design tradeoffs of ssds: from energy consumption’s
TRANSCRIPT

8
Design Tradeoffs of SSDs: From Energy Consumption’s Perspective
SEOKHEI CHO, CHANGHYUN PARK, YOUJIP WON, SOOYONG KANG, andJAEHYUK CHA, Hanyang UniversitySUNGROH YOON, Seoul National UniversityJONGMOO CHOI, Dankook University
In this work, we studied the energy consumption characteristics of various SSD design parameters. Wedeveloped an accurate energy consumption model for SSDs that computes aggregate, as well as component-specific, energy consumption of SSDs in sub-msec time scale. In our study, we used five different FTLs (pagemapping, DFTL, block mapping, and two different hybrid mappings) and four different channel configura-tions (two, four, eight, and 16 channels) under seven different workloads (from large-scale enterprise systemsto small-scale desktop applications) in a combinatorial manner. For each combination of the aforementionedparameters, we examined the energy consumption for individual hardware components of an SSD (micro-controller, DRAM, NAND flash, and host interface). The following are some of our findings. First, DFTL isthe most energy-efficient address-mapping scheme among the five FTLs we tested due to its good write am-plification and small DRAM footprint. Second, a significant fraction of energy is being consumed by idle flashchips waiting for the completion of NAND operations in the other channels. FTL should be designed to fullyexploit the internal parallelism so that energy consumption by idle chips is minimized. Third, as a meansto increase the internal parallelism, increasing way parallelism (the number of flash chips in a channel) ismore effective than increasing channel parallelism in terms of peak energy consumption, performance, andhardware complexity. Fourth, in designing high-performance and energy-efficient SSDs, channel switchingdelay, way switching delay, and page write latency need to be incorporated in an integrated manner todetermine the optimal configuration of internal parallelism.
Categories and Subject Descriptors: B.3.3 [Memory Structures]: Performance Analysis and Design Aids
General Terms: Design, Measurement
Additional Key Words and Phrases: SSD, NAND flash, energy consumption, FTL, parallelism, simulator
ACM Reference Format:Seokhei Cho, Changhyun Park, Youjip Won, Sooyong Kang, Jaehyuk Cha, Sungroh Yoon, and Jongmoo Choi.2015. Design tradeoffs of SSDs: From energy consumption’s perspective. ACM Trans. Storage 11, 2, Article 8(March 2015), 24 pages.DOI: http://dx.doi.org/10.1145/2644818
This work is sponsored by IT R&D program MKE/KEIT [No.10035202, Large Scale hyper-MLC SSD Tech-nology Development] and by the MSIP (Ministry of Science, ICT & Future Planning), Korea, under the ITRC(Information Technology Research Center) support program (NIPA-2014- H0301-14-1017) supervised by theNIPA (National IT Industry Promotion Agency).Authors’ addresses: S. Cho and C. Park, Department of Computer Software, Hanyang University, 222Wangsimni-ro, Seongdong-gu, Seoul 133-791, Korea; emails: {misost, pch1984}@hanyang.ac.kr; Y. Won (corre-sponding author), S. Kang, and J. Cha, Division of Computer Science and Engineering, Hanyang University;emails: {yjwon, sykang, chajh}@hanyang.ac.kr; S. Yoon, Department of Electrical and Computer Engineer-ing, Seoul National University, 1 Gwanak-ro, Gwanak-gu, Seoul 151-742, Korea; email: [email protected];J. Choi, Department of Software, Dankook University, 152, Jukjeon-ro, Suji-gu, Yongin-si, Gyeonggi-do,448-701, Korea; email: [email protected] to make digital or hard copies of part or all of this work for personal or classroom use is grantedwithout fee provided that copies are not made or distributed for profit or commercial advantage and thatcopies show this notice on the first page or initial screen of a display along with the full citation. Copyrights forcomponents of this work owned by others than ACM must be honored. Abstracting with credit is permitted.To copy otherwise, to republish, to post on servers, to redistribute to lists, or to use any component of thiswork in other works requires prior specific permission and/or a fee. Permissions may be requested fromPublications Dept., ACM, Inc., 2 Penn Plaza, Suite 701, New York, NY 10121-0701 USA, fax +1 (212)869-0481, or [email protected]© 2015 ACM 1553-3077/2015/03-ART8 $15.00
DOI: http://dx.doi.org/10.1145/2644818
ACM Transactions on Storage, Vol. 11, No. 2, Article 8, Publication date: March 2015.

8:2 S. Cho et al.
1. INTRODUCTION
Due to the rapid advancement of flash memory technology (e.g., adoption of sub-20nmprocess technology and multiple bits per cell), storage density of NAND flash-basedstorage devices has improved significantly. This has led to the decrease in cost/GB andsubsequently accelerated the wider deployment of NAND flash-based storage devices.In 2012, for the first time ever in the history of the semiconductor, the global salesof NAND flash exceeded that of DRAM [IC-insights 2012]. The NAND flash-basedstorage device positions itself as a mainline storage system not only in mobile devices(e.g., smartphones and smart pads) but also in desktop PCs, notebooks, and enter-prise servers [Narayanan et al. 2009; Intel 2012]. NAND flash-based storage devicesexhibit superior physical characteristics to HDDs in terms of noise, heat, and shockresistance. From the performance point of view, it exhibits 20× improvement in ran-dom IO performance and shorter I/O latency. A Solid-State Drive (SSD) positions itselfas a tier for hybrid storage systems for large-scale distributed systems [Grider 2011;Strande et al. 2012] or as a storage system for checkpointing the memory snapshot ofa supercomputer [He et al. 2010; Ni et al. 2012].
Building an energy-efficient computer system is of critical concern in the high-performance computing community [Frachtenberg et al. 2011; Pillai et al. 2012;Tsirogiannis et al. 2010]. SSDs have been widely perceived as a means to deliverenergy-efficient computer systems, replacing HDD-based storage systems [Poess andNambiar 2010]. Recently, SSD vendors have adopted aggressive internal parallelism toboost the I/O performance of SSDs. Most SSDs adopt eight channels, and each channelhas one or two flash packages. X25M from Intel [Intel 2009b], for example, can per-form 20 page-write operations simultaneously. The energy consumption rate of modernSSDs is much denser than that of legacy HDDs from the J/sec and J/cm3 point of view.A single HDD can consume as much as 8W. On the other hand, the peak power con-sumption of an SSD is subject to the number of flash dies, which can be programmedin parallel and can be as high as 16W.
Therefore, it is critical that every design choice of a modern SSD is carefully examinedfrom the aspect of energy consumption. In this work, we dedicate our effort to under-standing the energy consumption characteristics of various SSD components: addressmapping, garbage collection, internal parallelism, and page size. For our study, wedeveloped energy consumption models for SSD components: flash memory, microcon-troller, interface, and main memory. Our model is not a full-fledged energy consumptionsimulator, but the physical experiment shows that our simulator is within 8% errorfrom physical SSDs in terms of energy consumption. We implemented our energy con-sumption model on top of an existing DiskSim-based SSD simulator [Agrawal et al.2008].
The rest of the article is organized as follows: Section 2 describes the basics of NANDflash, SSDs, and energy consumption. Section 3 explains the energy consumption modelfor SSDs. Section 4 describes the organization of our simulator, Energysim. Section 5contains the results of our case study, and Section 6 contains related work. Section 7concludes the article.
2. MODERN SSDS AND ENERGY CONSUMPTION
2.1. SSD Organization
Figure 1 shows the overall architecture of an SSD. It consists of the SSD controller,RAM (DRAM or SRAM), NAND, and the interfaces. The SSD controller manages I/Ooperations and runs firmware (e.g., FTL, buffer manager, and garbage collector). DRAMor SRAM is typically used as the internal device cache and has two purposes: databuffering and map caching [Shim et al. 2010]. The interfaces refer to the host interface
ACM Transactions on Storage, Vol. 11, No. 2, Article 8, Publication date: March 2015.

Design Tradeoffs of SSDs: From Energy Consumption’s Perspective 8:3
Fig. 1. SSD hardware diagram.
and flash interface. The host interface connects the SSD and the host system. The flashinterface connects the SSD controller and the NAND chips and transfers data betweenthe controller and the page register. The speed of the flash interface varies subject tothe specific NAND flash interface (e.g., ONFI [ONFI 2011] and toggle NAND).
SSDs organize flash memory packages in channels and ways. Each channel has itsown page register, which acts as a buffer between the NAND flash chip and NANDflash controller. Flash pages in different channels can be accessed in parallel. Theaccesses to flash pages that are in the same channel but in different flash packages areinterleaved, which means that a following operation needs to wait until the precedingoperation releases the page register.
The degree of parallelism is usually governed by the number of channels multipliedby the number of ways (the number of flash packages in a channel). If a flash packageconsists of multiple planes, the maximum degree of parallelism is obtained by (# ofchannels) × (# of ways in a channel) × (# of planes in a way). One should determine anoptimal combination of the number of channels and the number of ways in achievinga given degree of parallelism. One of the important factors that governs the optimalconfiguration is peak current consumption. Figure 2 schematically illustrates the timeit took to write four pages and the level of current it consumed to complete the taskunder two different SSD configurations. In the first configuration, the SSD writesfour pages to four channels, one page in each channel (Figure 2(a)). In the secondconfiguration, the SSD writes four pages to two channels, two pages in each channel
ACM Transactions on Storage, Vol. 11, No. 2, Article 8, Publication date: March 2015.

8:4 S. Cho et al.
Fig. 2. Channel and way timing diagrams and current consumption.
Table I. HDD and SSD Specifications
Model Capacity Read/Write # of Channel Released Year
Caviar1 80GB 150/94MB/s - 2005X25M2 80GB 250/70MB/s 10 2008MXP3 128GB 220/200MB/s 8 2009Vertex 14 60GB 230/130MB/s 8 2009OCTANE4 512GB 535/400MB/s 8 20118403 250GB 540/250MB/s 8 2012
1WD; 2Intel; 3Samsung; 4OCZ
(Figure 2(b)). Each of the two writes in a channel goes into different chips, exploitingway parallelism. In the first configuration, since the channels can transfer data inan independent manner, four pages in each of the four channels can be written inparallel and the write operations of all NAND flashes are mostly overlapped. Channelswitch delay denotes the interval between the start times of two consecutive flashpages when they are written on the two flash chips that are in the adjacent channels.Way switch delay denotes the time interval between the start times of two consecutiveflash pages when they are written on two different flash pages that are attached tothe same channel. In multichannel and multiway SSDs, switching channels and waysaccompanies channel switch delay and way switch delay. There are a number of ways toachieve the same degree of parallelism. For example, we can adopt either four-channelone-way or two-channel two-way configurations to achieve a parallelism degree of 4.Using a smaller number of channels ameliorates the stress caused by peak current,that is, energy consumption, heat, channel interference, and so forth.
2.2. Energy Consumption of SSDs
We examined the current consumption behavior of one HDD and five commerciallyavailable SSDs (Table I). Some SSDs exhibited higher peak current consumption thanthe HDD. We used the current probe1(5V) and captured the current consumption. Thesampling interval was 100μsec. The graphs in Figure 3 show the averages of 10,000samples. The energy consumption for every 100μsec time slot can be computed as
1Tektronix TCP202.
ACM Transactions on Storage, Vol. 11, No. 2, Article 8, Publication date: March 2015.

Design Tradeoffs of SSDs: From Energy Consumption’s Perspective 8:5
Fig. 3. Current consumption of sequential write operation (voltage: 5V, sampling interval: 100μsec).
Fig. 4. Peak and average (active state) current.
(sampling interval) × (current) × (voltage). The workload is 4GB sequential writeoperation. Figure 3 illustrates the time series of the current consumption. To easilycompare the performance and energy consumption, we used the same x- and y-scalesin all graphs. For the 3.5” HDD, the current consumption level stayed at 690mA whenactive. The early SSD models consumed less energy than the hard disk drive did (Figure3(c) and Figure 3(d)). The recently released SSDs (Figure 3(e) and Figure 3(f)) consumedapproximately 800mA when active. These two SSDs consumed 15% more current thanthe HDD at its peak. The peak energy consumption is another important characteristicof the storage device because the controller circuitry needs to be built to sustain thepeak current. Otherwise, the SSD controller may be subject to interference, groundbounce, blackouts, and so forth. Figure 4 illustrates the average and peak energyconsumptions of the five SSDs and one HDD. We can see that the peak currents (mA)of recently released SSDs are much higher than those of the legacy HDD.
3. MODELING THE ENERGY CONSUMPTION OF SSD COMPONENTS
We developed an energy consumption model for each component of an SSD: the SSDcontroller, DRAM, NAND flash, and host interface. Individual components are assumed
ACM Transactions on Storage, Vol. 11, No. 2, Article 8, Publication date: March 2015.
8:6 S. Cho et al.
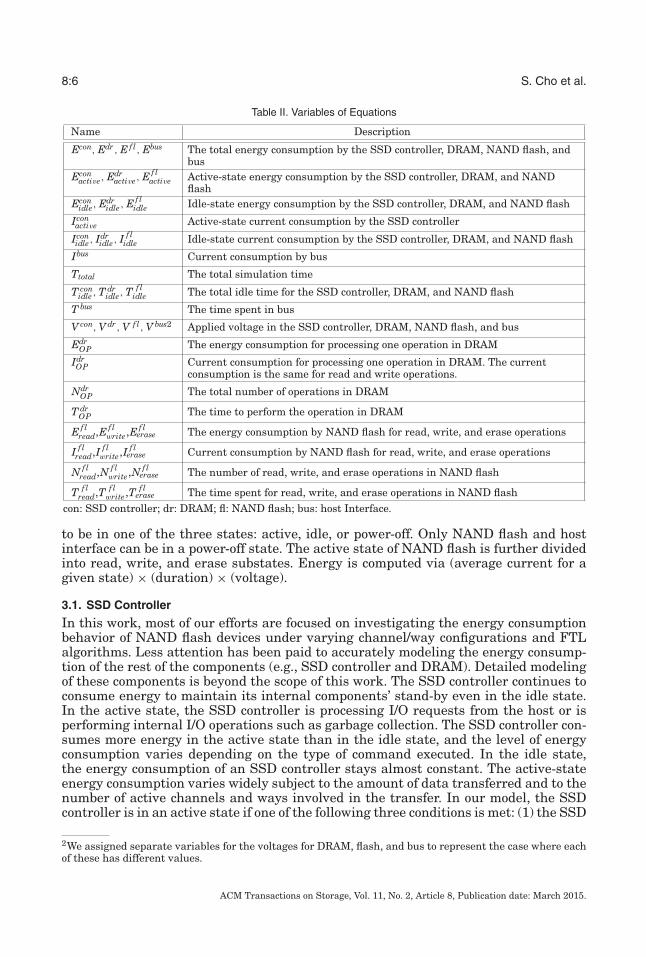
Table II. Variables of Equations
Name Description
Econ, Edr, E fl, Ebus The total energy consumption by the SSD controller, DRAM, NAND flash, andbus
Econactive, Edr
active, E flactive Active-state energy consumption by the SSD controller, DRAM, and NAND
flashEcon
idle, Edridle, E fl
idle Idle-state energy consumption by the SSD controller, DRAM, and NAND flash
Iconactive Active-state current consumption by the SSD controller
Iconidle, Idr
idle, I f lidle Idle-state current consumption by the SSD controller, DRAM, and NAND flash
Ibus Current consumption by bus
Ttotal The total simulation time
T conidle , T dr
idle, T flidle The total idle time for the SSD controller, DRAM, and NAND flash
T bus The time spent in bus
V con, V dr, V fl, V bus2 Applied voltage in the SSD controller, DRAM, NAND flash, and bus
EdrOP The energy consumption for processing one operation in DRAM
IdrOP Current consumption for processing one operation in DRAM. The current
consumption is the same for read and write operations.
NdrOP The total number of operations in DRAM
T drOP The time to perform the operation in DRAM
E flread,E fl
write,E flerase The energy consumption by NAND flash for read, write, and erase operations
I f lread,I f l
write,I f lerase Current consumption by NAND flash for read, write, and erase operations
N flread,N fl
write,N flerase The number of read, write, and erase operations in NAND flash
T flread,T fl
write,T flerase The time spent for read, write, and erase operations in NAND flash
con: SSD controller; dr: DRAM; fl: NAND flash; bus: host Interface.
to be in one of the three states: active, idle, or power-off. Only NAND flash and hostinterface can be in a power-off state. The active state of NAND flash is further dividedinto read, write, and erase substates. Energy is computed via (average current for agiven state) × (duration) × (voltage).
3.1. SSD Controller
In this work, most of our efforts are focused on investigating the energy consumptionbehavior of NAND flash devices under varying channel/way configurations and FTLalgorithms. Less attention has been paid to accurately modeling the energy consump-tion of the rest of the components (e.g., SSD controller and DRAM). Detailed modelingof these components is beyond the scope of this work. The SSD controller continues toconsume energy to maintain its internal components’ stand-by even in the idle state.In the active state, the SSD controller is processing I/O requests from the host or isperforming internal I/O operations such as garbage collection. The SSD controller con-sumes more energy in the active state than in the idle state, and the level of energyconsumption varies depending on the type of command executed. In the idle state,the energy consumption of an SSD controller stays almost constant. The active-stateenergy consumption varies widely subject to the amount of data transferred and to thenumber of active channels and ways involved in the transfer. In our model, the SSDcontroller is in an active state if one of the following three conditions is met: (1) the SSD
2We assigned separate variables for the voltages for DRAM, flash, and bus to represent the case where eachof these has different values.
ACM Transactions on Storage, Vol. 11, No. 2, Article 8, Publication date: March 2015.

Design Tradeoffs of SSDs: From Energy Consumption’s Perspective 8:7
controller is processing an I/O command from the host, (2) the SSD controller is per-forming garbage collection, or (3) the SSD controller is performing buffer management.Otherwise, the SSD is assumed to be in an idle state.
Econactive = (
Iconactive · V con) · (
Ttotal − T conidle
)(1)
Econidle = (
Iconidle · V con) · T con
idle (2)
Econ = Econactive + Econ
idle (3)
Equations (1), (2), and (3) represent the energy consumptions in the active state, in theidle state, and in total, respectively. Econ
active is the amount of energy the SSD controllerconsumes in the active state. Icon
active is the cumulative current consumed in the activestate, and V con is the voltage applied to the controller. The time spent in the active stateis obtained by subtracting the idle time, T con
idle , from the total simulation time, Ttotal. Econidle
is the energy consumed by the SSD controller in the idle state, and Iconidle is the consumed
current in the idle state. The total energy consumed by the SSD controller is denotedby Econ and is obtained by adding up the energy consumed in active and idle states.
3.2. DRAM
DRAM is in the active state when it is reading or writing. Otherwise, it is in the idlestate. We assume that the read and write operations consume the same amount ofcurrent.
EdrOP = (
IdrOP · V dr) · T dr
OP (4)
Edractive = Edr
OP · NdrOP (5)
Edridle = (
Idridle · V dr) · T dr
idle (6)
Edr = Edractive + Edr
idle (7)
Equation (4) shows the amount of energy consumed for processing one operation inDRAM. Idr
OP is the amount of current required for DRAM operation. V dr is the voltageapplied to DRAM, and T dr
OP is the time for DRAM to perform the operations. Equation (5)is the total energy DRAM consumes in the active state. Ndr
OP is the total number ofoperations. Equation (6) represents the energy DRAM consumes in the idle state.T dr
idle = Ttotal − (NdrOP · T dr
OP) and corresponds to the total simulation time minus theoperation time. Since DRAM is kept powered on for preserving data until the SSD ispowered off, the idle time corresponds to the total simulation time minus the operationtime. Equation (7) is the total energy consumption by DRAM, which is the sum of theenergy consumption in the idle and active states.
3.3. NAND Flash
A single NAND chip normally consumes 20 to 30mA to perform read, program, orerase operations [Grupp et al. 2009]. In the idle state, an SSD consumes energy forprecharging bit lines for NAND operations and for exchanging clock signals with theflash controller in the SSD controller. The active state of NAND flash is divided intothree substates: read, write, or erase. According to the datasheet by an NAND flashmanufacturer [Samsung 2012], NAND flash consumes almost an identical amount ofenergy regardless of the type of operation. However, according to Grupp et al. [2009],this is not realistic, and different operations consume different amounts of energy. Inthis article, we assume different current consumption levels for each NAND operation.
ACM Transactions on Storage, Vol. 11, No. 2, Article 8, Publication date: March 2015.

8:8 S. Cho et al.
Note that NAND flash is nonvolatile, and we can turn it off selectively if needed. Theenergy consumption of a single NAND flash die can be computed as follows:
E flread = (
I f lread · V fl) · T fl
read (8)
E flwrite = (
I f lwrite · V fl) · T fl
write (9)
E flerase = (
I f lerase · V fl) · T fl
erase (10)
E flactive = E fl
read · N flread + E fl
write · N flwrite + E fl
erase · N flerase (11)
E flidle = (
I f lidle · V fl) · T fl
idle (12)
E fl = E flactive + E fl
idle. (13)Equations (8), (9), and (10) represent the amount of energy consumed by NAND flashfor read, write, and erase operations, respectively. I f l
read, I f lwrite, and I f l
erase are currentconsumptions for read, write, and erase operations, respectively. T fl
read, T flwrite, and T fl
erase
are the time spent for read, write, and erase operations, respectively. V fl is the voltageapplied to the flash memory. We calculated the total energy consumption of operationsby adding up the energy consumption of each state. Equation (11) shows the energyconsumed by NAND flash in the active state, which is the sum of the energy consumedby each type of operation. N fl
read, N flwrite, and N fl
erase are the number of read, write, anderase operations, respectively. Equation (12) indicates the energy consumed by NANDflash in the idle state. T fl
idle is the idle time of NAND flash and is given by Ttotal − (T flread ·
N flread + T fl
write · N flwrite + T fl
erase · N flerase). Because it is possible to power off NAND flash as
needed, we can subtract the power-off time from the total time. The proposed simulatorprovides two types of energy consumption in the idle state: One is the energy consumedin the idle state without any power-off state. The other is the energy consumed in theidle state under the assumption that NAND flash is turned off when there is no I/Orequest. Equation (13) is the total energy consumption by NAND flash, which is thesum of the energy consumptions in active and idle states.
3.4. Host Interface
In SSDs, according to Grupp et al. [2009], the energy involved in data transfers isapproximately three times higher than that in the idle state in NAND flash. Thepower used in data transfers is not negligible and should be considered in modelingthe SSD energy consumption. The energy used by a data bus is less than that of theSSD controller, DRAM, or NAND flash in the active state. Energysim considers onlythe energy consumed during data transfers, ignoring the energy consumed in the idlestate:
Ebus = (Ibus ∗ V bus) ∗ T bus (14)Ibus and Vbus are the current and the voltage applied to the bus, respectively, and Top isthe time for data transfer through the bus.
4. SIMULATOR
4.1. Simulator Design
We modified the existing trace-driven simulator model for an SSD [Agrawal et al. 2008]to study its energy consumption behavior. We modified this simulator to support mul-tichannel and multiway configurations: the channel switch delay and way switch delaycan be adjusted via input parameters. We call the simulator Energysim.3 Figure 5
3The simulator is publicly available at https://github.com/ESOS-Lab/EnergySim/.
ACM Transactions on Storage, Vol. 11, No. 2, Article 8, Publication date: March 2015.

Design Tradeoffs of SSDs: From Energy Consumption’s Perspective 8:9
Fig. 5. Simulator system overview.
illustrates the structure of our simulator. Energysim models the energy consumptionof the SSD controller, DRAM, NAND flash, and host interface based on the model de-scribed in Section 3. It generates the aggregate energy consumption for a given period oftime as well as the energy consumption for every interval between the events. Also, En-ergysim generates the energy consumption statistics for each type of NAND operations.
The existing DiskSim model for SSDs [Agrawal et al. 2008] has only page mapping[Ban 1995]. We implemented DFTL [Gupta et al. 2009], block mapping [Ban 1999], andBAST [Jesung et al. 2002]. DFTL uses page mapping with caching and demand pagingfor mapping table management. In block mapping, consecutive sectors are relocatedto different flash blocks when some of the sectors are updated. In page mapping, eachupdated sector can be relocated into any NAND flash pages. Our block mapping is basedon Kuo et al. [2008]. BAST (Block Associative Sector Translation) categorizes NANDflash blocks into two categories: data block and log block. The data block and log blockare managed by block mapping and page mapping, respectively. An incoming writerequest is first written to the log block. When there are no pages available in the logblock, the valid pages in the log block are consolidated with the pages in the data blockand the respective log block is erased. This process is called log block cleaning. For logblock cleaning, BAST employs full merge, switch merge, and replacement. Replacementis an operation that erases victim log block and allocates a new free block. Among thethree types of log block cleaning operations, we found that the replacement operationcauses too many erase operations and negatively affects the performance. In this work,we devised modified BAST, which does not perform the replacement operation: wenamed this modified version BAST*. When the erase count of the victim block exceedsthe average erase count by 15% or more, the FTL switches the contents of the victimblock with those of a cold block. A cold block is a block that has not been erased for thelongest period of time [Gal and Toledo 2005].
In real SSDs, there exists a delay in switching channels or ways [Yoo et al. 2011].The SSD simulator by Agrawal et al. does not incorporate this characteristic and thuscannot accurately simulate the real-world behavior of an SSD. Our simulator modelsthe channel-switch and way-switch delays. The delay information is supplied as aconfiguration parameter.
4.2. Simulator Validation
We validated the accuracy of our simulator against a commercially available SSDmodel, Intel X25M. We used a current probe, Tektronix TCP202, and the oscilloscope,Tektronix DPO 3012, to capture the current consumption behavior of X25M. The total
ACM Transactions on Storage, Vol. 11, No. 2, Article 8, Publication date: March 2015.

8:10 S. Cho et al.
Table III. Energysim Parameters [Intel 2009b] (NAND Flash Spec. Is from Intel [2009a])
Read/Write/Erase 50μs/500, 900μs/2.0msRegister (1 byte) 20nsPage Size 4KBPages per Block 128Blocks per Plane 2,048Planes per Package 2
NAND Energy SpecificationsRead/Program/Erase 20mAIdle 3mAVoltage 3.3V
SSD ControllerActive/Idle 30mA/15mADRAM (512MB,page) Active/Idle 100mA/20mADRAM (8MB,other) Active/Idle 77mA/3mA
energy consumption is computed by multiplying the input voltage (5V), the total cur-rent, and the execution time, that is, EDrive = VDrive ∗ IDrive ∗ T ime. In this experiment,we turned off the DRAM cache4 of X25M to ensure the accuracy of measurement.Table III illustrates the parameters used in Energysim. These values are obtainedfrom the SSD datasheet [Intel 2009b] and NAND flash datasheet [Intel 2009a]. In thissimulation, we used different sizes of DRAM for page mapping and DFTL to examinethe difference in energy consumption caused by page table accesses. In simulatingpage mapping, our Energysim is configured with 512Mbyte DRAM with 100mA and20mA current consumptions for active and idle states, respectively. In other mappings(DFTL, Block, and BAST), our model is configured with 8Mbyte DRAM with 77mAand 3mA current consumption for active and idle states, respectively.
We open() the raw device and wrote different sizes of data ranging from 4KByte to160KByte in increments of 4KByte. Figure 6(a) and Figure 6(c) illustrate the currentconsumptions of writing different sizes of blocks varying from 4KB to 160KB. We usetwo graphs since the current consumption behavior radically changes when the I/Osize becomes larger than 80KByte. We can see in Figure 6(a) that current consumptionincreases by 17mA steps as we increase the data size by 4KByte. This stepwise increasecontinues until the I/O size reaches 80KByte. This is because X25M has a 10-channeland two-way configuration, and with an 80-KByte write, 20 page write operations areinterleaved across the channels and across the ways, fully exploiting its internal par-allelism. When FTL writes 80KByte, current consumption reaches the peak, 520mA.
As we can see in Figure 6(a) and Figure 6(c), as the data size increases, it takeslonger for X25M to reach its maximum current consumption level. For example, whenwe write one page, it takes 30μsec for the SSD to reach its maximum current consump-tion level. When we write two pages, it takes 60μsec for the SSD to reach its peakcurrent consumption. A possible explanation to this phenomenon is that the two pagesare written to different channels and it takes 30μsec to switch the channel. Whenthe I/O size exceeds 80KByte, it becomes a different situation. When we write 84KByte(21 pages), the first page and the 21st page are written to the same die. Therefore, the21st write request can only start after the first write completes. If the page program(write) latency is shorter, that is, 500μsec, than the sum of all channel-switch and way-switch delays, that is, 30μsec×20, the write requests will complete before the 21st writeoperation starts. In this case, the total current consumption continues to decrease until
4SATA command 82h.
ACM Transactions on Storage, Vol. 11, No. 2, Article 8, Publication date: March 2015.

Design Tradeoffs of SSDs: From Energy Consumption’s Perspective 8:11
Fig. 6. Comparison between Intel X25M and Energysim on current consumption behavior of write operations(10 channels, two chips/channel, 4Gbyte/chip, � = 4KByte).
Table IV. Energy Consumption: Real Device Versus Simulated Device (in mJ)
Write IO Size X25-M (mJ) Simulated X25-M (mJ)4K 1.3 1.2 (−6.0%)40K 2.5 2.4 (−5.8%)80K 4.0 3.7 (−8.1%)120K 7.3 6.7 (−8.0%)160K 8.6 8.2 (−4.5%)
the 21st write starts. We collected the block-level trace from this experiment using blk-trace and obtained energy consumption behavior from our simulator with the collectedtrace. Figure 6(b) and Figure 6(d) illustrate the result. Figure 6(c) illustrates currentconsumption of writing 84KByte to 160KByte on the real SSD (X25M). We can see thatthe simulator exhibits very similar current consumption patterns to the physical SSDin all these cases. Table IV compares the aggregate energy consumptions of the realSSD and the simulation model. The energy consumption of the Energysim-based SSDhas an 8% worst-case relative error.
5. CASE STUDIES
We investigated the energy consumption characteristics of SSDs under a variety ofoptions such as different address mapping, internal parallelism, and DRAM size. Inthis study, we used five FTLs (page level, DFTL, block level, BAST, and BAST*) andfour different channel configurations (two, four, eight, and 16 channels). The latency ofNAND operations and their current consumptions are set as specified in NAND flash
ACM Transactions on Storage, Vol. 11, No. 2, Article 8, Publication date: March 2015.

8:12 S. Cho et al.
Table V. SSD Specifications (NAND Flash Spec. Is from Intel [b])
SSD model
Total Capacity 460GB (512GB)Number of Channels 2, 4, 8, 16Number of Packages 16Pages per Block 64, 128, 256Page Size 4KB
Serial Access 20nsFlash Page Read/Write/Erase 50μs/900μs/2ms
Table VI. Workload Characteristics
Read Seq. Avg. Read Avg. WriteWorkload (%) (%) Size (KB) Size (KB)Financial1 [SPC 2009] 15.4 2.4 2.3 3.7Financial2 [SPC 2009] 78.5 4.3 2.3 2.9Homes [Koller and Rangaswami 2010] 21.7 45.6 16.7 4.0MSNfs [Kavalanekar et al. 2008] 66.1 6.0 10.0 11.0FileZilla [ESOSLab 2012] 0.1 62.4 10.4 436.9Torrent [ESOSLab 2012] 34.3 8.6 14.7 36.9GIMP [ESOSLab 2012] 48.7 17.9 136.2 15.1
memory datasheet [Intel 2009a], which are summarized in Table V. Overprovisioningdegree is set to 10%.
Queue depth is set to 32 in our simulator. We performed a set of experiments withdifferent queue depths from depth 1 to depth 64. According to our experiments, theperformance and the energy consumption are insensitive to the device queue depth,and we only show the result with queue depth 32 due to the space limit.
5.1. Workload Summary
Table VI shows the seven workloads used in this study. Financial1 and Financial2are the I/O traces generated by an OLTP program in financial systems [SPC 2009].MSNfs is the I/O trace gathered in the MSN Storage back-end file server [Kavalanekaret al. 2008]. The Homes workload is collected from the home directory in an NFS server,which consists of several research group activities such as developing, testing, technicalwriting, and plotting [Koller and Rangaswami 2010]. The remaining three workloads,FileZilla, Torrent, and GIMP, are from in-house traces [ESOSLab 2012].
5.2. FTL and Energy Consumption
We examined the I/O latency of the five FTLs under the seven workloads (Figure 7(a)).The page mapping yields the best performance in all workloads. DFTL exhibits 14%longer latency than page mapping. Compared with page mapping, block mapping andtwo hybrid mappings yield 2× or longer latencies. BAST shows the worst performancedue to the replacement merge overhead. The performance differences between FTLsbecome more significant as the fraction of write operations increases. Figure 7(b) showsthe normalized energy consumption. In most workloads, except MSNfs, DFTL is moreenergy efficient than page mapping. This is because DFTL has a smaller memoryfootprint than page mapping does since it maintains a smaller subset of mapping tablein the memory. The page mapping maintains the whole mapping table in its memory.With the MSNfs workload, DFTL suffers from frequent cache misses of the map table.DFTL triggers a large number of NAND operations to synchronize the contents of mapcache and the address mapping table in the NAND flash.
ACM Transactions on Storage, Vol. 11, No. 2, Article 8, Publication date: March 2015.

Design Tradeoffs of SSDs: From Energy Consumption’s Perspective 8:13
Fig. 7. Average response time and normalized energy consumption.
Fig. 8. Normalized average response time/total energy consumption.
To examine the energy efficiency of FTLs, we computed the (response time)/J for eachFTL and normalized it against page mapping. Figure 8 illustrates the result. DFTL isthe most energy-efficient FTL from the performance perspective.
We examined the energy consumption involved in accessing the mapping table inpage mapping and in DFTL. In page mapping, we assumed that the entire page tableis cached in DRAM. In DFTL, mapping table access occasionally triggers the NANDflash operation due to cache miss. In DFTL, energy consumption caused by mappingtable access varies widely subject to its access locality. Figure 9 illustrates the result.Financial1 and Financial2 workloads are highly skewed. In DFTL, the mapping tablelookup rarely triggers NAND operations since the hit ratio is quite high (specifically, thehit ratios of the two workloads are 98.5% and 97.8%, respectively). For the mappingtable operation, DFTL consumes only one-quarter of the energy consumed by pagemapping. In the MSNfs workload, the mapping table hit ratio is 25.3% in DFTL, causingfrequent mapping table access operations on NAND flash. In this workload, DFTLconsumes 11× more energy than page mapping does in the mapping table operation.
In SSDs, performance is governed by the number of NAND operations involved inservicing a given I/O request. The actual number of write operations caused by a writerequest from the host (e.g., SATA) command varies widely subject to the mappingalgorithm, wear-leveling algorithm, garbage collection algorithm, and so forth. Theratio of the number of pages written from the host to the actual number of pageswritten in the flash storage is called the write amplification factor. The performanceand energy consumption vary subject to the actual number of write operations in
ACM Transactions on Storage, Vol. 11, No. 2, Article 8, Publication date: March 2015.

8:14 S. Cho et al.
Fig. 9. Effect of mapping table caching on energy consumption.
Fig. 10. Details of energy consumption by NAND operation (Fi: Financial, Ho: Homes, MSN: MSNfs, File:FileZilla, To: Torrent, PA: page mapping, DF: DFTL, BL: block mapping, BA: BAST).
the storage device. We have observed that block mapping and two hybrid mappingsexhibit significantly longer I/O latencies than page mapping does. Block mapping,BAST*, and BAST consume 9.2%, 7.9%, and 21.9% more energy, respectively, thanpage mapping does. Sensitivity analysis shows that the accesses to the spare areaduring the replacement block management in block mapping negatively affect both theperformance and the energy consumption; the effect is far graver in energy consumptionthan in performance.
5.3. Energy Consumption Breakdown
In Figure 10, we show the breakdown of the total energy consumption by the NANDflash operation type. The idle time energy consumption in the figure excludes the en-ergy consumption when an SSD itself is in an idle state; that is, it only includes theaggregated energy consumption of each idle flash chip when at least one flash chipis executing a NAND operation. This is to accurately extract the amount of energy
ACM Transactions on Storage, Vol. 11, No. 2, Article 8, Publication date: March 2015.

Design Tradeoffs of SSDs: From Energy Consumption’s Perspective 8:15
Table VII. Energy Consumption for Each NAND Operation (%)(Workload: Financial1, Stripe Size: Page)
Read Write Erase Idle BUSPage 3.3 65.8 0.3 29.8 0.9DFTL 3.3 66.8 0.3 29.0 0.6Block 5.4 54.7 0.7 38.6 0.6BAST* 2.9 56.8 0.7 39.0 0.6BAST 2.5 55.8 0.6 40.7 0.4
Table VIII. NAND Operation Counts and Energy Consumption (Page Mapping)
Page Page Idle Time TotalRead Write Energy Energy Ratio
(×1,000) (×1,000) Cons. Cons. (%)MSN 1,959 1,175 31J 169J 18.6FileZilla 1 1,296 287mJ 141J 0.2
needed to maintain idle flash chips in an idle state.5 A common observation through-out all mapping schemes and workloads is that the energy consumption involved inwrite operations and during idle time accounts for a dominant portion of the totalenergy consumption. On average, each of them occupies 66% and 29% of the totalenergy consumption, respectively. Even with the read-intensive workload, Financial2,where 79% of the total I/O operations are read operations, write operations consumeabout 40% of the total energy, on average, while read operations consume only 7% ofthe total energy, on average. This is because a read operation consumes only about1/18 of the energy compared to a write operation. Current consumptions and voltagesare the same for read, write, and erase operations. The duration of each operation isdifferent. Read and write operations take 50μsec and 900μsec, respectively. A writeoperation consumes 18× more energy than a read operation does. While a single eraseoperation consumes 2× more energy (132nJ) than a write operation, the aggregatedenergy consumed by all erase operations occupies only 0.5% of the total energy con-sumption due to the very small number of erase operations.
Table VII shows the energy consumed by each NAND operation as a percentage ofthe total energy consumption. In page mapping and DFTL, write operations consumea relatively larger fraction of energy. In block mapping and two hybrid mappings,flash memories spend a relatively large fraction of energy in an idle state. This isbecause the two schemes, page mapping and block mapping, have different degreesof parallelism across flash chips. In multichannel/multiway SSDs, if the channels arenot fully utilized, some flash devices sit idle while the other flash devices are underoperation. We observed that the total energy consumption in the idle flash devices farexceeds the energy consumption of a single page write operation. Therefore, in termsof energy consumption, it is important to minimize the idle flash chips via maximizingparallel operations among flash chips. In page mapping, sequential page writes can bedistributed across channels, whereas in block mapping, sequential pages are writtenin the same block until the block becomes full. Hence, for small sequential writes (lessthan a block), block mapping cannot fully exploit channel parallelism and places mostflash chips in an idle state.
Table VIII shows the number of individual flash operations, idle time energy con-sumption (A), total energy consumption (B), and ratio of idle time energy consumptionto the total energy consumption (A/B). The MSNfs workload issues mainly small and
5Note that when an SSD is in an idle state, we can safely turn off the entire flash memory part in the SSDto save energy.
ACM Transactions on Storage, Vol. 11, No. 2, Article 8, Publication date: March 2015.

8:16 S. Cho et al.
Fig. 11. Normalized mean response time in each channel/way architecture.
random write requests, while the FileZilla workload issues mainly large and sequentialwrite requests. The ratio of the idle time energy consumption to the total energy con-sumption in each workload is about 18.6% and 0.2%, respectively. We can see the effectof the idle time on the total energy consumption. MSNfs issues 2.5× more I/Os thanFileZilla, most of which are read operations. A single page write operation consumesabout 18× more energy than a single page read operation. MSNfs consumes only 19.5%more energy than FileZilla in total, due to the high idle time energy consumption.
Based on the previous observations and analysis, we can identify an important SSDdesign objective in terms of energy consumption. The FTL algorithm should carefullybe designed to increase the degree of parallel operations to minimize the idle time offlash chips. Additionally, the SSD architecture should be designed to allow the flashpackages to be turned off when they are in an idle state.
5.4. The Internal Parallelism
To investigate the effect of the channel and way configuration on both the I/O responsetime and the energy consumption, we measured the response time and energy con-sumption under various channel/way architectures (from 2×8 to 16×1).6 We assumedthat physical pages are allocated in a channel-major round-robin fashion for writerequests.
Figure 11 shows the average response time in each channel/way configuration. Theresponse times are normalized to a 2 × 8 configuration (two channels and eight ways).A common observation among all mapping schemes is that the response times in 4 ×4, 8 × 2, and 16 × 1 configurations are almost the same in most workloads. This is veryinteresting because the increased channel parallelism brings marginal improvementto the I/O response time, contrary to common perception. We found the reason in thedynamics of both the channel switching delay and way switching delay (the time forthe flash controller to transfer data from the SSD buffer to the page register in theflash chip). When the number of channels becomes large enough, the aggregate channelswitch delay hides the way switching delay in each channel. In our experiment, thechannel switching and way switching delay are 30μsec and 82μsec [Yoo et al. 2011],respectively.
Let us provide an example. We examined detailed latency in issuing a 32KB (eightpage × 4KB) write under different channel/way configurations. In a 2 × 8 configuration,four pages are assigned to two channels, in a round-robin fashion. Since the latency toissue two page write commands to two different channels is 60μsec (=2 × 30μsec), theSSD controller needs to wait 22μsec (=82μsec –60μsec) until the first channel is readyto accept a new command. Hence, to issue eight page write commands to two channels,there occur six way switches (6 × 22μsec = 132μsec), in addition to the eight channel
6m by n denotes m-channel and n-way configuration.
ACM Transactions on Storage, Vol. 11, No. 2, Article 8, Publication date: March 2015.

Design Tradeoffs of SSDs: From Energy Consumption’s Perspective 8:17
Fig. 12. Normalized energy consumption in each channel/way architecture.
switches (=240μsec). However, in a 4 × 4 configuration, the time to issue four pagewrite commands to four different channels is 120μsec (=4 × 30μsec), longer than theway switching delay (82μsec). By the time the fourth page is issued to the channel 4,the channel 1 will be ready to accept a new command. In this case, we can issue fourpage write commands without any delay. The total delay in issuing eight page writecommands in a 4 × 4 configuration will be only 240μsec, shorter than the delay in a2 × 8 configuration. When the number of channels is larger than four, the total delaytime is the same for 8 × 2, 16 × 1, and 4 × 4 configurations. Therefore, to determine thechannel/way configuration in an SSD, we need to properly incorporate the channel andway switching delays to eliminate unnecessary delay caused by switching overhead.
Figure 12 shows the normalized average energy consumption under various channel/way configurations. We normalized the average energy consumption against that ofthe 2 × 8 configuration. While the average energy consumption slightly decreases asthe number of channels increases, the differences are negligible. The result of theperformance experiment includes not only the workloads with small-size I/Os but alsothe workloads with large-size I/Os. For the FileZilla workload, the average size of writeoperations is 437Kbyte. The average read size of the GIMP workload is 136Kbyte. Thechannel/way configuration does not notably affect the energy consumption providedthat the number of flash chips is the same.
5.5. Effect of Channel/Way Switch Delay
We measured the performance and energy consumption of four different combinationsof the channel/way switch delay: 15/41, 30/82, 30/123, and 30/164μsec. Figure 13 andFigure 14 illustrate the normalized energy consumption and normalized response timeunder four different combinations of channel and way switch delays, respectively. Inthese figures, there are seven groups of bars, and there are four bars in each group.Each group denotes the experiment result for each of seven traces. In each group,the results are normalized against the result of the longest channel and way switchconfiguration (30/164μsec) in the group. As shown in Figure 13, energy consumption isnot sensitive to the changes in channel and way switch delay. However, the responsetime is sensitive to the changes in channel and way switch delay.
5.6. Peak Energy Consumption
We examined the fraction of time the SSD controller consumes current at its maximumlevel. The length of this period is equivalent to the time during which the maximumnumber of flash chips is being programmed in parallel. We used four different channelconfigurations under six workloads. The key technical issue in this experiment is theeffect of page write latency. We used four different channel configurations: 16 × 1, 8 × 2,4 × 4, and 2 × 8. Existing works do not take into account the delay involved in switchingthe channels and ways [Park et al. 2009a; Agrawal et al. 2008]. However, it is found
ACM Transactions on Storage, Vol. 11, No. 2, Article 8, Publication date: March 2015.

8:18 S. Cho et al.
Fig. 13. Normalized energy consumption (C: channel switch delay, W: way switch delay (μsec)).
Fig. 14. Normalized mean latency (C: channel switch delay, W: way switch delay (μsec)).
that the channel switch delay cannot be ignored in studying the effect of parallelism[Yoo et al. 2013]. The most effective parallelism is governed not only by the numberof channels and ways but also by the page write latency. To fully exploit the channelparallelism, the total time to interleave the write requests across the channels shouldbe longer than the delay of switching the NAND die in a channel (way switch delay).Further, to fully exploit the hardware parallelism, the sum of latencies in switchingthe channels and ways should be longer than the time spent on writing a single page.For example, assume that a 64KByte write command has arrived from the host and theSSD has four channels and four ways. With a 4KByte page size, the write command
ACM Transactions on Storage, Vol. 11, No. 2, Article 8, Publication date: March 2015.

Design Tradeoffs of SSDs: From Energy Consumption’s Perspective 8:19
Fig. 15. Max current consumption time in page FTL (max current is 477mA in experiment parameter).
will be split into 16 NAND write requests. Assuming plain page mapping, these NANDoperations will be issued to each channel in round-robin fashion. The first and the fifthwrite operations will be designated to the same channel, and so will the second andthe sixth operations. Given a 30msec channel switch delay [Yoo et al. 2011], the firstand the fifth write requests will be 120msec apart. If the way switch delay is shorterthan 120msec, the first channel will be ready to accept a new write command whenthe fifth request arrives. Otherwise, the fifth write request has to wait until the NANDcontroller is ready to write a page to a new block. The first and the 17th page writeswill go to the same die in a 4 × 4 configuration. The 17th write command cannot startuntil the first write request completes. The internal parallelism should scale with thepage write latency and the equivalent page size.
Figure 15 illustrates the fraction of time during which the SSD consumes current atits maximum level. We ran the experiment with two page write latencies, 500μsec and900μsec. It is normalized to the 16-channel SSD. The channel switch delay and wayswitch delay are set to 30μsec and 82μsec, respectively [Yoo et al. 2011]. As long asthe number of channels is larger than or equal to three, that is, � 86
30�, we can saturatethe channel. Therefore, four-, eight-, and 16-channel SSDs yield the same behavior inboth Figure 15(a) and Figure 15(b). With two-channel configuration, each channel isunderutilized due to the way switching delay. Therefore, the two-channel SSD spends asmaller fraction of time at the maximum current consumption level than the others. Letus examine the effect of page write latency; with larger page write latency (900μsec),there are more outstanding concurrent write operations. Therefore, SSDs spend alonger time at the maximum current consumption level (Figure 15(b)). On the otherhand, in a 2 × 8 configuration, the SSD rarely consumes the maximum current whenthe page write latency is 500μsec (Figure 15(a)).
For internal parallelism of an SSD, there exist energy/performance tradeoffs. In-creasing the internal parallelism improves the performance, but it also increases thepeak energy consumption. Yoo et al. [2011] suggested the notion of Power Budget, whichis the maximum tolerable peak energy consumption (or current consumption) for anSSD. They propose that there should be an interface to inform the SSD of its PowerBudget and that the firmware of an SSD should be designed to dynamically adjustthe parallelism degree subject to its Power Budget. Several works have proposed dy-namically throttling the transfer rate or parallelism degree of an SSD to regulate thetemperature of the SSD [Park et al. 2009b; Lee et al. 2013]. To properly design theSSD internal parallelism, we need to incorporate the channel switch delay, way switchdelay, and page write latency.
Peak energy consumption is an important factor in designing the SSD controllercircuit. We examined the peak energy consumption behavior under different degrees
ACM Transactions on Storage, Vol. 11, No. 2, Article 8, Publication date: March 2015.

8:20 S. Cho et al.
Table IX. Page Program (Write) Latency
Page Size Write Latency (μsec)2KB 200 [Samsung 2005]4KB 900 [Intel 2009a]8KB 1300 [Samsung 2012]16KB 1600 [Micron 2013]
Fig. 16. Time series of current consumption with different page trite times: 500μsec versys 900μsec.
of parallelism: two-channel and 16-channel SSDs. We used two workloads: Financial1and FileZilla. The Finanacial1 workload exhibits small random writes with high tem-poral locality. Most of the I/O accesses are focused on the small region, and therefore,the SSD cannot fully exploit its internal parallelism. The side benefit of this is that theSSD rarely reaches its peak energy consumption. For the FileZilla workload, currentconsumption of the SSD stays at its peak for most of the time. This is because theSSD controller fully exploits its internal parallelism to sequentially write the files itis downloading. In terms of aggregate energy consumption, as long as the degree ofinternal parallelism remains the same, how to distribute the parallelism among thechannels and ways hardly matters; that is, a two-channel by eight-way configurationand an eight-channel by two-way configuration yield the same aggregate energy con-sumption. While SSDs with more channels spend a larger fraction of time at the peakcurrent level, we believe the difference is marginal.
In both workloads, the SSD with large-size pages (longer write latency) consumesmore energy. The difference in energy consumption becomes more visible in the randomworkloads (Figure 16(a) and Figure 16(c)) than in the workloads with large sequen-tial writes (Figure 16(b) and Figure 16(d)). Considering that NAND page size is everincreasing these days and that an NAND device with a 16KByte page size is being
ACM Transactions on Storage, Vol. 11, No. 2, Article 8, Publication date: March 2015.

Design Tradeoffs of SSDs: From Energy Consumption’s Perspective 8:21
manufactured, we would like to examine the effect of the NAND flash page size on theenergy consumption and performance when the filesystem block size is a fraction of theNAND flash page size. Most of the modern filesystems use a 4KByte block size to alignit with the page frame size of the main memory. From an energy consumption perspec-tive, it should be mandatory that the SSD controller implements subpage mapping.
Peak energy consumption does not change with respect to the channel/way combi-nation. Peak energy consumption is governed by the maximum number of flash chipsthat can be programmed in parallel. As long as the number of flash chips that canbe programmed in parallel remains the same, how they are arranged in channel/waycombination does not affect the peak energy consumption. However, the duration atwhich the SSD consumes energy at its maximum level varies subject to the channel/wayconfiguration. Also, total energy consumption is governed by the total amount of readand write operations and therefore is not subject to the channel/way configurations ofNAND flash memory.
6. RELATED WORK
Software components of an SSD include address mapping, garbage collection, andwear leveling. Numerous works have been proposed in the area of address mapping[Hu et al. 2010; Wei et al. 2011; Liu et al. 2012b; Chen et al. 2011b; Gupta et al.2009], wear leveling [Chen et al. 2011a; Wu et al. 2011; Murugan and Du 2011; Shmidt2002], and garbage collection [Liu et al. 2012a; Debnath et al. 2011]. These algorithmscan be executed either in the microcontroller of an SSD or in the CPU of the host[Fusion-IO 2011]. A single NAND flash chip is not as fast as an HDD and can exhibitan approximately 40MByte/sec write bandwidth [Strande et al. 2012]. To improvethe performance, modern SSDs, without any exception, arrange the NAND flash chipusing multiple channels and ways [Park et al. 2009a]. With multichannel and multiwayconfiguration, the SSD controller can perform multiple NAND operations concurrently,which results in higher performance. Pages across the multiple channels can negativelyaffect the overall SSD performance [Yoo et al. 2013]. There have been a number ofworks on building an energy-efficient system with SSDs [Strande et al. 2012]. Theenergy consumption aspect of HDDs has been under intense research for the last twodecades and has now reached sufficient maturity. These works propose to stop thespindle and/or to shut down the circuitry of the hard disk controller. It has also beenproposed to reduce the rotational speed to save energy [Yada et al. 2000]. Bucy et al.[2009] developed a DiskSim-based simulator to estimate the energy consumption ofHDDs for a given workload. Jung et al. [2012] developed NANDFlashSim for NANDflash devices.
With SSD-based storage devices, a system can become more energy efficient thanwith an HDD in terms of performance [Schall et al. 2010; Seo et al. 2008], that is,higher IOPS/J, but it becomes denser in terms of energy consumption. Energy densityof an SSD, that is, J/in3, is orders of magnitude larger than that of an HDD, andthe peak energy consumption of an SSD is much higher than that of an HDD [Inoueet al. 2011], which raises the heat dissipation issue. A number of works are dedicatedto regulating the peak energy consumption via throttling the data transfer rate orlimiting the number of flash memory chips programmed in parallel [Park et al. 2009b;Lee et al. 2013]. Compared to HDDs, SSDs will make CPU spend less time waiting foran I/O. This may escalate the peak energy consumption of a given system. Special careneeds to be taken to regulate the peak energy consumption of the entire system.
7. CONCLUSION
Researchers as well as practitioners do their best to get better performance out ofSSDs. This is achieved via increasing internal parallelism, adopting large-size buffers,
ACM Transactions on Storage, Vol. 11, No. 2, Article 8, Publication date: March 2015.

8:22 S. Cho et al.
increasing the areal density of the NAND flash cells, and so forth. As a result, mod-ern SSDs exhibit spectacular performance compared to the legacy HDDs. SSDs aremore energy efficient than HDDs from a byte/J point of view. However, the aggre-gate and peak energy consumptions of an SSD become much denser than those of anHDD (measured in J/sec and J/cm3, respectively). We believe that the energy aspectof an SSD design deserves more interest from the community. This work focuses onthe energy consumption behavior of an SSD under various design choices. We variedthe latency of NAND operations, the number of channels, and FTL algorithms andexamined the detailed energy consumption behavior of an SSD. We found that DFTL isthe most energy-efficient scheme due to its good write amplification behavior and thesmall memory footprint. We found that aggregate energy consumption is not sensitiveto the channel/way configuration but is rather governed by the write volume. While asingle erase operation consumes more energy than a single write operation, the aggre-gate energy consumption of all erase operations constitutes less than 1% of the totalenergy consumed by NAND flash. Peak energy consumption is governed by internalparallelism. When it is required to increase the internal parallelism, it is better toincrease way parallelism than channel parallelism from a peak current consumptionpoint of view. The result of this work provides an important guideline in designingenergy-efficient SSDs.
REFERENCES
Nitin Agrawal, Vijayan Prabhakaran, Ted Wobber, John D. Davis, Mark Manasse, and Rina Panigrahy. 2008.Design tradeoffs for SSD performance. In Proceedings of the USENIX 2008 Annual Technical Conferenceon Annual Technical Conference. USENIX, 57–70.
Amir Ban. 1995. Flash file system. U.S. Patent 5 404 485 (April 4, 1995).Amir Ban. 1999. Flash file system optimized for page-mode flash technologies. U.S. Patent 5 937 425 (Aug.
10, 1999).John S. Bucy, Gregory R. Ganger, and et al. 2009. The DiskSim Simulation Version 4.0. Available at
http://www.pdl.cmu.edu/DiskSim.Feng Chen, Tian Luo, and Xiaodong Zhang. 2011a. CAFTL: A content-aware flash translation layer enhancing
the lifespan of flash memory based solid state drives. In Proceedings of the 9th USENIX Conference onFile and Storage Technologies (FAST’11). USENIX Association, 6–6.
Zhiguang Chen, Nong Xiao, Fang Liu, and Yimo Du. 2011b. PBFTL: The page to block mapping FTLwith low response time. In Proceedings of the 2011 IEEE 19th International Symposium on Modeling,Analysis Simulation of Computer and Telecommunication Systems (MASCOTS’11). Singapore, 475–477.DOI:http://dx.doi.org/10.1109/MASCOTS.2011.31
Biplob Debnath, Srinibasan Krishnan, Weijun Xiao, David J. Lilja, and David H. C. Du. 2011. Sampling-basedgarbage collection metadata management scheme for flash-based storage. In Proceedings of the 2011IEEE 27th Symposium on Mass Storage Systems and Technologies (MSST’11). 1–6. DOI:http://dx.doi.org/10.1109/MSST.2011.5937228
ESOSLab. 2012. Linux Application Trace. Retrieved from http://esos.hanyang.ac.kr/sub/ssd_trace_data.zip.Eitan Frachtenberg, Ali Heydari, Harry Li, Amir Michael, Jacob Na, Avery Nisbet, and Pierluigi Sarti. 2011.
High-efficiency server design. In Proceedings of 2011 International Conference for High PerformanceComputing, Networking, Storage and Analysis. ACM, New York, NY, 27.
Fusion-IO. 2011. The fusion-io difference. In White Paper, Fusion-IO (WPCH031511).Eran Gal and Sivan Toledo. 2005. Algorithms and data structures for flash memories. ACM Computer Surveys
37, 2 (June 2005), 138–163. DOI:http://dx.doi.org/10.1145/1089733.1089735Gary Grider. 2011. ExaScale FSIO - Can we get there? Can we afford to? Retrieved from http://snapi2011.cis.
fiu.edu/uploads/General/1.Grider.pdf.Laura M. Grupp, Adrian M. Caulfield, Joel Coburn, Steven Swanson, Eitan Yaakobi, Paul H. Siegel, and Jack
K. Wolf. 2009. Characterizing flash memory: Anomalies, observations, and applications. In Proceedingsof the 42nd Annual IEEE/ACM International Symposium on Microarchitecture (MICRO 42). ACM, NewYork, NY, 24–33. DOI:http://dx.doi.org/10.1145/1669112.1669118
Aayush Gupta, Youngjae Kim, and Bhuvan Urgaonkar. 2009. DFTL: A flash translation layer employingdemand-based selective caching of page-level address mappings. In Proceeding of the 14th International
ACM Transactions on Storage, Vol. 11, No. 2, Article 8, Publication date: March 2015.
Design Tradeoffs of SSDs: From Energy Consumption’s Perspective 8:23
Conference on Architectural Support for Programming Languages and Operating Systems (ASPLOS’09).ACM, Washington, DC, 229–240. DOI:http://dx.doi.org/10.1145/1508244.1508271
Jiahua He, Arun Jagatheesan, Sandeep Gupta, Jeffrey Bennett, and Allan Snavely. 2010. DASH: A recipefor a flash-based data intensive supercomputer. In Proceedings of the 2010 ACM/IEEE InternationalConference for High Performance Computing, Networking, Storage and Analysis (SC’10). IEEE ComputerSociety, Washington, DC, 1–11. DOI:http://dx.doi.org/10.1109/SC.2010.16
Yang Hu, Hong Jiang, Dan Feng, Lei Tian, Shuping Zhang, Jingning Liu, Wei Tong, Yi Qin, and LiuzhengWang. 2010. Achieving page-mapping FTL performance at block-mapping FTL cost by hiding addresstranslation. In Proceedings of the 2010 IEEE 26th Symposium on Mass Storage Systems and Technologies(MSST’10). 1–12. DOI:http://dx.doi.org/10.1109/MSST.2010.5496970
IC-insights. December 19, 2012. Total flash memory market will surpass DRAM for first time in 2012. InResearch Bulletin, IC insights.
Takuro Inoue, Makoto Ikeda, Tomoya Enokido, Ailixier Aikebaier, and Makoto Takizawa. 2011. A powerconsumption model for storage-based applications. In Proceedings of the 2011 International Conferenceon Complex, Intelligent and Software Intensive Systems (CISIS’11). IEEE, 612–617.
Intel. 2012. Intel Solid-State Drive 320 Series and Dell PowerEdge. Retrieved from http://www.intel.com.br/content/dam/www/public/us/en/documents/technology-briefs/ssd-320-dell-poweredge-brief.pdf.
Intel. 2009a. MD332B NAND Flash Memory. Preliminary Datasheet.Intel. 2009b. Intel X25-M and X18-M Mainstream SATA Solid-State Drives. Retrieved from http://www.intel.
com/design/flash/nand/mainstream/technicaldocuments.htm.Kim Jesung, Kim Jong Min, S. H. Noh, Min Sang Lyul, and Cho Yookun. 2002. A space-efficient flash
translation layer for CompactFlash systems. IEEE Transactions on Consumer Electronics 48, 2 (2002),366–375.
Myoungsoo Jung, Ellis Herbert Wilson, David Donofrio, John Shalf, and Mahmut T. Kandemir. 2012. NAND-FlashSim: Intrinsic latency variation aware NAND flash memory system modeling and simulation atmicroarchitecture level. In Proceedings of the 2012 IEEE 28th Symposium on Mass Storage Systems andTechnologies (MSST’12). IEEE, 1–12.
Swaroop Kavalanekar, Bruce Worthington, Qi Zhang, and Vishal Sharda. 2008. Characterization of storageworkload traces from production Windows Servers. In Proceedings of the 2008 IEEE InternationalSymposium on Proceedings of Workload Characterization (IISWC 2008). 119–128. DOI:http://dx.doi.org/10.1109/IISWC.2008.4636097
Ricardo Koller and Raju Rangaswami. 2010. I/O deduplication: Utilizing content similarity to improveI/O performance. Transactions on Storage 6, 3, Article 13 (Sept. 2010), 26 pages. DOI:http://dx.doi.org/10.1145/1837915.1837921
Tei-Wei Kuo, Yuan-Hao Chang, Po-Chun Huang, and Che-Wei Chang. 2008. Special issues in flash. InProceedings of the IEEE/ACM International Conference on Computer-Aided Design, 2008 (ICCAD’08).San Jose, CA, USA, 821–826. DOI:http://dx.doi.org/10.1109/ICCAD.2008.4694174
Sungjin Lee, Taejin Kim, Ji-Sung Park, and Jihong Kim. 2013. An integrated approach for managing thelifetime of flash-based SSDs. In Proceedings of the Conference on Design, Automation and Test in Europe.EDA Consortium, 1522–1525.
Duo Liu, Yi Wang, Zhiwei Qin, Zili Shao, and Yong Guan. 2012a. A space reuse strategy for flash translationlayers in SLC NAND flash memory storage systems. IEEE Transactions on Very Large Scale Integration(VLSI) Systems 20, 6 (June 2012), 1094–1107. DOI:http://dx.doi.org/10.1109/TVLSI.2011.2142015
Duo Liu, Tianzheng Wang, Yi Wang, Zhiwei Qin, and Zili Shao. 2012b. A block-level flash memory man-agement scheme for reducing write activities in PCM-based embedded systems. In Proceedings of theDesign, Automation Test in Europe Conference Exhibition (DATE’12). 1447–1450.
Micron. 2013. 128Gb to 1Tb Asynchronous/Synchronous NAND, datasheet, Rev. G. 2013.Muthukumar Murugan and David H. C. Du. 2011. Rejuvenator: A static wear leveling algorithm for NAND
flash memory with minimized overhead. In Proceedings of the 2011 IEEE 27th Symposium on MassStorage Systems and Technologies (MSST’11). 1–12. DOI:http://dx.doi.org/10.1109/MSST.2011.5937225
Dushyanth Narayanan, Eno Thereska, Austin Donnelly, Sameh Elnikety, and Antony Rowstron. 2009. Mi-grating server storage to SSDs: Analysis of tradeoffs. In Proceedings of the 4th ACM European Conferenceon Computer Systems. ACM, 145–158.
Xiang Ni, Esteban Meneses, and Laxmikant V. Kale. 2012. Hiding checkpoint overhead in HPC applicationswith a semi-blocking algorithm. In Proceedings of the 2012 IEEE International Conference on ClusterComputing (CLUSTER). IEEE, 364–372.
ONFI. 2011. Open NAND Flash Interface (ONFI) Specification 3.0. Retrieved from http://www.onfi.org/specifications.
ACM Transactions on Storage, Vol. 11, No. 2, Article 8, Publication date: March 2015.

8:24 S. Cho et al.
Sang-Hoon Park, Seung-Hwan Ha, Kwanhu Bang, and Eui-Young Chung. 2009a. Design and analysis offlash translation layers for multi-channel NAND flash-based storage devices. IEEE Transactions onConsumer Electronics 55, 3 (2009), 1392–1400.
Jinha Park, Sungjoo Yoo, Sunggu Lee, and Chanik Park. 2009b. Power modeling of solid state disk fordynamic power management policy design in embedded systems. In Software Technologies for Embeddedand Ubiquitous Systems. Vol. 5860. Springer, 24–35. DOI:http://dx.doi.org/10.1007/978-3-642-10265-3_3
Padmanabhan Pillai, Michael Kaminsky, Michael A. Kozuch, and David G. Andersen. 2012. FAWNSort:Energy efficient Sorting of 10GB, 100GB, and 1TB. Winner of 2012 10GB, 100GB, and 1TB, JoulesortDaytona and Indy categories. Retrieved from http://softbenchmark.org/fawnsort-joulesort-2012.pdf.
Meikel Poess and Raghunath Othayoth Nambiar. 2010. Tuning servers, storage and database for energyefficient data warehouses. In Proceedings of the 2010 IEEE 26th International Conference on DataEngineering (ICDE’10). IEEE, 1006–1017.
Samsung. 2012. 64Gb A-die Toggle NAND Flash, datasheet Rev. 1.1. 2012.Samsung. 2005. K9XXG08UXM NAND Flash Memory, Preliminary Datasheet.Daniel Schall, Volker Hudlet, and Theo Harder. 2010. Enhancing energy efficiency of database applications
using SSDs. In Proceedings of the 3rd C* Conference on Computer Science and Software Engineering(C3S2E’10). ACM, New York, NY, 1–9. DOI:http://dx.doi.org/10.1145/1822327.1822328
Euiseong Seo, Seon-Yeong Park, and Bhuvan Urgaonkar. 2008. Empirical analysis on energy efficiencyof flash-based SSDs. In Proceedings of the 2008 Conference on Power Aware Computing and Systems(HotPower’08). USENIX Association, San Diego, California, 17–17.
Hyotaek Shim, Bon-Keun Seo, Jin-Soo Kim, and Seungryoul Maeng. 2010. An adaptive partitioningscheme for DRAM-based cache in Solid State Drives. In Proceedings of the 2010 IEEE 26th Sympo-sium on Mass Storage Systems and Technologies (MSST). 1–12. DOI:http://dx.doi.org/10.1109/MSST.2010.5496995
Dmitry Shmidt. 2002. TrueFFS wear-leveling mechanism. In Technical Report, M-systems (TN-DOC-017).SPC. 2009. UMASS TRACE REPOSITORY. Retrieved from http://traces.cs.umass.edu/.Shawn M. Strande, Pietro Cicotti, Robert S. Sinkovits, William S. Young, Rick Wagner, Mahidhar Tatineni,
Eva Hocks, Allan Snavely, and Mike Norman. 2012. Gordon: Design, performance, and experiencesdeploying and supporting a data intensive supercomputer. In Proceedings of the 1st Conference of theExtreme Science and Engineering Discovery Environment: Bridging from the eXtreme to the Campus andBeyond (XSEDE’12). ACM, Article 3, 8 pages. DOI:http://dx.doi.org/10.1145/2335755.2335789
Dimitris Tsirogiannis, Stavros Harizopoulos, and Mehul A. Shah. 2010. Analyzing the energy efficiency of adatabase server. In Proceedings of the 2010 ACM SIGMOD International Conference on Management ofData. ACM, 231–242.
Qingsong Wei, Bozhao Gong, S. Pathak, B. Veeravalli, LingFang Zeng, and K. Okada. 2011. WAFTL: Aworkload adaptive flash translation layer with data partition. In 2011 IEEE 27th Symposium onMass Storage Systems and Technologies (MSST). Denver, CO, USA, 1–12. DOI:http://dx.doi.org/10.1109/MSST.2011.5937217
Qi Wu, Guiqiang Dong, and Tong Zhang. 2011. Exploiting heat-accelerated flash memory wear-out recoveryto enable self-healing SSDs. In Proceedings of the 3rd USENIX Conference on Hot Topics in Storage andFile Systems (HotStorage 2011). USENIX, 4–4. http://dl.acm.org/citation.cfm?id=2002218.2002222
H. Yada, H. Ishioka, T. Yamakoshi, Y. Onuki, Y. Shimano, M. Uchida, H. Kanno, and N. Hayashi. 2000.Head positioning servo and data channel for HDDs with multiple spindle speeds. IEEE Transactions onMagnetics 36, 5 (2000), 2213–2215.
Balgeun Yoo, Youjip Won, Seokhei Cho, Sooyong Kang, Jongmoo Choi, and Sungroh Yoon. 2011. SSD char-acterization: From energy consumption’s perspective. In Proceedings of USENIX HotStorage. USENIX.
Jinsoo Yoo, Youjip Won, Joongwoo Hwang, Sooyong Kang, Jongmoo Choi, Sungroh Yoon, and Jaehyuk Cha.2013. VVSIM: Virtual machine based SSD simulator. In Proceedings of the 2013 IEEE 29th Symposiumon Proceeding of Mass Storage Systems and Technologies (MSST’13). IEEE.
Received July 2013; revised April 2014; accepted July 2014
ACM Transactions on Storage, Vol. 11, No. 2, Article 8, Publication date: March 2015.