design, synthesis, manufacturing, and testing of … · design, synthesis, manufacturing, and...
TRANSCRIPT

DESIGN, SYNTHESIS, MANUFACTURING, AND TESTING OF
A COMPETITIVE FHSAE VEHICLE
Final Report
KLK764
N12-07
National Institute for Advanced Transportation
Technology
University of Idaho
Eacker, Christopher; Wos, Samuel; Odom, Edwin;
Beyerlein, Steve; Law, Joe
June 2012

DISCLAIMER
The contents of this report reflect the views of the authors,
who are responsible for the facts and the accuracy of the
information presented herein. This document is disseminated
under the sponsorship of the Department of Transportation,
University Transportation Centers Program, in the interest of
information exchange. The U.S. Government assumes no
liability for the contents or use thereof.

1. Report No. 2. Government Accession No.
3. Recipient’s Catalog No.
4. Title and Subtitle
Design, Synthesis, Manufacturing, and Testing of a Competitive FHSAE Vehicle
5. Report Date June 2012
6. Performing Organization Code KLK764
7. Author(s)
Eacker, Christopher; Wos, Samuel; Odom, Dr. Edwin; Beyerlein,
Dr. Steve; Law, Dr. Joe
8. Performing Organization Report No.
N12-07
9. Performing Organization Name and Address 10. Work Unit No. (TRAIS)
National Institute for Advanced Transportation Technology University of Idaho PO Box 440901; 115 Engineering Physics Building Moscow, ID 83844-0901
11. Contract or Grant No.
DTRT07-G-0056
12. Sponsoring Agency Name and Address
US Department of Transportation Research and Special Programs Administration 400 7th Street SW Washington, DC 20509-0001
13. Type of Report and Period Covered Final Report: August 2010 – June 2012
14. Sponsoring Agency Code USDOT/RSPA/DIR-1
15. Supplementary Notes:
16. Abstract
The goal of this multi-year project is to create a fully functional University of Idaho entry in the hybrid FSAE competition scheduled for 2012. Vehicle integration has been completed as part of a variety of 2010-2011 senior design projects and 2011-2012 senior design projects. This leverages a variety of analytical and empirical studies undertaken in FY 2010 that demonstrate feasibility of the electromechanical powertrain, the energy management system, and the chassis layout. This project has engaged a broad population of graduate and undergraduate students in implementing sustainable transportation technology as well as creation of knowledge management systems that will benefit current and future competition teams. Approximately 30% of the allowed 19.5 Mega-Joules (MJ) for the 22 mile endurance event will be supplied in the initial charge state of the battery pack. The remaining 70% is stored in the vehicle’s gas tank. Accomplishments to date include a road load energy model, inertia modeling of the YZ250F, acceleration modeling, performance testing of the electric motor/controller, solid modeling of a reconfigured YZ250F motorcycle engine, suspension modeling, frame design, and an electronic archive designed to serve as a resource for just-in-time learning of hybrid terminology, subsystem descriptions, analysis methods, and performance tests. Specifications are given for all major subsystems and components that comprise a hybrid electronic competition vehicle that is destined for the 2012 Hybrid FSAE Challenge.
17. Key Words
Parallel Hybrid; Pre-Transmission;
Sustainability;
18. Distribution Statement
Unrestricted; Document is available to the public through the National Technical Information Service; Springfield, VT.
19. Security Classif. (of
this report)
Unclassified
20. Security Classif. (of
this page)
Unclassified
21. No. of
Pages
46
22. Price
…
Form DOT F 1700.7 (8-72) Reproduction of completed page authorized
Design, Synthesis, Manufacturing, and Testing of a Competitive FHSAE Vehicle i
TABLE OF CONTENTS
FIGURES ........................................................................................................................................ ii
TABLES ......................................................................................................................................... ii
EXECUTIVE SUMMARY .............................................................................................................1
DESCRIPTION OF PROBLEM......................................................................................................2
APPROACH AND METHODOLOGY ..........................................................................................5
Road Load Model ........................................................................................................................5
Inertia Model of the YZ250F .......................................................................................................8
Acceleration Model ......................................................................................................................9
Vehicle Powertrain Configuration .............................................................................................10
Energy Management ..................................................................................................................11
Motor Controller Development..................................................................................................13
Sustainability..............................................................................................................................14
VEHICLE INTEGRATION ..........................................................................................................16
YZ250F Engine ..........................................................................................................................16
Electronic Fuel Injection ............................................................................................................18
Engine Repackaging ..................................................................................................................20
Suspension and Steering ............................................................................................................20
Uprights......................................................................................................................................25
Inboard Suspension Components ...............................................................................................26
Sensors and Controls..................................................................................................................28
Data Collection ..........................................................................................................................32
Ergonomics ................................................................................................................................33
Braking System ......................................................................................................................33
Shifting ...................................................................................................................................34
Steering ..................................................................................................................................34
FINDINGS; CONCLUSIONS; RECOMMENDATIONS ............................................................35
Road Load Model ......................................................................................................................35
Energy Management ..................................................................................................................35
Vehicle Integration .....................................................................................................................36
Competition Overview ...............................................................................................................37
Design Infrastructure for Next Generation Vehicles .................................................................39
REFERENCES ..............................................................................................................................40
APPENDIX A: ...............................................................................................................................41
2012 UI Formula Hybrid Vehicle Overview .............................................................................41
Design, Synthesis, Manufacturing, and Testing of a Competitive FHSAE Vehicle ii
FIGURES
Figure 1: Completed 2011-2012 Vandal Hybrid Race Car ............................................................ 1
Figure 2: Organization of TK Solver Road Load Model ................................................................ 6
Figure 3: Powertrain Architecture ................................................................................................ 10
Figure 4: Vandal Hybrid Racing Powertrain Assembly ............................................................... 16
Figure 5: Re-oriented Engine Components ................................................................................... 17
Figure 6: Cylinder Orientation Compared to a Stock Engine ....................................................... 18
Figure 7: Engine Control System .................................................................................................. 19
Figure 8: Engine Repackage with an Electric Motor .................................................................... 20
Figure 9: Suspension Parameters .................................................................................................. 21
Figure 10: Wheel Rate vs. Vertical Travel ................................................................................... 27
Figure 11: Bell Crank Design for Pull Rod Suspension ............................................................... 28
Figure 12: Low Voltage Box Layout and Circuitry ...................................................................... 30
Figure 13: Sensor and Controller Network ................................................................................... 32
Figure 14: Endurance Wheel Velocity Data ................................................................................. 33
Figure 15: Battery Charging Curve ............................................................................................... 36
Figure 16: Competition Vehicle Preparing for Race. ................................................................... 37
Figure 17: 2012 Formula Hybrid Score Sheet .............................................................................. 38
TABLES
Table 1: Design Goals for Repackaged Powertrain ........................................................................ 3
Table 2: Design Goals for Frame .................................................................................................... 3
Table 3: Design Goals for Suspension, Steering, and Brakes ......................................................... 4
Table 4: Design Goals for Electrical System .................................................................................. 4
Table 5: Powertrain Parameters ...................................................................................................... 7
Table 6: Vehicle Properties Parameters .......................................................................................... 7
Table 7: Output Variables ............................................................................................................... 8
Table 8: Front Outboard Suspension Packaging Targets .............................................................. 21
Table 9: Front Inboard Suspension Packaging Targets ................................................................ 22
Table 10: Rear Inboard Suspension Packaging Targets ............................................................... 24
Design, Synthesis, Manufacturing, and Testing of a Competitive FHSAE Vehicle 1
EXECUTIVE SUMMARY
The goal of this multi-year project is to create a fully functional University of Idaho entry
into the hybrid FSAE competition, scheduled for spring 2012. The vehicle pictured in Figure
1 competed from April 30 to May 3, 2012 at the New Hampshire Motor Speedway at the
international Formula Hybrid Competition. This vehicle is the result of several 2010-2011
senior design projects and 2011-2012 senior design projects. Supporting technical work on
powertrain design, suspension optimization, vehicle solid modeling, and energy management
have been completed in four different master’s theses, three in mechanical engineering and
one in electrical engineering. Continuing work is being done on vehicle acceleration models,
energy tracking, and exploration of inertial optimization and its effect on vehicle
performance. Accomplishments to date include a road load energy model, performance
testing of the electric motor/controller, manufacturing of a reconfigured YZ250F motorcycle
engine, full vehicle fabrication, effective data acquisition, and electronic motor control.
Specifications and subsystem descriptions are given for all major subsystems and
components that comprise a hybrid electronic competition vehicle that is destined for the
2012 Hybrid FSAE Challenge.
Figure 1: Completed 2011-2012 Vandal Hybrid Race Car
Design, Synthesis, Manufacturing, and Testing of a Competitive FHSAE Vehicle 2
DESCRIPTION OF PROBLEM
The word “hybrid” describes the combination of attributes of two separate entities working to
achieve one desired end goal. This concept has existed for many years in biology, Greek
mythology, music, culture, and transportation. Manufacturers in several countries across the
world now build highly efficient hybrid locomotives. Gantry cranes that lift rail cars on and
off ships now utilize a generator to recover energy while the load is lowered. The Boeing
Company is investigating hybrid packages for Auxiliary Power Units in their next generation
737. The military is conducting research on parallel hybrids to support stealth operations and
rapid acceleration in their Humvees. The most significant achievement in mass produced
hybrid technology is perhaps the Toyota Prius. Since the Toyota Prius hit the automobile
market in 1997, Toyota’s hybrid vehicles have continued to set record sales year in and year
out. Students at the University of Idaho can learn much about hybrid propulsion systems by
analyzing and emulating design features found in vehicles such as the Prius.
Since the inception of the Formula SAE collegiate design competition in 1981, the rules have
forbidden the entry of any hybrid vehicles. This has been challenged in the last decade by
automotive market trends and public enthusiasm for green design. In 2007, the SAE rules
committee created the hybrid competition which is held at the New Hampshire Motor
Speedway in Loudon, New Hampshire. This project was undertaken to establish a Formula
Hybrid SAE (FHSAE) team at the University of Idaho.
The FHSAE rules are very similar to the FSAE competition rules with the major differences
focused on the powertrain size and configuration, as well as electrical safety precautions. The
displacement of the internal combustion engine is limited to a displacement of 250cc, and the
use of any number of electric motors is allowed [1]. The competition is broken into two
categories. The first portion consists of Static events to evaluate the student’s engineering,
manufacturing, and marketing knowledge and accounts for 450 of the allotted 1000 points
available in the competition. The second part is comprised of Dynamic events to test the
speed, robustness, drivability, and overall handling of the car and accounts for 550 of the
allotted 1000 points available in the competition. Subsystem design goals for the 2012 UI
FHSAE vehicle are given in Tables 1-4.

Design, Synthesis, Manufacturing, and Testing of a Competitive FHSAE Vehicle 3
Table 1: Design Goals for Repackaged Powertrain
Subsystem Objective
Engine Repackaging
‐ Connect electric motor to countershaft in YZ250F transmission ‐ Integrate with planetary differential to minimize mounting
hardware ‐ Maximize reuse of stock YZ250F and WR250 hardware ‐ Tilt engine head for tighter packaging behind driver ‐ Integrate WR250 starter in place of kick start
Intake and Exhaust
‐ Optimize for this application using Ricardo Wave ‐ Operate below the 110 dB sound level limit ‐ Thermally isolate from other components in rear box
EFI System ‐ Convert YZ250F from carbureted to fuel injected operation ‐ Customize fuel mapping for hot and cold starts, idling, and a
balance between maximum performance and fuel efficiency Test-stand ‐ Monitor performance at any throttle setting with eddy current
dynamometer ‐ Improve power and efficiency of engine operation ‐ Simulate race load conditions and test reconfigured powertrain
Shifter ‐ Ergonomic, quick, and compatible with EFI system ‐ Reliable operation during driving ‐ Automatic operation for dynamic acceleration event
Table 2: Design Goals for Frame
Subsystem Objective
Front Box ‐ Nodal mounting points for all suspension members ‐ Transmit loads from front bulkhead to main roll hoop ‐ Ergonomically package steering rack and wheel
Driver Box ‐ Ergonomic sitting position while satisfying FSAE driver templates
‐ Effectively package low-voltage electric motor control and data acquisition
Rear Box ‐ Rigidly attach engine and electric motor while protecting these components against all credible accident scenarios
‐ Nodal mounting points for all suspension components Overall Frame ‐ Rigid (>2400 ft-lb/deg.)
‐ Lightweight (<65 lbs.) ‐ Compliant with FSAE and FHSAE rules
Design, Synthesis, Manufacturing, and Testing of a Competitive FHSAE Vehicle 4
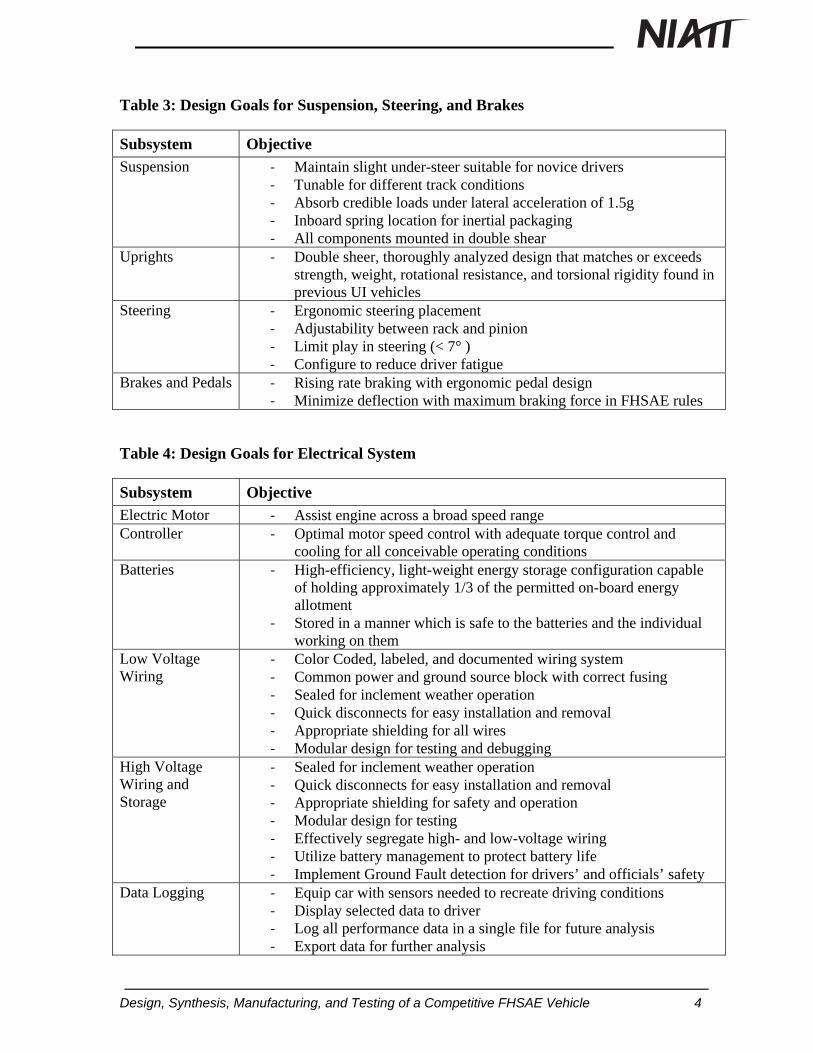
Table 3: Design Goals for Suspension, Steering, and Brakes
Subsystem Objective
Suspension ‐ Maintain slight under-steer suitable for novice drivers ‐ Tunable for different track conditions ‐ Absorb credible loads under lateral acceleration of 1.5g ‐ Inboard spring location for inertial packaging ‐ All components mounted in double shear
Uprights ‐ Double sheer, thoroughly analyzed design that matches or exceeds strength, weight, rotational resistance, and torsional rigidity found in previous UI vehicles
Steering ‐ Ergonomic steering placement ‐ Adjustability between rack and pinion ‐ Limit play in steering (< 7° ) ‐ Configure to reduce driver fatigue
Brakes and Pedals ‐ Rising rate braking with ergonomic pedal design ‐ Minimize deflection with maximum braking force in FHSAE rules
Table 4: Design Goals for Electrical System
Subsystem Objective
Electric Motor ‐ Assist engine across a broad speed range Controller ‐ Optimal motor speed control with adequate torque control and
cooling for all conceivable operating conditions Batteries ‐ High-efficiency, light-weight energy storage configuration capable
of holding approximately 1/3 of the permitted on-board energy allotment
‐ Stored in a manner which is safe to the batteries and the individual working on them
Low Voltage Wiring
‐ Color Coded, labeled, and documented wiring system ‐ Common power and ground source block with correct fusing ‐ Sealed for inclement weather operation ‐ Quick disconnects for easy installation and removal ‐ Appropriate shielding for all wires ‐ Modular design for testing and debugging
High Voltage Wiring and Storage
‐ Sealed for inclement weather operation ‐ Quick disconnects for easy installation and removal ‐ Appropriate shielding for safety and operation ‐ Modular design for testing ‐ Effectively segregate high- and low-voltage wiring ‐ Utilize battery management to protect battery life ‐ Implement Ground Fault detection for drivers’ and officials’ safety
Data Logging ‐ Equip car with sensors needed to recreate driving conditions ‐ Display selected data to driver ‐ Log all performance data in a single file for future analysis ‐ Export data for further analysis
Design, Synthesis, Manufacturing, and Testing of a Competitive FHSAE Vehicle 5
APPROACH AND METHODOLOGY
Road Load Model
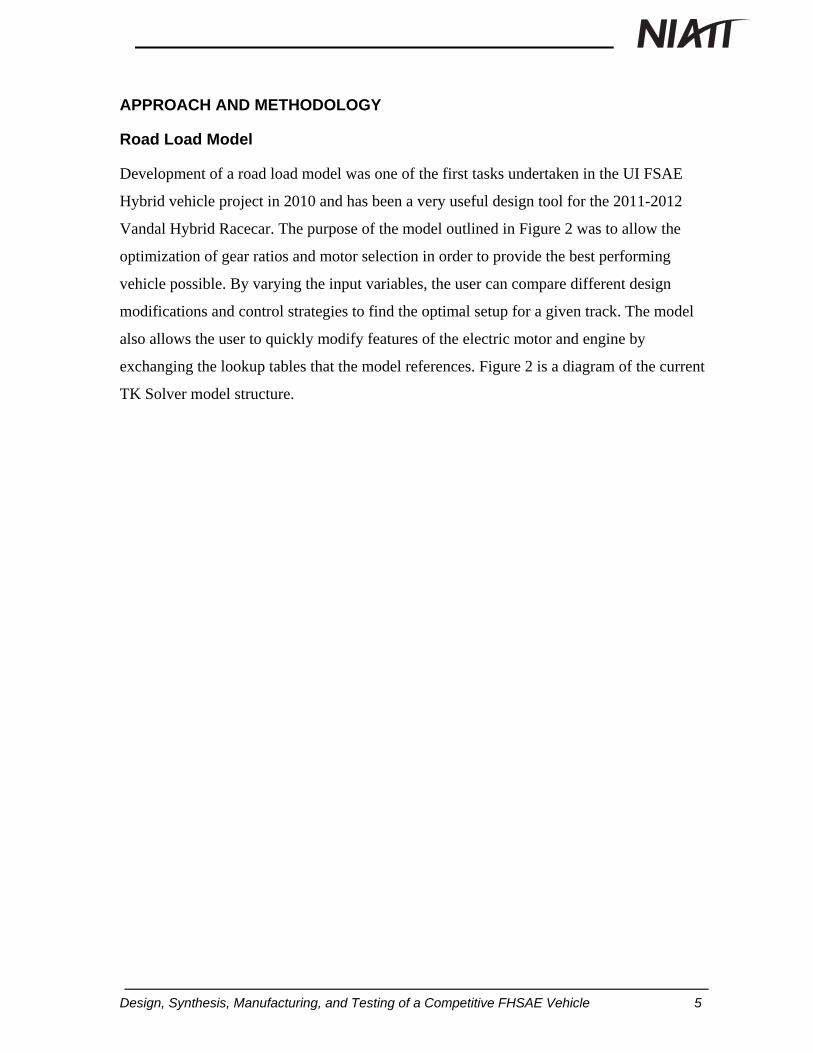
Development of a road load model was one of the first tasks undertaken in the UI FSAE
Hybrid vehicle project in 2010 and has been a very useful design tool for the 2011-2012
Vandal Hybrid Racecar. The purpose of the model outlined in Figure 2 was to allow the
optimization of gear ratios and motor selection in order to provide the best performing
vehicle possible. By varying the input variables, the user can compare different design
modifications and control strategies to find the optimal setup for a given track. The model
also allows the user to quickly modify features of the electric motor and engine by
exchanging the lookup tables that the model references. Figure 2 is a diagram of the current
TK Solver model structure.

Design, Synthesis, Manufacturing, and Testing of a Competitive FHSAE Vehicle 6
Figure 2: Organization of TK Solver Road Load Model
The parameters that can be adjusted as well as the parameters that are fixed within the
subroutine are indicated in Table 5. Note that the values here are listed as “Known.” In this
case, this means that they are either measured, such as in the case of tire diameter or
mandated by rules or manufacture specifications. Other known values are selected by the
user based on other knowledge or previous work during the design of the powertrain. These
parameters are summarized in Table 5-6.

Design, Synthesis, Manufacturing, and Testing of a Competitive FHSAE Vehicle 7
Table 5: Powertrain Parameters
Parameter User Selected/Fixed Known/Assumption
Max Vehicle Speed User Known Tire Diameter User Known Final Drive Ratio User Known Max Engine RPM User Known Shift RPM User Known Primary Reduction Fixed Known Transmission Gear Ratios Fixed Known
Table 6: Vehicle Properties Parameters
Parameter User Selected/Fixed Known/Assumption
Vehicle Weight User Assumption Coefficient Rolling Resistance User Assumption Coefficient of Drag User Assumption Frontal Area User Assumption Corner Radii User Known Cornering Capacity User Assumption Gravity, Air Density Fixed Known
Note that many of the variables used in this subroutine are listed as “Assumptions.” These
values are estimates based upon the current design of the vehicle. Once the vehicle is
assembled, the various parameters will be updated to reflect the actual vehicle, which will
increase the accuracy of the model and tailor it specifically for the UI FSAE Hybrid vehicle.
Once the basic track, powertrain and vehicle properties have been established, the analysis of
track performance can be completed and the results can be quantified and analyzed for
vehicle component selection. Analysis of the results revealed which of the vehicle parameters
were the most impactful, such as weight or power [2]. It also demonstrated how different
configurations of the powertrain, such as the electric motor, could potentially impact the
overall performance of the vehicle.
Table 7 shows the various performance outputs of the program and their intended purpose.
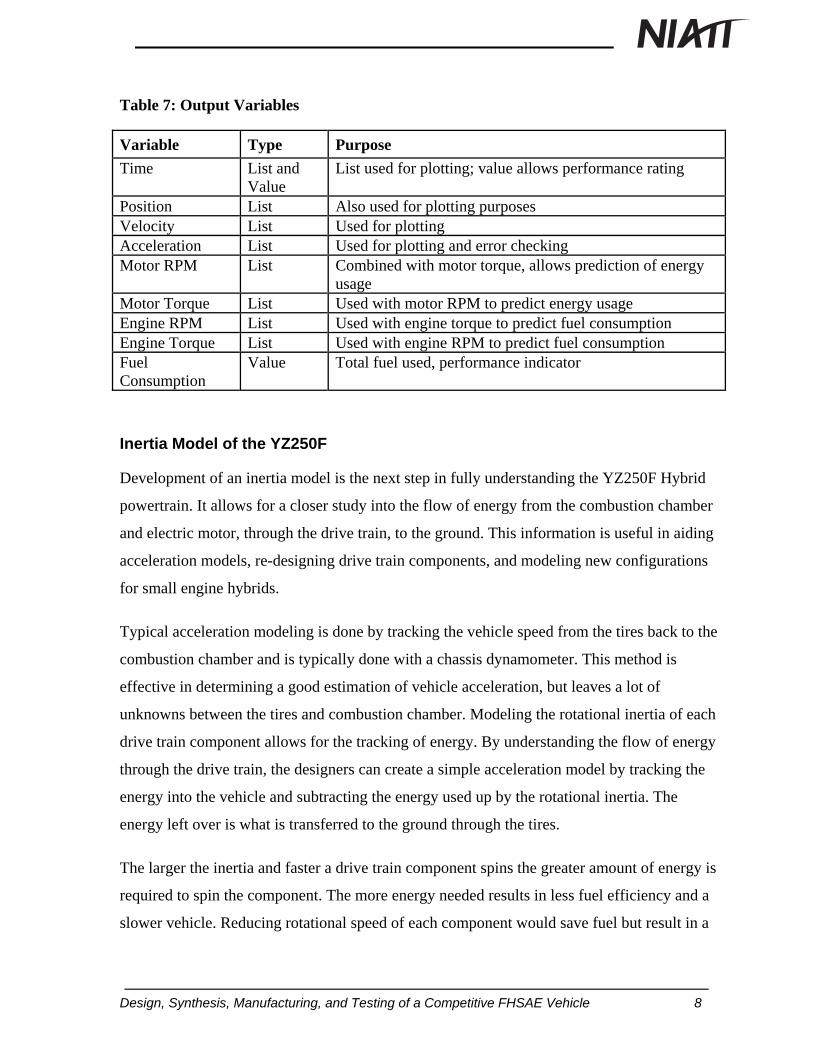
Design, Synthesis, Manufacturing, and Testing of a Competitive FHSAE Vehicle 8
Table 7: Output Variables
Variable Type Purpose
Time List and Value
List used for plotting; value allows performance rating
Position List Also used for plotting purposes Velocity List Used for plotting Acceleration List Used for plotting and error checking Motor RPM List Combined with motor torque, allows prediction of energy
usage Motor Torque List Used with motor RPM to predict energy usage Engine RPM List Used with engine torque to predict fuel consumption Engine Torque List Used with engine RPM to predict fuel consumption Fuel Consumption
Value Total fuel used, performance indicator
Inertia Model of the YZ250F
Development of an inertia model is the next step in fully understanding the YZ250F Hybrid
powertrain. It allows for a closer study into the flow of energy from the combustion chamber
and electric motor, through the drive train, to the ground. This information is useful in aiding
acceleration models, re-designing drive train components, and modeling new configurations
for small engine hybrids.
Typical acceleration modeling is done by tracking the vehicle speed from the tires back to the
combustion chamber and is typically done with a chassis dynamometer. This method is
effective in determining a good estimation of vehicle acceleration, but leaves a lot of
unknowns between the tires and combustion chamber. Modeling the rotational inertia of each
drive train component allows for the tracking of energy. By understanding the flow of energy
through the drive train, the designers can create a simple acceleration model by tracking the
energy into the vehicle and subtracting the energy used up by the rotational inertia. The
energy left over is what is transferred to the ground through the tires.
The larger the inertia and faster a drive train component spins the greater amount of energy is
required to spin the component. The more energy needed results in less fuel efficiency and a
slower vehicle. Reducing rotational speed of each component would save fuel but result in a

Design, Synthesis, Manufacturing, and Testing of a Competitive FHSAE Vehicle 9
direct loss in vehicle acceleration, which is undesirable in a race application. So the reduction
of each component’s inertia is more desirable. Reduction of a component’s mass or volume
is required to achieve a lower inertia. This can be done by using a light material and keeping
the same volume, reducing the volume and keeping the same material, or reducing the
component volume and changing its material properties.
Another option is the elimination or reconfiguration of the drive train components. This
method helps to reduce rotational inertia by changing the speed that each component spins at
by changing its location in the drive train. Since the rotational speed term in kinetic energy is
squared, unlike the inertia term, it will have a greater effect when reduced. This also leaves
the option to place several smaller electric motors into the drive train instead of one large
electric motor with a large inertia. Placing a small electric motor closer to the crank, or as
part of the crank, can reduce the impact of the one large electric motor, but still maintain the
same power input [3]. This option also allows the power train to be balanced to reduce
vibrations which would increase the life of several of the engine components.
Acceleration Model
In an effort to increase the performance and energy efficiency of the vehicle during
acceleration, a mathematical model was created to simulate the vehicle’s performance and
energy consumption for an acceleration event. An acceleration event at the Hybrid SAE
competition is 246ft long with teams competing to produce the fastest time under both hybrid
and electric-only operating conditions. Even though the acceleration event is only 15% of the
total points at the competition, the model is intended to help identify potential performance
and efficiency gains through the means of different powertrain configurations and
components [4]. The improvements aid in all of the dynamic events at competition,
accounting for 60% of the total score. The current model is based on the torque output of
both the electric motor and the internal combustion engine coupled in parallel, incorporating
basic vehicle parameters such as gear ratios, drivetrain efficiencies, aerodynamic drag,
vehicle weight, etc. The acceleration model is also used in the vehicle performance model
that simulates the vehicle’s acceleration, velocity, position, and fuel consumption during an
endurance event. The endurance event is a 22 km race where both completion time and
energy consumption are taken into account, requiring teams to decide where to draw the line

Design, Synthesis, Manufacturing, and Testing of a Competitive FHSAE Vehicle 10
between efficiency and performance. Future work on this model includes shifting
optimization, incorporating the rotation inertia model, improving accuracy of efficiency
predictions, and validation using the current vehicle
Vehicle Powertrain Configuration
Research and study of the hybrid architectures and previously developed UI models led to the
decision to develop the hybrid powertrain as a parallel system, shown in Figure 3. The
overall goal of the system was to develop a phase one vehicle that was primarily a gasoline
powered vehicle with electric assist to improve performance and reduce overall fuel
consumption. As in many modern production hybrids, the move to a downsized engine
(compared to the standard FSAE Vehicle) was made to increase the efficiency of the vehicle
[5]. An electric motor was then utilized to assist the gasoline engine during acceleration.
Figure 3: Powertrain Architecture
The primary powertrain components are the engine, clutch, transmission, differential, and
electric motor. The engine is an unmodified Yamaha YZ250F. The engine components
include the cylinder, cylinder head, and crankshaft assembly. An aftermarket clutch from

Design, Synthesis, Manufacturing, and Testing of a Competitive FHSAE Vehicle 11
Rekluse motorsports was included using the original mounting and operation configuration
eliminating the need for manual clutch actuation. The transmission gears were selected from
off-the-shelf available components from Yamaha Motors. The differential is from a
production vehicle housed in a custom built carrier. A Lynch electric motor was added
externally and connected to the powertrain via a custom countershaft and pulley assembly.
Energy Management
A Lynch 46hp permanent magnet motor was chosen by reviewing the most frequently used
motors in past FHSAE competitions and examining their compatibility with the YZ250F
engine through the road load model. Specifications taken into consideration were efficiency,
combined torque of the motor and the gasoline engine that did not exceed torque limitations
of the counter shaft, maximum power given these torque limitations, and the likelihood that
the selected motor would be reused in future FHSAE vehicles [6].
Circuitry capable of interpreting a proportional signal and adjusting the motor armature
voltage is required for vehicle speed adjustments. Since batteries will be used as the energy
storage system, a constant supply voltage can be expected. A Kelly PM Motor speed
controller was suggested by a Lynch Motor Company engineer as a good match for their
motor when supplied by a constant source. Further analysis of the Kelly controller
specification sheet verified it was capable of operating a permanent magnet motor and rated
for 400 Amps over ten second intervals. The operational voltage of the controller is
compatible with a 52 Volt (V) configuration for the 2012 car and up to a 96 V configuration
in future vehicles. Other features include regenerative braking, internal temperature
monitoring, and user-friendly light emitting diode [LED] fault codes for easier detection of
errors or warnings.
Competition rules state a maximum total energy storage capacity of 19.5 Mega-Joules (MJ)
or 5417 watt hours (Wh). This equates to 0.59 gallons (gal) of regular unleaded gasoline
using equation (1).

Design, Synthesis, Manufacturing, and Testing of a Competitive FHSAE Vehicle 12
(1)
where
5417
and
2414.
(Assuming a 27% efficiency)
Therefore the use of any electrical energy storage will result in less than 0.59 gallons of gas
available for the internal combustion engine (ICE). A 70:30, mechanical-to-electrical, energy
ratio was selected as a reasonable starting point. Since electrical energy would be stored in
batteries to maintain a more reliable and simplistic design, a greater amount of energy
storage will be in the form of gasoline to maintain a lighter weight solution. A 30% electrical
allotment translates to 1625Wh by:
∗ 0.3 (2)
The minimum requirement for the battery pack was the ability to complete the electric only,
75 Meter [m], sprint in less than ten seconds Four battery specifications of importance were
nominal voltage (translates to maximum velocity), discharge rate (translates to maximum
acceleration), operational temperature (function of discharge rate), and capacity (ability to
travel the entire distance). Since the battery capacity has been predetermined by means of the
TK Solver road model and temperature can be managed through packaging applications, the
battery selection consisted only of nominal voltage and current parameters that met the
desired capacity.
Initial battery research showed batteries are not intended for more than a ten times capacity
(10C) burst discharge rate, to avoid significantly decreasing the life of the battery. Recalling
the motor’s maximum armature current and the Kelly’s rated current as 400A, a 40Ah
configuration became the starting point for iterative analysis. The first step was to calculate
the nominal battery voltage from equation (3):

Design, Synthesis, Manufacturing, and Testing of a Competitive FHSAE Vehicle 13
∗ 0.8
,
(3)
where 0.8 is defined by the Formula Hybrid Rules Committee (FHRC) as the approximate
energy conversion efficiency of batteries and 40 . Therefore, the nominal voltage
equals 50.78V.
Other configurations were considered trading off the importance of acceleration time and
maximum speed. Also, factors beyond engineering design such as manufacturing lead time,
customer support, and physical restrictions (i.e. dimensions and weight) had to be considered.
The cell specifications for the 2012 system are 52.8V and 40Ah.
Motor Controller Development
The performance of the Hybrid Electric Race Car (HERC) relies on the driver’s ability to
process track information and vehicle dynamics in real time. However, the driver’s
processing speed, decision-making speed, data retention, and throughput are inherently
orders of magnitude slower and smaller than the ability of microcontrollers today. Adding a
distributive network of microcontrollers to control certain aspects of the vehicle, inform the
driver of vehicle parameters, and provide driving guidelines can greatly improve the
performance of the HERC. This increased performance led to better lap times, better fuel
consumption, and thus provided a higher chance of winning a race. A distributed network of
microcontrollers allows the driver to dedicate his focus to a smaller number of tasks by
controlling certain aspects of dynamic performance.
For a real-time distributive network of microcontrollers to effectively control a HERC, a very
detailed simulation of the HERC is required. The main purpose of the simulation was to be
able to calculate the most efficient times to convert energy stored in the batteries, ultra-
capacitors, or gasoline into torque to accelerate the vehicle. The simulation was needed to
determine the best times to use the energy and whether the internal combustion engine (ICE),
electric motor (EM), or both are the best source of torque at that given time. The Real Time
Optimized Performance Control (RTOPC) utilized the results of the simulation to control the
HERC.

Design, Synthesis, Manufacturing, and Testing of a Competitive FHSAE Vehicle 14
To effectively estimate the performance of the vehicle, the RTOPC was highly configurable
in real-time. The ability of the RTOPC to change vehicle properties is important, because
track conditions do not stay constant and they affect the performance of the vehicle [7]. The
accuracy of vehicle properties such as coefficient of friction of the tires, vehicle drag, and air
pressure for ICE calculations are all very important in calculating the performance of the
vehicle.
The robustness and precision of the RTOPC is very important, but it is also imperative that
the algorithms are simple enough to provide real-time feedback. Therefore, a balance
between the precision and calculation time of the RTOPC must be found.
Sustainability
The sustainability portion of the competition is one of the main driving forces behind the
development of the Formula Hybrid SAE Competition. A report is required of each team
competing in the Formula Hybrid competition. This is a new requirement and is an
opportunity for teams to present the sustainable features of their design. There are many
ways to go about such a task, but the two that are heavily favored by the design judges at the
competition are a Life Cycle Analysis (LCA) and Well-to-Wheel (WTW) analysis of the
vehicle, the idea being to better quantify the objective of sustainability in teams of the design
by means of analysis of its CO2 generation. The LCA accounts for all of the CO2 generation
that will be produced throughout the lifespan of the design. The WTW will only account for
approximately 80% of the CO2 that will be generated throughout the design’s life. The
University of Idaho chose to pursue a WTW analysis due to the simplicity and known
information of the design and components being implemented. The competition only allows
for a maximum of one page for the sustainability report, with only ½ of the page allotted for
text, and the rest for figures.
Three main points were discussed in the WTW analysis, the CO2 generation in the
production and delivery of the fuel used by the vehicle (Well-to-Tank), the CO2 generated by
the vehicle during operation (Tank-to-Wheel), and a comparison of the CO2 generation of a
comparable non-hybrid vehicle of the same performance. As was expected, the CO2
generation for a Mega joule (MJ) of energy from the power grid was far less than that for a

Design, Synthesis, Manufacturing, and Testing of a Competitive FHSAE Vehicle 15
fossil fuel. The same was the case when that energy was put to the pavement, as the electrical
system is far more efficient than the internal combustion engine. This was also found to be
the case when comparing the hybrid vehicle to a non-hybrid vehicle of similar performance;
it was found that there was a decrease of 31.5% in CO2 generation.
Design, Synthesis, Manufacturing, and Testing of a Competitive FHSAE Vehicle 16
VEHICLE INTEGRATION
YZ250F Engine
The engine selected for the hybrid powertrain is the Yamaha YZ250F. The YZ engine is a 5
valve, DOHC four-stroke single cylinder engine with a displacement of 249cc’s. The engine
is liquid cooled with a dry-sump oil system. The YZ engine was selected for its low weight
of approximately 100 lbs, and high power output of 34 hp. Yamaha has developed a
reputation of producing an engine with a low relative cost and proven reliability. The YZ250
utilizes a constant mesh 5 speed transmission with a multi-plate wet clutch [8].
To conform to the rules of the competition, the piston, cylinder, and cylinder head could not
be modified without moving the engine into the modified category, which would require that
an intake restrictor be added. The case and transmission could be modified in any manner
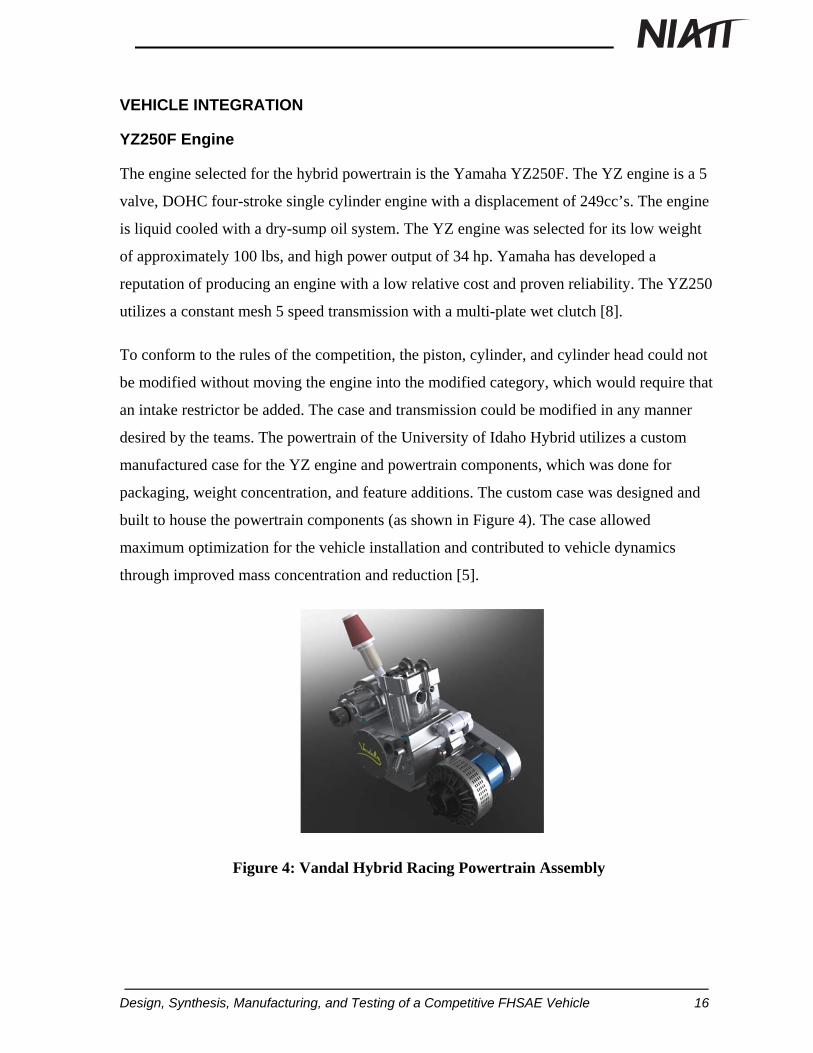
desired by the teams. The powertrain of the University of Idaho Hybrid utilizes a custom
manufactured case for the YZ engine and powertrain components, which was done for
packaging, weight concentration, and feature additions. The custom case was designed and
built to house the powertrain components (as shown in Figure 4). The case allowed
maximum optimization for the vehicle installation and contributed to vehicle dynamics
through improved mass concentration and reduction [5].
Figure 4: Vandal Hybrid Racing Powertrain Assembly
Design, Synthesis, Manufacturing, and Testing of a Competitive FHSAE Vehicle 17
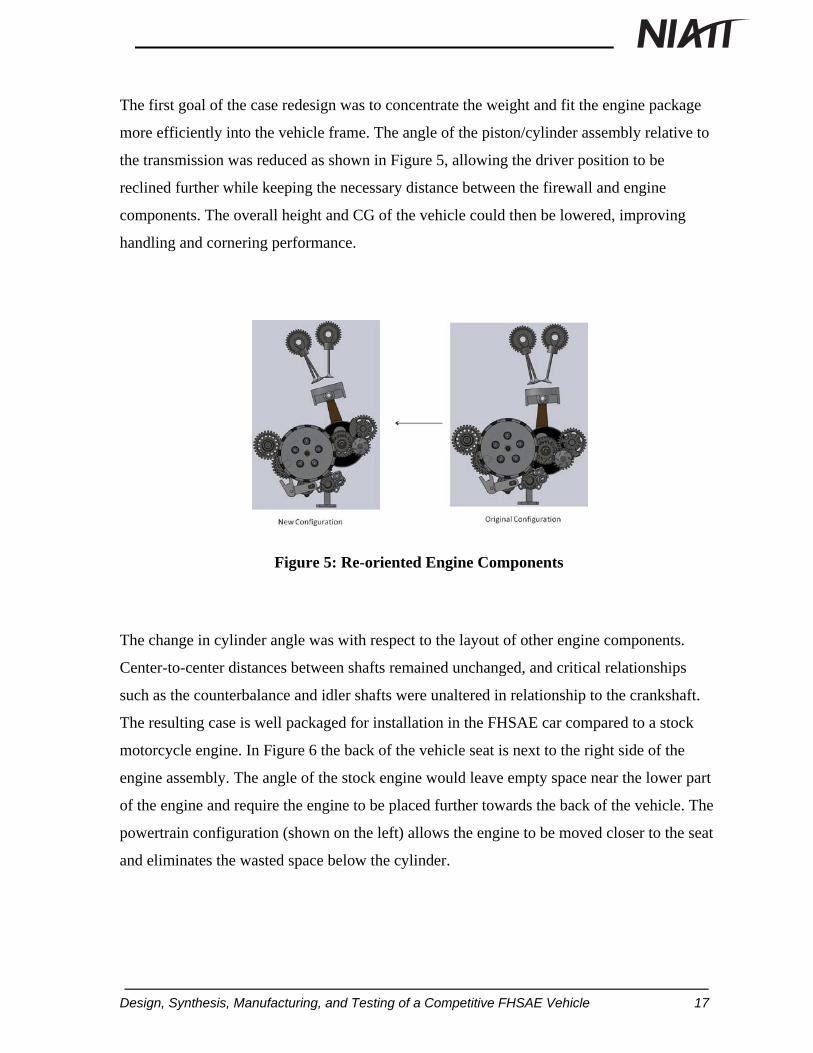
The first goal of the case redesign was to concentrate the weight and fit the engine package
more efficiently into the vehicle frame. The angle of the piston/cylinder assembly relative to
the transmission was reduced as shown in Figure 5, allowing the driver position to be
reclined further while keeping the necessary distance between the firewall and engine
components. The overall height and CG of the vehicle could then be lowered, improving
handling and cornering performance.
Figure 5: Re-oriented Engine Components
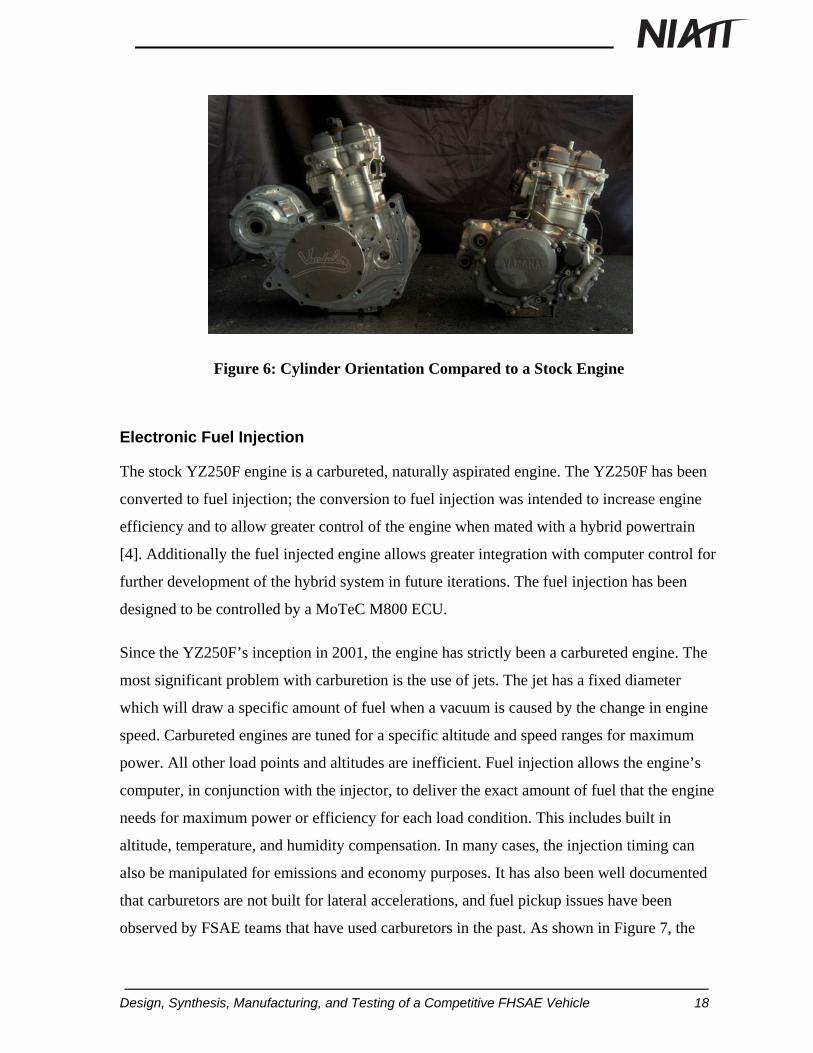
The change in cylinder angle was with respect to the layout of other engine components.
Center-to-center distances between shafts remained unchanged, and critical relationships
such as the counterbalance and idler shafts were unaltered in relationship to the crankshaft.
The resulting case is well packaged for installation in the FHSAE car compared to a stock
motorcycle engine. In Figure 6 the back of the vehicle seat is next to the right side of the
engine assembly. The angle of the stock engine would leave empty space near the lower part
of the engine and require the engine to be placed further towards the back of the vehicle. The
powertrain configuration (shown on the left) allows the engine to be moved closer to the seat
and eliminates the wasted space below the cylinder.
Design, Synthesis, Manufacturing, and Testing of a Competitive FHSAE Vehicle 18
Figure 6: Cylinder Orientation Compared to a Stock Engine
Electronic Fuel Injection
The stock YZ250F engine is a carbureted, naturally aspirated engine. The YZ250F has been
converted to fuel injection; the conversion to fuel injection was intended to increase engine
efficiency and to allow greater control of the engine when mated with a hybrid powertrain
[4]. Additionally the fuel injected engine allows greater integration with computer control for
further development of the hybrid system in future iterations. The fuel injection has been
designed to be controlled by a MoTeC M800 ECU.
Since the YZ250F’s inception in 2001, the engine has strictly been a carbureted engine. The
most significant problem with carburetion is the use of jets. The jet has a fixed diameter
which will draw a specific amount of fuel when a vacuum is caused by the change in engine
speed. Carbureted engines are tuned for a specific altitude and speed ranges for maximum
power. All other load points and altitudes are inefficient. Fuel injection allows the engine’s
computer, in conjunction with the injector, to deliver the exact amount of fuel that the engine
needs for maximum power or efficiency for each load condition. This includes built in
altitude, temperature, and humidity compensation. In many cases, the injection timing can
also be manipulated for emissions and economy purposes. It has also been well documented
that carburetors are not built for lateral accelerations, and fuel pickup issues have been
observed by FSAE teams that have used carburetors in the past. As shown in Figure 7, the

Design, Synthesis, Manufacturing, and Testing of a Competitive FHSAE Vehicle 19
design team decided to fuel inject the 2005 Yamaha YZ250F with the use of the Motec M800
standalone ECU. Motec is the world’s leader in motorsports application ECU’s. The M800 is
the most versatile and technologically advanced ECU available to consumers and will
provide the Formula Hybrid team with the best opportunity of success.
Figure 7: Engine Control System
Motec
M800
O2 Sensor
MAP
TPS
YZ250F
Computer with
Motec Tuning
Software
Throttle Position
Driver Torque Request
Vehicle Wheel Speed Sensors
Ignition Coil
Fuel Injector
Ambient Air Temperature
Race/Road Conditions
Crank Position Sensor
Camshaft Position Sensor
Electric Motor Controller

Design, Synthesis, Manufacturing, and Testing of a Competitive FHSAE Vehicle 20
Engine Repackaging
The custom-built case design will accommodate components within and attach the drivetrain
in a way that could not be packaged with the original case. The case can also be designed to
act as a load transferring member between the suspension and frame of the vehicle. The new
case shown in Figure 8 also allows better placement where the center of gravity (CG) will be
located, allowing the benefit of keeping it low and next to the driver’s CG. Along with the
CG, there is the advantage of being able to lean the motor back 32° in such a way that the
driver will be able to sit lower, resulting in a shorter car.
Figure 8: Engine Repackage with an Electric Motor
Suspension and Steering
Because this prototype race car is being developed for the amateur autocross racer,
predictability in the handling of the vehicle is of utmost importance. The design will use
suspension parameters in Figure 9 that are conservative and adjustable.

Design, Synthesis, Manufacturing, and Testing of a Competitive FHSAE Vehicle 21
Figure 9: Suspension Parameters
The packaging of the front suspension was the first step in the suspension design. Target
values for each of the parameters seen in Figure 9 had to be determined to give a guideline
for the packaging. The target values selected are displayed in Table 8 and an explanation of
why the values were selected follows.
Table 8: Front Outboard Suspension Packaging Targets
The kingpin angle, spindle length, and scrub radius were determined by first placing the
lower ball joint into the wheel as far and low as possible [9]. The issues of the kingpin angle,
scrub radius, and spindle length are interrelated. The larger the kingpin angle and spindle
length, the greater the lift in the front during steering. The raising of the front end aids in the
centering of the steering, and the greater the kingpin angle, the more positive camber is
gained in turns. The more spindle length, the more kickback in the steering as the wheel rolls
over bumpy terrain. Scrub radius adds feel of the road and reduces static steering effort, and
Kingpin Inclination 0⁰ - 3⁰
Scrub Radius -
Mechanical Trail .3 in
Caster 3⁰- 5⁰

Design, Synthesis, Manufacturing, and Testing of a Competitive FHSAE Vehicle 22
many race cars operate within acceptable tolerance with large amounts of scrub. Scrub radius
is not as big of a concern as it is on four wheel drive vehicles.
For packaging reasons, on the 2011-2012 FSAE, the rack is mounted low and rearward of the
wheel centerline. This is not the optimal position for the tie rod location based on the above
statement but this was done for packaging purposes. Although, other than the toe-in over-
steer, the team has not found any evidence as to why the tie rod could not be placed in this
location. Future testing and analysis will determine if this tie rod location is acceptable.
After packaging the outer suspension, attention was focused on inboard suspension
packaging. Selected targets are shown in Table 9. Because suspension design is an iterative
process and built upon compromise, target values had to be determined to give the process a
focus.
Table 9: Front Inboard Suspension Packaging Targets
The unequal length between the upper and lower a-arm was selected to reduce the change in
track (associated equal length a-arms) that causes the car to dart when running on rough
surfaces. The non-parallel a-arm design was chosen to dial in the roll centers to the target
location and target the camber gain. This design also reduces part of the weight transfer in
cornering [9].
The swing arm length is the distance from the chassis centerline to the instant center (the
point of intersection of upper and lower a-arms if they were extended infinitely).
Determining a desired swing arm length requires compromise. The length of 100 to 150
inches was chosen for the compromise between a short and ultra-long design. The advantages
of this length include low roll centers, minimal scrub (track variation), and only small camber
Swing Arm Length 100 - 150 in
Roll Center -1 – 2 in
Camber Gain .5 - 1 deg/in
Track 50 in
Ackermann Adjustable
Design, Synthesis, Manufacturing, and Testing of a Competitive FHSAE Vehicle 23
change going into bump and droop. It also produces a braking grip advantage over shorter
swing arm lengths. The disadvantages include less control over roll center sideways
migration and positive camber gain. This swing arm length is obtained by instigating a non-
parallel design of the a-arms.
The roll center is the theoretical point at which the body will roll. High roll centers offer a
smaller chassis roll moment, while low roll centers have larger rolling moments which must
be resisted by the springs. If the roll center is above ground, the force generated by the lateral
force on the tire and the instantaneous center causes the wheel to move down and the sprung
mass to move up. This is called Jacking. On the other hand, if the roll center is located below
ground, the sprung mass will be forced down. The target value of –1 to 2 inches was selected
to minimize jacking while at the same time keeping low rolling angles.
With the selection of an unequal length a-arm design, the car gets negative camber gain in
jounce and roll. The amount of gain is dependent upon the ratio of length between the upper
and lower a-arm. A certain amount of negative camber gain is advantageous in cornering, as
it counters the positive induced camber due to tire deformation and kingpin inclination. The
desired amount of camber gain is prompted by the tire used, inflation, lateral loads, and other
contributing suspension geometries. A target of .5 - 1 deg/in was selected by consulting with
experienced drivers and has been validated with computer simulation.
Wide tracks offer a vehicle that is more sensitive and responsive on a tight course, but more
twitchy in the straight line. Also, with wider tracks there is less weight transfer to the laden
wheel in cornering [9]. Given that the car is being manufactured for the autocross circuit, a
wider car is more reasonable. The team selected a 50 in front track based on the performance
of the best UI car and the top ten competitors cars.
Any bumpsteer greater than 0.1 deg through full suspension travel will produce a wandering
effect in the front end of the car over a bumpy track. The tie rods must be placed in a
geometry that eliminates this effect. After the hard points are decided upon, the tie rod joint
can be determined.

Design, Synthesis, Manufacturing, and Testing of a Competitive FHSAE Vehicle 24
The rear suspension targets are less of a concern than the front because the rear uprights are
fixed. Selected values are summarized in Table 10. The most important concern with the rear
setup is the adjustability of toe. Toe adjustments will counter the effects of slip angles in tight
corners and add to the effective tractive effort of the tires.
Table 10: Rear Inboard Suspension Packaging Targets
Swing arm lengths on the rear are considerably shorter than on the front because of the
effects of caster steer in the front. Positive caster adds to negative camber gain in steer. The
shorter swing arm lengths induce a greater camber gain to match that of the front.
Although caster, trail, and kingpin values apply only to wheels that can be steered, the plane
passing through the three outboard pivot points should pass through the center of the contact
patch to make the toe stiffness high. This minimizes the moment arm and reduces
acceleration and braking forces acting through the suspension. The rear roll centers should be
in the same range as the front roll centers for the same reasons. The rear roll centers should
be higher than the front roll centers to exaggerate the weight transfer across the rear tires and
help to reduce understeer.
The suspension hard points were determined based on accepted target values, computer
simulation, and rule and geometric constraints. Again, the goal is to produce a car that has
predictable handling characteristics and maintains maximum grip on the track at all times.
The race tire is arguably the most important part of the suspension. Selecting the appropriate
tire and designing the suspension to maximize the effectiveness of that tire is the key to a
winning vehicle. The team selected the Hoosier 6x13x20.5 race slick for the competition tire.
The Hoosier compound has the highest friction coefficient at the lowest loads compared with
Goodyear and Avon. During cornering experiments, the Hoosier had the most predictable
Swing Arm Length 80 - 100 in
Roll Center -1 – 2 in
Camber Gain 1 – 1.5 deg/in
Track 48 in
Design, Synthesis, Manufacturing, and Testing of a Competitive FHSAE Vehicle 25
reactions to longitudinal forces and had a higher peak cornering stiffness than Goodyear.
These characteristics make the Hoosier desirable over the others.
The selection of a tire prompted the need for a design that maximizes the ability of the tire.
Hoosier tires perform the best at small negative camber angles. During computer simulations
using WinGeo, the hard points were adjusted to leave a camber of -.5 degrees in a 1.3 g hair-
pin turn. This should give maximum grip from the tires on the tightest expected turns.
Uprights
The design process began by researching the upright designs used on other FSAE formula
cars, formula one cars, passenger cars, ATVs, and other similar vehicles. Formula FSAE
uprights are of two basic types: one is machined out of a single piece of bulk material,
generally aluminum, and the second is welded out of sheet metal, generally steel. As part of
the conceptual design process, the team designed an upright of each type.
Each of these designs was evaluated using the finite elemental analysis capabilities of Catia.
Using the previous year’s upright as a standard, it was determined that the aluminum upright
did not provide sufficient torsional rigidity. This was consistent with the experience past
University of Idaho teams have had when using aluminum uprights, so the team decided to
continue with a sheet steel design.
Improving upon the previous year’s sheet steel design proved to be very challenging. At this
point, it was clear that changing design would be a good time to consider other modifications
like possibly finding lighter, lower resistance bearings.
Tyler Thornton at Timken Bearing helped find bearings that are half the weight of the
bearings on last year’s formula car and have 50 percent less friction and heat loss than the old
bearings. In order to be able to use these bearings, the bearing housing bore on the uprights
needed to be reduced. The bore reduction was performed on the solid mode of the old front
upright, and an FEA analysis was performed to determine the effects of the change. In this
model, the safety factor dropped from 1.92 to 1.78.
Design, Synthesis, Manufacturing, and Testing of a Competitive FHSAE Vehicle 26
In one of the other conceptual design upright models, the change in bore diameter reduced
the safety factor from 2.30 to 2.28. In both cases, the reduction in safety factor is reasonable,
so there is no problem creating uprights that will work with the desired bearing changes.
Along with the changes to the uprights, changes to the hubs were also successfully made to
fit the new bearings without compromising strength and rigidity. Future work in the fall will
include a complete analysis of the upright and hub assembly to optimize strength and rigidity
while minimizing weight.
Inboard Suspension Components
With the geometry of the suspension chosen and the uprights designed, the team began to
design the inboard components of the suspension, such as bell cranks and pull rods. In order
to find the geometry of the bell crank, the team first had to determine whether to use a push
or pull rod configuration. Ultimately the decision was to use a pull rod configuration due to
the packaging and weight reduction. Using pull rods allowed the use of shorter attachments
to the inboard springs as well as the ability to package the majority of the suspension weight
closer to the roll center of the car. Since pull rods will almost always be in tension, the
diameter and wall thickness of the pull rod was greatly reduced because buckling was no
longer an issue.
The team then set up a solid works model with the a-arms, pull rod, bell crank, and points of
attachments for the shock. The model allowed the adjustment of the length of the pull rod
and each side of the bell crank. Using this model, the team took the suspension through a
range of motions and calculated the wheel rates at every 1/2 inch. It was assumed that the
suspension was using a spring rate of 170 lb/in. Figure 10 shows the results of this analysis.
The horizontal lines are the forces of the car when braking and cornering 1.6 G.

Design, Synthesis, Manufacturing, and Testing of a Competitive FHSAE Vehicle 27
Figure 10: Wheel Rate vs. Vertical Travel
Only two styles of bell cranks were considered—the typical triangular shape used on
previous cars and the L-shape. The triangular shape was chosen because it allowed the team
to minimize the weight and maximize strength of the bell crank under full loading of the
suspension. The identical bell crank configuration and packaging on the front and rear of the
car provided ideal packaging and ease of manufacturing. This required the car to use 175
lb/in springs in the front and 225 lb/in springs in the rear. The bell cranks used for suspension
in the FHSAE car utilize an adjustment capability on the shock side of the bell crank and the
pull rod side of the bell crank as well as placement for the torsion anti-roll bar in the front
and rear of the car. Figure 11 is a view of the bell crank. The bell cranks are positioned so
that the frame member of the vehicle passes between them for better packaging. This also
0
100
200
300
400
500
600
700
800
0 0.5 1 1.5 2 2.5
Wheel R
ate (lb/in)
Vertical Tire Travel (in)
Wheel Rate VS. Vertical Travel
PR‐3",SP‐3"
PR‐2.5",SP‐3"
PR‐2.5",SP‐3.5"
PR‐3",SP‐3.5"
PR‐3",SP‐4"
PR‐2.5",SP‐4"
PR‐2.5" , SP‐3.75"
PR‐2.5", SP‐3.25"
PR‐2.5",SP‐3.85
PR‐2.5",SP‐3.95"
Combined corneringand brakingCornering
Braking

Design, Synthesis, Manufacturing, and Testing of a Competitive FHSAE Vehicle 28
allows the bell cranks to be attached in double shear. The two halves are held together using
two 1/4 inch bolts also attaching the anti-roll and pull rod as well as a 3/8 inch bolt attaching
the spring and a 1/2 inch bolt fixing the bell crank to the frame.
Figure 11: Bell Crank Design for Pull Rod Suspension
Sensors and Controls
Seven microcontroller development boards were used to create a distributed control and data
acquisition network. Each of the microcontrollers performs one of the following tasks:
1. Electric motor control (EMC)
2. Data acquisition
3. Battery management system interface (BMSI)
4. Data storage
5. User Interface
The EMC microcontroller reads driver input from the throttle, brake, and shift buttons. The
driver input data is used with vehicle speed, ICE rpm, and electric motor rpm to calculate the
desired torque command for the electric motor. Two microcontrollers are dedicated to data
Design, Synthesis, Manufacturing, and Testing of a Competitive FHSAE Vehicle 29
acquisition. The first data acquisition microcontroller focuses on obtaining data from sensors
located in the front of the vehicle, while the second data acquisition microcontroller focuses
on obtaining data from sensors located in the rear of the vehicle. Another two
microcontrollers are dedicated to retrieving data from the Battery Management Boards
(BMS). These microcontrollers parse serial communication data from the BMS to obtain
battery cell voltages and temperatures. One microcontroller is dedicated to the user interface.
The user interface microcontroller interfaces with the mode selection button, diagnostics
keypad, and LCD display. Each of the six microcontrollers mentioned above broadcast their
data onto the CAN bus. The last microcontroller reads all of the signals from the CAN bus
and stores them onto an SD card.
The communication network allows for distributed control, distributed data storage, and
distributed sensor interface on the hybrid electric vehicle (HEV), all packaged in one location
for protection and easy access. A single “low voltage box” (LVB) was constructed to be
packaged underneath the driver to house the microcontroller network. The LVB layout is in
Figure 12.

Design, Synthesis, Manufacturing, and Testing of a Competitive FHSAE Vehicle 30
Figure 12: Low Voltage Box Layout and Circuitry
Creating distributed functionality allows for time critical operations, such as motor control, to
operate at a higher frequency and not be interrupted by lower priority tasks. The distributed
approach also allows for a modular design in which components can easily be added or
removed from the sensor network. The communication network is comprised of four main
communication protocols: controller area network (CAN), serial peripheral interface (SPI),
inter-integrated circuit (I2C), also known as two-wire interface (TWI), and serial.
The microcontrollers can operate in six distinct modes: endurance, autocross, electric drag,
hybrid drag, test, and data retrieval. Each driving mode is catered for best performance in its
respective event. The modes vary by setting different limits for electric motor operation as
well as displaying different sets of information to the driver via the LCD. Test mode verifies
the communication between microcontrollers and the sensors, and displays the results on the

Design, Synthesis, Manufacturing, and Testing of a Competitive FHSAE Vehicle 31
LCD. Data retrieval mode allows the team to connect a computer to the vehicle to read the
stored sensor data from the last race.
The microcontrollers utilize three different types of sensors: Hall Effect sensors,
accelerometers, and potentiometers. A Hall Effect gear tooth sensor was mounted on each
wheel to monitor the speed of the vehicle and the rpm of each wheel. An accelerometer was
attached to the chassis next to each wheel to monitor the acceleration and dynamic
performance. The throttle body sensor reads the output voltage of the potentiometer attached
to the throttle. Along with those sensors, the microcontrollers interface with numerous
peripheral devices to obtain data. The peripheral devices include the Kelly Controller,
Battery Management System, a real-time clock, and the Motec M800. The data acquired by
these sensors are used in the real-time control of the vehicle and in the post-race data
analysis. A layout of the sensors on the vehicle is in Figure 13.
A key aspect of the design and implementation of the distributed control network was to
create a modular system that allows for easy debugging, quick swapping of components,
simple assembly, and testing of components on and off the vehicle [7]. To meet these goals,
the electronics are housed in easily accessible plastic containers that are interconnected using
quick disconnects. This allows for the entire system to be installed on the car in less than 5
minutes.

Design, Synthesis, Manufacturing, and Testing of a Competitive FHSAE Vehicle 32
Figure 13: Sensor and Controller Network
Data Collection
After the HERC has completed a race, the race performance data can be obtained from the
on-board SD card. The data can be acquired by taking the SD cards out of the low-voltage
box and inserting it into a computer or by initiating a data transfer via HyperTerminal to a
laptop and saving the session. Both methods of data extraction yield a text file that contains
the organized data.

Design, Synthesis, Manufacturing, and Testing of a Competitive FHSAE Vehicle 33
The desired data can be plotted versus time to analyze the performance of the HERC and
how it was driven throughout the entire race. The maximum and minimum values are also
easily obtained using the maximum and minimum functions on the desired column of data.
The error rate obtained is small, at about 17 errors per 2000 data points, or 0.85%. A much
cleaner graph is produced by removing most of the errors. A comparison between the
erroneous data and the data with the errors removed is in Figure 14.
Figure 14: Endurance Wheel Velocity Data
Along with wheel speed, 71 different sensor and signal data values are stored and available
for analysis.
Ergonomics
Braking System
The brake system provides a rising rate mechanical advantage (MA) throughout the entire
pedal stroke. This ranges from a low MA of 3 at the beginning of the stroke and to a final
MA of 7 at the end of the stroke. The initial low MA, at stroke initiation, results in quick pad

Design, Synthesis, Manufacturing, and Testing of a Competitive FHSAE Vehicle 34
take up. The linkage lengths were optimized using SAM 6.1 kinematics software. The master
cylinders were packaged below the pedal box platform, allowing for a significant decrease in
frame length. The brake pedal was designed to minimize flexure and weight using finite
element analysis. It has a safety factor of 2.1 and maximum deflection of 0.034", under the
mandatory 2000N driver input load. The brake system features both a mechanical bias bar as
well as residual pressure valves.
Shifting
To eliminate the need to engage a clutch manually through hand movements, the car features
a push button shifter. Because of its reliability and speed, a Pingel Electric Shifter was
selected. With this arrangement the driver is able to pay more attention to the course. Also,
the time that engine power is supplied to the rear tires during acceleration is increased.
Steering
The steering system is designed to achieve an 80% Ackerman in order to reduce corner entry
understeer and tire wear. Bump steer is minimized by placing the tie rods on a line to the
suspension instant center. A 0.22 inch scrub radius was chosen to minimize driver effort
throughout a 180 degree motion from lock to lock. The custom aluminum rack and housing
withstand a worst-case loading of 90 lbs.
Design, Synthesis, Manufacturing, and Testing of a Competitive FHSAE Vehicle 35
FINDINGS; CONCLUSIONS; RECOMMENDATIONS
Road Load Model
At this time, the road load model is a functional model that will be continually updated and
revised to improve the usefulness as well as the accuracy of the resulting data. Many of the
values used in the calculations have been assumptions based upon previous FSAE
knowledge. Initially these assumptions were placeholders to help the development of the
model and to verify proper operation. As the model evolves, the values that were assumed or
estimated are constantly being measured and updated. Known values are then added to
improve the accuracy and prediction capabilities of the results, as well as to provide a
verification of model precision. As the values used in model computation are updated, the
program itself will also be updated and expanded to include vehicle parameters and
assumptions derived from additional testing as well as energy consumption forecasts that
involve power electronics and batteries. Currently vehicle acceleration and autocross event
performance is predicted to within 5% of actual performance.
These performance calculations can then be used to predict event points at the competition,
ultimately providing a value to maximize for vehicle and powertrain design optimization.
This optimization aids in energy allocation and battery selection for the powertrain design
and was the primary component for changing the hybrid powertrain architecture to a post-
transmission layout. The predicted overall competition performance was increased by 21%
from the pre-transmission layout with everything being equal. Additionally the road load
model is currently being revised to implement a Graphic User Interface (GUI). This will
allow new users to easily edit the model and make higher level design dictions without
extensive knowledge of the program as well as increase the efforts to pass current team
knowledge on to younger team members.
Energy Management
In order to improve the model and to optimize future vehicles, a series of sensors and data
logging equipment has been mounted on the 2012 vehicle. Information such as speed,
position, memory, energy consumption, and torque will be stored with timestamps by a
microprocessor. Besides the sensory equipment and related hardware, a display will be

Design, Synthesis, Manufacturing, and Testing of a Competitive FHSAE Vehicle 36
incorporated to inform the driver of the current linear speed of the vehicle, the amount of
gasoline still available in the gas tank, and the approximate state of charge of the batteries.
A CALB eight cell pack was charged with PowerLab 8 battery charger. The charging process
continued for approximately three hours. About 28Ah was transferred into the cells.
Figure 15: Battery Charging Curve
Vehicle Integration
The following table includes the major components and design types selected for the UI
Hybrid FSAE vehicle. The vehicle design is based upon standard rear wheel drive with front
steering. Fabrication is underway and the latest state of subsystem evolution can be seen on
the capstone design website: http://seniordesign.engr.uidaho.edu/2010-2011/hybridformula/.

Design, Synthesis, Manufacturing, and Testing of a Competitive FHSAE Vehicle 37
Competition Overview
Figure 16: Competition Vehicle Preparing for Race
University of Idaho gets ready to run the autocross at the 6th Annual Formula Hybrid
Competition (Figure 16).
Although the University of Idaho #42 car did not do as well as we had hoped, we still
managed to finish in the top ten. A lot was learned and a lot was taken away from what
was accomplished. The judges loved the car design, and gave the team some insight for
future designs. The UI car managed to produce an extremely fast lap during the endurance
event and had the fastest average lap time out of all the competing vehicles that ran the
endurance, proving that the UI has a very, very competitive vehicle. Out of 39 teams that
signed up, 24 actually showed up, and 14 finally passed all the technical inspections and got
a chance to run. Out of those teams, only one was a rookie team: the University of Idaho. The
final scores have been posted and UI placed 8th, the highest ranking rookie team of the year.

Design, Synthesis, Manufacturing, and Testing of a Competitive FHSAE Vehicle 38
Figure 17: 2012 Formula Hybrid Score Sheet

Design, Synthesis, Manufacturing, and Testing of a Competitive FHSAE Vehicle 39
Design Infrastructure for Next Generation Vehicles
A program is under development that combines the evolutionary design capabilities of ESOP
(Evolutionary Structural Optimization Program) with the geometric analysis functions of
WinGeo, developed by Bill Mitchell. This new program, VSOP (Vehicle Suspension
Optimization Program), optimizes the node locations of a double a-arm suspension system to
give the best fit to a set of desired suspension characteristics. Desired values of camber, roll
center height, roll center width, caster, and VSAL (virtual swing arm length) are input by the
user, as are constant parameters such as wheelbase and track length. The program then finds
the suspension configuration that comes closest to satisfying all parameters. Because
suspension parameters often offer conflicting performance curves, a Pareto surface is
developed, over which the global optimum, or Pareto point, is located. This optimum is then
output as the program reaches convergence. This program is being used along with Msc.
Adams/car dynamic simulation software to ensure that the FHSAE vehicle exhibits superior
suspension performance for given track specifications.
To create a complete, stable, and functional assembly model of the FHSAE vehicle, it is
necessary to use a high-end modeling tool such as CATIA. Crafting machine elements such
as fully-involute gears in the 3D modeling environment is a very difficult task because there
are many parameters and geometrical constructions involved that are unique to gear
manufacturing. Unfortunately, there is currently no software package available that can take
standardized gear parameters as inputs and have CATIA make an accurate model. Such an
application is under development using Visual Basic 6. Five different gear models will be
supported by this effort: spur, helical, bevel, worm, and internal. A CATIA-produced macro
that contains all of the information necessary to develop the specific gear has been created
and is currently being manipulated to fit into the Visual Basic scripting language. Finally, a
graphical user interface is being made to allow end-users to input their available parameters
and the software will ascertain whether or not sufficient information exists to make the part
in CATIA. Provided there are no input errors, the program communicates with CATIA and
executes the macro, creating the true-to-life part that can then be used in assembly modeling,
simulation, and manufacturing.

Design, Synthesis, Manufacturing, and Testing of a Competitive FHSAE Vehicle 40
REFERENCES
[1] Thayer School of Engineering at Dartmouth. 2012 Formula Hybrid Rules. Hanover, NH: Trustees of Dartmouth College, 2012. [2] Butsick, Brandon. Design of a Hybrid Drivetrain for FSAE Hybrid. Moscow: University of Idaho, 2011. [3] Flowers, Tyler. Moscow: Inertia Balancing of Single Cylinder Engines for Hybrid Vehicle Application. University of Idaho, 2012. [4] Storms, Randall. Fuel Injection and Intake/Exhaust Sizing of a YZ250F Engine for a Formula Hybrid Vehicle. University of Idaho, 2010. [5] Wos, Sam. Highly Integrated Parallel Hybrid Powertrain. Warrendale: SAE International, 2012. [6] Bashford, Brett. Electric Propulsion Subsystem for a Parallel-Drive Formula Hybrid Vehicle. University of Idaho, 2012. [7] Ulrich, Josh W. Real-time Optimized Performance Control of a Formula Society of Automotive Engineers Hybrid Vehicle. University of Idaho, 2012. [8] Yamaha Motor Corporation. YZ250F Specs. [Online] http://www.yamaha-motor.com/sport/products/modelspecs/12/0/specs.aspx. [9] Milliken, William F.; Milliken, Douglas L. Race Car Vehicle Dynamics. Warrendale: SAE International, 1995. ISBN 1-56091-526-9.

Design, Synthesis, Manufacturing, and Testing of a Competitive FHSAE Vehicle 41
APPENDIX A:
2012 UI Formula Hybrid Vehicle Overview
Chassis Welded Steel Frame
Suspension Fully independent unequal length A-Arm
Steering Rack and pinion
Body Carbon fiber composite
Tires Hoosier racing
Wheels Aluminum rim with aluminum centers
Brakes Brembo calipers and custom steel rotors
Gasoline Engine Yamaha YZ250F
Starting system Yamaha WR250F starter assembly
Fuel delivery Throttle body fuel injection
Peak power output 33 hp @ 12000 rpm
Peak torque 18 ft-lb @ 9000 rpm
Transmission 4 speed constant mesh w/electronic shifting
Clutch Rekluse Motorsports Z-Start Pro
Gearing Stock WR250F gear ratios
Final drive Planetary driven torsen differential
Electric Motor Lynch LEM200-135 RAG
Peak power output 46 hp
Peak torque 61 ft-lb
Continuous torque 29 ft-lb
Motor controller Kelly KDH09401A
Electrical System Parallel hybrid configuration
Batteries Impact
Nominal voltage 52 Volts
Maximum current 400 Amps
Capacity 40 Amp-hours