design rules for solution-processable n-type organic...
TRANSCRIPT

Design Rules for Solution-Processable n-type Organic Thermoelectric
Materials
By
Boris Russ
A dissertation submitted in partial satisfaction of the
requirements for the degree of
Doctor of Philosophy
in
Chemical Engineering
in the
Graduate Division
of the
University of California, Berkeley
Committee in charge:
Professor Rachel A. Segalman, Co-Chair
Professor Nitash P. Balsara, Co-Chair
Professor Bryan D. McCloskey
Professor Andrew Minor
Summer 2015

Design Rules for Solution-Processable n-type Organic Thermoelectric Materials
© 2015
by Boris Russ

1
Abstract
Design Rules for Solution-Processable n-type Organic Thermoelectric Materials
by
Boris Russ
Doctor of Philosophy in Chemical Engineering
University of California, Berkeley
Professor Rachel A. Segalman, Co-Chair
Professor Nitash P. Balsara, Co-Chair
Thermoelectrics can convert thermal energy directly into electrical energy or, alternatively,
induce solid-state heating or cooling under electrical bias. As a result, these devices hold potential
contributions in waste heat recovery and thermal management applications. Due to high material
and processing costs, the applications of traditional bulk thermoelectrics, which have been around
for over half a century, have been constrained to niche markets. Organic materials are becoming
an appealing option for thermoelectrics with molecular design of such materials enabling tunability
of electronic transport. Building efficient thermoelectric architectures requires complementary p-
type (hole transporting) and n-type (electron transporting) components. While several high
performance hole-transporting organic systems have been developed, a scarcity of stable n-type
doping strategies compatible with facile processing has been a major impediment to the
advancement of n-type organic electronics, and thermoelectric studies of organic n-type systems
are scarce.
To develop design rules for improved n-type organic materials, we have used the perylene
diimide (PDI) core as an n-type organic model system. The PDI core is air-stable and amenable to
synthetic modification, thereby facilitating tunability of both molecular structure and electronic
properties. Use of trimethylammonium functionalization with hydroxide counterions, tethered to
the core by alkyl spacers, enables both water solubility and self-doping in PDI variants. By
complementing thermoelectric characterization of these variants with insight on the electronic and
structural property changes from optical spectroscopy, magnetic resonance studies, and X-ray
chemical and structural characterization techniques, we show that a chemical transformation in the
charged end groups upon thin film drying is critical to the underlying mechanism that enables
charge carrier generation in these self-doping materials in the solid-state. Doping using tethered
functionality is highly generalizable to other n-type small molecule systems of interest, including
naphthalene diimides, diketopyrrolopyrroles, and PCBM. Structural modifications of the side
chains can also be used to improve thin film thermoelectric properties. We show that changing the
length of the alkyl spacer between the charged end groups and the PDI core dramatically increases
electrical properties through a morphology-induced enhancement in the thin film effective electron
mobility. The top derivatives in our study demonstrated the highest power factors reported for
solution-processed films of n-type small molecules. We also show that broader system tunability

2
and an enhancement in performance can be achieved through counteranion-mediated dopant
activation and by complementing the inherent solid-state self-doping of these materials with
chemical doping in solution.
The findings in this dissertation help shape promising molecular design strategies for future
enhancements in the thermoelectric performance of n-type materials. Furthermore, the potential
for coupling these n-type system advances with complementary p-type organic materials brings
the development of fully solution-processable organic thermoelectric modules and their integration
into applications, currently inaccessible by traditional, rigid inorganics, closer to reality.

i
Dedication
To the loving memories of my father, Alexander, and my paternal grandmother, Esther.
To my mother, Natalie, my brother, Paul, and my maternal grandparents, Mikhail and Galina.
and
To the mentors and friends throughout my life who helped guide me here.

ii
Table of Contents
LIST OF FIGURES ................................................................................................................. iv
ACKNOWLEDGEMENTS .......................................................................................................x
CHAPTER 1. INTRODUCTION ........................................................................................1 1.1 Fundamentals of thermoelectric materials ....................................................................1
1.1.1 Attractive thermal conductivity of organic materials .........................................4
1.1.2 The Power Factor: fundamentals of S and σ ......................................................5 1.1.3 Scattering effects enable opportunities to decouple S and σ ..............................8
1.2 Fundamentals of Organic Electronic Materials ............................................................8
1.2.1 Charge transport in organic systems .............................................................9 1.2.2 Generating charge carriers in organic systems ...........................................10
1.3 Fundamentals of Module Design ................................................................................11
1.3.1 Inspirations and opportunities with organics for module design ......................14 1.4 Outline and summary of core dissertation chapters ....................................................16
CHAPTER 2. POWER FACTOR ENHANCEMENT IN SOLUTION-PROCESSED
ORGANIC N-TYPE THERMOELECTRICS THROUGH MOLECULAR DESIGN ...........18 2.1 Introduction .................................................................................................................18
2.2 Results and Discussion ...............................................................................................20 2.3 Conclusions.................................................................................................................25
2.4 Experimental ...............................................................................................................25 2.5 Acknowledgements .....................................................................................................26 2.6 Appendix: Supporting experimental information .......................................................27
CHAPTER 3. TETHERED TERTIARY AMINES AS SOLID-STATE N-TYPE DOPANTS
FOR SOLUTION-PROCESSABLE ORGANIC SEMICONDUCTORS ...............................32
3.1 Introduction .................................................................................................................32 3.2 Results and Discussion ...............................................................................................35
3.3 Conclusions.................................................................................................................40 3.4 Acknowledgements .....................................................................................................41 3.5 Appendix: Supporting experimental information .......................................................41
3.5.1 Materials and Methods .....................................................................................41 3.5.2 Synthesis ...........................................................................................................44 3.5.3 Figures and Tables ............................................................................................51
CHAPTER 4. MODULATION OF N-TYPE ELECTRICAL TRANSPORT PROPERTIES
IN SOLUTION-PROCESSED ORGANIC THIN FILMS VIA TUNABLE COUNTERION
MEDIATED DOPANT ACTIVATION ..................................................................................60 4.1 Introduction .................................................................................................................60 4.2 Results and Discussion ...............................................................................................62 4.3 Conclusions.................................................................................................................66
4.4 Acknowledgements .....................................................................................................66 4.5 Appendix: Supporting experimental information .......................................................67

iii
CHAPTER 5. ENHANCED THERMOELECTRIC POWER FACTOR IN N-TYPE
ORGANIC SEMICONDUCTOR THIN FILMS BY COMBINING EXTRINSIC AND SELF-
DOPING STRATEGIES .........................................................................................................68 5.1 Introduction .................................................................................................................68
5.2 Results and Discussion ...............................................................................................70 5.3 Conclusions.................................................................................................................73 5.4 Experimental ...............................................................................................................73 5.4 Acknowledgements .....................................................................................................75
CHAPTER 6. CONCLUSIONS AND FUTURE OUTLOOK ..........................................76
CHAPTER 7. REFERENCES ...........................................................................................78

iv
List of Figures
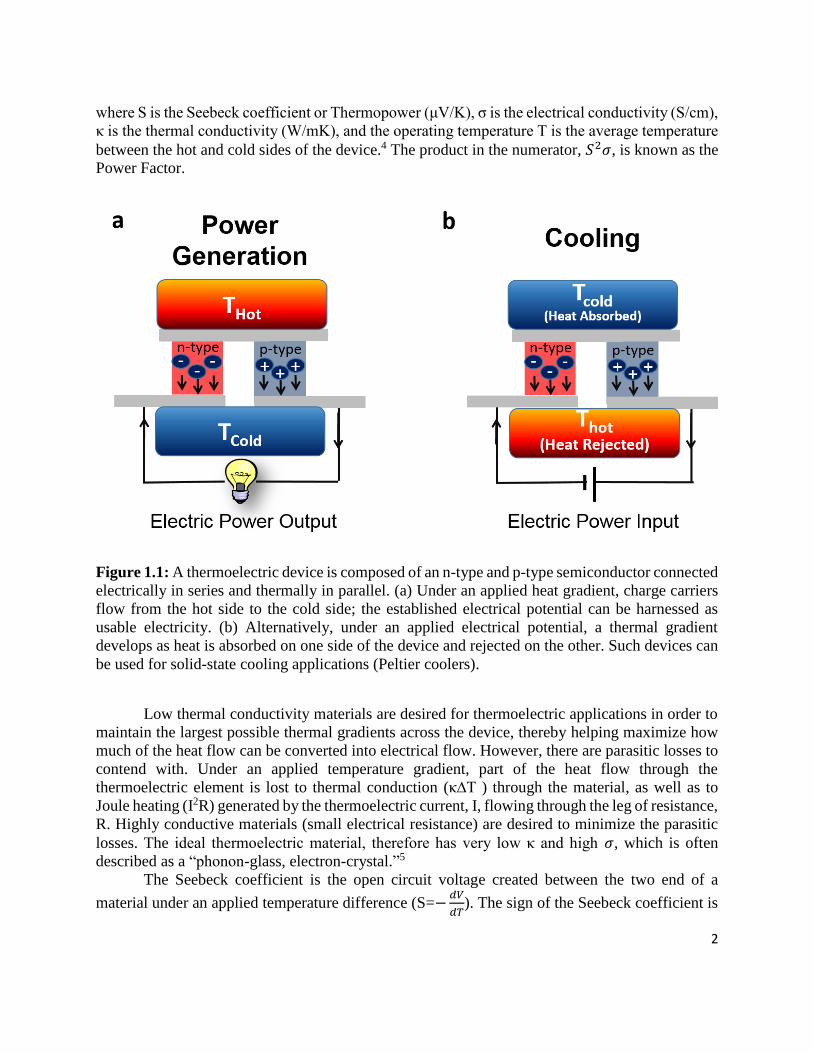
Figure 1.1: A thermoelectric device is composed of an n-type and p-type semiconductor connected
electrically in series and thermally in parallel. (a) Under an applied heat gradient, charge
carriers flow from the hot side to the cold side; the established electrical potential can be
harnessed as usable electricity. (b) Alternatively, under an applied electrical potential, a
thermal gradient develops as heat is absorbed on one side of the device and rejected on the
other. Such devices can be used for solid-state cooling applications (Peltier coolers). .......... 2
Figure 1.2: Improvement in thermoelectric performance has been challenging due to competing
thermoelectric properties in bulk materials. For example, (a) increasing material electrical
conductivity, σ, by raising the carrier concentration in the material decreases the Seebeck
coefficient, S, and (b) increases the thermal conductivity, κ. As a result, overall improvements
in performance are negated. Figures motivated by and adapted from Ref. 6-8. ..................... 3
Figure 1.3: The traditional coupling between the electrical conductivity and Seebeck coefficient.
(a) The energy dependent electrical conductivity is shown to be asymmetric relative to the
chemical potential (dashed red line). The Seebeck coefficient is proportional to 𝜎(E)*(E-Ef)
with its magnitude proportional to the net of the positive contribution (yellow hump) above
the chemical potential and the negative contribution below it (purple hump). (b) The Seebeck
coefficient can be enhanced by positioning the edge of the conduction band further away from
the chemical potential. Figures motivated by and adapted from Ref. 6-8. .............................. 7
Figure 1.4: Thermal flow schematic in a thermoelectric element. ............................................... 12
Figure 1.5: Illustration of enabled flexible using organic materials (perylene diimide derivatives
on polyimide film). ................................................................................................................ 15
Figure 1.6: Configuration possibilities for thermoelectric design. (a) Traditional configuration in
which heat is harvested through the thickness of the thermoelectric legs. (b) Non-traditional
geometries accessible to using solution-processed organic materials in which temperature
gradients are created and harvested in-plane. ........................................................................ 15
Figure 1.7: Solution-processed organic materials present the ability for unconventional module
design for harvesting energy from concentrated heat sources. .............................................. 16
Figure 2.1: (a) Increasing the length of the alkyl chain between the charged side group and the PDI
backbone from two to six methylene groups enhances electrical conductivity 100-fold. The

v
Seebeck coefficient is negative (n-type electronic transport) and remains approximately
constant with spacer length.(b) Extending the alkyl spacer length boosts the thermoelectric
power factor by two orders of magnitude. ............................................................................. 21
Figure 2.2: (a) Self-doping in all three PDI derivatives leads to high polaron charge carrier
concentrations. Dropcast films (~200 nm thick on glass) of PDI-1, PDI-2, and PDI-3 indicate
similar optoelectronic transitions regardless of spacer length. Spectra of all three materials
display the characteristic peaks for PDI radical anion (polaron) charge carriers (~730 nm, 815
nm, and 1000 nm). The peak broadening seen in PDI-3 is attributed to significant
intermolecular interactions. (b) The spin concentrations (density of polaron charge carriers)
in PDI-1, PDI-2, and PDI-3 are within an order of magnitude of each other (1020-1021
carriers/cm3) as determined by quantified EPR methods (see Supporting Information for
details). These results suggest that doping level can not explain the observed differences in
electrical conductivity between the three PDI variants. ........................................................ 23
Figure 2.3: Tuning the length of the alkyl spacer between the charged side groups and the PDI core
leads to dramatic changes in thin film morphology. GIWAXS patterns are shown for the three
PDI derivatives (a) PDI-1 (b) PDI-2 (c) PDI-3 (see Section 2.4 for film preparation details).
While detailed crystallographic indexing is not possible from this complex data, it is clear that
the three systems have different overall structures indicating that morphology may be playing
a leading role in increasing the conductivity of PDI-3 relative to PDI-1. Interestingly, PDI-1
shows the greatest structural order, indicating that molecular orientation likely does not play
a positive role in this effect. Line cuts marked by the red rectangles in the three images were
used to estimate π-π spacing distances in the variants........................................................... 24
Figure 2.4: EPR signatures for PDI-1, PDI-2, and PDI-3 in comparison to a reference sample of
DPPH. .................................................................................................................................... 30
Figure 2.5: AFM images of thin films of PDI-1. Both the amplitude and the phase images are
shown. Domains in these thin films appear to be hundreds of nanometers to microns in size.
............................................................................................................................................... 31
Figure 3.1: Chemical transformation of sidechain functionality precedes n-type doping in water-
soluble perylene diimides (PDIs). a) Quaternary functionalization, used to render the PDI core
water-soluble (PDI-I), is achieved through methylation of PDI-NMe2. When hydroxide anions
are used as the counteranions (PDI-OH), charge transfer promoting tertiary amines are
recovered upon solid-state thermal treatment by demethylation of the quaternary ammonium

vi
groups. Tertiary amine functional groups (in PDI-NMe2) induce charge transfer in solid-state
under mild thermal treatment. (b) Structures of PDI controls evaluated in this study. ......... 34
Figure 3.2: Conversion of NMe3+ to NMe2 in PDI-OH proceeds upon thin film annealing at 120
°C (i-o hrs, ii-1 hr, iii-16 hrs) as observed via XPS (N 1s spectra). As expected, after extended
annealing, the XPS spectrum of films of PDI-OH closely resembles that of PDI-NMe2 (iv).
............................................................................................................................................... 36
Figure 3.3: Electron paramagnetic resonance (EPR). Quantitative measurements of charge carrier
concentration in PDI samples were done in triplicate for all samples: (1) PDI-NMe2/PDI-C6
composites with varying PDI-NMe2 content (blue squares), (2) annealed PDI-OH samples
(red circles). Error bars for each measurement are on the scale of the data points. ............. 37
Figure 3.4: Evolution PDI thin film optical absorption spectra with anneal time: 0 min (light dotted
line), 20 min (dashed line), and 1 hr (dark solid line) for (a) PDI-OH and (b) PDI-NMe2. .. 38
Figure 3.5: Tethered tertiary amines represent a general design motif for solid-state n-type dopants.
Distinct EPR radical signatures are observed for functionalized samples (in black) in three
common n-type molecular systems: (a) naphthalene diimide (NDI-NMe2), (b)
diketopyrrolopyrrole (DPP-NMe2), and (c) fullerene (PCBM-NMe2) derivatives. EPR signal
corresponding to control samples with the same molecular cores but without tertiary amine
functionalization are shown in red (see Appendix for structures). ........................................ 40
Figure 3.6: X-ray photoelectron spectroscopy analysis. (a) Comparison of the XPS nitrogen signal
distribution between quaternary ammonium, imide, and tertiary amine environments for PDI-
NMe2 and PDI-OH (annealed for 0 hrs, 20min, 1hr, 4 hrs, and 16hrs) is shown. (b) Evolution
of the fractional ammonium signal (in red) and the resulting tertiary amine signal in PDI-OH
with annealing. The dashed lines represents the fractional tertiary amine signal (blue) and
fractional ammonium signal (red) measured for PDI-NMe2 in XPS. Presence of ammonium
signal in annealed PDI-NMe2 thin films may arise from radical cations formed upon charge
donation from the tertiary amine groups. Radical cations along with unreacted quaternary
ammonium functional groups are likely compounded in the remaining ammonium signal
observed in PDI-OH thin films with extended annealing. ..................................................... 51
Figure 3.7 FTIR of (a) PDI-OH, (b) PDI-NMe2. Comparison of as-cast (black line) and annealed
(16hrs, 120 oC; red line) samples. .......................................................................................... 52
vii
Figure 3.8: MALDI-MS of PDI-OH. Comparison of PDI-OH in its initial state and post annealing
(120 oC, 16hrs) demonstrates the loss of a methyl group. ..................................................... 53
Figure 3.9: EPR raw spectra of as-cast and annealed (a) PDI-OH and (b) PDI-NMe2. Asymmetry
in the PDI-NMe2 spectra is attributed to spin anisotropy within the sample in solid-state.... 54
Figure 3.10: UV/VIS/NIR in solid-state. Comparison of the solid-state spectra for PDI-OH, PDI-
I, PDI-NMe2, and PDI-C6 in the as-cast state and the annealed states. Doping is observed in
PDI-OH and PDI-NMe2 upon film casting. The signal intensity in the PDI polaron region
(700-1000nm) increases for PDI-OH and PDI-NMe2 spectra with annealing, but remains
unchanged for PDI-I and PDI-C6 with annealing. ................................................................ 55
Figure 3.11: UV/VIS/NIR in Solution. Comparison of solution spectra for PDI-NMe2 (in
chloroform, red) and PDI-OH (in water, blue). ..................................................................... 55
Figure 3.12: (a) Self-doping PDIs are composed of perylene diimide core acceptors and tethered
tertiary amine donors. To get a sense for the energetics involved in charge transfer, we
consider, (b) trimethylamine as the model Donor and (c) perylene diimide as the Acceptor.
............................................................................................................................................... 56
Figure 3.13: XPS comparison (Nitrogen edge) of PDI-NMe2 after varied annealing times (as cast,
20 minutes, 4 hours, and 16 hours at 120 oC). Charge carrier concentrations were quantified
with EPR for corresponding samples. ................................................................................... 57
Figure 3.14: Solution proton NMR spectra. Comparison of PDI-NMe2 neat and post annealing
(120 oC, 16hrs) suggests that longterm thermal treatment results in chemical transformation
of PDI-NMe2.......................................................................................................................... 58
Figure 3.15: LUMO levels for PDI, PCBM, NDI, and DPP molecular systems. ......................... 59
Figure 4.1: (a) Perylene diimide small molecules with tethered quaternary ammonium endgroups
can be coupled with counteranion of choice (iodide or hydroxide) through ion exchange (b)
The dopant activation strategy in this study harnesses the ability of highly nucleophilic
hydroxide anions (in contrast to iodide anions) to enable chemical transformation of the
quaternary endgroup to a tertiary amine doping group. ........................................................ 61
viii
Figure 4.2: Solid-state thin film electrical conductivity is modulated two orders of magnitude by
tuning the fractional concentration of hydroxide anions available to chemically transform
quaternary endgroups into tethered tertiary amine dopants. .................................................. 63
Figure 4.3: X-ray photoelectron spectroscopy Nitrogen edge 1s spectra quantification. The fraction
of quaternary and tertiary amine nitrogen signal are quantified for samples containing a varied
fraction of hydroxide/iodide counteranion. Increased fraction of hydroxide anion leads to an
increased fractional conversion of quaternary endgroups into tertiary amine endgroups. .... 64
Figure 4.4: Electronic property changes of thin films with varied hydroxide anion fractions. (a)
Increasing the fractional ratio of hydroxide anion increases the polaron signatures of PDI (730,
790, 1050 nm) (b) Charge carrier concentration as quantified using EPR indicates that
increasing the hydroxide anion fraction results in monotonically increasing carrier
concentration in the solid state films. .................................................................................... 65
Figure 4.5: XPS spectra comparing the nitrogen edge spectra for 0, 25, 50, 75, and 100% hydroxide
anion composition (balance iodide anion). The nitrogen edge is deconstructed into three
contributions: the quaternary, imide, and tertiary amine nitrogen signals. With increasing
hydroxide concentration, the presence of quaternary nitrogen signal decreases while the
tertiary amine signal increases. .............................................................................................. 67
Figure 5.1: (a) Extrinsic doping with hydrazine hydrate leads to ~7-fold enhancement in electrical
conductivity compared to as-cast thin films. (b) With increasing concetration of hydrazine
hydrate, the Seebeck coefficient initially decreases in magnitude before plateauing. (c)
Optimal doping boosts the corresponding thermoelectric power factor ~2.5-fold. ............... 70
Figure 5.2: Optical absorption and charge carrier concentration for PDI-OH thin films doped with
increasing concentration of hydrazine hydrate. (a) Absorption spectra of doped films shows
increased polaron peak intensities with increased concentration of dopant; (inset) intensity of
a characteristic PDI polaron absorption peak (@790nm is plotted relative to a core PDI peak
@480nm as a function of increasing dopant concentration. (b) Charge carrier concentration,
as quantified using electron paramagnetic resonance, in the doped PDI-OH samples is around
~1021 electrons/cm3. In a testament to the air stability of these materials, the samples retain ~
1020 electrons/cm3after one week of exposure to air. ............................................................ 71
Figure 5.3: Grazing-incidence wide-angle X-ray scattering. (a) Increased concentration of
hydrazine hydrate leads to a broadening of the π-π stacking. Dashed line shows path along
which π-π spacing peak characterization was compared. (b) π-π d-spacing slightly decreases

ix
while crystallite correlation length increases with a small amount of added dopant; at higher
dopant concentrations, the π-π spacing increases and the correlation length diminishes. ..... 72

x
Acknowledgements
Many individuals disserve acknowledgement for guiding me onto the path to graduate
school and helping me succeed during my five years at Berkeley.
I am deeply grateful to my research advisor, Professor Rachel Segalman, for accepting me
into her lab, believing in me, and helping me grow both personally and professionally. I am grateful
to her for encouraging me to explore different facets of thermal management technologies in
collaborations on interdisciplinary projects. Throughout my graduate school experience, she has
helped me learn how to distill the deep scientific questions at hand while keeping the big picture
in mind – a skill that will be invaluable in my future career.
I would also like to thank my research co-advisor, Dr. Jeffrey Urban, for allowing me to
work in the incredible facilities of the Molecular Foundry, for embedding me in the highly
collaborative research environment of the Inorganic Facility, and for encouraging me to explore
my scientific curiosities. His positive energy and insightful advice helped me navigate challenging
hurdles, and I am grateful for his mentorship throughout my PhD.
I am also deeply grateful to the graduate students and postdocs with whom I have had the
pleasure to work and interact with along the way, especially to Bryan McCulloch, Miguel
Modestino, Victor Ho, Nelson Coates, Bhooshan Popere, Ayash Sahu, and Shannon Yee, who
selflessly spent countless hours teaching me fundamentals in lab – skills that have enabled my
independent research. Furthermore, I would like to thank the rest of the Segalman group both at
Berkeley and at Santa Barbara throughout my time in graduate school for making the lab
environment social and exciting: Barbara Ekerdt, Dusan Cuso, Megan Hoarfrost, Hannah Murnen,
Adrianne Rosales, Wendy van Zoelen, Eddie Buehler, Bryan W. Boudouris, Hilda Buss,
William Chang, Cynthia Chen, Emily Davidson, Gabriel Sanoja, Christopher Evans, Georgios
Rizis, Haiyu Fang, Anastasia Patterson, Scott Danielsen, Eun Seon Cho, Bryan Beckingham, and
Yanika Schneider. I also want to acknowledge the hard work of several talented Berkeley
undergraduates: Morgan Shishido, Nathan Ellebracht, and Nick Mackay; it was a privilege
mentoring you. I am thankful to the entire Urban group and the staff in the Molecular Foundry
who helped brainstorm ideas, streamline experimental headaches, and encouraged breaks
afterhours with fun sports and social get-togethers: Nelson Coates, Ayash Sahu, Alyssa Brand,
Tracy Mattox, Jason Forster, Norman Su, Tev Kuykendall, Anne Ruminski, Emory Chan, Shaul
Aloni, Nate Hohman, Woochul Lee, Fan (Peter) Yang, Eddy Zaia, Eun Seon Cho, Karol Miszta,
Fen Qiu, Preston Zhou, Paul Baade, and Maxime Szybowski.
I am grateful to all my UCSB collaborators on the AFOSR MURI Organic Thermoelectrics
program without whom my research efforts would not be possible. I would like thank Max Robb,
Cheng-Kang Mai, Stephanie Fronk, and Bhooshan Popere for helping synthesize the specialized
organic small molecules essential for this dissertation, Erin Perry for help with EPR data
acquisition, and Tom Mates for help with XPS analysis. I am especially grateful to Prof. Michael
Chabinyc for his mentorship.
I also want to thank my Chemical Engineering Class of 2010 cohort, especially Jorge
Santiago Ortiz, Edwin Yik, Karthish Manthiram, and Barbara Ekerdt for being there through the
highs and lows. Additionally, I am grateful to the administrative and support staff in the Chemical
Engineering department at UC Berkeley who have helped make graduate life more manageable,
in particular Carlet Altamirano, Jessica Chapman, Fred Deakin, and Rocio Sanchez.

xi
I would not be in graduate school if it wasn’t for the support and encouragement of kind
and caring mentors during my undergraduate studies and during my four years working at GE. I
especially want to thank my undergraduate thesis advisor, Prof. Robert Prud’homme, for instilling
in me an interest for laboratory research. I am also grateful to my friend and mentor from my time
working at GE Global Research, Tao Deng, who tirelessly encouraged me to push deeper
scientifically and go to graduate school.
Most importantly, I want to thank my family, who have loved and supported me
unconditionally. I am so grateful to my parents, Alex and Natalie, who instilled in me core values,
a strong work ethic, and a general worldly curiosity that have shaped me into who I am today. I
thank my brother, Paul, for his non-stop support and feel incredibly fortunate that we’ve been able
to spend memorable quality time together in the Bay Area throughout my PhD.
My grandparents have been pivotal role-models in my life, and I thank them for that. My
Grandmother Esther always stressed that hard work and dedication could overcome great
obstacles, and I try to live by her example. She strongly encouraged my pursuit of graduate studies,
and even in her 90’s, she eagerly questioned my weekly scientific progress. My grandfather,
Mikhail, is a master of vivid story-telling, which brings history, science, and art to life; he is a
constant source of inspiration to me and keeps me mentally on my toes. Lastly, I am very thankful
to my grandmother, Galina, for her constant encouragement; I also thank her for enabling me to
do chemistry and apply thermal management expertise away from the lab in trying to recreate her
delicious family recipes; this side hobby has kept me well fed.

1
Chapter 1. Introduction
The surge in sensors and wearable electronics coming to market1 is personalizing services,
such as preventative healthcare, and, as a result, driving the need for integrated functionality that
can enable long-lasting, reliable, and conformal power generation. As a solid-state route to convert
heat into electricity, thermoelectrics could harvest body heat to help meet this demand for power.
Thermoelectrics can also be utilized for solid-state cooling/heating applications, and the realization
of wearable thermal management functionality may have a role to play in improving consumer
energy efficiency. For example, approximately fifty percent of U.S. household energy
consumption currently goes towards maintaining personal comfort through heating and cooling.2
If localized thermal regulation capabilities could be incorporated into wearable technologies, it
may be possible to reduce home energy consumption by controlling personal comfort locally
where it’s actually desired (i.e. around the human body) instead of broadly heating or cooling large
volumetric enclosures. As a technology, thermoelectrics have been around for nearly 60 years, but
the use of costly rare earth materials, expensive processing, and rigid architectures has until now
confined applications to niche markets, such as power generation in deep space exploration (using
radioactive decay as the thermal source) or solid-state heating/cooling in luxury car seats.3 Organic
thermoelectrics have attracted rapidly growing research interest with the promise of flexible
modules made from abundant materials. Ideal for operation near ambient and body temperatures,
this conceptually attractive technology has potential to enable applications, such as flexible bio-
integrated energy generators and active thermal controllers in smart clothing.
To envision how these applications could be realized, it is helpful to understand the
fundamental challenges of thermoelectric material design and see what opportunities organic
materials present. In Section 1.1, key fundamentals of thermoelectric operation are introduced.
Section 1.2 highlights the fundamentals of charge transport in organic materials, and Section 1.3
touches on opportunities for organic materials in module design. Section 1.4 summarizes the
research findings covered in this dissertation, which are presented in detail in Chapters 2-6.
1.1 Fundamentals of thermoelectric materials
A thermoelectric device, depicted in Figure 1.1, is composed of an n-type (electron
transporting) and p-type (hole transporting) semiconductor material connected together
electrically in series and thermally in parallel. The array is sandwiched between electrically
insulating heat spreaders on both the hot side and cold side. Under an applied thermal gradient,
charge carriers flow from the hot to the cold side, and the resulting electrical potential can be
harnessed as usable electricity (Figure 1.1a). If operated in reverse (flowing electricity through
the material to generate a temperature difference), thermoelectrics can also be used for cooling
applications as Peltier coolers (Figure 1.1b). In this dissertation, we focus on the power generation
application.
Thermoelectric performance is described by a non-dimensional figure of merit called ZT,
defined as
𝑍𝑇 =𝑆2𝜎𝑇
𝑘 (1.1)
2
where S is the Seebeck coefficient or Thermopower (μV/K), σ is the electrical conductivity (S/cm),
κ is the thermal conductivity (W/mK), and the operating temperature T is the average temperature
between the hot and cold sides of the device.4 The product in the numerator, 𝑆2𝜎, is known as the
Power Factor.
Figure 1.1: A thermoelectric device is composed of an n-type and p-type semiconductor connected
electrically in series and thermally in parallel. (a) Under an applied heat gradient, charge carriers
flow from the hot side to the cold side; the established electrical potential can be harnessed as
usable electricity. (b) Alternatively, under an applied electrical potential, a thermal gradient
develops as heat is absorbed on one side of the device and rejected on the other. Such devices can
be used for solid-state cooling applications (Peltier coolers).
Low thermal conductivity materials are desired for thermoelectric applications in order to
maintain the largest possible thermal gradients across the device, thereby helping maximize how
much of the heat flow can be converted into electrical flow. However, there are parasitic losses to
contend with. Under an applied temperature gradient, part of the heat flow through the
thermoelectric element is lost to thermal conduction (κ∆T ) through the material, as well as to
Joule heating (I2R) generated by the thermoelectric current, I, flowing through the leg of resistance,
R. Highly conductive materials (small electrical resistance) are desired to minimize the parasitic
losses. The ideal thermoelectric material, therefore has very low κ and high 𝜎, which is often
described as a “phonon-glass, electron-crystal.”5
The Seebeck coefficient is the open circuit voltage created between the two end of a
material under an applied temperature difference (S=−𝑑𝑉
𝑑𝑇). The sign of the Seebeck coefficient is

3
indicative of the dominant charge carrier involved in electrical transport (electron transport if S is
negative and hole transport if S is positive).
Figure 1.2: Improvement in thermoelectric performance has been challenging due to competing
thermoelectric properties in bulk materials. For example, (a) increasing material electrical
conductivity, σ, by raising the carrier concentration in the material decreases the Seebeck
coefficient, S, and (b) increases the thermal conductivity, κ. As a result, overall improvements in
performance are negated. Figures motivated by and adapted from Ref. 6-8.
Improving thermoelectric performance is fundamentally challenging because S and σ are
anti-correlated, and coupled with κ. The enhancement challenge is graphically illustrated in Figure
1.26-8. The ZT relationship suggests that to improve performance one might aim to enhance the
electrical conductivity, which can be done, for example, by increasing the carrier concentration, n
(𝜎 = 𝑛𝑞𝜇, where q is the elementary charge constant, and, 𝜇, is the charge mobility). However,
increasing the carrier concentration generally leads to a reduction in the material’s Seebeck
coefficient (explained more in Section 1.1.2) and an increase in the thermal conductivity (see
Section 1.1.1). As a result, improvements in ZT are have been hard to achieve and limited to an
optimization problem. Useful thermoelectric materials are typically doped semiconductors that can
balance the thermal and electrical properties.4,5
For high temperature applications, such as waste heat recovery from vehicle exhaust, only
inorganic materials are stable enough to be useful and active research is ongoing into a number of
inorganic classes of materials, including silicides, skutterudites, half Heusler alloys, inorganic
clathrates, and oxides.5 At low operating temperatures (below 200 oC), alloys of the inorganic
semiconductor, bismuth telluride (Bi2Te3), have long been the benchmark thermoelectric material
with a ZT of approximately 1 (which equates to ~5% efficiency at 100 K temperature difference,
see Section 1.3 for relation between ZT and efficiency)5. However, bismuth telluride is toxic, not
earth abundant, and fragile, resulting in rigid and brittle module architectures. Conducting
polymers and molecular semiconductors are an attractive earth abundant alternative for low

4
temperature applications, as they are amenable to high-throughput processing and can be utilized
in flexible and scalable module designs.
1.1.1 Attractive thermal conductivity of organic materials
The thermal conductivity is composed of an electrical (κe) and a phonon (κph) contribution:9
𝜿 = 𝜿𝒆 + 𝜿𝒑𝒉 (1.2)
Emphasizing the coupling of electrical and thermal transport, the magnitude of 𝜅𝑒 can be related
to σ through the Wiedermann-Franz relationship,
𝜿𝒆 = 𝑳𝑻𝝈 (1.3)
where the L is the Lorenz number (system dependent but ~ 2.4E-8 J2K-2C-2).
Inorganic semiconductor materials, like Bi2Te3 (bulk κ=1.4 W/mK), have greatly benefited
from strategies to scatter phonons in the material without impeding electron transport.10,11 While
this approach has resulted in driving thermal conductivity down (𝜅 ~0.1-1 W/mK), introducing
nanoscale interfaces in the material needed to realize these beneficial effects usually requires
expensive and energy intensive processes.10
Organic materials, both electrically conducting and insulating, have inherently low thermal
conductivities (~0.1-0.5 W/mK), dominated by the phonon contribution.12 At the current state of
organic material performance, the electron contribution is generally negligible given. For example,
at T=300K and 𝜎 = 1000𝑆
𝑐𝑚 (which is at the high end of currently achievable conductivities in
organic materials), the Wiedermann-Franz relationship predicts the 𝜅𝑒 contribution is only 0.007
W/mK. It is noted that while the Wiedermann-Franz relationship was initially derived assuming
an ideal electron gas model and wasn’t intended for organic system, it has recently been shown to
hold in highly conducting conjugated polymers.12
Thermal conductivity in electrically conducting organic materials is influenced by a
complex combination of factors that are currently not well understood. Investigations into the
effects of crystallinity and solid-state morphology on thermal conductivity in conjugated systems
are the subject of active research.12 Further investigation of intriguing properties, like directional
anisotropy of thermal transport,13,14 could help develop molecular design and processing strategies
that can optimize performance in thermal transport relevant applications, like thermoelectrics.
Given the inherently small thermal conductivity of organic materials, the main challenge
with utilizing organic materials for thermoelectric applications is the enhancement of the power
factor. To put the design target in perspective, if κ=0.2-0.6 W/mK, which is a typical range of
thermal conductivities for organic systems, achieving power factors of ~1000-3000 μW/mK2 is
necessary to reach ZT=1 in thermoelectric materials operating near room temperature with

5
∆T=100K. To date, most organic systems have only demonstrated power factors substantially
below 100 μW/mK2, although some promising systems, complemented by improved processing
approaches, are starting to reach the desired power factor milestone.15,16
1.1.2 The Power Factor: fundamentals of S and σ
Transport in bulk inorganic thermoelectrics can be described using classical theory of
conduction governing band-like transport.17 In this formulation, the electrical conductivity can be
written as
𝝈𝑩𝒖𝒍𝒌 = −𝒆𝟐
𝟑∫ 𝝂𝟐 𝒕𝒔
𝝏𝒇𝒐
𝝏𝑬𝒈(𝑬)𝒅𝑬 = −
𝒆𝟐
𝟑∫ 𝝈(𝑬)𝒅𝑬 (𝟏. 𝟒)
where e is the charge constant, ν is the velocity of the charge carrier, ts is the scattering time,
𝜕𝑓𝑜
𝜕𝐸
is the derivative of the equilibrium Fermi-Dirac distribution, and g is the density of states. The
integrand is also known as the differential electrical conductivity, 𝜎(E). Scattering phenomena,
captured by the presence of ts can be associated with a complex assortment of energetic,
temperature, and morphological factors in the material.
The distribution of carriers in a material is given by the Fermi distribution; only carriers
near in energy to the chemical potential (EF) will participate in transport. To help visualize 𝜎(E),
we consider the simplified case of equation 1.4 where the terms ν and ts are taken to be energy
independent (in reality, there usually is energy dependence and strong energy dependence in ts
could be helpful, see Section 1.1.3). If only fo=fo(E) and g=g(E) are energy dependent, then the
product of -𝜕𝑓𝑜
𝜕𝐸 and g(E) is proportional to the distribution 𝜎(E) (Figure 1.3a, left). The integral of
this distribution, illustrated as the yellow hump, is, therefore, proportional to the total conductivity,
𝜎. The inherent curvature in the parabolic band density of states, g(E), shown in the illustration
results in the asymmetry observed in 𝜎(E) about the chemical potential.
The expression for the Seebeck coefficient in bulk materials, Sbulk, can be obtained by
considering electron transport under both an electrical and a thermal potential:
𝑺𝑩𝒖𝒍𝒌 = −𝟏
𝒆𝑻
∫(𝑬 − 𝑬𝒇)𝝂𝟐
𝒕𝒔𝝏𝒇𝒐
𝝏𝑬𝒈(𝑬)𝒅𝑬
∫ 𝝂𝟐 𝒕𝒔𝝏𝒇𝒐
𝝏𝑬𝒈(𝑬)𝒅𝑬
(𝟏. 𝟓)
or in simplified terms
𝑺𝑩𝒖𝒍𝒌 = −𝟏
𝒆𝑻
∫ 𝝈(𝑬)(𝑬 − 𝑬𝒇)𝒅𝑬
𝝈 (𝟏. 𝟔)

6
The expression for the Seebeck coefficient captures the reciprocal relationship between S
and 𝜎. Furthermore, the numerator of the Seebeck coefficient expression shows that S is a measure
of the asymmetry of hot carriers (those above the chemical potential) and cold carriers (those below
the chemical potential). As illustrated in Figure 1.3a,6-8 the integrand of the Sbulk expression can
be visualized by multiplying the energy dependent electrical conductivity distribution by the line
E-EF. The Seebeck coefficient is proportional to the net sum of the hump above (positive
contribution) and below the chemical potential (negative contribution). Therefore, the magnitude
of the Seebeck coefficient is related to the asymmetry of the carrier distributions around the
chemical potential. The inequality about the chemical potential can be enhanced by positioning
the edge of the conduction band further away from the chemical potential. However, this decreases
the area encompassed by the differential conductivity, thereby lowering the overall electrical
conductivity. This inverse correlation between S and σ in bulk inorganic materials is illustrated in
Figure 1.3b with metals having high S and low σ and insulators having high S and low σ.

7
Figure 1.3: The traditional coupling between the electrical conductivity and Seebeck coefficient.
(a) The energy dependent electrical conductivity is shown to be asymmetric relative to the
chemical potential (dashed red line). The Seebeck coefficient is proportional to 𝜎(E)*(E-Ef) with
its magnitude proportional to the net of the positive contribution (yellow hump) above the chemical
potential and the negative contribution below it (purple hump). (b) The Seebeck coefficient can
be enhanced by positioning the edge of the conduction band further away from the chemical
potential. Figures motivated by and adapted from Ref. 6-8.

8
1.1.3 Scattering effects enable opportunities to decouple S and σ
It is possible to break the inverse coupling between electrical conductivity and Seebeck
coefficient through the introduction of either energy dependent scattering or energy independent
scattering events.
Often times, we consider the scattering time, ts, to be energy independent. However, if
highly energy dependent scattering could be achieved, it may be possible to scatter cold carriers
(purple hump in Figure 1.3a, right) while allowing high energy carriers to pass (yellow hump).
By using this energy filtering approach, it is possible to increase the asymmetry of carriers above
and below the Fermi energy, thereby increasing the Seebeck coefficient.18,19 The reduction of the
total number of charge carriers decreases the electrical conductivity, but since the power factor
scales as the square of the Seebeck coefficient, a net increase in the power factor can be realized.
Alternatively weak or non-energy dependent scattering events, such as impurity scattering,
boundary scattering, or electron-phonon scattering, can be used to decouple S and σ. This
decoupling results because non-energy dependent scattering events impact the electrical
conductivity, but have little influence on the Seebeck coefficient.20,21 To illustrate this, we consider
equations 1.4 and 1.5. If ts is not energy dependent (but dependent on some characteristic distance
or possibly temperature), then it can come out of the integral. While ts still remains in the
expression for electrical conductivity (Eq. 1.7), it cancels out in the expression for S (Eq. 1.8).
𝝈𝑩𝒖𝒍𝒌 = −𝒆𝟐
𝟑𝝂𝟐𝒕𝒔 ∫
𝝏𝒇𝒐
𝝏𝑬𝒈(𝑬)𝒅𝑬 (𝟏. 𝟕)
𝑺𝑩𝒖𝒍𝒌 = −𝟏
𝒆𝑻
∫(𝑬 − 𝑬𝒇)𝝏𝒇𝒐
𝝏𝑬𝒈(𝑬)𝒅𝑬
∫𝝏𝒇𝒐
𝝏𝑬𝒈𝒅𝑬
(𝟏. 𝟖)
While some organic systems can be described by band transport,22 most follow hopping
transport,23,24 but the strategies discussed for controlling scattering phenomena to decouple the
typical inverse correlation between S and σ still generally apply.8,20 In this dissertation, leverage
of non-energy dependent scattering to boost the electrical conductivity without impacting the
Seebeck coefficient is an important design parameter, enabling power factor enhancement in n-
type organic materials. In the following section, the fundamentals of charge transport in organic
electronic materials are discussed.
1.2 Fundamentals of Organic Electronic Materials
Organic materials were generally considered insulators until work in the 1970s on
conjugated polymers showed that organics could be made electrical conductive – pioneering
research that resulted in the 2000 Nobel prize in Chemistry (Heeger, MacDiarmid, Shirakawa).25

9
With the promise of inexpensive, high throughput fabrication, and flexible modules, a major surge
in organic electronics material development took place in the 1990s and 2000s with great interest
in using organic materials for solar cells26-28, field-effect transistor,29-31 and light emitting diode
applications.32-34 While thermoelectric properties (S and σ) were measured in early classes of
conducting organic materials, the measurements were mostly done for material characterization
purposes. Building on the general organic electronics foundation of knowledge, it has only been
in the last 5 years that there has been a rapidly growing interest in using organic materials for
thermoelectric applications.15,35-43
The conducting nature of organics stems from their conjugated chemistry. Conjugated
materials have sp2 hybridized carbon atoms resulting in delocalized π-orbitals perpendicular to the
plane of the sigma bonded molecular skeleton.35 Due to π-bond stabilization, which creates
torsional penalties, conjugated molecules tend to be rigid. Unlike saturated insulating polymers
with large bandgaps, conducting organic systems generally have small bandgaps (1-4 eV) and can
support injected charge that can be delocalized over the π-orbital system without compromising
the structural integrity of the molecule established by the σ-bonding.23,44
The propensity for conjugated systems to π-π stack makes crystallite and aggregate
formation favorable. On one hand, enhanced π-π stacking in the solid-state can benefit charge
mobility by helping strengthen intermolecular electron coupling and increase charge
delocalization.23,45 In highly crystalline organic materials, both n-type and p-type, high intrinsic
mobilities (~1-10 cm2/Vs) have been reported.23 The stacking and aggregation in conjugated
materials also manifests in solubility issues.35,44 Synthetically introducing solubilizing side chains
can help with solution-processing, which is an enabling property for high throughput fabrication
strategies and integration of materials into products.32,46,47 Both molecular semiconductors and
conjugated polymers are of great interest for organic electronics research. Small molecules have
the advantage of being easier to purify and crystallize. At the same time, the comparatively higher
viscosities of polymers tends to help homogenously deposit material from solution during device
fabrication.46 Promising small molecule architectures often serve as a starting point for conjugated
polymer backbones.
1.2.1 Charge transport in organic systems
The distribution of available energy levels that carriers can occupy in a molecular system
is considered to be Gaussian in nature around the Highest Occupied Molecular Orbital (HOMO)
and Lowest Unoccupied Molecular Orbital (LUMO) energies.23 The bandwidths of these
distributions can be as low as ~10 meV in weakly coupled systems and ~100 meV in strongly
coupled ones.48 The position of the HOMO/LUMO levels and the bandgap between them dictate
the transport properties in organic semiconductors.23,44 These levels can be tuned through synthetic
modification. For example, substitution of the conjugated system with π-acceptors, such as cyano
and carbonyl groups, increases the overall conjugation length of the material and helps stabilize
(lower) the LUMO levels.44,45 As additional examples, attaching electron withdrawing groups
(such as fluorinated groups) or substituting more electronegative atoms in the extended π system
(such as the introduction of nitrogen atoms instead of carbon) can simultaneously lower the LUMO
and HOMO levels.45
10
Charge transport in conjugated polymers and molecular semiconductors occurs via quasi-
particles, known as polarons (which can be positive or negative).49 Polarons result from electron-
phonon interactions in soft material systems with the molecular lattice polarizing around a
charge.23,49 Organic semiconductors generally have low dielectric constants (ϵ ~3.3-5.5) as
compared to inorganic materials, like silicon (ϵ=11.9).48 Furthermore, molecules are held together
by weak van der Waals interactions.49 As a result of little electronic screening and the weak
assembly forces, charge introduced into an organic system tends to be localized and polaron
motion through a material usually occurs by hopping from site to site when provided with
sufficient excitation energy (although band-like transport has also been observed).22,23 At
sufficiently high carrier concentrations, it is also possible to get radical dications/dianions or
bipolarons, which are energetically favorable to the presence of two nearby polarons.15,49 Given
sufficient activation energy, bipolarons are thought to participate in transport by splitting back into
two polarons that move to a neighboring site and subsequently recombine.15,49-51 As different
charge transport mechanisms result in unique transport property temperature dependences,
measurement of transport properties as a function of temperature can be insightful.24,35
Several characterization approaches are helpful to provide insight regarding the presence
of charge in organic materials. The formation of polarons and bipolarons creates states within the
bandgap, which can be detected in optical spectroscopy.49 Polaron formation can also induce a
conformational change from aromatic to quinoid character in conjugated polymer chains.49 The
resulting bond character changes between aromatic and quinoid conformations can be observed
using Raman spectroscopy.52 Additionally, because polarons are radical cation/anions (unpaired
charge with spin), they can be detected using electron paramagnetic resonance (EPR).49 In contrast,
bipolarons (paired charges with no spin) are silent in EPR.
1.2.2 Generating charge carriers in organic systems
Tunable introduction of charge carriers (doping) was a critical enabler of inorganic
electronic materials, and, likewise, is a vital component in pushing the merits of organic systems.
In contrast to inorganics, organic systems require significantly higher amounts of dopant to boost
carrier concentrations (ppm, or <1% for inorganics vs ~10-40 mol% for organics).53 Due to
localization of charge and strong Coulombic interactions in a low dielectric media, the electronic
mobility is generally suppressed by trap sites at low doping levels in organic materials.50,51,54
Increasing the charge carrier concentration initially helps to fill these traps.53 Once the trap sites
are filled, the energy barriers for hopping transport can be significantly decreased resulting in a
rapid spike in mobility and an increase in the concentration of mobile charge carriers.50,51,53
Furthermore, doping allows control of the energetic barriers for charge transfer at interfaces
between a material and electrode or at the interface of two active materials.55 By establishing
Ohmic contacts, the injection or extraction of charge becomes easier and the
overpotentials/operating voltages in desired applications can be reduced.53 Doping is also helpful
in optimizing the power factor in thermoelectric material under an applied thermal gradient.56
The charge generation can be done electrochemically or chemically. In the electrochemical
approach, the conjugated polymer/molecular semiconductor is brought into contact with a metal
electrode in the presence of an electrolyte.46 When the applied electrical potential is matched to
the ionization potential (oxidation) or electron affinity (reduction) of the organic material, charge

11
transfer occurs. Due to the weak intermolecular forces in organic systems, counterions of opposite
charge from the electrolyte can penetrate into film to allow electroneutrality for charge provided
by metal electrode.54 Alternatively, reactive atomic or molecular species can be used in the
chemical approach; these species can be introduced either prior to, during, or post solid-state
assembly of the active material.38,53,57-60 To be effective and widely applicable, chemical dopants
must have low ionization energy (for n-doping) or large electron affinities (to be p-dopants).
Furthermore, it’s important for the cation/anion products formed upon doping to both remain stable
and not act as charge traps that hinder transport.53 Lastly, dopant solution-processability is desired
to allow for scalable and cheap utility. Finding stable n-type doping strategies has been especially
challenging; organic semiconductors generally have low electron affinities (3 to 4 eV) and are
susceptible to oxidation by air and water under ambient conditions unless electron affinities exceed
~4 eV.61 This dissertation focuses on developing improved n-doping strategies for the design of
high performance organic thermoelectrics.
1.3 Fundamentals of Module Design
As mentioned in Section 1.1, the design of thermoelectric modules requires the assembly
of p-type and n-type legs, connected electrically in series and thermally in parallel. Module
performance is dependent on the material properties as well as geometrical considerations of the
individual legs. To a get a sense for the device parameters involved in dictating thermoelectric
module performance, we derive the efficiency of a thermoelectric material by considering a single
thermocouple (connected p- and n- leg).4,62 For simplicity, we assume negligible interface thermal
and electrical resistances at the metal interconnects (in practice this is not the case). Under an
applied temperature gradient, part of the heat flow through the thermoelectric element is lost to
thermal conduction through the material, κ*(TH - TC), and Joule heating (I2R) generated by the
induced thermoelectric current, I, flowing through the leg of resistance, R. Joule heating occurs
uniformly throughout the material; therefore, half the heat is transported to the hot side and half to
the cold side. There is also Peltier heat absorption, S*I*TH, from the hot side and heat generation,
S*I*TC, at the cold side as a result of the current going from the hot side to the cold side. The
thermal transport components are illustrated on a sample leg in Figure 1.4.

12
Figure 1.4: Thermal flow schematic in a thermoelectric element.
Therefore, the heat flow into the element at the hot side and out of the element at the cold side of
the thermoelectric element is the combination of the Peltier heating, Joule heating, and thermal
conduction contributions:
𝑄𝑖𝑛 = 𝑆𝑇𝐻 ∗ 𝐼 − 0.5𝑅𝐼𝑛𝑡𝑒𝑟𝑛𝑎𝑙𝐼2𝑅 + 𝜅(𝑇𝐻 − 𝑇𝐶)
𝑄𝑜𝑢𝑡 = 𝑆𝑇𝐶 ∗ 𝐼 + 0.5𝑅𝐼𝑛𝑡𝑒𝑟𝑛𝑎𝑙𝐼2𝑅 + 𝜅(𝑇𝐻 − 𝑇𝐶)
The resulting power produced is
𝑃𝑝𝑟𝑜𝑑𝑢𝑐𝑒𝑑 = 𝑄𝑖𝑛 − 𝑄𝑜𝑢𝑡 = 𝑆𝐼(𝑇𝐻 − 𝑇𝐶) − 𝑅𝑖𝑛𝑡𝑒𝑟𝑛𝑎𝑙𝐼2
The open circuit voltage is,
𝑉𝑂𝐶 = 𝑆∆𝑇
If the thermocouple was connected to a resistive load, 𝑅𝐿𝑜𝑎𝑑, we can get an expression for the
output voltage and current. It is helpful to define a load ratio, M=𝑅𝐿𝑜𝑎𝑑/𝑅𝐼𝑛𝑡𝑒𝑟𝑛𝑎𝑙.
Then,
13
𝑉𝑂𝑢𝑡𝑝𝑢𝑡 = 𝑉𝑂𝐶
𝑅𝐿𝑜𝑎𝑑
𝑅𝐿𝑜𝑎𝑑 + 𝑅𝐼𝑛𝑡𝑒𝑟𝑛𝑎𝑙= 𝑉𝑂𝐶
𝑀
1 + 𝑀
𝐼𝑂𝑢𝑡𝑝𝑢𝑡 =𝑉𝑂𝐶
𝑅𝐿𝑜𝑎𝑑 + 𝑅𝐼𝑛𝑡𝑒𝑟𝑛𝑎𝑙=
𝑉𝑂𝐶
𝑅𝐼𝑛𝑡𝑒𝑟𝑛𝑎𝑙(1 + 𝑀)
The power produced can also be expressed in terms of the load ratio:
𝑃𝑝𝑟𝑜𝑑𝑢𝑐𝑒𝑑 =𝑉𝑂𝐶
2𝑀
𝑅𝐼𝑛𝑡𝑒𝑟𝑛𝑎𝑙(𝑀 + 1)2
Knowing the input energy flow rate and the output electrical power from the circuit, the efficiency
is calculated as:
𝜂 =𝑃𝑝𝑟𝑜𝑑𝑢𝑐𝑒𝑑
𝑄𝐻=
𝑅𝐿𝑜𝑎𝑑𝐼2
𝑆𝑇𝐻 ∗ 𝐼 − 0.5𝑅𝐼𝑛𝑡𝑒𝑟𝑛𝑎𝑙𝐼2 ∗ 𝑅 + 𝜅∆𝑇 (1.9)
Or in terms of M:
𝜂 = [𝑇𝐻 − 𝑇𝐶
𝑇𝐻] ∗ [
𝑀
𝑀 + 1 +𝑀2
𝑍𝑇𝐻− 0.5
∆𝑇𝑇𝐻
] (1.10)
where
𝑍 =𝑆2
𝜅𝑅𝐼𝑛𝑡𝑒𝑟𝑛𝑎𝑙=
[𝑆𝑝 − 𝑆𝑛]2
[ [𝜅𝑝
𝜎𝑝]
12
+ [𝜅𝑛
𝜎𝑛]
12
]
2
and κn,p, Sn,p, σn,p are the thermoelectric properties of the n-type and p-type legs.
It can be seen that the efficiency is expressed as a product of the reversible Carnot efficiency,
𝑇𝐻−𝑇𝐶
𝑇𝐻, and an irreversible factor, [
𝑀
𝑀+1+𝑀2
𝑍𝑇𝐻−0.5
∆𝑇
𝑇𝐻
]
For maximum efficiency, we find the solution to 𝜕𝜂
𝜕𝑀=0 to obtain
14
𝜂𝑚𝑎𝑥 = [𝑇𝐻 − 𝑇𝐶
𝑇𝐻] ∗ [
𝑀𝜂 − 1
𝑀𝜂 +𝑇𝐶
𝑇𝐻
] = 𝜂𝐶𝑎𝑟𝑛𝑜𝑡 ∗ [𝑀𝜂 − 1
𝑀𝜂 +𝑇𝐶
𝑇𝐻
] (1.11)
where
𝑀𝜂 = [1 + 𝑍𝑇)]1
2 where T = 𝑇𝐻+𝑇𝐶
2
For maximum power, we likewise solve 𝜕𝑃𝑝𝑟𝑜𝑑𝑢𝑐𝑒𝑑
𝜕𝑀= 0
𝜕𝑃𝑝𝑟𝑜𝑑𝑢𝑐𝑒𝑑
𝜕𝑀= 𝑆(𝑇𝐻 − 𝑇𝐶) − 2𝑅𝑖𝑛𝑡𝑒𝑟𝑛𝑎𝑙𝐼 = 0
𝐼𝑝𝑟𝑜𝑑𝑢𝑐𝑒𝑑𝑚𝑎𝑥 =
𝑆(𝑇𝐻 − 𝑇𝐶)
2𝑅𝐼𝑛𝑡𝑒𝑟𝑛𝑎𝑙=
𝑉𝑂𝐶
2𝑅𝐼𝑛𝑡𝑒𝑟𝑛𝑎𝑙=
𝑉𝑂𝐶
𝑅𝑇𝑜𝑡𝑎𝑙
From the maximum current expression, we see that the maximum power will occur
when, 𝑅𝐼𝑛𝑡𝑒𝑟𝑛𝑎𝑙 = 𝑅𝑙𝑜𝑎𝑑. In this case, 𝑀𝑃 = 𝑀 = 1.
Therefore, the equation for maximum power produced is:
𝑃𝑚𝑎𝑥 =𝑆2 ∗ (𝑇𝐻 − 𝑇𝐶)2
4𝑅𝐼𝑛𝑡𝑒𝑟𝑛𝑎𝑙=
𝑉𝑂𝐶2
4𝑅𝐼𝑛𝑡𝑒𝑟𝑛𝑎𝑙 (1.12)
As can be seen from these derivations, the conditions for the load ratio are different depending on
whether the thermoelectric generator is meant to be operated at maximum efficiency or maximum
power generation. Furthermore, while S, σ, and κ are intrinsic properties, the presence of
resistance, R, in the above equations (R=𝜌𝐿𝑒𝑛𝑔𝑡ℎ
𝐴𝑟𝑒𝑎) means that the geometry of the legs can be used
as a design parameter to meet efficiency or power demands.
1.3.1 Inspirations and opportunities with organics for module design
Organic thermoelectrics can enable flexible, large area devices composed of inexpensive
starting materials.32,35,63 In Figure 1.5, examples of solution-processable thermoelectric materials
developed as part of this dissertation are shown cast onto flexible polyimide substrates to illustrate
this point.

15
Figure 1.5: Illustration of enabled flexible using organic materials (perylene diimide derivatives
on polyimide film).
Traditional modules are constructed with thick legs to harness a temperature gradient from the
through-plane temperature difference (Figure1.6a). By utilizing thin film construction, it is
possible to create in-plane harvesting geometries (Figure 1.6b).
Figure 1.6: Configuration possibilities for thermoelectric design. (a) Traditional configuration in
which heat is harvested through the thickness of the thermoelectric legs. (b) Non-traditional
geometries accessible to using solution-processed organic materials in which temperature
gradients are created and harvested in-plane.
Easily cast solution-processable organic thermoelectric materials allow consideration of
modules that can be constructed in such unconventional geometries. For example, a tape can be
constructed with p-leg material on side and n-leg on the opposite, separated by a spacer with metal
interconnect deposited around one edge of the tape (Figure 1.7a). One can envision using such
tape to easily create customizable geometries (Figure 1.7b), allowing for conformal coverage of
16
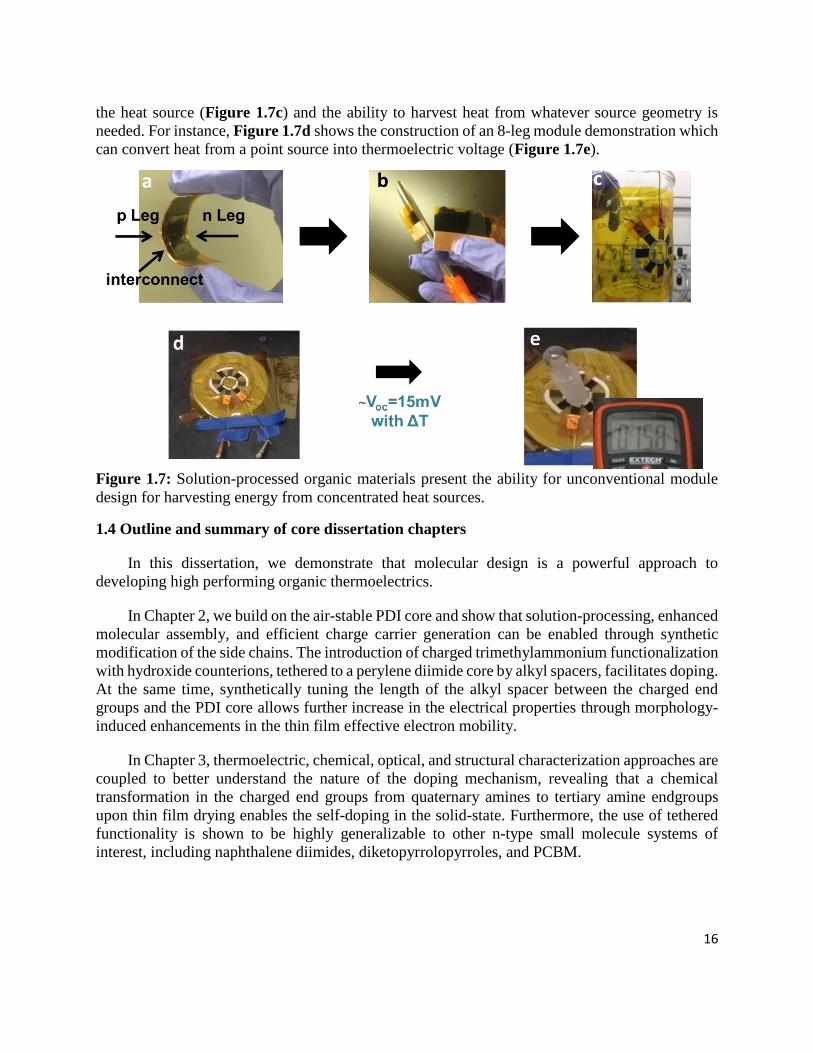
the heat source (Figure 1.7c) and the ability to harvest heat from whatever source geometry is
needed. For instance, Figure 1.7d shows the construction of an 8-leg module demonstration which
can convert heat from a point source into thermoelectric voltage (Figure 1.7e).
Figure 1.7: Solution-processed organic materials present the ability for unconventional module
design for harvesting energy from concentrated heat sources.
1.4 Outline and summary of core dissertation chapters
In this dissertation, we demonstrate that molecular design is a powerful approach to
developing high performing organic thermoelectrics.
In Chapter 2, we build on the air-stable PDI core and show that solution-processing, enhanced
molecular assembly, and efficient charge carrier generation can be enabled through synthetic
modification of the side chains. The introduction of charged trimethylammonium functionalization
with hydroxide counterions, tethered to a perylene diimide core by alkyl spacers, facilitates doping.
At the same time, synthetically tuning the length of the alkyl spacer between the charged end
groups and the PDI core allows further increase in the electrical properties through morphology-
induced enhancements in the thin film effective electron mobility.
In Chapter 3, thermoelectric, chemical, optical, and structural characterization approaches are
coupled to better understand the nature of the doping mechanism, revealing that a chemical
transformation in the charged end groups from quaternary amines to tertiary amine endgroups
upon thin film drying enables the self-doping in the solid-state. Furthermore, the use of tethered
functionality is shown to be highly generalizable to other n-type small molecule systems of
interest, including naphthalene diimides, diketopyrrolopyrroles, and PCBM.

17
In Chapter 4, we use the insight regarding the doping mechanism established in Chapter 3 to
develop a simple strategy for tuning charge carrier concentration in charged self-doping material
through control of counteranion composition.
In Chapter 5, we further expand the tunability of n-type doping by combining self-doping
with extrinsic chemical doping to create synergistic enhancements in thermoelectric performance.
The top derivatives in our study demonstrated the highest electrical conductivities and power
factors reported for solution-processed films of n-type small molecules. With continued
performance enhancements (especially in available n-type materials), the utilization of organic
modules in wearable technology applications, like low power generation, is nearing reality.
18
Chapter 2. Power factor enhancement in solution-processed organic n-type
thermoelectrics through molecular design
Adapted from “Power factor enhancement in solution-processed organic n-type thermoelectrics
through molecular design,” B. Russ, M.J. Robb, F.G. Brunetti, P.L. Miller, E.E. Perry, S.N. Patel,
V. Ho, W.B. Chang, J.J Urban, M.L. Chabinyc, C.J. Hawker, R.A. Segalman, Advanced
Materials, 2014, 26, 3473-3477 (DOI: 10.1002/adma.201306116) with permission of the authors.
Reproduced with permission of Advanced Materials.
A new class of high-performance n-type organic thermoelectric materials, self-doping
perylene diimide derivatives with modified side chains, is reported. These materials achieve the
highest n-type thermoelectric performance of solution-processed organic materials reported to
date, with power factors as high as 1.4 μW/mK2. These results demonstrate that molecular design
is a promising strategy for enhancing organic thermoelectric performance.
2.1 Introduction
Organic thermoelectrics have attracted considerable research interest, propelled by the
promise of realizing flexible, large-area, and low-cost modules.35,64,65 Building efficient
thermoelectric architectures capable of achieving this overarching goal requires high performance
complementary p-type (hole transporting) and n-type (electron transporting) materials. Although
the thermoelectric performance of p-type organic materials is rapidly advancing,56,64,66-69 the
performance of n-type organic electronic materials has not benefitted from the same level of
innovation.41,42,60,70-80 Finding stable n-type doping strategies has been difficult because organic
semiconductors generally have small electron affinities (3 to 4 eV). Consequently, very few
materials have been identified as n-type organic thermoelectrics. Of these materials, vapor doped
fullerenes41,76,78,80 and powder-processed organometallic poly(Ni 1,1,2,2-ethenetetrathiolate)81
derivates have shown the highest n-type thermoelectric performance, with electrical conductivies
as high as 9 S/cm and 40 S/cm and power factors up to 30 μWm-1K-2 and 70 μWm-1K-2,
respectively. However, these materials are not amenable to solution-processing. Record
thermoelectric performance for solution-processed organic thermoelectric materials was recently
reported by Schlitz and coworkers, who demonstrated solution doping of a high mobility n-type
polymer, poly[N,N’-bis(2-octyl-dodecyl)-1,4,5,8-napthalenedicarboximide-2,6-diyl]-alt-5,5’-
(2,2’-bithiophene)] (P(NDIOD-T2), using dihydro-1H-benzoimidazol-2-yl (N-DBI) derivatives.38
The authors achieved electrical conductivities of nearly 10-2 S/cm and power factors of 0.6
μWm-1K-2. In contrast to this promising extrinsic doping approach, here we examine the
thermoelectric properties of self-dopable perylene diimides (PDI), in which a charged doping
group is intrinsically tethered to the conjugated backbone. Critically, we demonstrate that self-
doped PDIs have the highest n-type thermoelectric performance of solution-processed organic
materials reported to date and present molecular design strategies to guide future technological
innovation in this new class of thermoelectric materials.

19
PDIs have been widely examined for their n-type behavior due to their ease of synthesis,
low cost, and optical and electrical transport properties that can be broadly tuned through
controlled chemical transformations.45,82-85 The low lying LUMO (near -4.0 eV) enables electron
injection from a variety of metals and provides electrochemical stability.29,61 Furthermore, water
soluble derivatives can be accessed through simple chemical modifications of the PDI core,86-88
enabling a pathway toward green, solution processing of thin films.
Molecular functionalization also has potential for enabling localized dopants in assembled
thin films. Recently, Gregg and coworkers demonstrated that in addition to providing aqueous
solubility, charged ethyl side chains can facilitate a controllable and reversible self-doping
mechanism activated through a low temperature thermal treatment of cast films.59 Capitalizing on
this self-doping phenomenon, the authors achieved conductivities as high as 10-3 S/cm and
showcased the material’s application as an effective hole-blocking layer. We postulated that
further n-type performance enhancements might be achieved by combining this self-doping
mechanism with proper modification of the PDI side chain length, which has been shown to
strongly change morphology and electronic properties of the resulting thin films.82 In this
communication, we show that thin film electronic transport properties can be dramatically
modified through molecular design of the alkyl spacer length between the charged side groups and
the PDI backbone, suggesting that both morphology (which changes as a result of structural
modification) as well as self-doping play a crucial role in thermoelectric performance. Physical
characterization of a series of water-soluble PDIs and characterization of their electrical
conductivities and thermoelectric power factor (as high as 0.5 S/cm and 1.4 μW/mK2, respectively)
demonstrate the attractive n-type thermoelectric properties accessible for these materials. Taking
advantage of these characteristics, we report here the highest n-type thermoelectric performance
for any solution processed small molecule. Moreover, the synthetic variability inherent in these
systems suggests promising strategies for achieving future performance enhancements.

20
2.2 Results and Discussion
Initially, a series of functionalized perylene diimide derivatives containing two, four, and
six methylene spacer groups between quaternary amine substituents and the PDI nucleus (Scheme
2.1) were prepared and fully characterized (see Supporting Information).
Scheme 2.1: Chemical structures of PDI small molecules with varying alkyl length (n) between
the PDI backbone and the charged side group.
In order to characterize the thermoelectric properties of the PDI materials, thin films were
dropcast onto glass substrates with pre-patterned gold contacts and thermally treated prior to
property measurements (see Experimental section for details on processing and measurements).
Synthetically, the nature of the charged side groups dictates interesting thermoelectric behavior as
shown in Figure 2.1. Increasing the alkyl spacer length from two (PDI-1) to six methylene groups
(PDI-3) increases the electrical conductivity one hundredfold, reaching 0.5 S/cm (Figure 2.1a). It
should be noted that the conductivity measurements of PDI-1 (~0.001 S/cm) are in agreement with
measurements by Gregg and coworkers;59 PDI-2 and PDI-3 are previously unreported materials.
The thermopower of all three variants is negative, confirming that n-type electrical transport is
dominant. Interestingly, the thermopower is invariant to alkyl spacer length. Combined, the
electrical conductivity and thermopower properties yield a power factor as high as 1.4 μW/mK2
for films of PDI-3 (Figure 2.1b).

21
Figure 2.1: (a) Increasing the length of the alkyl chain between the charged side group and the
PDI backbone from two to six methylene groups enhances electrical conductivity 100-fold. The
Seebeck coefficient is negative (n-type electronic transport) and remains approximately constant
with spacer length.(b) Extending the alkyl spacer length boosts the thermoelectric power factor by
two orders of magnitude.
22
To elucidate the nature of the observed electrical conductivity (σ), both the charge carrier
density (n) and mobility (μ) should be considered (σ=neμ, where e is the elementary charge). Self-
doping in PDI-1 was previously reported to increase the polaron charge carrier density, modifying
the electrical conductivity many orders of magnitude.59 While the nature of the n-type doping
mechanism in the charged PDI system is not fully understood, Gregg and coworkers hypothesized
that the transformation of ionic species into radical anions may be driven by molecular compaction
and the associated deshielding of ions during solvent drying.59 Similar driving forces for
generation of charge carriers have been suggested in recent findings demonstrating effective
doping of fullerenes with tetrabutylammonium salts.77 Given the minor changes made to the side-
chains, it might be expected that the doping mechanism in PDI-2 and PDI-3 is similar to that in
PDI-1 and also results in polaron charge carriers. To confirm the nature of the charge carriers, UV-
VIS-NIR absorption spectra of all three materials were measured on thermally treated samples.
As shown in Figure 2.2a, the spectra verify that all three materials have similar optical
transitions in the visible range and three characteristic peaks in the visible-near infrared region
(~730 nm, 815 nm, and 1000 nm) representative of the PDI anion (polaron charge carriers).59,89
The polaron charge carrier densities were found to be within an order of magnitude (3x10²⁰ - 3x10²¹
polarons/cm3) for the three PDI derivatives as quantified by electron paramagnetic resonance
(EPR) measurements (Figure 2.2b; see Appendix, Figure 2.4 and measurement details). While
these PDI variants are heavily doped (on the order of the molecular density), a population of neutral
molecules is still present; the absorption in the visible region in the UV-VIS-NIR spectra is
consistent with this observation. It is noted that the EPR measurements are in agreement with
charge density estimates by Gregg and coworkers in self-doped PDI-1 based on changes in UV-
VIS-NIR spectra.59
The EPR results confirm that the observed variations in electrical conductivity are not the
result of differences in doping level. In fact, the charge carrier densities appear to be inversely
correlated with the electrical conductivity measurements in the three variants. Therefore, we posit
that alkyl spacer length influences electrical conductivity through large changes in the apparent
thin film electron mobility (a combined effect of intra- and inter-domain transport properties). The
molecular structure in PDI materials is known to affect film packing morphology which has been
demonstrated to impact the observed carrier mobility in devices such as thin film

23
Figure 2.2: (a) Self-doping in all three PDI derivatives leads to high polaron charge carrier
concentrations. Dropcast films (~200 nm thick on glass) of PDI-1, PDI-2, and PDI-3 indicate
similar optoelectronic transitions regardless of spacer length. Spectra of all three materials display
the characteristic peaks for PDI radical anion (polaron) charge carriers (~730 nm, 815 nm, and
1000 nm). The peak broadening seen in PDI-3 is attributed to significant intermolecular
interactions. (b) The spin concentrations (density of polaron charge carriers) in PDI-1, PDI-2, and
PDI-3 are within an order of magnitude of each other (1020-1021 carriers/cm3) as determined by
quantified EPR methods (see Supporting Information for details). These results suggest that doping
level can not explain the observed differences in electrical conductivity between the three PDI
variants.
transistors.45,82-84,90 To investigate this hypothesis, we used grazing incidence wide angle X-ray
scattering (GIWAXS) analysis to compare the morphologies of PDI-1, PDI-2, PDI-3 in dropcast
films. The PDI films were found to be polycrystalline (Figure 2.3). Sharp reflections at q values
of ~1.8 Å-1 for PDI-1, PDI-2, PDI-3 (spacing of 3.39 Å, 3.49 Å, and 3.33 Å in real space,
respectively) are attributed to π-π stacking between PDI units, which is comparable to reported π-
π spacing distances found in other PDI systems.84 Due to the limited number of features in the
scattering analysis, definitive crystal structure assignment is difficult. Nonetheless, it is clear that
the film morphologies of the three variants are indeed different.

24
Figure 2.3: Tuning the length of the alkyl spacer between the charged side groups and the PDI
core leads to dramatic changes in thin film morphology. GIWAXS patterns are shown for the three
PDI derivatives (a) PDI-1 (b) PDI-2 (c) PDI-3 (see Section 2.4 for film preparation details). While
detailed crystallographic indexing is not possible from this complex data, it is clear that the three
systems have different overall structures indicating that morphology may be playing a leading role
in increasing the conductivity of PDI-3 relative to PDI-1. Interestingly, PDI-1 shows the greatest
structural order, indicating that molecular orientation likely does not play a positive role in this
effect. Line cuts marked by the red rectangles in the three images were used to estimate π-π
spacing distances in the variants.
Further, applying the Scherrer formula (l =2πK/Δq, where the shape factor, K, is ~ 0.9) to
the observed peak broadening (Δq) in the GIWAXS data, we estimate the correlation lengths (l) in
PDI-1, PDI-2, PDI-3 are 52.9 Å, 107.7 Å, and 34.1 Å, respectively.90 In comparison, domains in
these thin films are hundreds of nanometers to microns in size, as estimated by AFM
characterization (Figure 2.5, see appendix), suggesting that transport in these materials is most
likely limited by intra-crystalline defects. Advanced processing techniques to improve the quality
of crystallites (reduce defects) may help boost electronic transport properties, in addition to
increasing scattering detail for better structure assignments of cast films.
The observed thermopower invariance in PDI-1, PDI-2, and PDI-3 does not follow the
expected inverse proportionality with conductivity and suggests an unprecedented ability to
enhance the power factor (S2σ) through molecular design. This observation further supports the
hypothesis that electrical conductivity is modified by morphology-induced changes in mobility, as
opposed to changes in the electronic structure. Morphological changes affect scattering
mechanisms that are independent of the relative position of the Fermi energy relative to the
conduction band, such as boundary scattering, electron-phonon interactions, and voids.
Thermoelectric transport theory suggests that such scattering events would greatly influence
electrical conductivity without impact to the thermopower.20 This phenomena has been seen
experimentally in both small molecule and polymer based systems.20,21,35,67 A deeper

25
understanding into what specific scattering events are modified with side-chain control is the
subject of ongoing investigation. Using the charge carrier density numbers from the EPR
measurements, we estimate the apparent mobilities, μapparent (=σ/ne), for thin films of PDI-1, PDI-
2, and PDI-3 to be ~10-6, 10-4, and 10-2 cm2/Vs, respectively. Given that the carrier concentrations
achieved in these self-dopable PDIs are high, boosting conductivity through morphology driven
improvements in thin film mobility may be the most impactful strategy for further thermoelectric
performance enhancement.
2.3 Conclusions
The findings in this Communication demonstrate that coupling molecular design of a
perylene diimide platform with an effective doping mechanism enables a broad new direction for
n-type organic thermoelectric research. We demonstrate that record electronic properties can be
achieved by changing the alkyl spacer length between the charged side groups and the PDI
backbone. Further structural refinement is currently underway to probe the effect of changes in
alkyl spacer on structural and thermoelectric properties and to more deeply understanding the self-
doping mechanism. Insight into the self-doping pathway and its mechanistic constraints will
dictate the synthetic design of future PDI derivatives with changes in both the side chains and
central nucleus being examined. The vast possibilities for enhancing the performance of water
soluble n-type perylene diimide small molecules reinforce the immense potential for this system
to advance the development of all solution-processed flexible thermoelectric devices.
2.4 Experimental
PDI synthesis. Detailed synthetic schemes for the three materials can be found in the SI.
Synthesized PDIs with iodine counterion were dissolved in DI water at concentrations of ~2-
3mg/ml and slowly eluted through a counterion exchange column (DOWEX 550A, Sigma). The
resulting solutions were all deep purple in color and were used without further treatment.
Film Preparation. Films were dropcast on glass substrates (1 cm x 1 cm, 1 mm thick). The
substrates were pre-cleaned by sonicating in successive baths: 1% aqueous Hellmanex soap
solution (Sigma), water, acetone, and isopropyl alcohol for 10 minutes. Four gold electrical
measurement contact pads (100 nm thick overtop 5 nm of chromium adhesion layer) were then
deposited near the corners using a shadow mask in a thermal evaporator. After gold deposition,
the substrate cleaning sequence was repeated and additionally the washed substrates were treated
with O2-plasma (Harrick Plasma Cleaner PDC-32G) for 15 minutes to improve wettability
immediately before film deposition. Films were dropcast (70 µl, 1-3 mg/ml) at 75 oC at
concentrations on a leveled hotplate and kept covered to control evaporation. Cast films were
approximately 400-500 nm thick as characterized by a profilometer (Dektak 150). Films were
brought into a glovebox and baked inside on a hotplate for 20 minutes at 120 oC before
measurement.

26
Electrical Transport Measurements. Electrical measurements were obtained as previously
reported.39 Specifically, in-plane electrical conductivity was acquired using the four-point van der
Pauw technique. Tungsten tipped micromanipulators were used to puncture through the films and
make electrical contact to the Au bottom contact pads. The thermopower was measured by
suspending the substrate between two temperature-controlled Peltier stages (separated ~3 mm) and
applying a small temperature difference between the stages (-20 oC to +20 oC). Thermal grease
was used to ensure good thermal contact. The thermoelectric voltage was measured between two
Au contact pads on separate stages using micromanipulators with tungsten probe tips.
Simultaneously, the temperature of each pad was measured with a (K-type) thermocouple near the
probe tip. The thermoelectric voltage versus temperature difference was always linear, yielding a
negative thermopower (e.g., S = -dV/dT) for all samples. Three to five identical samples from the
same solution were prepared to capture the reported sample-to-sample variations of these
materials.
Other Characterization. Thin film absorption was measured using a Cary 50 UV-VIS-NIR
spectrometer. A specially built holder for the UV-VIS-NIR setup was connected to a heating
element and was used to bake the thin film samples at 120 oC. The measurement chamber was kept
under inert gas (nitrogen) to simulate the same conditions as during the electrical measurements.
EPR was performed on a Bruker EMX with samples being cast on quartz substrates and treated
identically to electrical measurement samples inside a glovebox. Details of EPR sample
preparation and charge quantification methodology can be found in the supplemental materials.
GIWAXS was performed at Stanford Synchrotron Radiation Lightsource beamline 11–3 using a
photon energy of 12.7 keV, a MAR345 image plate area detector, and a helium filled sample
chamber. The incidence angle was optimized to increase scattering from the film and minimize
substrate scattering. For GIWAXS measurements films were dropcast on Si wafers from solutions
identical to those used for electrical measurements and thermally treated at 120 oC for 20 min
inside the sample chamber before measurement.
2.5 Acknowledgements
This work was funded by the AFOSR MURI program under FA9550-12-1-0002. B.R. and M.J.R
contributed equally to this work. Portions of this research were carried out at the Molecular
Foundry, a Lawrence Berkeley National Laboratory user facility supported by the Office of
Science, Office of Basic Energy Sciences, U.S. Department of Energy, under Contract DE-AC02-
05CH11231. Portions of this work were performed at the MRL Shared Experimental Facilities,
which are supported by the MRSEC Program of the NSF under Award No. DMR 1121053; a
member of the NSF-funded Materials Research Facilities Network (www.mrfn.org). GIWAXS
studies were performed at the Stanford Synchrotron Radiation Lightsource (beamline 11-3), a
Directorate of SLAC National Accelerator Laboratory and an Office of Science User Facility
operated for the U.S. Department of Energy Office of Science by Stanford University. B.R.
gratefully acknowledges the Department of Defense for fellowship support through the National
Defense Science and Engineering Graduate Fellowship (DOD-NDSEG). M.J.R. thanks UC
Regents, CSP Technologies, and the Department of Energy Office of Science (DOE-SCGF) for
graduate fellowships.

27
2.6 Appendix: Supporting experimental information
Materials
All reagents from commercial sources were used without further purification. Perylene-3,4,9,10-
tetracarboxylic dianhydride, imidazole, iodomethane, and 2-(dimethylamino)ethylamine were
purchased from Aldrich. 4-(dimethylamino)butylamine and 6-(dimethylamino)hexylamine were
purchased from Matrix Scientific. Deuterated solvents were obtained from Cambridge Isotope
Laboratories, Inc.
General procedure for the synthesis of dimethylamino perylene diimides. Perylene-3,4,9,10-
tetracarboxylic dianhydride and the alkyl amine (4 eq.) were combined with imidazole in a round
bottom flask equipped with a stir bar and sealed with a septum. The reaction vessel was purged
with argon and subsequently heated with stirring at 130 °C for the indicated amount of time. At
the conclusion of the reaction, the vessel was allowed to cool to room temperature, the contents
were suspended in methanol, and the solid was collected by filtration using a 0.8 μm nylon
membrane. The solid was washed with methanol and dried under vacuum to afford the pure
product.
General procedure for the quaternization of dimethylamino perylene diimides. The
dimethylamino substituted perylene diimide and iodomethane (4 eq.) were dissolved in chloroform
in a round bottom flask equipped with a stir bar and condenser and refluxed for the indicated
amount of time. At the conclusion of the reaction, the mixture was cooled to room temperature
and filtered through a 0.8 μm nylon membrane. The solid was washed consecutively with
chloroform, diethyl ether, hexane, and ethanol and dried under vacuum to afford the pure product.
Bis(2-(dimethylamino)ethyl)perylene diimide. The general procedure was employed using
perylene-3,4,9,10-tetracarboxylic dianhydride (1.082 g, 2.757 mmol), 2-
(dimethylamino)ethylamine (0.9869 g, 11.20 mmol), and imidazole (14.1 g, 207 mmol) in a 50
mL round bottom flask. After 2 h at 130 °C and workup, 1.46 g (99%) of the desired product was
obtained. 1H NMR (600 MHz, CDCl3): δ 2.37 (s, 12H), 2.70 (t, J = 7.0 Hz, 4H), 4.37 (t, J = 7.0
Hz, 4H), 8.62 (d, J = 8.0 Hz, 4H), 8.69 (d, J = 7.9 Hz, 4H). 13C NMR (125 MHz, CDCl3): δ 38.31,
45.69, 56.97, 123.28, 123.46, 126.63, 129.61, 131.66, 134.83, and 163.64. MS (FD): m/z [M]+
calcd for [C32H28N4O4]+, 532.2; found, 532.2.

28
Bis(2-(trimethylammonium)ethyl)perylene diimide diiodide. The general procedure was employed
using bis(2-dimethylamino)ethyl-perylene diimide (0.9048 g, 1.699mmol), iodomethane (0.42
mL, 6.8 mmol), and chloroform (50 mL). After refluxing for 3 h and workup, 1.36 g (98%) of the
desired product was obtained. 1H NMR (600 MHz, DMSO-d6): δ 3.25 (s, 18H), 3.67 (t, J = 7.4
Hz, 4H), 4.51 (t, J = 7.0 Hz, 4H), 8.61 (d, J = 8.1 Hz, 4H), 8.96 (d, J = 8.1 Hz, 4H). 13C NMR
(150 MHz, DMSO-d6): δ 33.70, 52.48, 61.78, 122.41, 124.79, 125.33, 128.35, 131.00, 133.92, and
162.68. MS (ESI): m/z [M + Na]+ calculated for [C34H34I2N4O4 + Na]+, 839.0567; found,
839.0552.
Bis(4-(dimethylamino)butyl)perylene diimide. The general procedure was employed using
perylene-3,4,9,10-tetracarboxylic dianhydride (1.008 g, 2.569 mmol), 4-
(dimethylamino)butylamine (1.203 g, 10.35 mmol), and imidazole (14.4 g, 211 mmol) in a 50 mL
round bottom flask. After 1.25 h at 130 °C and workup, 1.44 g (95%) of the desired product was
obtained. 1H NMR (600 MHz, CDCl3): δ 1.59 – 1.68 (m, 4H), 1.75 – 1.84 (m, 4H), 2.24 (s, 12H),
2.35 (t, J = 7.6 Hz, 4H), 4.23 (t, J = 7.7 Hz, 4H), 8.49 (d, J = 8.0 Hz, 4H), 8.59 (d, J = 7.9 Hz, 4H). 13C NMR (125 MHz, CDCl3): δ 25.28, 26.19, 40.57, 45.53, 59.49, 123.17, 123.36, 126.43, 129.38,
131.45, 134.62, and 163.42. MS (FD): m/z [M]+ calcd for [C36H36N4O4]+, 588.3; found, 588.3.
Bis(4-(trimethylammonium)butyl)perylene diimide diiodide. The general procedure was employed
using bis(4-dimethylamino)butyl-perylene diimide (0.7813 g, 1.327 mmol), iodomethane (0.35
mL, 5.6 mmol), and chloroform (40 mL). After refluxing for 2 h and workup, 1.14 g (98%) of the
desired product was obtained. 1H NMR (600 MHz, DMSO-d6): δ 1.71 (p, J = 7.3 Hz, 4H), 1.79
– 1.88 (m, 4H), 3.08 (s, 18H), 3.36 – 3.42 (m, 4H), 4.12 (t, J = 7.4 Hz, 4H), 8.43 (d, J = 8.0 Hz,
4H), 8.74 (d, J = 7.9 Hz, 4H). 13C NMR (150 MHz, DMSO-d6): δ 19.87, 24.44, 52.35, 64.98,
122.73, 124.21, 125.42, 128.30, 130.95, 133.76, and 162.77. MS (ESI): m/z [M + Na]+ calcd for
[C38H42I2N4O4 + Na]+, 895.1193; found, 895.1182.
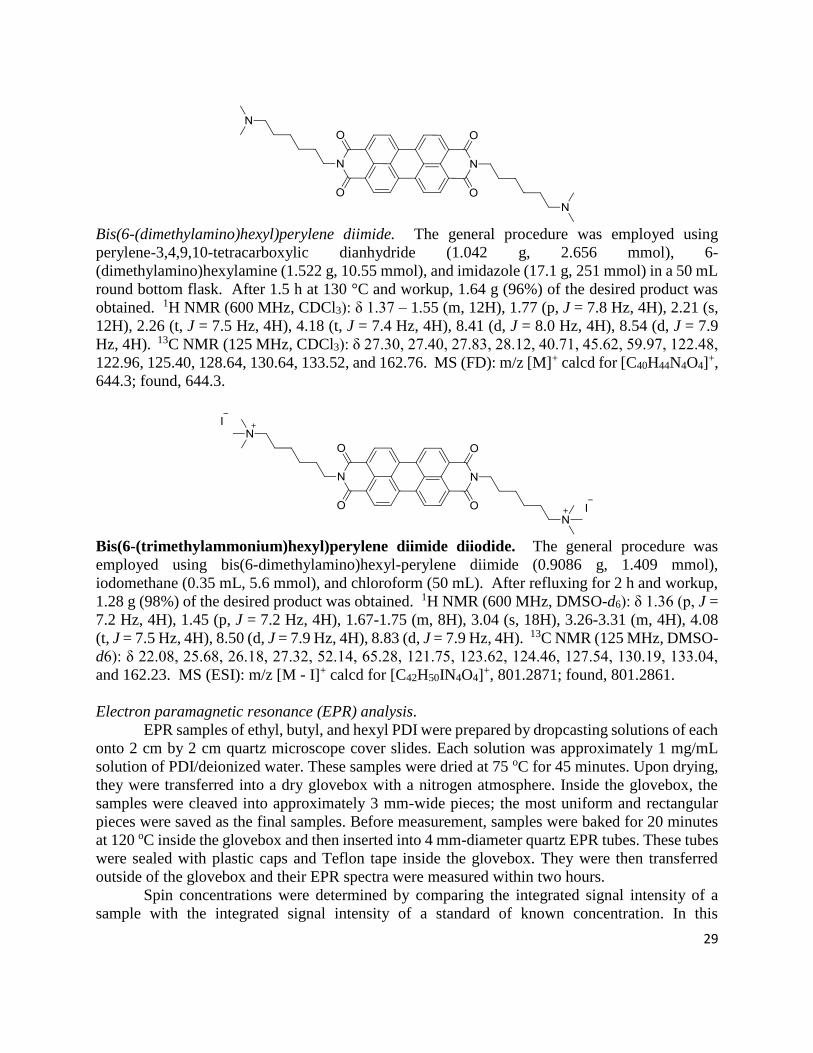
29
Bis(6-(dimethylamino)hexyl)perylene diimide. The general procedure was employed using
perylene-3,4,9,10-tetracarboxylic dianhydride (1.042 g, 2.656 mmol), 6-
(dimethylamino)hexylamine (1.522 g, 10.55 mmol), and imidazole (17.1 g, 251 mmol) in a 50 mL
round bottom flask. After 1.5 h at 130 °C and workup, 1.64 g (96%) of the desired product was
obtained. 1H NMR (600 MHz, CDCl3): δ 1.37 – 1.55 (m, 12H), 1.77 (p, J = 7.8 Hz, 4H), 2.21 (s,
12H), 2.26 (t, J = 7.5 Hz, 4H), 4.18 (t, J = 7.4 Hz, 4H), 8.41 (d, J = 8.0 Hz, 4H), 8.54 (d, J = 7.9
Hz, 4H). 13C NMR (125 MHz, CDCl3): δ 27.30, 27.40, 27.83, 28.12, 40.71, 45.62, 59.97, 122.48,
122.96, 125.40, 128.64, 130.64, 133.52, and 162.76. MS (FD): m/z [M]+ calcd for [C40H44N4O4]+,
644.3; found, 644.3.
Bis(6-(trimethylammonium)hexyl)perylene diimide diiodide. The general procedure was
employed using bis(6-dimethylamino)hexyl-perylene diimide (0.9086 g, 1.409 mmol),
iodomethane (0.35 mL, 5.6 mmol), and chloroform (50 mL). After refluxing for 2 h and workup,
1.28 g (98%) of the desired product was obtained. 1H NMR (600 MHz, DMSO-d6): δ 1.36 (p, J =
7.2 Hz, 4H), 1.45 (p, J = 7.2 Hz, 4H), 1.67-1.75 (m, 8H), 3.04 (s, 18H), 3.26-3.31 (m, 4H), 4.08
(t, J = 7.5 Hz, 4H), 8.50 (d, J = 7.9 Hz, 4H), 8.83 (d, J = 7.9 Hz, 4H). 13C NMR (125 MHz, DMSO-
d6): δ 22.08, 25.68, 26.18, 27.32, 52.14, 65.28, 121.75, 123.62, 124.46, 127.54, 130.19, 133.04,
and 162.23. MS (ESI): m/z [M - I]+ calcd for [C42H50IN4O4]+, 801.2871; found, 801.2861.
Electron paramagnetic resonance (EPR) analysis.
EPR samples of ethyl, butyl, and hexyl PDI were prepared by dropcasting solutions of each
onto 2 cm by 2 cm quartz microscope cover slides. Each solution was approximately 1 mg/mL
solution of PDI/deionized water. These samples were dried at 75 oC for 45 minutes. Upon drying,
they were transferred into a dry glovebox with a nitrogen atmosphere. Inside the glovebox, the
samples were cleaved into approximately 3 mm-wide pieces; the most uniform and rectangular
pieces were saved as the final samples. Before measurement, samples were baked for 20 minutes
at 120 oC inside the glovebox and then inserted into 4 mm-diameter quartz EPR tubes. These tubes
were sealed with plastic caps and Teflon tape inside the glovebox. They were then transferred
outside of the glovebox and their EPR spectra were measured within two hours.
Spin concentrations were determined by comparing the integrated signal intensity of a
sample with the integrated signal intensity of a standard of known concentration. In this

30
experiment, the spin concentration calculations were complicated by the variation in film thickness
that resulted from the dropcasting. The thickness of each sample was measured using profilometry.
The film was scraped off in three locations down to the substrate and the average difference in
thickness across these sites was quoted as the average thickness of the dropcasted film. To
calculate the spin concentrations, we measured the samples after a 20 minute, 120 C bake and
compared the normalized, integrated intensity of the samples to the normalized, integrated
intensity of a standard material. 2,2-diphenyl-1-picrylhydrazyl (DPPH) was used as the standard
sample and a calibrator for determining the g-factor of each material. Error in comparing the spin
concentration stemmed from uncertainty with regards to the concentration of the standard and the
error in measuring the length, width, and thickness of each sample. Raw EPR signatures are shown
in Figure 2.4.
Figure 2.4: EPR signatures for PDI-1, PDI-2, and PDI-3 in comparison to a reference sample of
DPPH.

31
Figure 2.5: AFM images of thin films of PDI-1. Both the amplitude and the phase images are
shown. Domains in these thin films appear to be hundreds of nanometers to microns in size.

32
Chapter 3. Tethered tertiary amines as solid-state n-type dopants for
solution-processable organic semiconductors
Adapted from “Tethered tertiary amines as solid-state n-type dopants for solution-processable
organic semiconductors,” B. Russ, M.J. Robb, B.C. Popere, E.E. Perry, C-K. Mai, S.L. Fronk, S.N.
Patel, T.E. Mates, G.C. Bazan, J.J Urban, M.L. Chabinyc, C.J. Hawker, R.A. Segalman, with
permission of the authors. Manuscript under review (2015).
A scarcity of stable n-type doping strategies compatible with facile processing has been a
major impediment to the advancement of organic electronic devices. Localizing dopants near the
cores of conductive molecules can lead to improved efficacy of doping. We and others recently
showed the effectiveness of tethering dopants covalently to an electron-deficient aromatic
molecule using trimethylammonium functionalization with hydroxide counterions linked to a
perylene diimide core by alkyl spacers. In this work, we demonstrate that, contrary to previous
hypotheses, the main driver responsible for the highly effective doping observed in thin films is
the formation of tethered tertiary amine moieties during thin film processing. Furthermore, we
demonstrate that tethered tertiary amine groups are powerful and general n-doping motifs for the
successful generation of free electron carriers in the solid-state, not only when coupled to the
perylene diimide molecular core, but also when linked with other small molecule systems
including naphthalene diimide, diketopyrrolopyrrole, and fullerene derivatives. Our findings help
expand a promising molecular design strategy for future enhancements of n-type organic electronic
materials.
3.1 Introduction
The promise of low-cost and scalable electronic devices has attracted great interest in the
development of active organic materials for applications, including light emitting devices,32-34
photovoltaics,26-28 thin film transistors,29-31 and thermoelectrics.43,56,91,92 Key to realizing the
potential of such organic electronics are controlled hole (p-type) and electron (n-type) doping
strategies. Doping can enable device performance improvements by: (1) boosting effective carrier
mobilities by filling trap states, (2) enhancing electrical conductivity by increasing the density of
free charge carriers, and (3) aligning energy levels at active material interfaces and metal charge
injection/extraction contacts to reduce device operating voltages or optimize open circuit voltages
under thermal bias.
While strategies for p-type doping have advanced significantly,53,91,93 the low electron
affinities of organic semiconductors (3 to 4 eV) have limited the options for n-doping of
materials.53 To enable seamless integration with scalable and cost-effective fabrication
approaches, doping strategies compatible with solution-processing are desired. Extrinsic dopants,
such as cleavable organometallic complexes,58 hydride transfer species, like N-DMBI,31,94 and
charged tetrabutylammonium salts,77 in which counterions have been proposed to act as sacrificial
electron donors, are all promising approaches, especially with ongoing efforts to reduce the use of
rare and expensive organometallic metal centers.58 Molecular design can also be used to better co-
localize dopants and prevent phase segregation.38 We and others recently demonstrated an
alternative strategy to using extrinsic dopants that simultaneously enables solution-processability

33
and localizes the dopants within the active host matrix to create high performing thermoelectric
materials.59,92,95 Specifically, quaternary ammonium cations with hydroxide counterions were
tethered to perylene diimide (PDI) using alkyl spacers. Doping of these water-soluble charged
PDIs was accomplished through drying and a low temperature thermal treatment of cast films,
resulting in exceptional charge carrier densities in the solid-state (1020-1021 carriers/cm3).92
Despite the demonstrated performance of these materials, the underlying mechanism for
the self-doping phenomenon was not well understood. It was initially proposed that doping could
result from counteranions participating in a partial electron transfer during molecular compaction
with the cationic functionalities remaining inert.59 However, trimethylammonium functional
groups are known to react with unsolvated hydroxide ions, leaving some uncertainty about the
identity of the active doping species in the solid-state.96,97 To aid the design of future self-doping
materials, we sought to identify the active motif responsible for n-type doping and understand its
role in the doping mechanism. In this work, we demonstrate that the hydroxide counterions and
trimethylammonium functional groups in the PDI system are chemical precursors in the doping
process and react in the solid-state to produce tethered dimethyl amino end groups (Figure 1a). It
is these resulting tertiary amines that are involved in the electron transfer observed in thin films.
Furthermore, we show that solid-state doping using tethered tertiary amine functional groups can
be extended to other n-type small molecule systems of interest, including naphthalene diimide
(NDI), diketopyrrolopyrrole (DPP), and fullerene derivatives. The combination of streamlined
synthesis and the generality of the localized doping approach presents a new design paradigm with
major implications in the development of solution-processable n-type organic materials highly
relevant to the broad organic electronic materials community.

34
Figure 3.1: Chemical transformation of sidechain functionality precedes n-type doping in water-
soluble perylene diimides (PDIs). a) Quaternary functionalization, used to render the PDI core
water-soluble (PDI-I), is achieved through methylation of PDI-NMe2. When hydroxide anions are
used as the counteranions (PDI-OH), charge transfer promoting tertiary amines are recovered upon
solid-state thermal treatment by demethylation of the quaternary ammonium groups. Tertiary
amine functional groups (in PDI-NMe2) induce charge transfer in solid-state under mild thermal
treatment. (b) Structures of PDI controls evaluated in this study.
35
3.2 Results and Discussion
Initially, a series of functionalized PDI derivatives was synthesized (Figure 3.1a) and fully
characterized (see Appendix). Briefly, bis(6-dimethylaminohexyl) functionalized PDI (PDI-
NMe2) was synthesized in a one-step reaction starting from perylene tetracarboxylic acid
dianhydride.92,98To form the trimethylammonium functionalized PDI with hydroxide counterions,
PDI-NMe2 was first methylated using CH3I (forming PDI-I) and the I¯ anion subsequently
exchanged for OH¯ (resulting in PDI-OH). Additional PDI variants lacking the dimethylamino
group (Figure 3.1b), namely PDI-C6 (N-hexyl) and PDI-Alkene (N-hex-5-ene substituents, see
Appendix for synthesis), were used as controls in this study.
Given the inherent instability of alkylammonium salts,96,97,99 we hypothesized that several
possible chemical reactions might be involved in the self-doping of charged PDIs in thin films,
primarily via transformation of the quaternary ammonium groups during processing. For example,
Hofmann elimination involving abstraction of the β-hydrogens by the hydroxide would result in
elimination of trimethylamine, producing water and a terminal alkene functional group (PDI-
Alkene).96,99Alternatively, nucleophilic attack of a methyl group by the hydroxide would liberate
methanol resulting in neutral dimethylamino functionalities tethered to the PDI core (PDI-
NMe2).96 The latter substitution pathway seemed plausible in the doping process. Firstly,
hydroxide anions are known to be strong nucleophiles and have recently been shown to drive
chemical transformations via nucleophilic attack leading to n-doping intermediates in fullerene
species.100 Secondly, it is well established that tertiary amines can participate in electron transfer
reactions. Studies of photoinduced electron transfer between amine-containing species and organic
acceptors in solution have been a topic of research for decades.101-104 Recently, the combination of
triethylamine and PDI was shown to be an effective photoredox catalyst system for the reduction
of aryl halides.105 The presence of amines has also been implicated in solid-state doping related
events, from control of contact work-functions55,106,107 to induction of photochromic and
photomechanical responses.108
Changes in the local nitrogen environment of the functional groups, as tracked with X-ray
photoelectron spectroscopy (XPS), suggest that conversion of quaternary ammonium cations to
tertiary amines does take place upon thin film formation and annealing. As shown in Figure 3.2,
the fraction of quaternary ammonium functionalization (cyan shading) diminishes upon drying and
annealing of the PDI-OH films, while the concentration of tertiary amines increases (pink shading).
For comparison, the signal fraction corresponding to the PDI imide nitrogen atoms (shaded red)
remains unchanged (~50%, as expected). Upon film drying and prior to annealing (i), tertiary
amines already compose ~15% of all functional groups (see Appendix, Figure 3.6 for quantitative
details). Annealing thin films of PDI-OH at 120 °C (ii,iii) propagates end group conversion; after
16 hours, the annealed PDI-OH films closely resemble annealed films of PDI-NMe2 (iv), with only
minor amounts of ammonium signal still remaining. In contrast, PDI-I (PDI-OH precursor with I¯
counterions instead of OH¯) thin films did not display noticeable tertiary amine signal even after
extended annealing (not shown), supporting the presumption that the chemical transformation is
strongly dependent on the nucleophilicity of the hydroxide anion. Dehydration and a decrease in
hydroxide anion concentration in PDI-OH films with annealing is also observed in FTIR
spectroscopy, which shows a strong decrease in absorption in the hump in the broad spectra region

36
characteristic of hydroxyl groups between 2000-4000 cm-1 (see Appendix, Figure 3.7). These
conclusions are further supported by MALDI-MS measurements that demonstrate the loss of a
methyl group upon annealing of PDI-OH. The signal with m/z = 674 corresponding to the NMe3+
dication completely disappears after annealing with the concomitant enrichment of a signal at m/z
= 659, which corresponds to the unsymmetrical PDI containing one tertiary amine and one
quaternary amine group (see Appendix, Figure 3.8).
Figure 3.2: Conversion of NMe3+ to NMe2 in PDI-OH proceeds upon thin film annealing at 120
°C (i-o hrs, ii-1 hr, iii-16 hrs) as observed via XPS (N 1s spectra). As expected, after extended
annealing, the XPS spectrum of films of PDI-OH closely resembles that of PDI-NMe2 (iv).

37
Figure 3.3: Electron paramagnetic resonance (EPR). Quantitative measurements of charge carrier
concentration in PDI samples were done in triplicate for all samples: (1) PDI-NMe2/PDI-C6
composites with varying PDI-NMe2 content (blue squares), (2) annealed PDI-OH samples (red
circles). Error bars for each measurement are on the scale of the data points.
To elucidate the doping capabilities of the tethered tertiary amines liberated in annealed
PDI-OH and in PDI-NMe2, we used quantitative electron paramagnetic resonance (EPR)
spectroscopy (Figure 3.3, Figure 3.9 in Appendix). Control samples, PDI-C6 and PDI-Alkene,
showed negligible charge concentration. In PDI-NMe2/PDI-C6 composite films, with PDI-C6
content varied to adjust the overall fraction of amine functional groups, the polaron densities are
large (~1020 carriers/cm3) and roughly scale with the fraction of amine functional groups. The
charge concentrations for annealed PDI-OH thin films, in which the fraction of amine functional
groups was estimated from the XPS data, fall in line with the established tertiary amine
dependence. Distinct radical anion (polaron) related features (peaks at ~730 nm, 800 nm, and 1000
nm) in the UV/VIS/NIR spectra of PDI-OH thin films, seen in Figure 3.4, are consistent with the
EPR findings. Upon annealing, the intensity of the polaron bands for PDI-OH and PDI-NMe2 thin
films increases, while no changes are observed in films of PDI-I and PDI-C6 controls (see

38
Appendix, Figure 3.10). It is noted that the polaron features are more pronounced with PDI-OH
than with PDI-NMe2 in the UV/VIS/NIR spectra (relative to the absorption intensity of the neutral
PDI features in the visible range). The relative difference in polaron intensities is also seen in FTIR
comparing the asymmetry in the absorption feature at ~1700 cm-1 (corresponding to the carbonyl
group) relative to the peak at 1650 cm-1 with a greater asymmetry of the peaks suggesting stronger
doping (see Appendix, Figure 3.7).109 We suspect that the polaron signatures appear weaker for
the PDI-NMe2 sample because of air exposure during the optical spectroscopy measurements105
(in contrast, EPR and XPS measurements were done in a nitrogen environment). This suggests that
residual cationic ammonium functionality may play an important role in providing enhanced air
stability to samples of annealed PDI-OH.
Figure 3.4: Evolution PDI thin film optical absorption spectra with anneal time: 0 min (light dotted
line), 20 min (dashed line), and 1 hr (dark solid line) for (a) PDI-OH and (b) PDI-NMe2.

39
As the characteristic polaron features are not observed in solutions of either PDI-OH or
PDI-NMe2 (see Appendix, Figure 3.11), electron transfer (ET) is likely to occur in the solid state.
Given that the ionization potential of the tertiary amine and the electron affinity of the PDI are
separated by ~2.6 eV, it is intriguing that the ET appears to be spontaneous, even when processing
the films in the dark. The observed doping is probably enabled by Coulombic stabilization of the
proximal radical anion and cation as well as polarization in the solid (see Appendix, Figure
3.12).77 It is noted that PDI-NMe2 films were highly doped as-cast without additional thermal
treatment as confirmed by EPR (see Appendix, Figure 3.13). While the doping effects are
observed even when processing films in the dark, rapid visible light photo-induced excitation
during sample transfer may also be involved in the charge generation process. UV light photo-
induced ET involving tethered amine functionalities in the solid-state has recently been reported.108
It is possible that some PDI•–/-NMe2•+ radical ion pairs may be formed during the doping process,
although given the thermodynamic instability of such amine intermediates, these byproducts may
be transient and likely rapidly decompose to more stable cationic species. The possibility of
protonation of the tertiary amine during this process may explain the small high binding energy
peak seen in the XPS for PDI-NMe2 samples (Figure 3.2, iv and Figure 3.13 in Appendix). We
note that in quantifying the charge carrier concentration, all signal is attributed to the PDI anion
radicals given the likely instability of complimentary tertiary amine cation radicals formed. The
possibility remains that signal from cation radicals is convoluted in quantified signal but the order
of magnitude and the reported trends in polaron concentrations in the PDI films would be
unaffected. Solution proton NMR of amine tethered PDIs before and after the thermal processing
(see Appendix, Figure 3.14) were different, suggesting that longterm annealing likely drives some
chemical transformations and renders the doping process irreversible. More involved NMR
experiments and transient light spectroscopy experiments, which are beyond the scope of this
study, may be helpful in identifying the nature of possible intermediates.
Having identified tethered tertiary amine functional groups as the active motif responsible
for low temperature self-doping, we sought to extend this strategy to solution-processable systems
beyond PDIs. Thus, dimethylamine functionalized variants (Figure 3.5) of naphthalene diimide
(NDI-NMe2), diketopyrrolopyrrole (DPP-NMe2), and fullerene (PCBM-NMe2) were synthesized
and fully characterized (see Appendix). In a testament to the generality of the doping capability,
dimethylamine functionalization successfully led to doping in all three of these molecular systems
with LUMO levels between 3.5-4.1 eV (see Appendix, Figure 3.15) under mild processing
conditions, exemplified by the distinct radical signatures observed in EPR compared to
corresponding controls without dimethylamino functionalities (Figure 3.5; see Appendix for
controls). Further work is underway to optimize molecular design and film packing of these
systems for integration into high performing devices.

40
Figure 3.5: Tethered tertiary amines represent a general design motif for solid-state n-type
dopants. Distinct EPR radical signatures are observed for functionalized samples (in black) in three
common n-type molecular systems: (a) naphthalene diimide (NDI-NMe2), (b)
diketopyrrolopyrrole (DPP-NMe2), and (c) fullerene (PCBM-NMe2) derivatives. EPR signal
corresponding to control samples with the same molecular cores but without tertiary amine
functionalization are shown in red (see Appendix for structures).
3.3 Conclusions
In conclusion, we demonstrate that tethered dimethyl amine end groups are versatile stand-
alone n-doping functionalities for the successful generation of free electron carriers in solid-state
films. The generality of this behavior is demonstrated not only when coupled to a perylene diimide
molecular core, but also when linked to naphthalene diimide, diketopyrrolopyrrole, and fullerene
derivatives. Furthermore, the use of charged quaternary ammonium groups can enable water
solubility, while still capitalizing on doping via tertiary amines. We show that the hydroxide anion
and trimethylammonium functionality in water-processable charged PDI-OH react in the solid-
state to produce dimethyl amine end groups that are responsible for the observed n-type doping.
Residual cationic groups in dehydrated films may help stabilize generated charge, thereby adding
air stability to the doped films. It should be noted that the reactivity of alkylammonium complexes
highlighted in this study may also help shed new light on alternate doping processes involving
charged alkylammonium extrinsic dopants. The mechanistic understanding provided here
broadens the possibilities for the design of solution-processable n-type organic materials of great
interest to the organic electronics community as a whole.

41
3.4 Acknowledgements
This work was funded by the AFOSR MURI program under FA9550-12-1-0002.
Portions of this research were carried out at the Molecular Foundry, a LBNL user facility
supported by the Office of Science, BES, U.S. DOE, under Contract DE-AC02-
05CH11231. Portions of this work were performed at the MRL Shared Experimental
Facilities, which are supported by the MRSEC Program of the NSF under Award No. DMR
1121053; a member of the NSF-funded Materials Research Facilities Network
(www.mrfn.org). B.R. gratefully acknowledges the DOD, AFOSR, for DOD-NDSEG
fellowship support, 32 CFR 168a under contract FA9550-11-C-0028. M.J.R. thanks UC
Regents, CSP Technologies, and the DOE (SCGF) for graduate fellowships. We thank Fred
Wudl for helpful conversations.
3.5 Appendix: Supporting experimental information
3.5.1 Materials and Methods
For synthesis of perylene diimide derivatives, all reagents from commercial sources were
used without further purification unless otherwise stated. Perylene-3,4,9,10-tetracarboxylic
dianhydride, imidazole, iodomethane were purchased from Aldrich. 6-
(dimethylamino)hexylamine was purchased from Matrix Scientific. Deuterated solvents were
obtained from Cambridge Isotope Laboratories, Inc.
All compounds involved in PDI synthesis were characterized by 1H and 13C NMR
spectroscopy, IR spectroscopy, and mass spectrometry. NMR spectra were recorded using a
Varian 500 or 600 MHz spectrometer. All 1H NMR experiments are reported in δ units, parts per
million (ppm), and were measured relative to the signal for residual chloroform (7.26 ppm) in
deuterated solvent. All 13C NMR spectra were measured in deuterated solvents and are reported
in ppm relative to the signals for residual chloroform (77.16 ppm) or 1,1,2,2-tetrachloroethane
(73.78 ppm). Mass spectrometry was performed on a Micromass QTOF2 quadrupole/time-of-
flight tandem mass spectrometer (ESI) or a Waters GCT Premier time-of-flight mass spectrometer
(EI). IR spectra were recorded on a Perkin Elmer Spectrum 100 with a Universal ATR sampling
accessory. Column chromatography was performed on a Biotage SP1 Flash Purification System
using KP-Sil SNAP cartridges and empty SNAP samplets.
For synthesis of tertiary amine functionalized C60, all reagents and solvents were
purchased from Sigma Aldrich, BDM, Fisher Scientific, or Acros Organics and used without
further purification unless specified. PCBM was purchased from Solenne. Solvents used for air
and/or water sensitive reactions (toluene) were dried by passage through two columns of alumina
and degassed by argon purge in a custom-built solvent purification system. 1H NMR spectra were
obtained on a Varian VNMRS 500 MHz or 600 MHz spectrometer. MALDI spectra were obtained
on a Bruker Microflex series MALDI-TOF using a matrix of dithranol saturated chloroform.

42
Molecular Controls for Tertiary Amine Functionalized PCBM, NDI, and DPP
[6,6]-Phenyl C61 butyric acid methyl ester (PCBM-Control), N,N′-(1-Hexyl)-1,4,5,8-
naphthalenetetracarboxydiamide (NDI-Control), and 3,6-Bis(5-bromo-2-thienyl)-2,5-bis(2-
hexyldecyl)-2,5-dihydro-pyrrolo[3,4-c]pyrrole-1,4-dione (DPP-Control) were acquired from
Sigma Aldrich.
Thin film preparation
Thin films were cast from solution under mild heating [PDI-OH (water), cast at 75 oC; PDI-NMe2,
NDI-NMe2, DPP-NMe2 (CHCl3), cast at 30 oC]; PCBM-NMe2 (MeOH/Toluene), cast at 30 oC]
Optical spectroscopy
Solution and thin film optical absorption spectra were collected using an Agilent Technologies
Cary 60 UV-Vis spectrometer.
Continuous flow mass spectrometry
A Pfeiffer Vacuum Prisma quadrapole mass spectrometer was used to monitor evaporation
composition upon dehydration of PDI-OH solution.

43
X-ray photoelectron Spectroscopy (XPS) analysis
XPS analysis was performed on a Kratos Axis Ultra DLD spectrometer (Kratos Analytical,
Manchester, UK). All spectra were run using monochromated Al-k-alpha radiation; survey and
high-resolution spectra were run at pass energies of 160 and 20 eV, respectively.
Electron paramagnetic resonance (EPR) analysis
PDI-OH and PDI-NMe2
Samples were prepared by dropcasting solutions onto 2 cm by 2 cm quartz microscope cover slides.
The samples were cleaved into approximately 3 mm-wide pieces; the most uniform and rectangular
pieces were saved as the final samples. Samples were then transferred into a dry glovebox with a
nitrogen atmosphere. Before measurement PDI-OH samples were annealed for 0 hrs, 20min, 1hr,
4 hrs, and 16hrs at 120 oC; PDI-NMe2 and PDI-C6/PDI-NMe2 composite samples were annealed
for 4hrs. All samples were then inserted into 4 mm-diameter quartz EPR tubes. These tubes were
sealed with plastic caps and Teflon tape inside the glovebox. They were then transferred outside
of the glovebox and their EPR spectra were measured within two hours.
Spin concentrations were determined by comparing the integrated signal intensity of a sample with
the integrated signal intensity of a standard of known concentration. In this experiment, the spin
concentration calculations were complicated by the variation in film thickness that resulted from
the dropcast. The thickness of each sample was measured using profilometry. The film was scraped
off in three locations down to the substrate and the average difference in thickness across these
sites was quoted as the average thickness of the dropcasted film. To calculate the spin
concentrations, the normalized, integrated intensity of the samples was compared to the
normalized, integrated intensity of a standard material. 2,2-diphenyl-1-picrylhydrazyl (DPPH) was
used as the standard sample and a calibrator for determining the spin concentrations of each
material. All samples were measured in triplicate.
NDI-NMe2 , NDI-Control, DPP-NMe2, and DPP-Control
EPR samples were prepared as discussed above and were all annealed for ~4hrs at 120 °C inside
the glovebox prior to measurement.
PCBM-NMe2 and PCBM-Control
For enhanced signal-to-noise, solutions were case and dried directly inside the quartz EPR tubes,
which were then annealed for 4 hrs at 150 °C in a glovebox prior to measurement.

44
3.5.2 Synthesis
Functionalized Perylene Diimide Derivatives
General procedure for the synthesis of dimethylamino perylene diimides Perylene-3,4,9,10-tetracarboxylic dianhydride and the alkyl amine (4 eq.) were combined with
imidazole in a round bottom flask equipped with a stir bar and sealed with a septum. The reaction
vessel was purged with argon and subsequently heated with stirring at 130 °C for the indicated
amount of time. At the conclusion of the reaction, the vessel was allowed to cool to room
temperature, the contents were suspended in methanol, and the solid was collected by filtration
using a 0.8 μm nylon membrane. The solid was washed with methanol and dried under vacuum
to afford the pure product.
General procedure for the quaternization of dimethylamino perylene diimides
The dimethylamino substituted perylene diimide and iodomethane (4 eq.) were dissolved in
chloroform in a round bottom flask equipped with a stir bar and condenser and refluxed for the
indicated amount of time. At the conclusion of the reaction, the mixture was cooled to room
temperature and filtered through a 0.8 μm nylon membrane. The solid was washed consecutively
with chloroform, diethyl ether, hexane, and ethanol and dried under vacuum to afford the pure
product.
PDI-NMe2
Bis(6-(dimethylamino)hexyl)perylene diimide The general procedure was employed using perylene-3,4,9,10-tetracarboxylic dianhydride (1.042
g, 2.656 mmol), 6-(dimethylamino)hexylamine (1.522 g, 10.55 mmol), and imidazole (17.1 g, 251
mmol) in a 50 mL round bottom flask. After 1.5 h at 130 °C and workup, 1.64 g (96%) of the
desired product was obtained. 1H NMR (600 MHz, CDCl3): δ 1.37 – 1.55 (m, 12H), 1.77 (quin,
J = 7.8 Hz, 4H), 2.21 (s, 12H), 2.26 (t, J = 7.5 Hz, 4H), 4.18 (t, J = 7.4 Hz, 4H), 8.41 (d, J = 8.0
Hz, 4H), 8.54 (d, J = 7.9 Hz, 4H). 13C NMR (125 MHz, CDCl3): δ 27.30, 27.40, 27.83, 28.12,
40.71, 45.62, 59.97, 122.48, 122.96, 125.40, 128.64, 130.64, 133.52, and 162.76. MS (FD): m/z
[M]+ calcd for [C40H44N4O4]+, 644.3; found, 644.3.

45
PDI-I
Bis(6-(trimethylammonium)hexyl)perylene diimide diiodide
The general procedure was employed using bis(6-dimethylamino)hexyl-perylene diimide (0.9086
g, 1.409 mmol), iodomethane (0.35 mL, 5.6 mmol), and chloroform (50 mL). After refluxing for
2 h and workup, 1.28 g (98%) of the desired product was obtained. 1H NMR (600 MHz, DMSO-
d6): δ 1.36 (p, J = 7.2 Hz, 4H), 1.45 (quin, J = 7.2 Hz, 4H), 1.67-1.75 (m, 8H), 3.04 (s, 18H), 3.26-
3.31 (m, 4H), 4.08 (t, J = 7.5 Hz, 4H), 8.50 (d, J = 7.9 Hz, 4H), 8.83 (d, J = 7.9 Hz, 4H). 13C
NMR (125 MHz, DMSO-d6): δ 22.08, 25.68, 26.18, 27.32, 52.14, 65.28, 121.75, 123.62, 124.46,
127.54, 130.19, 133.04, and 162.23. MS (ESI): m/z [M - I]+ calcd for [C42H50IN4O4]+, 801.2871;
found, 801.2861.
PDI-OH
PDI-OH preparation via counterion exchange
Synthesized PDI-I variants were dissolved in DI water at concentrations of ~2-3mg/ml and slowly
eluted through a counterion exchange column (DOWEX 550A, Sigma). The resulting solution was
deep purple in color and was used without further treatment.
PDI-Alkene

46
N,N'–bis(hex-5-enyl)perylene-3,4,9,10-tetracarboxylic diimide
Perylene-3,4,9,10-tetracarboxylic dianhydride (610 mg, 1.55 mmol) and 1-amino-5-hexene1 (661
mg, 6.66 mmol) were combined with imidazole (7.4 g) in a 50 mL round bottom flask equipped
with a stir bar and sealed with a septum. The flask was purged with argon for approximately 5
min and heated with stirring in an oil bath maintained at 120 °C. After 2 h, the flask was cooled
and the contents were suspended in 2M HCl and filtered using a 0.45 μm nylon membrane. The
solid was washed with water, methanol, and acetone and dried under vacuum to yield 860 mg
(quant) of the desired product as a red solid after drying under vacuum. 1H NMR (600 MHz,
CDCl3) δ: 1.56 (p, J = 7.7 Hz, 4H), 1.79 (quin, J = 8.1 Hz, 4H), 2.16 (q, J = 7.2 Hz, 4H), 4.22 (t,
J = 7.7 Hz, 4H), 4.93–5.07 (m, 4H), 5.83 (ddt, J = 17.0, 10.2, 6.7 Hz, 2H), 8.58–8.71 (m, 8H); 13C
NMR (150 MHz, 1,1,2,2-tetrachloroethane-d2) δ: 26.3, 27.5, 33.4, 40.4, 114.8, 120.2, 123.0,
123.1, 131.3, 134.4, 138.5, 163.2 ppm; IR (solid, cm-1): 3071, 2932, 2860, 1692, 1651, 1593, 1579,
1439, 1340, 1250; HRMS (EI, m/z): calcd for [C36H30N2O4]+ (M+), 554.2206; found, 554.2195.
Tertiary Amine Functionalized C60
PCBM Reduction to C60-OH
C60-OH was synthesized according to literature methods.110 The product was purified using
column chromatography on silica gel with 9:1 toluene to ethyl acetate as the eluent. C60-OH was
produced with a yield of 70%. 1H NMR (500 MHz, CDCl3) δ (ppm): 7.93 (m, 2H), 7.55 (m, 2H),
7.48 (m, 1H), 3.74 (q, 2H), 2.90 (m, 2H), 1.92-1.98 (m, 2H), 1.78 (m, 2H). MALDI-TOF:
calculated mass: 882.104; found: 883.035.
C60-OH Conversion to C60-OTs
Under argon atmosphere, C60-OH (0.068 mmol, 1 eq.), p-toluenesulfonic acid (0.272 mmol, 4 eq.),
and DMAP (0.068 mmol, 1 eq.) were dissolved in chloroform (1.50 mL) and carbon disulfide

47
(1.50 mL). DIPEA (0.08 mL, 7 eq.) was added via syringe. The reaction was allowed to stir for
15 hours. The reaction mixture was diluted with dichloromethane and washed three times with
water. The organic layer was dried over sodium sulfate and the solvent removed under reduced
pressure. The product was purified using column chromatography on silica gel starting with an
eluent mixture of 2:1 hexane to chloroform and ending with a mixture of 1:2 hexane to chloroform.
C60-OTs was produced with a yield of 60.%. 1H NMR (500 MHz, CDCl3) δ (ppm): 7.87 (m, 2H),
7.78 (d, 2H), 7.55 (m, 2H), 7.48 (m, 1H), 7.34 (d, 2H), 4.12 (m, 2H), 2.83 (m, 2H), 2.45 (s, 3H),
1.85 (m, 4H). MALDI-TOF: calculated mass: 1036.113; found: 1036.286.
C60-OTs Conversion to C60-NMe2
PCBM-NMe2
Under argon atmosphere, C60-OTs (0.055 mmol, 1 eq.) was dissolved in THF (2 mL) and
chloroform (2 mL). Dimethylamine (2 M in THF, 1.65 mmol, 30 eq.) was added via syringe. The
reaction was heated to 60°C and allowed to stir for 20 hours. The reaction mixture was diluted
with chloroform and washed three times with dilute aqueous potassium hydroxide. The organic
layer was dried over sodium sulfate and the solvent removed under reduced pressure. The product
was purified using column chromatography on silica gel starting with chloroform as the eluent and
ending with chloroform plus 5% methanol. C60-NMe2 was produced with a yield of 72%. 1H
NMR (600 MHz, CDCl3) δ (ppm): 7.90 (m, 2H), 7.54 (m, 2H), 7.46 (m, 1H), 2.88 (m, 2H), 2.48
(m, 2H), 2.34 (s, 6H), 1.85 (m, 2H), 1.73 (m, 2H). MALDI-TOF: calculated mass: 909.152;
found: 907.995.

48
Tertiary Amine Functionalized Napthalene Diimide
NDI- NMe2
N,N’-bis(6-dimethylamino)hexyl-1,4,5,8-naphthalene tetracarboxylic diimide
1,4,5,8-Naphthalenetetracarboxylic dianhydride (3.73 mmol, 1 eq.) was suspended in anhydrous
dimethyl acetamide (15 mL) and the contents were sparged with nitrogen for 15 min. N,N-
dimethylethylenediamine (9.3 mmol, 2.5 eq.) was added via a syringe and the reaction mixture
was stirred at 80˚C for 15 h. Upon cooling, the crude reaction mixture was poured into
hexanes/isopropyl alcohol mixture (200 mL, 1:1) cooled to 0˚C. The resulting suspension was
stirred and allowed to warm to room temperature. The solids were collected via filtration and
subsequently washed with copious amounts of water. The product was purified over a short silica
gel plug with ethyl acetate as the eluent. The solution was concentrated in vacuo to yield a beige
solid (1 g, 65% yield). 1H NMR (500 MHz, CDCl3) δ (ppm): 8.75 (s, 4H), 4.19 (t, 2H, J = 6.9
Hz), 2.24–2.20 (m, 16H).
Tertiary Amine Functionalized Diketopyrrolopyrrole111-113
2,5-bis(6-bromohexyl)-3,6-di(thiophen-2-yl)-2,5-dihydropyrrolo[3,4-c]pyrrole-1,4-dione
3,6-Di(thien-2-yl)pyrrolo[3,4-c]pyrrole-1,4(2H,5H)-dione (534 mg, 1.78 mmol) was dissolved in
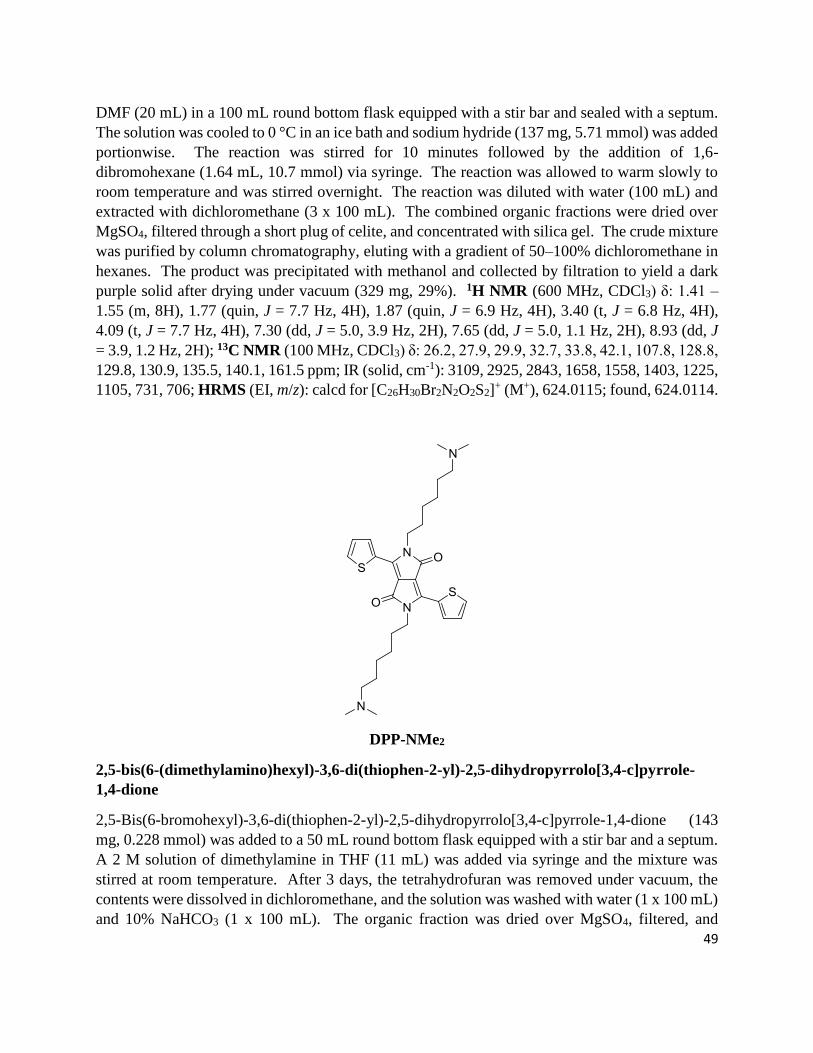
49
DMF (20 mL) in a 100 mL round bottom flask equipped with a stir bar and sealed with a septum.
The solution was cooled to 0 °C in an ice bath and sodium hydride (137 mg, 5.71 mmol) was added
portionwise. The reaction was stirred for 10 minutes followed by the addition of 1,6-
dibromohexane (1.64 mL, 10.7 mmol) via syringe. The reaction was allowed to warm slowly to
room temperature and was stirred overnight. The reaction was diluted with water (100 mL) and
extracted with dichloromethane (3 x 100 mL). The combined organic fractions were dried over
MgSO4, filtered through a short plug of celite, and concentrated with silica gel. The crude mixture
was purified by column chromatography, eluting with a gradient of 50–100% dichloromethane in
hexanes. The product was precipitated with methanol and collected by filtration to yield a dark
purple solid after drying under vacuum (329 mg, 29%). 1H NMR (600 MHz, CDCl3) δ: 1.41 –
1.55 (m, 8H), 1.77 (quin, J = 7.7 Hz, 4H), 1.87 (quin, J = 6.9 Hz, 4H), 3.40 (t, J = 6.8 Hz, 4H),
4.09 (t, J = 7.7 Hz, 4H), 7.30 (dd, J = 5.0, 3.9 Hz, 2H), 7.65 (dd, J = 5.0, 1.1 Hz, 2H), 8.93 (dd, J
= 3.9, 1.2 Hz, 2H); 13C NMR (100 MHz, CDCl3) δ: 26.2, 27.9, 29.9, 32.7, 33.8, 42.1, 107.8, 128.8,
129.8, 130.9, 135.5, 140.1, 161.5 ppm; IR (solid, cm-1): 3109, 2925, 2843, 1658, 1558, 1403, 1225,
1105, 731, 706; HRMS (EI, m/z): calcd for [C26H30Br2N2O2S2]+ (M+), 624.0115; found, 624.0114.
DPP-NMe2
2,5-bis(6-(dimethylamino)hexyl)-3,6-di(thiophen-2-yl)-2,5-dihydropyrrolo[3,4-c]pyrrole-
1,4-dione
2,5-Bis(6-bromohexyl)-3,6-di(thiophen-2-yl)-2,5-dihydropyrrolo[3,4-c]pyrrole-1,4-dione (143
mg, 0.228 mmol) was added to a 50 mL round bottom flask equipped with a stir bar and a septum.
A 2 M solution of dimethylamine in THF (11 mL) was added via syringe and the mixture was
stirred at room temperature. After 3 days, the tetrahydrofuran was removed under vacuum, the
contents were dissolved in dichloromethane, and the solution was washed with water (1 x 100 mL)
and 10% NaHCO3 (1 x 100 mL). The organic fraction was dried over MgSO4, filtered, and

50
concentrated. After precipitation with cold hexanes, the product was isolated by filtration as a
dark purple solid after drying under vacuum (84 mg, 67%). 1H NMR (600 MHz, CDCl3) δ: 1.32
– 1.39 (m, 4H), 1.40 – 1.50 (m, 8H), 1.75 (quin, J = 7.6 Hz, 4H), 2.19 (s, 12H), 2.22 (t, J = 7.6 Hz,
4H), 4.07 (t, J = 8.0 Hz, 4H), 7.28 (dd, J = 5.0, 3.9 Hz, 2H), 7.64 (dd, J = 5.0, 1.2 Hz, 2H), 8.92
(dd, J = 3.9, 1.2 Hz, 2H); 13C NMR (100 MHz, CDCl3) δ: 27.0, 27.3, 27.8, 30.1, 42.3, 45.6, 59.9,
107.8, 128.8, 129.9, 130.8, 135.4, 140.1, 161.5 ppm; IR (solid, cm-1): 3091, 3065, 2925, 2852,
2760, 1651, 1557, 1224, 855, 697; HRMS (ESI, m/z): calcd for [C30H43N4O2S2]+ (M+H)+,
555.2827; found, 555.2812.

51
3.5.3 Figures and Tables
(a)
(b)
Figure 3.6: X-ray photoelectron spectroscopy analysis. (a) Comparison of the XPS nitrogen signal
distribution between quaternary ammonium, imide, and tertiary amine environments for PDI-
NMe2 and PDI-OH (annealed for 0 hrs, 20min, 1hr, 4 hrs, and 16hrs) is shown. (b) Evolution of
the fractional ammonium signal (in red) and the resulting tertiary amine signal in PDI-OH with
annealing. The dashed lines represents the fractional tertiary amine signal (blue) and fractional
ammonium signal (red) measured for PDI-NMe2 in XPS. Presence of ammonium signal in
annealed PDI-NMe2 thin films may arise from radical cations formed upon charge donation from
the tertiary amine groups. Radical cations along with unreacted quaternary ammonium functional
groups are likely compounded in the remaining ammonium signal observed in PDI-OH thin films
with extended annealing.
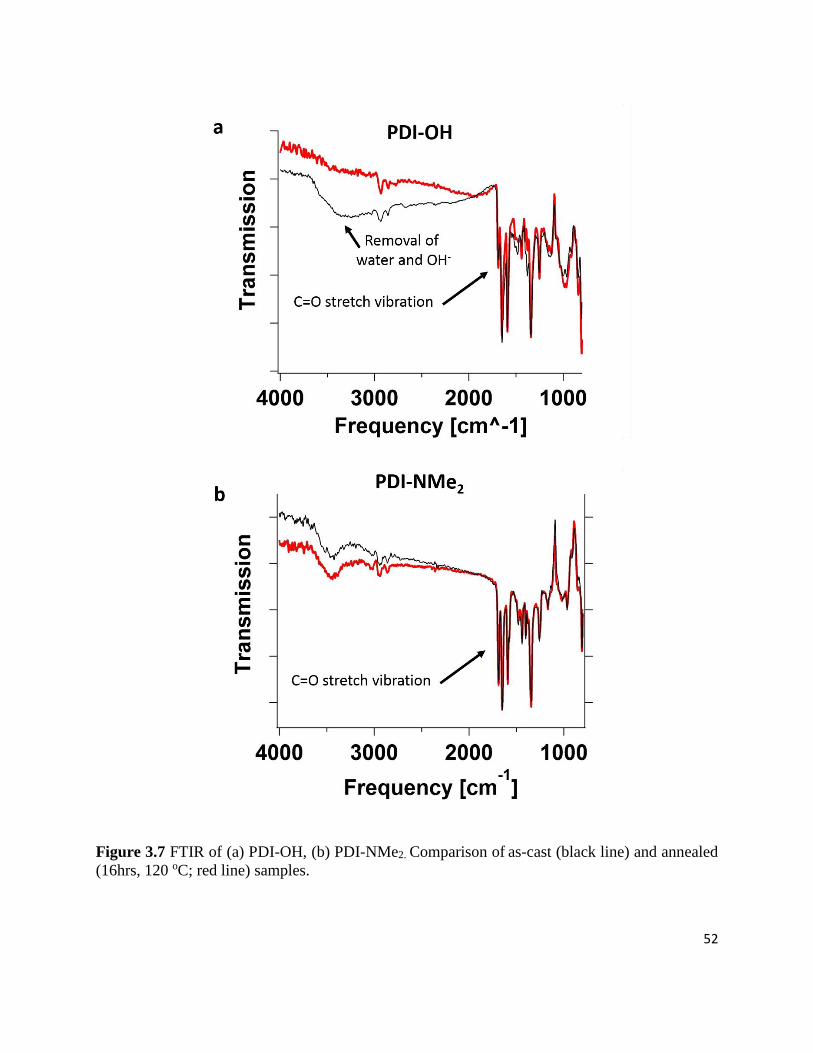
52
Figure 3.7 FTIR of (a) PDI-OH, (b) PDI-NMe2. Comparison of as-cast (black line) and annealed
(16hrs, 120 oC; red line) samples.

53
Figure 3.8: MALDI-MS of PDI-OH. Comparison of PDI-OH in its initial state and post annealing
(120 oC, 16hrs) demonstrates the loss of a methyl group.

54
Figure 3.9: EPR raw spectra of as-cast and annealed (a) PDI-OH and (b) PDI-NMe2. Asymmetry
in the PDI-NMe2 spectra is attributed to spin anisotropy within the sample in solid-state.

55
Figure 3.10: UV/VIS/NIR in solid-state. Comparison of the solid-state spectra for PDI-OH, PDI-
I, PDI-NMe2, and PDI-C6 in the as-cast state and the annealed states. Doping is observed in PDI-
OH and PDI-NMe2 upon film casting. The signal intensity in the PDI polaron region (700-1000nm)
increases for PDI-OH and PDI-NMe2 spectra with annealing, but remains unchanged for PDI-I
and PDI-C6 with annealing.
Figure 3.11: UV/VIS/NIR in Solution. Comparison of solution spectra for PDI-NMe2 (in
chloroform, red) and PDI-OH (in water, blue).

56
Estimation of Charge-Transfer Energetics in Self-Doping PDI Solid-State Thin Films
To estimate the charge transfer energetics associated with self-doping PDIs in the solid-state, we
consider an alkylamine as a representative Donor (D) and the perylene dimide core as the Acceptor
(A), which is shown in Figure 3.12. For the charge transfer to happen spontaneously, as is
observed experimentally, the overall free energy change (∆GCT) must be negative.
We can determine ∆GCT as IPD – EAA - EC, where IPD is the solid state ionization potential of the
donor and EAA is the solid state electron affinity of the acceptor, and EC is the Coulombic
stabilization energy. We use reported solid-state values for the electron affinity of perylene dimide
(3.9 eV)75 and ionization potential of alkylamines (6.5 eV).55
A+ e- A- EAA = ~3.9 eV
D D+ + e- IPD = ~ 6.5 eV
Figure 3.12: (a) Self-doping PDIs are composed of perylene diimide core acceptors and tethered
tertiary amine donors. To get a sense for the energetics involved in charge transfer, we consider,
(b) trimethylamine as the model Donor and (c) perylene diimide as the Acceptor.
In solid-state, energetic stabilization effects, including electronic polarization114 and Coulombic
stabilization, aid in reducing the energy barrier. Polarization effects are already taken into account
when using solid state EA and IP values.
The Coulombic stabilization can be roughly approximated as, C = − 𝑒2
4𝜋∈𝑜∈∗𝑑 , where
𝟏
𝟒𝝅∈𝒐 =
8.98755E9 Nm2/C2; e is the charge constant (1.6E-19 C); ∈ is the dielectric constant (~3 for
organic solid film). If the separation distance between D+
and A-
, d, is taken to be ~4 �̇�, then,
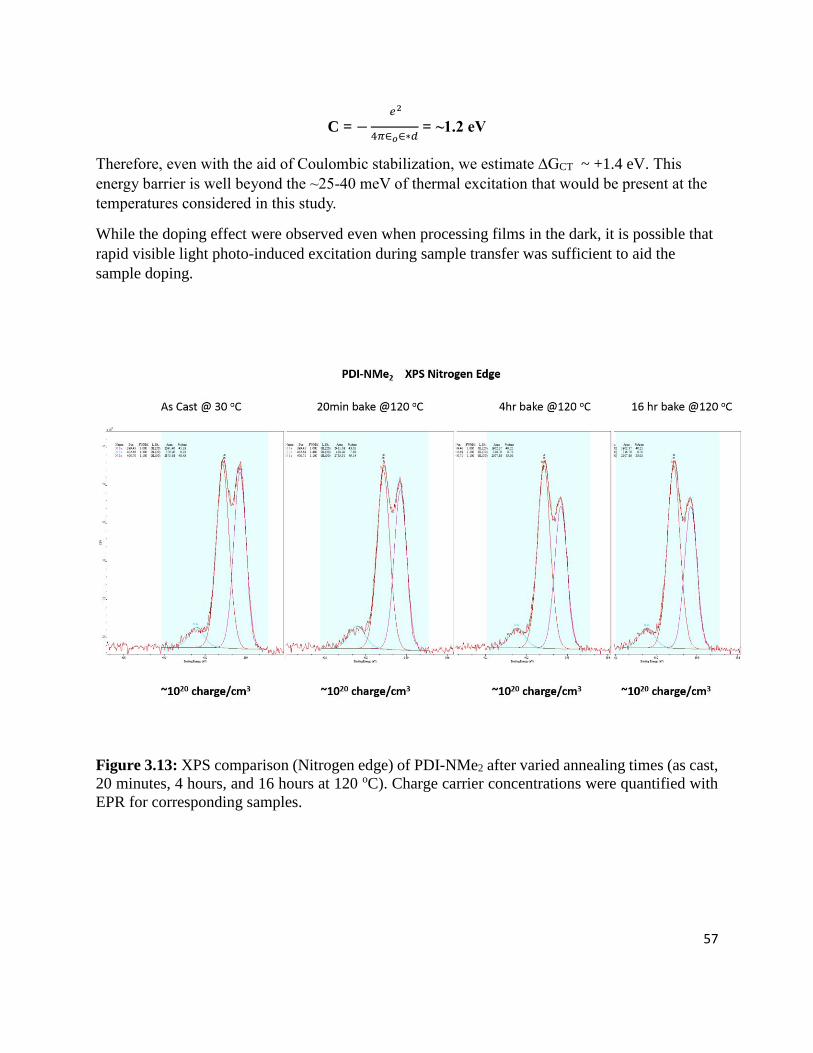
57
C = − 𝑒2
4𝜋∈𝑜∈∗𝑑 = ~1.2 eV
Therefore, even with the aid of Coulombic stabilization, we estimate ∆GCT ~ +1.4 eV. This
energy barrier is well beyond the ~25-40 meV of thermal excitation that would be present at the
temperatures considered in this study.
While the doping effect were observed even when processing films in the dark, it is possible that
rapid visible light photo-induced excitation during sample transfer was sufficient to aid the
sample doping.
Figure 3.13: XPS comparison (Nitrogen edge) of PDI-NMe2 after varied annealing times (as cast,
20 minutes, 4 hours, and 16 hours at 120 oC). Charge carrier concentrations were quantified with
EPR for corresponding samples.
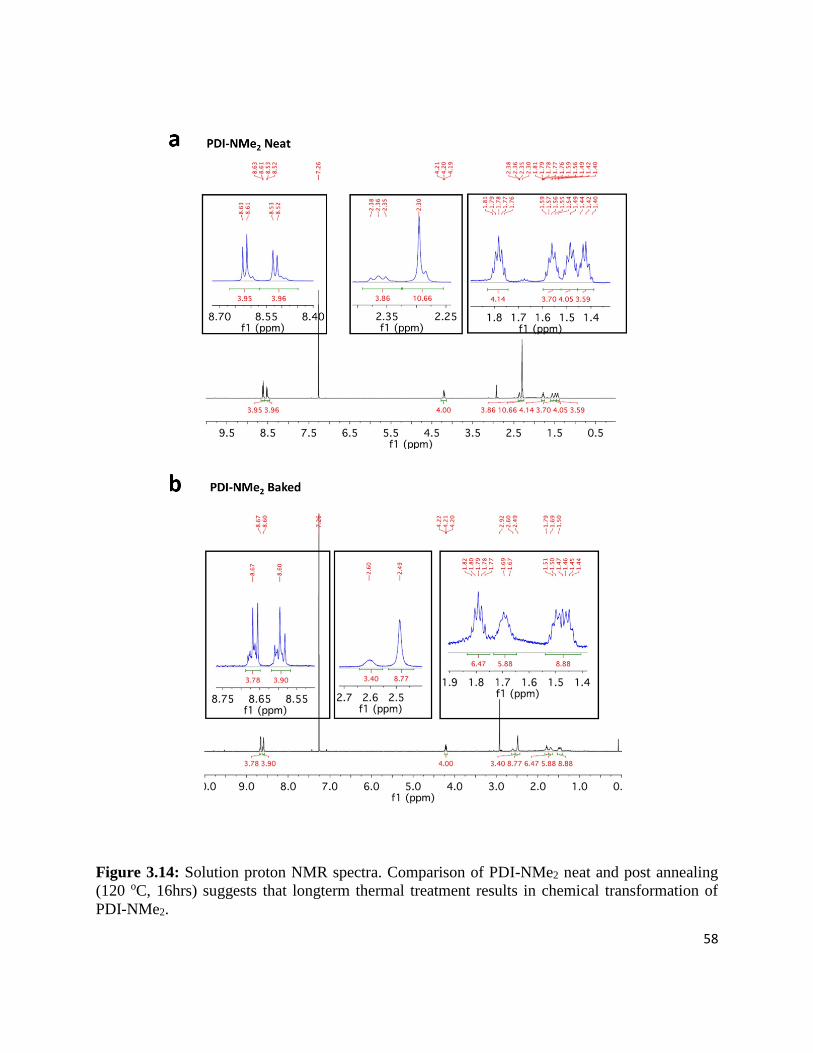
58
Figure 3.14: Solution proton NMR spectra. Comparison of PDI-NMe2 neat and post annealing
(120 oC, 16hrs) suggests that longterm thermal treatment results in chemical transformation of
PDI-NMe2.
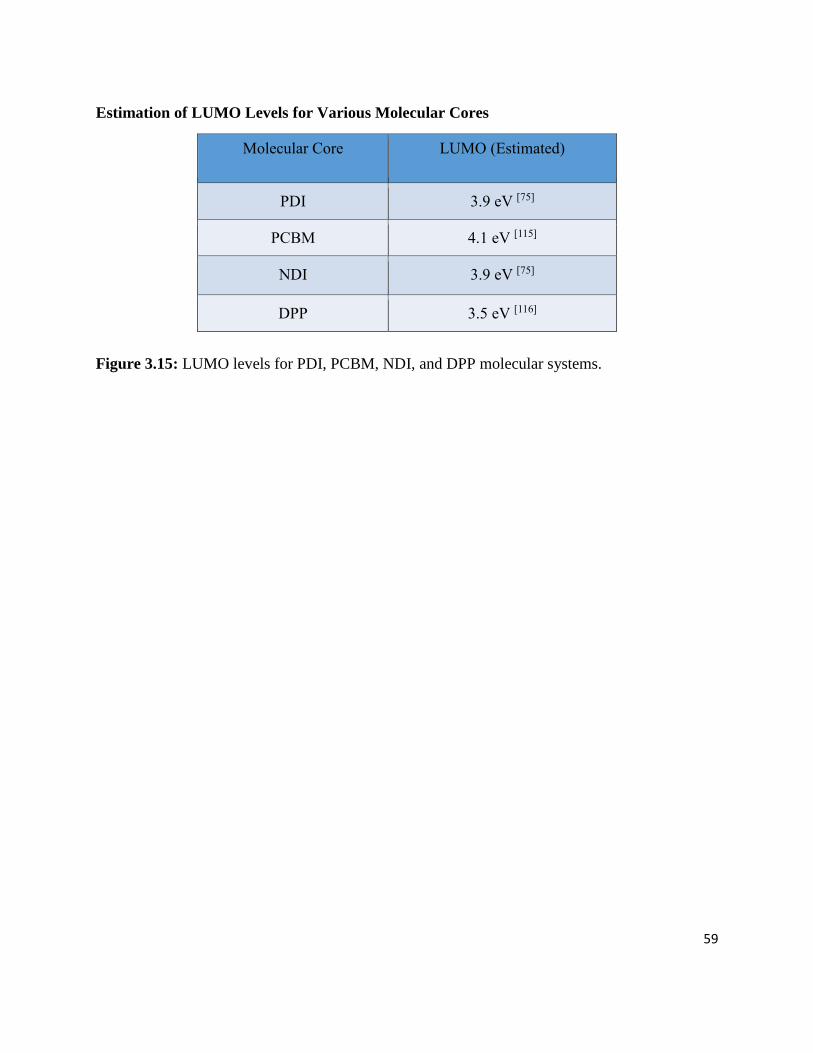
59
Estimation of LUMO Levels for Various Molecular Cores
Molecular Core LUMO (Estimated)
PDI 3.9 eV [75]
PCBM 4.1 eV [115]
NDI 3.9 eV [75]
DPP 3.5 eV [116]
Figure 3.15: LUMO levels for PDI, PCBM, NDI, and DPP molecular systems.

60
Chapter 4. Modulation of n-type electrical transport properties in solution-
processed organic thin films via tunable counterion mediated dopant
activation
Adapted from “Modulation of n-type electrical transport properties in solution-processed organic
thin films via tunable counterion mediated dopant activation,” B. Russ, E.E. Perry, M. Shishido,
M.J. Robb, S.N. Patel, T.E. Mates, J.J Urban, M.L. Chabinyc, C.J. Hawker, R.A. Segalman, with
permission of the authors. Manuscript in preparation (2015).
Innovation of n-type organic electronic materials has been hampered by a shortage of stable
and highly tunable n-type doping strategies compatible with solution-processing. We and others
recently showed the effectiveness of covalently coupling dopants to an electron-deficient aromatic
core using trimethylammonium functionalization with hydroxide counterions linked by alkyl
spacers to a perylene diimide molecule. To expand the utility of this promising n-doping molecular
design strategy, approaches to tune the extent of self-doping are necessary. In this work, we
demonstrate that control of counteranion composition enables a facile methodology for modulating
the charge carrier concentration and electrical conductivity in the solid-state over multiple orders
of magnitude.
4.1 Introduction
Organic materials offer the opportunity for low-cost, large area, and flexible electronic
devices, with possible applications in light emitting devices32-34, photovoltaics26-28, thin film
transistors,29-31 and thermoelectrics.43,56,91,92 To realize the potential of such applications, tunable
hole (p-type) and electron (n-type) doping strategies are imperative. Doping can help fill trap states
to raise effective carrier mobilities as well as increase the density of mobile charge carriers, thereby
boosting electrical conductivity. Additionally, tunable doping aids the alignment of energy levels
at active material interfaces and metal charge injection/extraction contacts, which can help
decrease device operating voltages and optimize open circuit voltages under thermal bias. While
high performing p-type organic materials utilizing effective doping strategies are quickly
advancing, 53,91,93 the low electron affinities of organic semiconductors (3 to 4 eV) have made the
design of stable and solution processable n-doping strategies challenging, and as a result, high
performance n-type materials are scarce.53
Perylene diimides (PDIs) are an attractive class of n-type organic electronic materials with
a low lying LUMO (near -4.0 eV) that promotes electron injection from a variety of metal
electrodes and enables electrochemical stability.29,45,61,82,83 Furthermore, optical and electrical
transport properties of PDIs can be widely tuned through controlled chemical modifications. We
and others recently reported that tethering dopant moieties to the PDI semiconducting core presents
an effective doping strategy, simultaneously enabling solution-processing and dopant localization
in the active matrix and resulting in high electrical performance.59,92 Specifically,
trimethylammonium functional moieties with hydroxide counterions were linked to the PDI using
alkyl spacers. Doping of these water-soluble charged PDIs was accomplished through drying and
a low temperature thermal treatment of cast films. By modifying the alkyl spacer length (from 2
to 6 methylene units), we showed that the electrical properties of the PDI thin films could be

61
enhanced 100-fold to record values for solution processable small molecules (as high as 0.5 S/cm).
The generation of charge carriers was highly effective irrespective of spacer length (n=1020-1021
carriers/cm3). Therefore, the dramatic change in electrical conductivity (𝜎 = 𝑛𝑒𝜇, where e is the
charge constant) was attributed to changes in the apparent mobility (𝜇).
Further investigation into the doping mechanism using these quaternary amine endgroups
revealed that presence of hydroxide anions enables a chemical transformation of quaternary amine
groups into tertiary amine groups, which then leads to doping in the solid state.117 In contrast, no
chemical transformation occurs in the initially quaternized PDI with iodide counteranion (prior to
anion exchange). For a doping strategy to be versatile, it should allow for broad tunability of
electrical properties. We, therefore, sought to develop a way to broadly tune the charge carrier
concentrations and corresponding electrical properties in self-doping materials in the solid state.
In this Communication, we showcase how control of counteranion composition enables the desired
tunability of charge carrier concentration and electrical conductivity over multiple orders of
magnitude.
Figure 4.1: (a) Perylene diimide small molecules with tethered quaternary ammonium endgroups
can be coupled with counteranion of choice (iodide or hydroxide) through ion exchange (b) The
dopant activation strategy in this study harnesses the ability of highly nucleophilic hydroxide
anions (in contrast to iodide anions) to enable chemical transformation of the quaternary endgroup
to a tertiary amine doping group.

62
4.2 Results and Discussion
A perylene diimide derivative, functionalized with six methylene unit spacer groups
between quaternary amine substituents and the PDI core (Figure 4.1a) was prepared and fully
characterized as reported previously.92 Initially the quaternized PDI is coupled with iodide as the
counterion (PDI-I). After counterion exchange, the iodide counterion can be fully exchanged for
hydroxide anion (PDI-OH) using anion exchange resin. The ratio of I¯/ OH¯ in casting solutions
was quantitatively controlled by mixing PDI-I and PDI-OH solutions in appropriate ratios.
In order to characterize the effects of tuning counteranion ratio on electronic properties in
the solid state, thin films were dropcast onto glass substrates with pre-patterned gold contacts for
electrical conductivity measurements (four-point van der Pauw technique) as reported previously.
Samples were cast on silicon for X-ray photoelectron spectroscopy and on quartz for electron
paramagnetic resonance measurements. Cast films were approximately 300-400 nm thick as
characterized by a profilometer (Dektak 150). Films were brought into a glovebox, annealed at
120 oC for 20 minutes and immediately measured.
Controlling the availability of hydroxide anions enables tuning of the electrical
conductivity over two orders of magnitude (Figure 4.2). The hydroxide range was varied between
10% and 100% for electrical conductivity measurements to allow for measurement with the 4-pt
van der Pauw technique. Within this range, the electrical conductivity can be tuned from ~0.003
S/cm to ~0.5 S/cm, achieving the same degree of conductivity modulation previously done by
varying the alkyl spacer between the dopant group and the PDI core without the need for modified
molecular design. The conductivity is seen to asymptote above 50% hydroxide anion
concentration.

63
Figure 4.2: Solid-state thin film electrical conductivity is modulated two orders of magnitude by
tuning the fractional concentration of hydroxide anions available to chemically transform
quaternary endgroups into tethered tertiary amine dopants.
XPS can be used to help further explore the nature of the observed changes in electrical
conductivity. It was previously shown that the presence of hydroxide anions results in a chemical
transformation in the solid-state of quaternary amine groups to tertiary amines preceding charge
transfer. In contrast, no chemical transformation and consequently no doping occurs in the
presence of the less nucleophilic iodide counteranion. This is illustrated in Figure 4.1b. To obtain
insight regarding the extent of the endgroup chemical transformation with varied counteranion
ratio, we probed the nitrogen edge of the X-ray photoelectron spectroscopy. Distinct features for
tertiary amine (400 eV), amide (401 eV), and quaternary amine (402.8 eV) are observed, consistent
with previous observations.117 Comparing the ratio of the tertiary amine peak to the quaternary
amine peak was used as a proxy for endgroup transformation. Controlling the availability of
hydroxide anions enables tuning the extent of chemical transformation of the quaternary endgroups
tethered to PDI. As shown in Figure 4.2 (see Appendix for original XPS spectra), increasing the
fraction of available hydroxide counteranions leads to a monotonic decrease in the amount of
ammonium endgroups left in annealed films and an increase in the amount of tertiary amine groups
present.

64
Figure 4.3: X-ray photoelectron spectroscopy Nitrogen edge 1s spectra quantification. The
fraction of quaternary and tertiary amine nitrogen signal are quantified for samples containing a
varied fraction of hydroxide/iodide counteranion. Increased fraction of hydroxide anion leads to
an increased fractional conversion of quaternary endgroups into tertiary amine endgroups.
Varying the fraction of tertiary amine groups present is expected to tune the charge carrier
concentration in the thin films. Optical spectroscopy supports this hypothesis. A comparison of
PDI-I/PDI-OH films containing 0, 10, 25, 50, 75, and 100% hydroxide anion fraction is shown in
in Figure 4.3a. The UV-VIS-NIR absorption spectra of samples containing varied counteranion
ratios have similar optical transitions in the visible range and three characteristic peaks in the
visible-near infrared region (~730 nm, 790 nm, and 1050 nm) representative of the PDI anion
(polaron charge carriers).59,92 With increasing ratio of the hydroxide anion, the intensity of the
polaron peaks increases. Electron paramagnetic resonance measurements are consistent with the
UV-VIS-NIR spectra showing an increased intensity of the polaron peaks with increased
hydroxide fraction. EPR quantification was performed following a previously reported protocol;
the charge carrier concentration is increased from ~1016 carriers/cm-3 in pure PDI-I samples to 1018
carriers/cm3 with the presence of 10 mol% hydroxide anion fraction and then asymptotes to ~1020
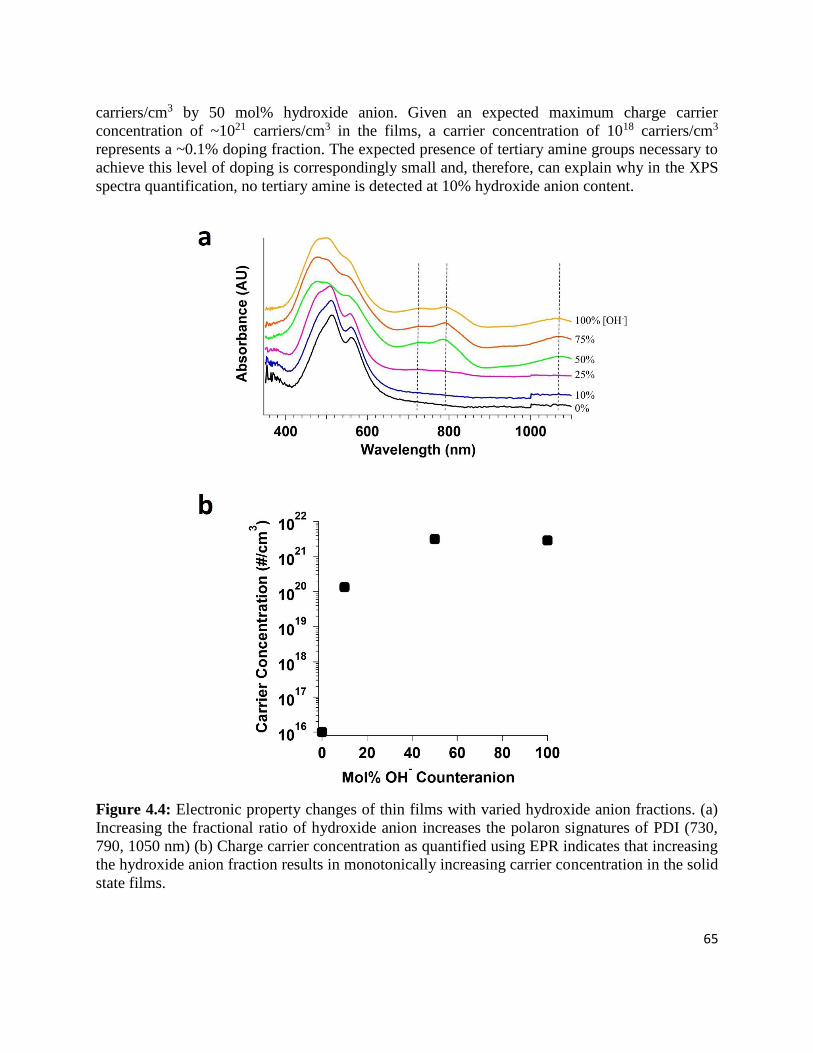
65
carriers/cm3 by 50 mol% hydroxide anion. Given an expected maximum charge carrier
concentration of ~1021 carriers/cm3 in the films, a carrier concentration of 1018 carriers/cm3
represents a ~0.1% doping fraction. The expected presence of tertiary amine groups necessary to
achieve this level of doping is correspondingly small and, therefore, can explain why in the XPS
spectra quantification, no tertiary amine is detected at 10% hydroxide anion content.
Figure 4.4: Electronic property changes of thin films with varied hydroxide anion fractions. (a)
Increasing the fractional ratio of hydroxide anion increases the polaron signatures of PDI (730,
790, 1050 nm) (b) Charge carrier concentration as quantified using EPR indicates that increasing
the hydroxide anion fraction results in monotonically increasing carrier concentration in the solid
state films.

66
4.3 Conclusions
The findings in this Communication demonstrate that control of counteranion composition
enables a useful methodology for tuning electrical properties of self-doping materials in the solid-
state. Utilizing this approach, we demonstrate that the charge carrier concentration and the
electrical conductivity can be modulated over two orders of magnitude by tuning the percent
fraction of hydroxide anion from 10% to 100% in perylene diimide based thin films coupled with
quaternary ammonium functional groups. The added tunability in regulating electrical transport
properties helps expand the utility of an already promising molecular design strategy for n-type
organic electronic materials.
4.4 Acknowledgements
This work was funded by the AFOSR MURI program under FA9550-12-1-0002. Portions
of this research were carried out at the Molecular Foundry, a Lawrence Berkeley National
Laboratory user facility supported by the Office of Science, Office of Basic Energy Sciences, U.S.
Department of Energy, under Contract DE-AC02-05CH11231. Portions of this work were
performed at the MRL Shared Experimental Facilities, which are supported by the MRSEC
Program of the NSF under Award No. DMR 1121053; a member of the NSF-funded Materials
Research Facilities Network (www.mrfn.org). B.R. gratefully acknowledges the Department of
Defense for fellowship support through the National Defense Science and Engineering Graduate
Fellowship (DOD-NDSEG). M.J.R. thanks UC Regents, CSP Technologies, and the Department
of Energy Office of Science (DOE-SCGF) for graduate fellowships.
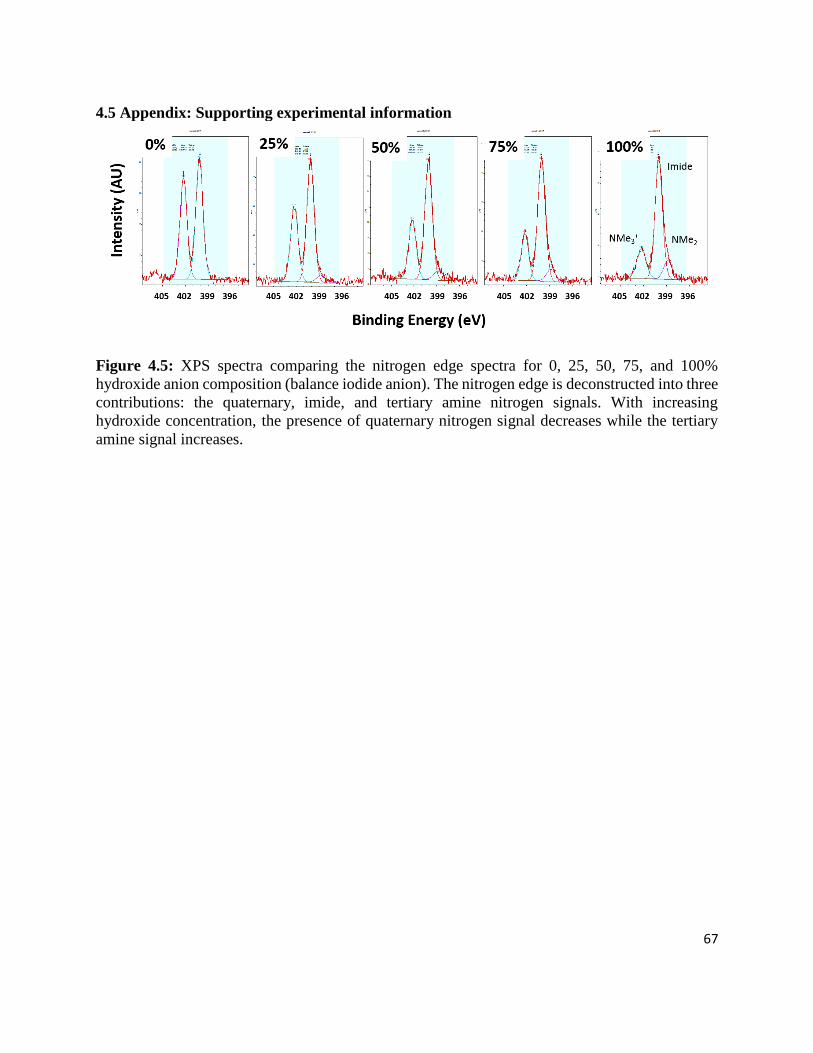
67
4.5 Appendix: Supporting experimental information
Figure 4.5: XPS spectra comparing the nitrogen edge spectra for 0, 25, 50, 75, and 100%
hydroxide anion composition (balance iodide anion). The nitrogen edge is deconstructed into three
contributions: the quaternary, imide, and tertiary amine nitrogen signals. With increasing
hydroxide concentration, the presence of quaternary nitrogen signal decreases while the tertiary
amine signal increases.

68
Chapter 5. Enhanced thermoelectric power factor in n-type organic
semiconductor thin films by combining extrinsic and self-doping strategies
Adapted from “Enhanced thermoelectric power factor in n-type organic semiconductor thin films
by combining extrinsic and self-doping strategies,” B. Russ, E.E. Perry, M.J. Robb, S.N. Patel, J.J
Urban, M.L. Chabinyc, C.J. Hawker, R.A. Segalman, with permission of the authors. Manuscript
in preparation (2015).
5.1 Introduction
With potential to enable low-cost, flexible, and large area modules, organic thermoelectrics
are an area of rapidly growing research interest.35,64 Thermoelectric performance is captured by
the figure of merit, ZT=S2σ/(κT), where the Seebeck coefficient, S, and the electrical conductivity,
σ, define the power factor, S2σ, and, κ is the thermal conductivity. To realize efficient modules,
complimentary, high performance, hole transporting (p-type) and electron transporting (n-type)
materials are necessary, connected electrically in series and thermally in parallel. The thermal
conductivity in organics is generally low, focusing the performance design challenge for organic
thermoelectrics on enhancing the power factor. While performance of p-type organic
thermoelectrics has rapidly advanced,35,69 the low electron affinities of organic semiconductors (3
to 4 eV) have impeded the development of solution processable n-doping strategies, and as a result,
few high performance n-type organic thermoelectric materials have been reported38,42,92 Of these
materials, powder-processed organometallic poly(Ni 1,1,2,2-ethenetetrathiolate) derivatives have
demonstrated the highest performance with electrical conductivities as high as 40 S/cm and power
factors up to 70 μWm−1K−2.42 However, these materials are not solution-processable. Very
recently, Shi et al. reported promising solution-processable conjugated polymer options of air-
stable BDPPV derivatives showing remarkable n-type performance of 14 S/cm and power factors
as high as 28 μW m−1K−2 when doped with the extrinsic dopant N-DMBI ((4-(1,3-dimethyl-2,3-
dihydro-1Hbenzoimidazol-2-yl)phenyl)dimethylamine), in solution.40 In this manuscript, we use
perylene diimides as an alternative n-type molecular architecture to demonstrate a powerful new
approach to solution-processable doping by combining tunable extrinsic doping with molecularly
designed tethered doping to enable complimentary performance enhancements.
The perylene diimide architecture has been widely studied and is known to offer ease of
synthesis, low cost, and optical and electrical transport properties that can be broadly tuned through
controlled chemical transformations.45 The low lying LUMO (near 4.0 eV) enables electron
injection from a variety of metals and provides electrochemical stability.29,61 Furthermore, water
soluble derivatives can be accessed through simple chemical modifications of the PDI core,
enabling a pathway toward facile solution-processing of thin films.86,87
We recently reported that tethering dopant moieties to the PDI semiconducting core
presents an effective doping strategy, simultaneously enabling solution-processing and

69
localization of the dopants in the active matrix and resulting in enhanced thermoelectric
performance.92 Specifically, trimethylammonium functional moieties with hydroxide counterions
were coupled to perylene diimide (PDI) using alkyl spacers. Doping of these water-soluble charged
PDIs was accomplished through drying and a low temperature thermal treatment of cast films,
resulting in exceptional charge carrier densities in the solid-state (1020-1021 carriers/cm3) and
record performance for n-type small molecule thermoelectrics (electrical conductivity of 0.5 S/cm
and a power factor of 1.4 μW/mK2).
More recently, we showed that the self-doping using tethered trimethylammonium
functional groups occurs only upon a chemical transformation in the solid-state and not in
solution.117 In contrast, traditional extrinsic dopants generally induce doping in solution prior to
thin film deposition. To aid the design of future thermoelectric systems, we sought to determine if
integrating extrinsic doping with solution-processable self-doping materials can promote a
pathway for performance enhancements. In this Communication, we show the synergistic effects
of using traditional extrinsic doping employing a prototypical chemical dopant, the reducing agent,
hydrazine hydrate (Scheme 5.1), which has been shown previously to effectively dope PDIs in
solution and solid-state,118 in combination with a self-doping charged PDI derivative (Scheme 5.1,
PDI-OH). Critically, we find that the combined doping strategy results in highly improved
electrical conductivity and power factor for PDI thermoelectric based materials (exceeding 1.3
S/cm and 3.4 μW/mK2, respectively), which is ~2.5 times better than previously reported with this
system.
A functionalized perylene diimide derivative containing six methylene spacer groups
between quaternary amine substituents and the PDI nucleus (Scheme 5.1) was prepared and fully
characterized following previously reported methodologies.92 Hydrazine hydrate was used as
received.
Scheme 5.1: Functionalized perylene diimide with tethered trimethylammonium cations coupled
with hydroxide counterion. This tethered functionality is responsible for self-doping in the solid-
state. Hydrazine hydrate was used as a secondary (extrinsic) dopant in this study.

70
5.2 Results and Discussion
To investigate the effects of doping on the thermoelectric properties of the PDI materials,
thin films were dropcast onto glass substrates with pre-patterned gold contacts (details on
processing and measurements are found in the Experimental section). Extrinsic chemical doping
with hydrazine hydrate facilitates beneficial effects on the thermoelectric behavior of the solid-
state system as shown in Figure 5.1 with no thermal treatments necessary after thin film drying.
Increasing the concentration of hydrazine hydrate in the PDI solution leads to ~7x increase in
electrical conductivity compared to as-cast PDI-OH and leads to a ~3x increase in conductivity
over thermally processed samples reported previously,92 peaking at ~1.4 S/cm (Figure 5.1a) at a
1:4 hydrazine hydrate:PDI (HH:PDI) molar ratio. Above a 1:4 HH:PDI ratio, presence of
additional dopant decreases the overall conductivity. The measured Seebeck coefficient is
negative, confirming n-type electrical transport is dominant, as expected. With added hydrazine
hydrate up to the 1:4 HH:PDI molar ratio, a decrease in the magnitude of the Seebeck coefficient
is observed from ~230 μV/K to ~160 μV/K (Figure 5.1b). For extrinsic dopant ratios greater than
1:4 HH:PDI in the system, the Seebeck coefficient appears to plateau at ~160 μV/K. Combined,
the electrical conductivity and thermopower properties yield a peak power factor of ~3.4 μW/mK2
(Figure 5.1c), which is also ~2.5x higher than achieved with self-doping alone.
Figure 5.1: (a) Extrinsic doping with hydrazine hydrate leads to ~7-fold enhancement in electrical
conductivity compared to as-cast thin films. (b) With increasing concetration of hydrazine hydrate,
the Seebeck coefficient initially decreases in magnitude before plateauing. (c) Optimal doping
boosts the corresponding thermoelectric power factor ~2.5-fold.
The initial anti-correlated relationship between conductivity and Seebeck coefficient is
commonly observed in thermoelectrics when modulating the charge carrier concentration. To
confirm the nature of the charge carriers and possible changes in their concentration with added
hydrazine hydrate concentration, UV-VIS-NIR absorption spectra of PDI-OH films doped to
different extents were collected on cast samples. As shown in Figure 5.2a, all doped samples have
similar optical transitions in the visible range and three characteristic peaks in the visible-near
infrared region (~730 nm, 790 nm, and 1050 nm) representative of the PDI anion (polaron charge
carriers).59,89 Furthermore, a characteristic bipolaron peak at ~ 610 nm is absent, consistent with

71
the view that single polarons dominate charge transport. As seen by the optical spectra of doped
PDI with hydrazine hydrate, the intensity of the polaron peaks increases with added hydrazine
hydrate. For reference, the intensity of the polaron peak at 790 nm is plotted relative to the intensity
of a peak associated with the PDI core at 490 nm, showing an increasing relative polaron intensity
with increasing secondary doping fraction (Figure 5.2a, inset). The growing carrier concentration
with added secondary dopant concentration observed with optical spectroscopy is consistent with
the anti-correlated trend in electrical properties observed at low secondary dopant loadings.
Quantified charge concentrations using electron paramagnetic resonance (EPR) were also in
agreement with the optical spectroscopy observations, indicating that the doping concentrations
are large (1020-1021) at all doping concentrations of hydrazine hydrate (even beyond a 1:4 HH:PDI
molar ratio). Furthermore, the doping approach is highly stable in air, exemplified by the high
charge concentrations retained in the thin films after one week of air exposure.
Figure 5.2: Optical absorption and charge carrier concentration for PDI-OH thin films doped with
increasing concentration of hydrazine hydrate. (a) Absorption spectra of doped films shows
increased polaron peak intensities with increased concentration of dopant; (inset) intensity of a
characteristic PDI polaron absorption peak (@790nm is plotted relative to a core PDI peak
@480nm as a function of increasing dopant concentration. (b) Charge carrier concentration, as
quantified using electron paramagnetic resonance, in the doped PDI-OH samples is around ~1021
electrons/cm3. In a testament to the air stability of these materials, the samples retain ~ 1020
electrons/cm3after one week of exposure to air.
The nonstandard correlation of electrical conductivity and the Seebeck coefficient at
doping concentrations above a 1:4 HH:PDI molar ratio, showing a decoupling of the Seebeck
coefficient and the electrical conductivity, hints that the turnover in performance observed in the
co-doped system may result from changes in the thin film morphology that deleteriously impacting
electrical conductivity by modifying the apparent thin film electron mobility (σ=neμ, where n is
the charge carrier density, μ, the mobility, and, e, the elementary charge constant). We previously
observed similar decoupling upon modifying the side chain alkyl spacer length of the self-doping
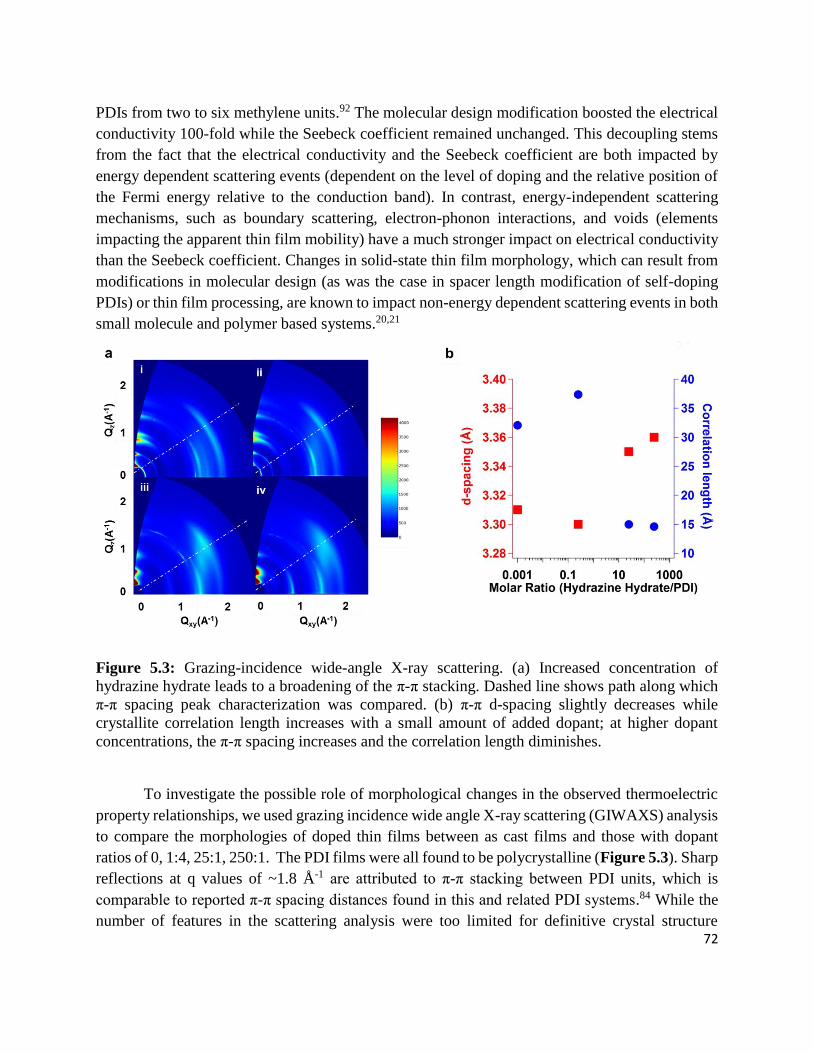
72
PDIs from two to six methylene units.92 The molecular design modification boosted the electrical
conductivity 100-fold while the Seebeck coefficient remained unchanged. This decoupling stems
from the fact that the electrical conductivity and the Seebeck coefficient are both impacted by
energy dependent scattering events (dependent on the level of doping and the relative position of
the Fermi energy relative to the conduction band). In contrast, energy-independent scattering
mechanisms, such as boundary scattering, electron-phonon interactions, and voids (elements
impacting the apparent thin film mobility) have a much stronger impact on electrical conductivity
than the Seebeck coefficient. Changes in solid-state thin film morphology, which can result from
modifications in molecular design (as was the case in spacer length modification of self-doping
PDIs) or thin film processing, are known to impact non-energy dependent scattering events in both
small molecule and polymer based systems.20,21
Figure 5.3: Grazing-incidence wide-angle X-ray scattering. (a) Increased concentration of
hydrazine hydrate leads to a broadening of the π-π stacking. Dashed line shows path along which
π-π spacing peak characterization was compared. (b) π-π d-spacing slightly decreases while
crystallite correlation length increases with a small amount of added dopant; at higher dopant
concentrations, the π-π spacing increases and the correlation length diminishes.
To investigate the possible role of morphological changes in the observed thermoelectric
property relationships, we used grazing incidence wide angle X-ray scattering (GIWAXS) analysis
to compare the morphologies of doped thin films between as cast films and those with dopant
ratios of 0, 1:4, 25:1, 250:1. The PDI films were all found to be polycrystalline (Figure 5.3). Sharp
reflections at q values of ~1.8 Å-1 are attributed to π-π stacking between PDI units, which is
comparable to reported π-π spacing distances found in this and related PDI systems.84 While the
number of features in the scattering analysis were too limited for definitive crystal structure

73
assignment, the separation distances of the π-π stacking is observed to increase as the dopant
concentration exceeds 1:4 ratio of dopant to PDI. Applying the Scherrer formula (l =2πK/Δq,
where the shape factor, K, is ~ 0.9) to the GIWAXS peak broadening observed in these materials
(Δq), the correlation lengths (l) are estimated to be 32.1 Å, 37.4 Å, 15.0 Å, and 14.6 Å,
respectively.84 As reported previously, the domains in these thin films are hundreds of nanometers
to microns in size suggesting that transport in these materials is most likely limited by intra-
crystalline defects.92 The increase in π-π separation distance and simultaneous decrease in the
correlation length suggest increased energetic barriers for charge transport, which is consistent
with the observed changes in electrical conductivity. Interestingly, presence of a low concentration
of secondary dopant resulted in a decrease in the π-π spacing distances and increase the structural
correlation length of the crystallites.
The observed changes in molecular packing upon co-doping may be related to both thin
film processing and the charge density in solid state. Firstly, the generation of doped complexes in
solution upon solution-doping can change the extent of molecular aggregation in solution, which
in turn can affect the thin film morphological assembly and electronic properties. Furthermore, the
observed change in molecular packing (the π-π spacing distances and correlation lengths) may be
the result of an excessive charge carrier concentration. Gregg et al. previously observed a similar
turnover in electrical conductivity when electrochemically doping PDI materials.89 The authors
attributed this turnover to increased repulsion between a high concentration of charged PDI
molecules in a low dielectric environment.
5.3 Conclusions
The findings in this Communication demonstrate that coupling strategies of extrinsic and
self-doping can be used to enhance performance of n-type organic solution-processable
thermoelectric materials. Utilizing this approach, we demonstrate record electronic properties and
power factor in perylene diimide based thin films. We highlight that care must be taken to ensure
optimal level of secondary dopant is introduced not only to reinforce charge carrier concentrations
but also achieve optimal molecular packing to maximize apparent thin film mobility in boosting
thermoelectric performance. Combining solution and solid-state doping strategies offers a
powerful design handle in the development of active materials for all solution-processed flexible
thermoelectric devices.
5.4 Experimental
PDI synthesis. PDI-OH was prepared and characterized as previously reported. Hydrazine hydrate
solution was acquired from Sigma (78-82% solution, #18412) used without further purification,
and diluted with DI water as necessary.

74
Film Preparation. Films were dropcast on glass substrates (1 cm x 1 cm, 1 mm thick). The
substrates were pre-cleaned by sonicating in successive baths: 1% aqueous Hellmanex soap
solution (Sigma), water, acetone, and isopropyl alcohol for 10 minutes. Four gold electrical
measurement contact pads (100 nm thick on top of 5 nm of chromium adhesion layer) were then
deposited near the corners using a shadow mask in a thermal evaporator. After gold deposition,
the substrate cleaning sequence was repeated and additionally the washed substrates were treated
with O2-plasma (Harrick Plasma Cleaner PDC-32G) for 15 minutes to improve wettability
immediately before film deposition. Solutions of doped PDI with proper hydrazine hydrate fraction
mixed in were prepared and films were dropcast (70 µl, ~1-3 mg/ml) at 75 oC on a leveled hotplate
and kept covered to control evaporation. Cast films were approximately 300-400 nm thick as
characterized by a profilometer (Dektak 150). Films were brought into a glovebox and
immediately measured without additional thermal treatment.
Electrical Transport Measurements. Electrical measurements were obtained as previously
reported.39 Specifically, the four-point van der Pauw technique was used to acquire in-plane
electrical conductivity measurements. Electrical contacts to the Au bottom contact pads were made
using Tungsten tipped micromanipulators to puncture through the films to the pads underneath.
To measure the thermopower, the substrate was suspended between two temperature-controlled
Peltier stages (separated ~3 mm). A small temperature difference was then applied between the
stages (-20 oC to +20 oC). Thermal grease was utilized to enable good thermal contact. Using
micromanipulators with tungsten probe tips, the thermoelectric voltage established between two
Au contact pads on separate stages was recorded. Simultaneously, the temperature of each pad was
monitored with a (K-type) thermocouple close to the Tungsten probe tip. Three to five identical
samples from the same solution were prepared to capture the reported sample-to-sample variations
of these materials. The established thermoelectric voltage versus temperature differences always
resulted in a linear correlation, yielding a negative thermopower (e.g., S = -dV/dT) for all samples.
Other Characterization. Thin film absorption was measured using a Cary 50 UV-VIS-NIR
spectrometer. EPR was performed on a Bruker EMX with samples being cast on quartz substrates
and treated identically to electrical measurement samples. Charge quantification was performed as
previously reported. To probe air stability of the doped materials, initially measured EPR samples
were stored in air for one week and reanalyzed. GIWAXS was performed at Stanford Synchrotron
Radiation Lightsource beamline 11–3 using a photon energy of 12.7 keV, a MAR345 image plate
area detector, and a helium filled sample chamber. The incidence angle was optimized to enhance
scattering from the film and minimize substrate scattering. For GIWAXS measurements films were
dropcast on Si wafers from identical solutions and handled the same as films used for electrical
measurements.

75
5.4 Acknowledgements
This work was funded by the AFOSR MURI program under FA9550-12-1-0002. Portions of
this research were carried out at the Molecular Foundry, a Lawrence Berkeley National Laboratory
user facility supported by the Office of Science, Office of Basic Energy Sciences, U.S. Department
of Energy, under Contract DE-AC02-05CH11231. Portions of this work were performed at the
MRL Shared Experimental Facilities, which are supported by the MRSEC Program of the NSF
under Award No. DMR 1121053; a member of the NSF-funded Materials Research Facilities
Network (www.mrfn.org). GIWAXS studies were performed at the Stanford Synchrotron
Radiation Lightsource (beamline 11-3), a Directorate of SLAC National Accelerator Laboratory
and an Office of Science User Facility operated for the U.S. Department of Energy Office of
Science by Stanford University. B.R. gratefully acknowledges the Department of Defense for
fellowship support through the National Defense Science and Engineering Graduate Fellowship
(DOD-NDSEG). M.J.R. thanks UC Regents, CSP Technologies, and the Department of Energy
Office of Science (DOE-SCGF) for graduate fellowships.

76
Chapter 6. Conclusions and Future Outlook
Wearable technologies and the personalization of low power sensor applications are
spurring a search for new power generation solutions as well as opening up novel approaches to
thermal management. Flexible organic thermoelectrics are poised to meet both these technological
challenges. Thermoelectric materials can convert thermal energy directly into electrical energy or,
alternatively, induce solid-state heating or cooling under electrical bias. Building efficient
thermoelectric architectures requires complementary p-type (hole transporting) and n-type
(electron transporting) components, yet while high performance hole-transporting organic systems
are ready for the task, a scarcity of stable high performing n-type materials has been a roadblock
to realizing the potentials of organic thermoelectrics devices. Throughout this dissertation, we have
focused on developing design rules for improved n-type organic materials using the perylene
diimide (PDI) molecular motif as an n-type organic model system, whose molecular structure and
electronic properties can be easily tuned.
In Chapter 2, we demonstrate that the air-stable PDI core is amenable to synthetic
modification that enables solution-processing, enhanced molecular assembly, and efficient charge
carrier generation. To do this, we used trimethylammonium functionalization with hydroxide
counterions, tethered to a perylene diimide core by alkyl spacers. We show that modifications of
the side chain can improve thin film thermoelectric properties; by changing the length of the alkyl
spacer between the charged end groups and the PDI core, electrical properties are dramatically
increased through morphology-induced enhancements in the thin film effective electron mobility.
In Chapter 3, a deeper exploration of the underlying doping mechanism, by complementing
thermoelectric, chemical, optical, and structural characterization, reveals that a chemical
transformation in the charged end groups from quaternary amines to tertiary amine endgroups
upon thin film drying is critical to enabling charge carrier generation in the self-doping materials
in the solid-state. Furthermore, we show that doping using tethered functionality is highly
generalizable to other n-type small molecule systems of interest, including naphthalene diimides,
diketopyrrolopyrroles, and PCBM. In Chapter 4, we show how the insight into the doping
mechanism established in Chapter 3 enables a simple strategy to tune charge carrier concentration
in charged self-doping material through control of anion composition. In Chapter 5, we
demonstrate a novel doping approach that combines self-doping with extrinsic chemical doping to
create synergistic enhancements in thermoelectric performance. The top derivatives in our study
demonstrated the highest electrical conductivities and power factors reported for solution-
processed films of n-type small molecules.
Our findings craft promising molecular design strategies for future enhancements in the
thermoelectric performance of n-type materials. Given the highly efficient nature of the doping in
these materials, future performance enhancements are likely to be realized by focusing on
improvements in thin film mobility. Both directed solution processing techniques as well as
rational synthetic modifications of the side chains extending from the imide positions or at the bay
positions may prove helpful in this endeavor. Extending the degree of conjugation by coupling
small molecules into oligomers or polymers with the self-doping PDI scaffold also offers exciting
opportunities to enhance processing and performance. Coupling the advances in these n-type
system with complementary p-type organic materials may soon bring to fruition the realization of

77
fully solution-processable organic thermoelectric modules and their integration into applications
compatible with wearable technologies.

78
Chapter 7. References
1 Melnick, J. Dial-Up Sensors: Printed, Flexible, and Organic Sensors for the Things in the
Internet of Things. Lux Research Market Report; https://portal.luxresearchinc.com/
(2014).
2 Energy, U. D. o. Information on Heating and Cooling http://energy.gov/public-
services/homes/heating-cooling.
3 Shakouri, A. Recent Developments in Semiconductor Thermoelectric Physics and
Materials. Annual Review of Materials Research 41, 399-431, doi:doi:10.1146/annurev-
matsci-062910-100445 (2011).
4 Rowe, D. M. Thermoelectrics handbook: macro to nano. (CRC press, 2005).
5 Snyder, G. J. & Toberer, E. S. Complex thermoelectric materials. Nat Mater 7, 105-114,
doi:10.1038/nmat2090 (2008).
6 Sangi Reddy, P. R. Transport of charge and energy in metal-molecule-metal junctions,
Univ. of California, Berkeley, (2007).
7 Wang, R. Y.-S. Energy transport and conversion in nanostructured materials,
University of California, Berkeley, (2008).
8 Yee, S. K. Development of Organic-Inorganic Hybrid Thermoelectrics, Univ. of
California, Berkeley, (2013).
9 Kittel, C. Introduction to solid state physics. (Wiley, 2005).
10 Vineis, C. J., Shakouri, A., Majumdar, A. & Kanatzidis, M. G. Nanostructured
thermoelectrics: big efficiency gains from small features. Adv Mater 22, 3970-3980,
doi:10.1002/adma.201000839 (2010).
11 Cahill, D. G. et al. Nanoscale thermal transport. J Appl Phys 93, 793-818,
doi:doi:http://dx.doi.org/10.1063/1.1524305 (2003).
12 Liu, J. et al. Thermal Conductivity and Elastic Constants of PEDOT:PSS with High
Electrical Conductivity. Macromolecules 48, 585-591, doi:10.1021/ma502099t (2015).
13 Gibson, A. G., Greig, D., Sahota, M., Ward, I. M. & Choy, C. L. Thermal conductivity of
ultrahigh-modulus polyethylene. Journal of Polymer Science: Polymer Letters Edition 15,
183-192, doi:10.1002/pol.1977.130150401 (1977).

79
14 Ju, Y. S., Kurabayashi, K. & Goodson, K. E. Thermal characterization of anisotropic thin
dielectric films using harmonic Joule heating. Thin Solid Films 339, 160-164,
doi:http://dx.doi.org/10.1016/S0040-6090(98)01328-5 (1999).
15 Bubnova, O. et al. Semi-metallic polymers. Nat Mater 13, 190-194 (2014).
16 Park, T., Park, C., Kim, B., Shin, H. & Kim, E. Flexible PEDOT electrodes with large
thermoelectric power factors to generate electricity by the touch of fingertips. Energy &
Environmental Science 6, 788-792, doi:10.1039/C3EE23729J (2013).
17 Chen, G. Nanoscale energy transport and conversion: a parallel treatment of electrons,
molecules, phonons, and photons. (Oxford University Press, USA, 2005).
18 Mahan, G. & Woods, L. Multilayer thermionic refrigeration. Phys Rev Lett 80, 4016
(1998).
19 Vashaee, D. & Shakouri, A. Improved thermoelectric power factor in metal-based
superlattices. Phys Rev Lett 92, 106103-106103 (2004).
20 Yee, S. K., Coates, N. E., Majumdar, A., Urban, J. J. & Segalman, R. A. Thermoelectric
power factor optimization in PEDOT:PSS tellurium nanowire hybrid composites. Phys
Chem Chem Phys 15, 4024-4032, doi:Doi 10.1039/C3cp44558e (2013).
21 Yoon, C. O., Reghu, M., Moses, D., Heeger, A. J. & Cao, Y. Electrical-Transport in
Conductive Blends of Polyaniline in Poly(Methyl Methacrylate). Synthetic Met 63, 47-52,
doi:Doi 10.1016/0379-6779(94)90247-X (1994).
22 Minder, N. A., Ono, S., Chen, Z., Facchetti, A. & Morpurgo, A. F. Band-like electron
transport in organic transistors and implication of the molecular structure for performance
optimization. Adv Mater 24, 503-508, doi:10.1002/adma.201103960 (2012).
23 Coropceanu, V. et al. Charge transport in organic semiconductors. Chem Rev 107, 926-
952, doi:10.1021/cr050140x (2007).
24 Shakouri, A. & Li, S. in Thermoelectrics, 1999. Eighteenth International Conference on.
402-406 (IEEE).
25 Mele, G. & Epstein, A. Special issue - Celebrating the year 2000 Nobel Prize in Chemistry
to Alan Heeger, Alan MacDiarmid and Hideki Shirakawa for the discovery and
development of conductive polymers - Foreword. Synthetic Met 125, 1-1, doi:Doi
10.1016/S0379-6779(01)00506-9 (2001).
26 Bredas, J. L., Norton, J. E., Cornil, J. & Coropceanu, V. Molecular Understanding of
Organic Solar Cells: The Challenges. Accounts Chem Res 42, 1691-1699, doi:Doi
10.1021/Ar900099h (2009).

80
27 Li, G., Zhu, R. & Yang, Y. Polymer solar cells. Nat Photonics 6, 153-161, doi:Doi
10.1038/Nphoton.2012.11 (2012).
28 Lin, Y. Z., Li, Y. F. & Zhan, X. W. Small molecule semiconductors for high-efficiency
organic photovoltaics. Chem Soc Rev 41, 4245-4272, doi:Doi 10.1039/C2cs15313k (2012).
29 Anthopoulos, T. D. et al. Air-stable complementary-like circuits based on organic
ambipolar transistors. Adv Mater 18, 1900-+, doi:DOI 10.1002/adma.200502677 (2006).
30 Dimitrakopoulos, C. D. & Malenfant, P. R. L. Organic thin film transistors for large area
electronics. Adv Mater 14, 99-+, doi:Doi 10.1002/1521-4095(20020116) (2002).
31 Wei, P., Oh, J. H., Dong, G. F. & Bao, Z. N. Use of a 1H-Benzoimidazole Derivative as an
n-Type Dopant and To Enable Air-Stable Solution-Processed n-Channel Organic Thin-
Film Transistors. Journal of the American Chemical Society 132, 8852-+, doi:Doi
10.1021/Ja103173m (2010).
32 Forrest, S. R. The path to ubiquitous and low-cost organic electronic appliances on plastic.
Nature 428, 911-918, doi:Doi 10.1038/Nature02498 (2004).
33 Friend, R. H. et al. Electroluminescence in conjugated polymers. Nature 397, 121-128,
doi:10.1038/16393 (1999).
34 Huang, J. S., Li, G., Wu, E., Xu, Q. F. & Yang, Y. Achieving high-efficiency polymer
white-light-emitting devices. Adv Mater 18, 114-117, doi:DOI 10.1002/adma.200501105
(2006).
35 Bubnova, O. & Crispin, X. Towards polymer-based organic thermoelectric generators.
Energy & Environmental Science 5, 9345-9362, doi:Doi 10.1039/C2ee22777k (2012).
36 Chen, Y., Zhao, Y. & Liang, Z. Solution processed organic thermoelectrics: towards
flexible thermoelectric modules. Energy & Environmental Science 8, 401-422,
doi:10.1039/C4EE03297G (2015).
37 Zhang, Q., Sun, Y., Xu, W. & Zhu, D. Organic thermoelectric materials: emerging green
energy materials converting heat to electricity directly and efficiently. Adv Mater 26, 6829-
6851, doi:10.1002/adma.201305371 (2014).
38 Schlitz, R. A. et al. Solubility-Limited Extrinsic n-Type Doping of a High Electron
Mobility Polymer for Thermoelectric Applications. Adv Mater 26, 2825-2830 (2014).
39 See, K. C. et al. Water-Processable Polymer-Nanocrystal Hybrids for Thermoelectrics.
Nano Lett 10, 4664-4667, doi:Doi 10.1021/Nl102880k (2010).
81
40 Shi, K. et al. Toward High Performance n-Type Thermoelectric Materials by Rational
Modification of BDPPV Backbones. Journal of the American Chemical Society 137, 6979-
6982, doi:10.1021/jacs.5b00945 (2015).
41 Sumino, M. et al. Thermoelectric properties of n-type C-60 thin films and their application
in organic thermovoltaic devices. Appl Phys Lett 99, doi:10.1063/1.3631633 (2011).
42 Sun, Y. M. et al. Organic thermoelectric materials and devices based on p- and n-type
Poly(metal 1,1,2,2-ethenetetrathiolate)s (vol 24, pg 932, 2012). Adv Mater 24, 1781-1781,
doi:DOI 10.1002/adma.201290076 (2012).
43 Yu, C. H., Murali, A., Choi, K. W. & Ryu, Y. Air-stable fabric thermoelectric modules
made of N- and P-type carbon nanotubes. Energy & Environmental Science 5, 9481-9486
(2012).
44 Cheng, Y.-J., Yang, S.-H. & Hsu, C.-S. Synthesis of Conjugated Polymers for Organic
Solar Cell Applications. Chem Rev 109, 5868-5923, doi:10.1021/cr900182s (2009).
45 Anthony, J. E., Facchetti, A., Heeney, M., Marder, S. R. & Zhan, X. n-Type organic
semiconductors in organic electronics. Adv Mater 22, 3876-3892,
doi:10.1002/adma.200903628 (2010).
46 Freund, M. S. & Deore, B. A. Self-doped conducting polymers. (John Wiley & Sons,
2007).
47 Sirringhaus, H. et al. High-Resolution Inkjet Printing of All-Polymer Transistor Circuits.
Science 290, 2123-2126, doi:10.1126/science.290.5499.2123 (2000).
48 Hains, A. W., Liang, Z. Q., Woodhouse, M. A. & Gregg, B. A. Molecular Semiconductors
in Organic Photovoltaic Cells. Chem Rev 110, 6689-6735, doi:10.1021/cr9002984 (2010).
49 Bredas, J. L. & Street, G. B. POLARONS, BIPOLARONS, AND SOLITONS IN
CONDUCTING POLYMERS. Accounts Chem Res 18, 309-315,
doi:10.1021/ar00118a005 (1985).
50 Arkhipov, V. I., Emelianova, E. V., Heremans, P. & Bässler, H. Analytic model of carrier
mobility in doped disordered organic semiconductors. Physical Review B 72, 235202
(2005).
51 Emin, D. Pair breaking in semiclassical singlet small-bipolaron hopping. Physical Review
B 53, 1260-1268 (1996).
52 Bernard, M. & Hugot-Le Goff, A. Quantitative characterization of polyaniline films using
Raman spectroscopy: II. Effects of self-doping in sulfonated polyaniline. Electrochimica
Acta 52, 728-735 (2006).
82
53 Lussem, B., Riede, M. & Leo, K. Doping of organic semiconductors. Phys Status Solidi A
210, 9-43, doi:DOI 10.1002/pssa.201228310 (2013).
54 Hains, A. W., Liang, Z., Woodhouse, M. A. & Gregg, B. A. Molecular semiconductors in
organic photovoltaic cells. Chem Rev 110, 6689-6735, doi:10.1021/cr9002984 (2010).
55 Zhou, Y. et al. A universal method to produce low-work function electrodes for organic
electronics. Science 336, 327-332, doi:10.1126/science.1218829 (2012).
56 Bubnova, O. et al. Optimization of the thermoelectric figure of merit in the conducting
polymer poly(3,4-ethylenedioxythiophene). Nature Materials 10, 429-433, doi:Doi
10.1038/Nmat3012 (2011).
57 Glaudell, A. M., Cochran, J. E., Patel, S. N. & Chabinyc, M. L. Impact of the Doping
Method on Conductivity and Thermopower in Semiconducting Polythiophenes. Advanced
Energy Materials 5, n/a-n/a, doi:10.1002/aenm.201401072 (2015).
58 Guo, S. et al. n-Doping of Organic Electronic Materials using Air-Stable Organometallics.
Adv Mater 24, 699-+ (2012).
59 Reilly, T. H., Hains, A. W., Chen, H. Y. & Gregg, B. A. A Self-Doping, O2-Stable, n-Type
Interfacial Layer for Organic Electronics. Advanced Energy Materials 2, 455-460 (2012).
60 Naab, B. D. et al. High Mobility N-Type Transistors Based on Solution-Sheared Doped
6,13-Bis(triisopropylsilylethynyl)pentacene Thin Films. Adv Mater,
doi:10.1002/adma.201205098 (2013).
61 Anthopoulos, T. D., Anyfantis, G. C., Papavassiliou, G. C. & de Leeuw, D. M. Air-stable
ambipolar organic transistors. Appl Phys Lett 90, doi:10.1063/1.2715028 (2007).
62 Goupil, C., Seifert, W., Zabrocki, K., Müller, E. & Snyder, G. J. Thermodynamics of
Thermoelectric Phenomena and Applications. Entropy 13, 1481 (2011).
63 Bahk, J.-H., Fang, H., Yazawa, K. & Shakouri, A. Flexible thermoelectric materials and
device optimization for wearable energy harvesting. Journal of Materials Chemistry C
(2015).
64 Poehler, T. O. & Katz, H. E. Prospects for polymer-based thermoelectrics: state of the art
and theoretical analysis. Energy & Environmental Science 5, 8110,
doi:10.1039/c2ee22124a (2012).
65 Yang, J. H., Yip, H. L. & Jen, A. K. Y. Rational Design of Advanced Thermoelectric
Materials. Advanced Energy Materials 3, 549-565, doi:DOI 10.1002/aenm.201200514
(2013).
83
66 Pernstich, K. P., Rossner, B. & Batlogg, B. Field-effect-modulated Seebeck coefficient in
organic semiconductors. Nat Mater 7, 321-325, doi:10.1038/nmat2120 (2008).
67 von Mühlenen, A., Errien, N., Schaer, M., Bussac, M.-N. & Zuppiroli, L. Thermopower
measurements on pentacene transistors. Physical Review B 75,
doi:10.1103/PhysRevB.75.115338 (2007).
68 Germs, W. C., Guo, K., Janssen, R. A. J. & Kemerink, M. Unusual Thermoelectric
Behavior Indicating a Hopping to Bandlike Transport Transition in Pentacene. Phys Rev
Lett 109, doi:10.1103/Physrevlett.109.016601 (2012).
69 Kim, G. H., Shao, L., Zhang, K. & Pipe, K. P. Engineered doping of organic
semiconductors for enhanced thermoelectric efficiency. Nature Materials 12, 719-723,
doi:Doi 10.1038/Nmat3635 (2013).
70 Cho, N. et al. n-Doping of thermally polymerizable fullerenes as an electron transporting
layer for inverted polymer solar cells. Journal of Materials Chemistry 21, 6956,
doi:10.1039/c1jm10214a (2011).
71 Jung, B. J., Tremblay, N. J., Yeh, M.-L. & Katz, H. E. Molecular Design and Synthetic
Approaches to Electron-Transporting Organic Transistor Semiconductors†. Chemistry of
Materials 23, 568-582, doi:10.1021/cm102296d (2011).
72 Katz, H. E. & Huang, J. Thin-Film Organic Electronic Devices. Annual Review of
Materials Research 39, 71-92, doi:10.1146/annurev-matsci-082908-145433 (2009).
73 See, K. C., Landis, C., Sarjeant, A. & Katz, H. E. Easily synthesized naphthalene
tetracarboxylic diimide semiconductors with high electron mobility in air. Chemistry of
Materials 20, 3609-3616, doi:Doi 10.1021/Cm7032614 (2008).
74 Wei, P. et al. 2-(2-Methoxyphenyl)-1,3-dimethyl-1H-benzoimidazol-3-ium iodide as a
new air-stable n-type dopant for vacuum-processed organic semiconductor thin films. J Am
Chem Soc 134, 3999-4002, doi:10.1021/ja211382x (2012).
75 Zhan, X. W. et al. Rylene and Related Diimides for Organic Electronics. Adv Mater 23,
268-284, doi:DOI 10.1002/adma.201001402 (2011).
76 Inabe, T. et al. Electronic structure of alkali metal doped C60 derived from thermoelectric
power measurements. Phys Rev Lett 69, 3797-3799 (1992).
77 Li, C. Z. et al. Doping of Fullerenes via Anion-Induced Electron Transfer and Its
Implication for Surfactant Facilitated High Performance Polymer Solar Cells. Adv Mater
25, 4425-4430, doi:10.1002/adma.201300580 (2013).
78 Wang, Z. H. et al. Electronic transport properties of KxC70 thin films. Physical Review B
48, 10657-10660 (1993).

84
79 Wuesten, J., Ziegler, C. & Ertl, T. Electron transport in pristine and alkali metal doped
perylene-3,4,9,10-tetracarboxylicdianhydride (PTCDA) thin films. Physical Review B 74,
doi:10.1103/PhysRevB.74.125205 (2006).
80 Menke, T., Ray, D., Meiss, J., Leo, K. & Riede, M. In-situ conductivity and Seebeck
measurements of highly efficient n-dopants in fullerene C60. Appl Phys Lett 100, 093304,
doi:10.1063/1.3689778 (2012).
81 Sun, Y. M. et al. Organic Thermoelectric Materials and Devices Based on p- and n-Type
Poly(metal 1,1,2,2-ethenetetrathiolate)s. Adv Mater 24, 932-+, doi:DOI
10.1002/adma.201104305 (2012).
82 Chesterfield, R. J. et al. Organic thin film transistors based on N-alkyl perylene diimides:
Charge transport kinetics as a function of gate voltage and temperature. Journal of Physical
Chemistry B 108, 19281-19292, doi:10.1021/jp046246y (2004).
83 Delgado, M. C. R., Kim, E. G., da Silva, D. A. & Bredas, J. L. Tuning the Charge-Transport
Parameters of Perylene Diimide Single Crystals via End and/or Core Functionalization: A
Density Functional Theory Investigation. Journal of the American Chemical Society 132,
3375-3387, doi:10.1021/ja908173x (2010).
84 Schmidt, R. et al. High-Performance Air-Stable n-Channel Organic Thin Film Transistors
Based on Halogenated Perylene Bisimide Semiconductors. Journal of the American
Chemical Society 131, 6215-6228, doi:10.1021/ja901077a (2009).
85 Vura-Weis, J., Ratner, M. A. & Wasielewski, M. R. Geometry and Electronic Coupling in
Perylenediimide Stacks: Mapping Structure-Charge Transport Relationships. Journal of
the American Chemical Society 132, 1738-+, doi:10.1021/ja907761e (2010).
86 Chen, Q. et al. Finely tailored performance of inverted organic photovoltaics through layer-
by-layer interfacial engineering. ACS applied materials & interfaces 3, 3962-3970,
doi:10.1021/am200849r (2011).
87 Deligeorgiev, T., Zaneva, D., Petkov, I., Timcheva, I. & Sabnis, R. SYNTHESIS AND
PROPERTIES OF FLUORESCENT BIS-QUATERNIZED PERYLENE DYES. Dyes and
Pigments 24, 75-81, doi:10.1016/0143-7208(94)87012-8 (1994).
88 Funahashi, M. & Sonoda, A. High electron mobility in a columnar phase of liquid-
crystalline perylene tetracarboxylic bisimide bearing oligosiloxane chains. Journal of
Materials Chemistry 22, 25190, doi:10.1039/c2jm35579e (2012).
89 Gregg, B. A. & Cormier, R. A. Liquid crystal perylene diimide films characterized by
electrochemical, spectroelectrochemical, and conductivity versus potential measurements.
Journal of Physical Chemistry B 102, 9952-9957, doi:10.1021/jp982842e (1998).
85
90 Rivnay, J. et al. Large modulation of carrier transport by grain-boundary molecular packing
and microstructure in organic thin films. Nature Materials 8, 952-958,
doi:10.1038/nmat2570 (2009).
91 Hayashi, K., Shinano, T., Miyazaki, Y. & Kajitani, T. Fabrication of iodine-doped
pentacene thin films for organic thermoelectric devices. J Appl Phys 109 (2011).
92 Russ, B. et al. Power Factor Enhancement in Solution-Processed Organic n-Type
Thermoelectrics Through Molecular Design. Adv Mater 26, 3473-3477 (2014).
93 Kao, C. Y. et al. Doping of Conjugated Polythiophenes with Alky Silanes. Adv Funct
Mater 19, 1906-1911 (2009).
94 Naab, B. D. et al. Mechanistic Study on the Solution-Phase n-Doping of 1,3-Dimethyl-2-
aryl-2,3-dihydro-1H-benzoimidazole Derivatives. Journal of the American Chemical
Society 135, 15018-15025 (2013).
95 Gregg, B. A., Chen, S.-G. & Branz, H. M. On the superlinear increase in conductivity with
dopant concentration in excitonic semiconductors. Appl Phys Lett 84, 1707,
doi:10.1063/1.1668326 (2004).
96 Chempath, S. et al. Mechanism of tetraalkylammonium headgroup degradation in alkaline
fuel cell membranes. J Phys Chem C 112, 3179-3182 (2008).
97 Edson, J. B., Macomber, C. S., Pivovar, B. S. & Boncella, J. M. Hydroxide based
decomposition pathways of alkyltrimethylammonium cations. J Membrane Sci 399, 49-59
(2012).
98 Robb, M. J., Newton, B., Fors, B. P. & Hawker, C. J. One-Step Synthesis of Unsymmetrical
N-Alkyl-N′-aryl Perylene Diimides. The Journal of Organic Chemistry 79, 6360-6365,
doi:10.1021/jo500945k (2014).
99 Varcoe, J. R. & Slade, R. C. T. Prospects for alkaline anion-exchange membranes in low
temperature fuel cells. Fuel Cells 5, 187-200 (2005).
100 Weber, C. D., Bradley, C. & Lonergan, M. C. Solution phase n-doping of C60 and PCBM
using tetrabutylammonium fluoride. Journal of Materials Chemistry A 2, 303-307,
doi:10.1039/C3TA14132B (2014).
101 Swinnen, A. M. et al. Photophysics of the Intramolecular Exciplex Formation in Omega-
(1-Pyrenyl)-Alpha-N,N-Dimethylaminoalkanes. Journal of the American Chemical
Society 109, 321-330 (1987).
102 Tauber, M. J., Kelley, R. F., Giaimo, J. M., Rybtchinski, B. & Wasielewski, M. R. Electron
hopping in pi-stacked covalent and self-assembled perylene diimides observed by ENDOR

86
spectroscopy. Journal of the American Chemical Society 128, 1782-1783,
doi:10.1021/ja057031k (2006).
103 Vanderauweraer, M., Gilbert, A. & Deschryver, F. C. Influence of Starting Conformations
on Intramolecular Exciplex Formation in Omega-Phenyl-Alpha-N,N-
Dimethylaminoalkanes. Journal of the American Chemical Society 102, 4007-4017 (1980).
104 Wasielewski, M. R. Photoinduced Electron-Transfer in Supramolecular Systems for
Artificial Photosynthesis. Chem Rev 92, 435-461 (1992).
105 Ghosh, I., Ghosh, T., Bardagi, J. I. & König, B. Reduction of aryl halides by consecutive
visible light-induced electron transfer processes. Science 346, 725-728,
doi:10.1126/science.1258232 (2014).
106 Fabiano, S., Braun, S., Fahlman, M., Crispin, X. & Berggren, M. Effect of Gate Electrode
Work-Function on Source Charge Injection in Electrolyte-Gated Organic Field-Effect
Transistors. Adv Funct Mater 24, 695-700 (2014).
107 Fabiano, S. et al. Poly(ethylene imine) Impurities Induce n-doping Reaction in Organic
(Semi)Conductors. Adv Mater 26, 6000-6006, doi:10.1002/adma.201401986 (2014).
108 Matsunaga, Y., Goto, K., Kubono, K., Sako, K. & Shinmyozu, T. Photoinduced Color
Change and Photomechanical Effect of Naphthalene Diimides Bearing Alkylamine
Moieties in the Solid State. Chem-Eur J 20, 7309-7316 (2014).
109 Schmidt, D., Bialas, D. & Würthner, F. Ambient Stable Zwitterionic Perylene Bisimide-
Centered Radical. Angewandte Chemie 127, 3682-3685, doi:10.1002/ange.201408067
(2015).
110 Zhang, W.-B. et al. Improved synthesis of fullerynes by Fisher esterification for modular
and efficient construction of fullerene polymers with high fullerene functionality. Polymer
52, 4221-4226 (2011).
111 El Samii, Z. K. A., Al Ashmawy, M. I. & Mellor, J. M. New routes to heterocycles via
sulphenylation of unsaturated amides. Journal of the Chemical Society, Perkin
Transactions 1, 2517-2522 (1988).
112 Papageorgiou, C. & Borer, X. Acid‐Catalyzed Rearrangements for a Diastereoselective
Entry into a New Fused Hexacyclic Heterocycle:(5RS, 7aRS, 12RS, 14aRS,)‐4, 5, 7a, 11,
12, 14, 14a‐octahydro‐5, 12‐dimethyl‐diindolo [1, 7‐bc: 1′, 7′‐gh][2, 6] naphthyridine.
Helvetica chimica acta 71, 1079-1083 (1988).
113 Woo, C. H., Beaujuge, P. M., Holcombe, T. W., Lee, O. P. & Fréchet, J. M. Incorporation
of furan into low band-gap polymers for efficient solar cells. Journal of the American
Chemical Society 132, 15547-15549 (2010).
87
114 Hill, I., Kahn, A., Soos, Z. & Pascal Jr, R. Charge-separation energy in films of π-
conjugated organic molecules. Chemical Physics Letters 327, 181-188 (2000).
115 Mühlbacher, D. et al. High photovoltaic performance of a low‐bandgap polymer. Adv
Mater 18, 2884-2889 (2006).
116 Sonar, P., Ng, G.-M., Lin, T. T., Dodabalapur, A. & Chen, Z.-K. Solution processable low
bandgap diketopyrrolopyrrole (DPP) based derivatives: novel acceptors for organic solar
cells. Journal of Materials Chemistry 20, 3626-3636 (2010).
117 B. Russ, M. J. R., B.C. Popere, E.E. Perry, C-K. Mai, S.L. Fronk, S.N. Patel, T.E. Mates,
G.C. Bazan, J.J Urban, M.L. Chabinyc, C.J. Hawker, R.A. Segalman. Tethered tertiary
amines as solid-state n-type dopants for solution-processable organic semiconductors.
Under Review (2015).
118 Che, Y. K. et al. Enhancing one-dimensional charge transport through intermolecular pi-
electron delocalization: Conductivity improvement for organic nanobelts. Journal of the
American Chemical Society 129, 6354-+, doi:10.1021/ja070164g (2007).