design, prototyping and measurement of a cascaded 6-ghz
TRANSCRIPT

J. Aerosp. Technol. Manag., São José dos Campos, Vol.8, No 2, pp.137-142, Apr.-Jun., 2016
AbstrAct: The design, prototyping, and free-space measurement of a 6-GHz Frequency Selective Surface filter is presented. The prototyping resolution of a large (A4 sheet size) Frequency Selective Surface with small loops as elements is checked, as well as the correlation with measurements performed with a 3-D full-wave solver. The test also involved the effect of cascading two different Frequency Selective Surfaces with a viewpoint towards a narrower frequency range, which provided good results.
Keywords: Frequency Selective Surface, Filter, Free-space measurement, Measurement and prototyping.
Design, Prototyping and Measurement of a Cascaded 6-GHz Frequency Selective Surface ArrayMarcelo Bender Perotoni1, Luiz Alberto Andrade2, Cynthia Junqueira3
IntroductIon
A Frequency Selective Surface (FSS) possesses electromagnetic transmission properties that vary with frequency (Kraus and Marhefka 2002). FSSs can be seen as filters that operate on free-space waves, in contrast to lumped or distributed filters that are based on guided waves or transmission lines. They can be seen as an evolution from Salisbury screens, a primitive spatial filter; these screens consist of electromagnetic radiation absorbing material layer backed by a metallic plate positioned at a quarter-wavelength distance (Knott et al. 1985). Given the quarter-wavelength distance associated to the structure, it has an inherent narrow bandwidth performance, alleviated by some loading techniques and further geometrical variations (Abdelaziz 2008). They have several different applications; one of the most famous is in radomes — a cover placed to protect an antenna (Kraus and Marhefka 2002).
Other applications involve dichroic reflectors — where two different frequency signals share the same reflector structure, and the FSS is opaque to one band but transparent to the other (Munk 2000) — or absorber screens for electromagnetic energy (Engheta 2002), in applications such as for reducing unintended emissions for electromagnetic compatibility purposes. In the case of stealth vehicles, antennas are one of the main factors that lead to high Radar Cross Section (RCS) figures, due to their inherent resonant characteristics (Knott et al. 1985). One way to reduce the RCS of the vehicle, thereby producing stealth characteristics, is by placing a band-pass FSS radome in front of the antenna, which lets signals within the antenna frequency range
doi: 10.5028/jatm.v8i2.629
1.Universidade Federal do ABC – Centro de Engenharia, Modelagem e Ciências Sociais Aplicadas – Santo André/SP – Brazil. 2.Departamento de Ciência e Tecnologia Aeroespacial – Instituto de Aeronáutica e Espaço – Divisão de Materiais – São José dos Campos/SP – Brazil. 3.Spectrum Line RF & Microwave – Campinas/SP – Brazil.
Author for correspondence: Marcelo Bender Perotoni | Universidade Federal do ABC – Centro de Engenharia, Modelagem e Ciências Sociais Aplicadas | Avenida dos Estados, 5.001 – Bangu | CEP: 09.210-580 – Santo André/SP – Brazil | Email: [email protected]
received: 02/26/2016 | Accepted: 05/01/2016
J. Aerosp. Technol. Manag., São José dos Campos, Vol.8, No 2, pp.137-142, Apr.-Jun., 2016
138Perotoni MB, Andrade LA, Junqueira C
go through and blocks out-of-band signals. The RCS within the antenna frequency range will not change, since, ideally, the FSS array will be transparent to it, but those outside the band-pass region can be significantly lowered, due to the fact it will be opaque and reflect the incoming signals with scattering angles different from those of a simple dielectric radome (Kraus and Marhefka 2002; Singh et al. 2012).
The chosen design frequency was around 6 GHz, having a band-pass characteristic (so that it can be placed in an aeronautical radome). The 6-GHz frequency range was chosen to test the available prototyping capabilities — a similar previous project on the X-band (10 GHz) was not successful due to a large variation in the geometric dimensions of the array, observed after the fabrication. By not successful it is implied that the measured results were not correlated to those simulated by CST Microwave Studio®, a 3-D electromagnetic field solver. This X-band array was constructed by a third-party local company specialized in Printed Circuit Board (PCB) prototyping. Then the frequency was decided to be scaled down, in order to guarantee a safer margin concerning the fabrication process.
Two similar FSS array boards were manufactured to check their response as cascaded, with a view towards narrowing the frequency response for the 6-GHz frequency range.
FSS deSIgn and MeaSureMent
FSSs, being periodic arrays, can be developed based on an approach where a single cell is designed, and the boundary conditions emulate an infinite array. By doing so, the designer has the optimum solution, i.e. the ideal infinite array is quickly simulated, without edge effects and differences in inter-element couplings (all elements are subjected to the same coupling from neighboring elements).
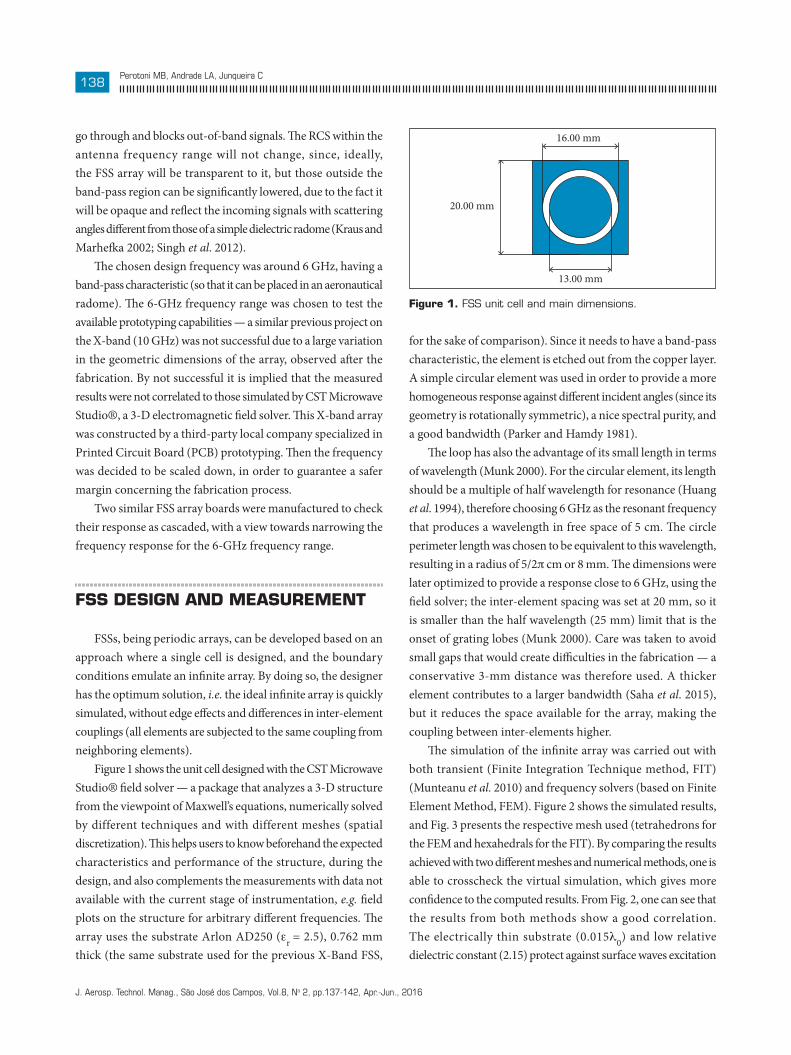
Figure 1 shows the unit cell designed with the CST Microwave Studio® field solver — a package that analyzes a 3-D structure from the viewpoint of Maxwell’s equations, numerically solved by different techniques and with different meshes (spatial discretization). This helps users to know beforehand the expected characteristics and performance of the structure, during the design, and also complements the measurements with data not available with the current stage of instrumentation, e.g. field plots on the structure for arbitrary different frequencies. The array uses the substrate Arlon AD250 (er = 2.5), 0.762 mm thick (the same substrate used for the previous X-Band FSS,
for the sake of comparison). Since it needs to have a band-pass characteristic, the element is etched out from the copper layer. A simple circular element was used in order to provide a more homogeneous response against different incident angles (since its geometry is rotationally symmetric), a nice spectral purity, and a good bandwidth (Parker and Hamdy 1981).
The loop has also the advantage of its small length in terms of wavelength (Munk 2000). For the circular element, its length should be a multiple of half wavelength for resonance (Huang et al. 1994), therefore choosing 6 GHz as the resonant frequency that produces a wavelength in free space of 5 cm. The circle perimeter length was chosen to be equivalent to this wavelength, resulting in a radius of 5/2p cm or 8 mm. The dimensions were later optimized to provide a response close to 6 GHz, using the field solver; the inter-element spacing was set at 20 mm, so it is smaller than the half wavelength (25 mm) limit that is the onset of grating lobes (Munk 2000). Care was taken to avoid small gaps that would create difficulties in the fabrication — a conservative 3-mm distance was therefore used. A thicker element contributes to a larger bandwidth (Saha et al. 2015), but it reduces the space available for the array, making the coupling between inter-elements higher.
The simulation of the infinite array was carried out with both transient (Finite Integration Technique method, FIT) (Munteanu et al. 2010) and frequency solvers (based on Finite Element Method, FEM). Figure 2 shows the simulated results, and Fig. 3 presents the respective mesh used (tetrahedrons for the FEM and hexahedrals for the FIT). By comparing the results achieved with two different meshes and numerical methods, one is able to crosscheck the virtual simulation, which gives more confidence to the computed results. From Fig. 2, one can see that the results from both methods show a good correlation. The electrically thin substrate (0.015l0) and low relative dielectric constant (2.15) protect against surface waves excitation
Figure 1. FSS unit cell and main dimensions.
16.00 mm
13.00 mm
20.00 mm

J. Aerosp. Technol. Manag., São José dos Campos, Vol.8, No 2, pp.137-142, Apr.-Jun., 2016
139Design, Prototyping and Measurement of a Cascaded 6-GHz Frequency Selective Surface Array
(Saha et al. 2015), though resulting in larger elements. Th e loading eff ect of the substrate is shown in detail in Fig. 2, by comparing the transmittance eff ects between the use of vacuum and the Arlon product. It can be seen that the Arlon substrate shift s the resonant frequency to lower values, from 8 to 6.4 GHz, resulting in a higher-quality factor (Q). Figure 3 also shows the surface current and electric fi eld excited on the designed element at the resonant frequency; it can be seen that, at resonance, the horizontal middle of the loop behaves as an open circuit
–104 5 6 7 8 9 10
–9–8–7–6–5–4–3–2–10
S-parameters [Magnitude in dB]
–114 5 6 7 8 9 10 11 12
–10–9–8–7
–5–6
–4–3–2–10
Frquency [GHz]
S21_FrequencyS21_Transient
S21_AirS21_Arlon
0–2.83–5.66–8.48–11.3–14.1–17–19.8–22.6–25.5–28.3–31.1–33.9–36.8–40
dB [max V/m]
H(Magnetic �eld)
Plane waveField probesE
(Eletric �eld)Figure 2. (a) Simulated (transient and frequency solvers) FSS unit cell — the S21 transmittance is shown; (b) Comparison of the transmittance response with Arlon product and air as substrates.
Figure 3. Meshes for the FEM (a) and FIT (b). Simulated surface current (c) and electric fi eld (d) for the resonant frequency of 6 GHz — normal incidence.
Figure 4. Finite FSS simulated with a plane wave excitation.
(minimum current/maximum voltage), whereas the vertical middle is a short circuit (maximum current/minimum voltage).
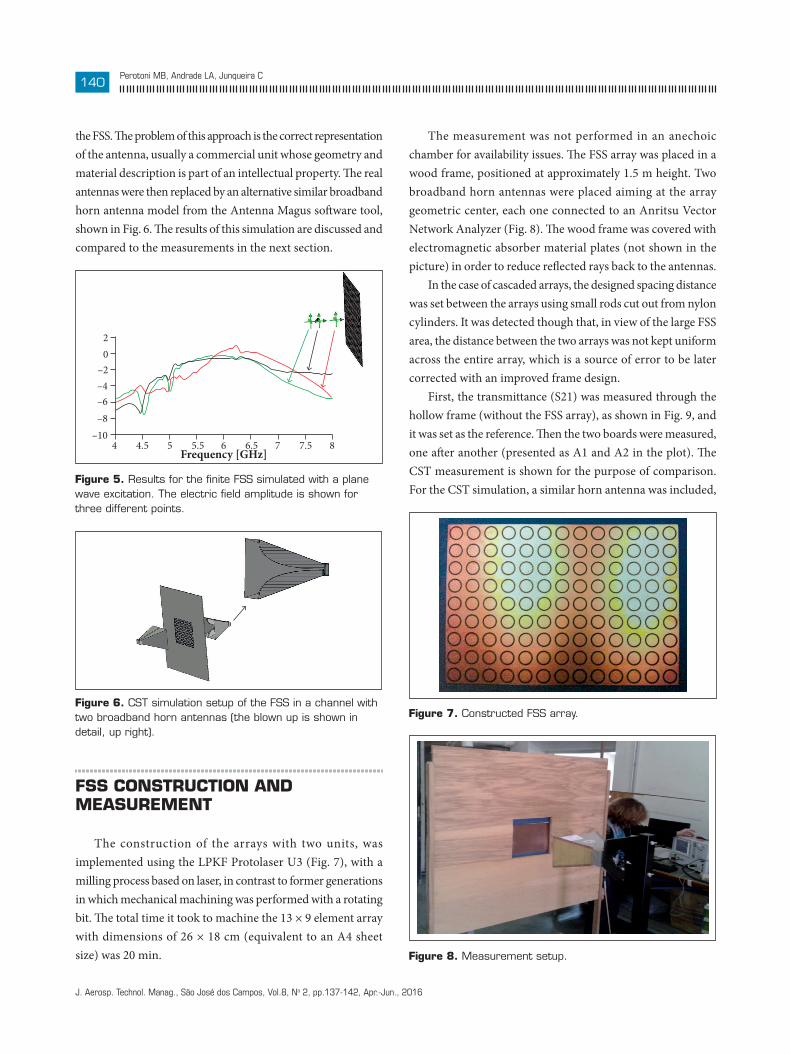
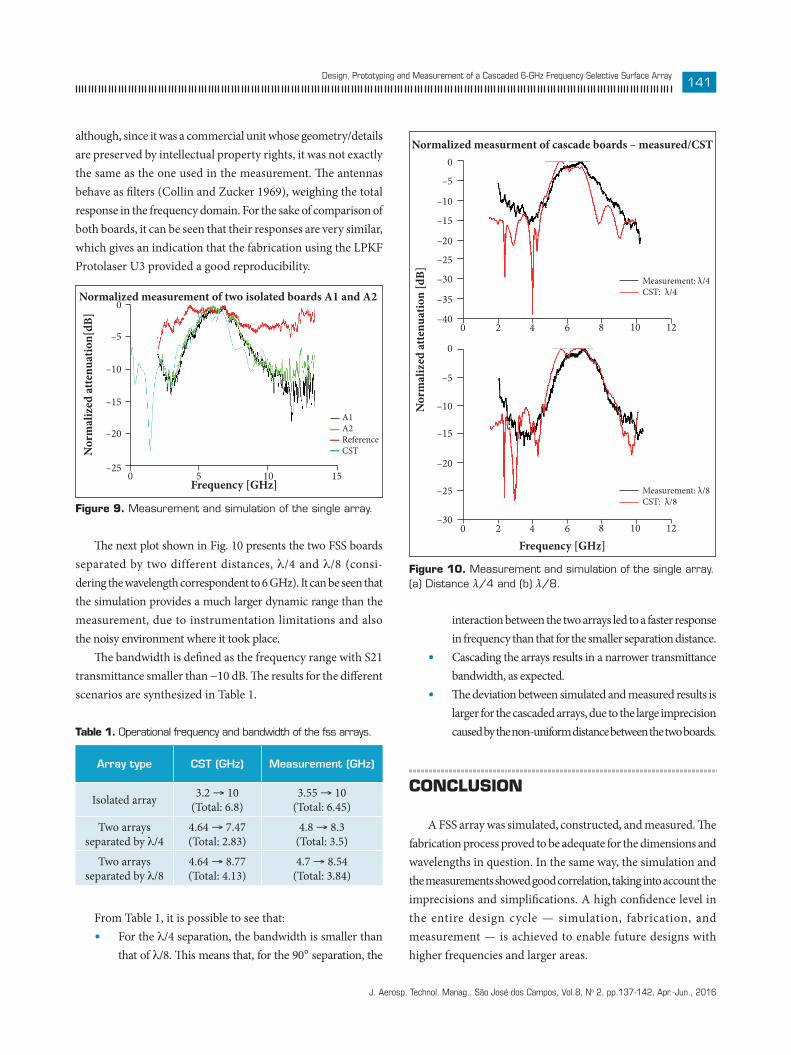
The simulation of a finite array is more involved fromthe viewpoint of computing demand. For this simulation, thetransient solver of CST was employed, since it provides a linear scaling between the electrical size and computing requirements, lighter than that of FEM, for instance. Figure 4shows one approach to evaluate the filter effect of the FSSarray — a plane wave excitation (electric fi eld amplitude of 1 V/m) is incident on one side of the FSS, and the electric fi eld is recorded on the other side, at a certain distance in order to be far from evanescent fi elds close to the surface. Th e fi eld is recorded by entities called “probes”, which do not interfere with the 3-D model, but just record the fi elds at that specifi c point in both frequency and time domains. Th e results for the electric fi eld at the three points (distances of 4, 8, and 10 cm) is shown in Fig. 5. It can be seen that, for points closer to the FSS,the eff ect of the evanescent fi elds are more pronounced, with the fi ltering envelope profi le stabilizing as the distance increases.
Th e laboratory test is implemented with two antennas (as presented in the next section). Th e simulation can include the antennas to measure the S21 transmittance of the whole channel taking into account these antennas, free-space propagation, and
(a) (b) (c) (d)
J. Aerosp. Technol. Manag., São José dos Campos, Vol.8, No 2, pp.137-142, Apr.-Jun., 2016
140Perotoni MB, Andrade LA, Junqueira C
the FSS. Th e problem of this approach is the correct representation of the antenna, usually a commercial unit whose geometry and material description is part of an intellectual property. Th e real antennas were then replaced by an alternative similar broadband horn antenna model from the Antenna Magus soft ware tool, shown in Fig. 6. Th e results of this simulation are discussed and compared to the measurements in the next section.
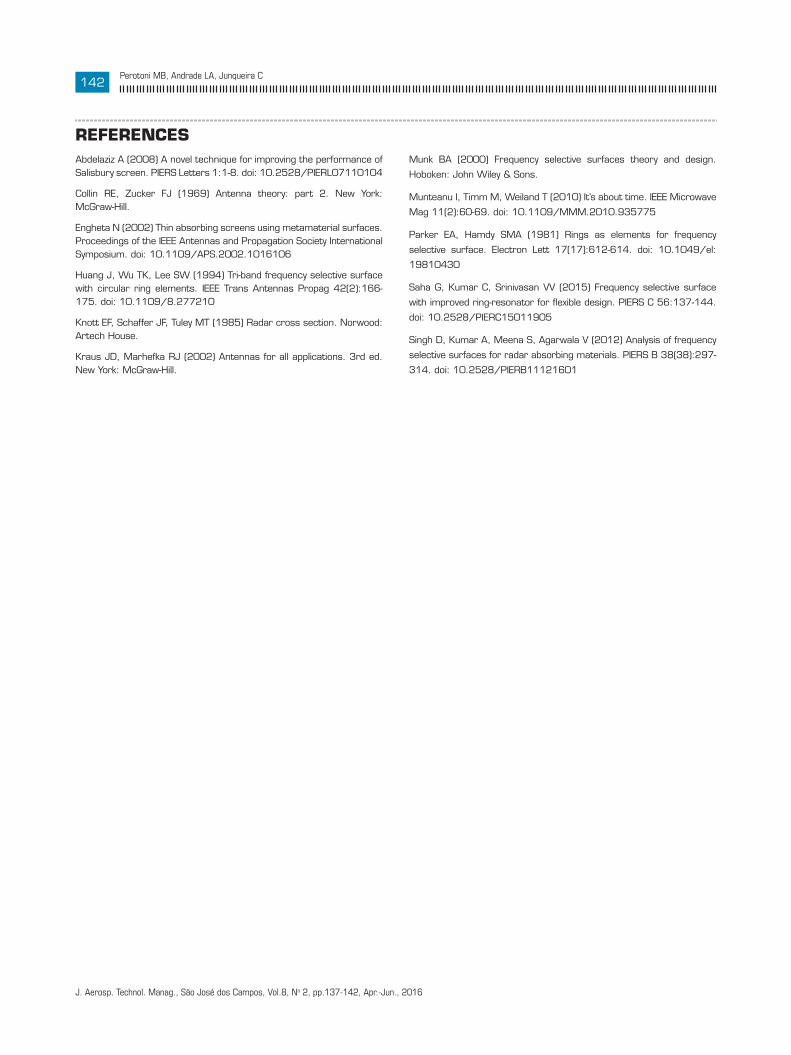
The measurement was not performed in an anechoic chamber for availability issues. Th e FSS array was placed in a wood frame, positioned at approximately 1.5 m height. Two broadband horn antennas were placed aiming at the array geometric center, each one connected to an Anritsu Vector Network Analyzer (Fig. 8). Th e wood frame was covered with electromagnetic absorber material plates (not shown in the picture) in order to reduce refl ected rays back to the antennas.
In the case of cascaded arrays, the designed spacing distance was set between the arrays using small rods cut out from nylon cylinders. It was detected though that, in view of the large FSS area, the distance between the two arrays was not kept uniform across the entire array, which is a source of error to be later corrected with an improved frame design.
First, the transmittance (S21) was measured through the hollow frame (without the FSS array), as shown in Fig. 9, and it was set as the reference. Th en the two boards were measured, one aft er another (presented as A1 and A2 in the plot). Th e CST measurement is shown for the purpose of comparison. For the CST simulation, a similar horn antenna was included,
–104 4.5 5 5.5 6
Frequency [GHz]6.5 7 87.5
–8–6–4–202
Figure 6. CST simulation setup of the FSS in a channel with two broadband horn antennas (the blown up is shown in detail, up right).
FSS conStructIon and MeaSureMent
The construction of the arrays with two units, was implemented using the LPKF Protolaser U3 (Fig. 7), with a milling process based on laser, in contrast to former generations in which mechanical machining was performed with a rotating bit. Th e total time it took to machine the 13 × 9 element array with dimensions of 26 × 18 cm (equivalent to an A4 sheet size) was 20 min.
Figure 5. Results for the fi nite FSS simulated with a plane wave excitation. The electric fi eld amplitude is shown for three different points.
Figure 7. Constructed FSS array.
Figure 8. Measurement setup.
J. Aerosp. Technol. Manag., São José dos Campos, Vol.8, No 2, pp.137-142, Apr.-Jun., 2016
141Design, Prototyping and Measurement of a Cascaded 6-GHz Frequency Selective Surface Array
0–25
–20
–15
–10
–5
0
5Frequency [GHz]
Normalized measurement of two isolated boards A1 and A2
Nor
mal
ized
atte
nuat
ion[
dB]
10 15
A1A2ReferenceCST
Normalized measurment of cascade boards – measured/CST
Frequency [GHz]
Nor
mal
ized
atte
nuat
ion
[dB] Measurement: λ/4
CST: λ/4
Measurement: λ/8CST: λ/8
0
–5
–10
–15
–20
–25
–30
–35
–400 2 4 6 8 10 12
0
–5
–10
–15
–20
–25
–300 2 4 6 8 10 12
although, since it was a commercial unit whose geometry/details are preserved by intellectual property rights, it was not exactly the same as the one used in the measurement. The antennas behave as filters (Collin and Zucker 1969), weighing the total response in the frequency domain. For the sake of comparison of both boards, it can be seen that their responses are very similar, which gives an indication that the fabrication using the LPKF Protolaser U3 provided a good reproducibility.
Figure 10. Measurement and simulation of the single array. (a) Distance λ/4 and (b) λ/8.
Figure 9. Measurement and simulation of the single array.
Array type cst (GHz) Measurement (GHz)
Isolated array 3.2 → 10 (Total: 6.8)
3.55 → 10 (Total: 6.45)
Two arrays separated by l/4
4.64 → 7.47 (Total: 2.83)
4.8 → 8.3 (Total: 3.5)
Two arrays separated by l/8
4.64 → 8.77 (Total: 4.13)
4.7 → 8.54 (Total: 3.84)
table 1. Operational frequency and bandwidth of the fss arrays.
interaction between the two arrays led to a faster response in frequency than that for the smaller separation distance.
• Cascading the arrays results in a narrower transmittance bandwidth, as expected.
• The deviation between simulated and measured results is larger for the cascaded arrays, due to the large imprecision caused by the non-uniform distance between the two boards.
concluSIon
A FSS array was simulated, constructed, and measured. The fabrication process proved to be adequate for the dimensions and wavelengths in question. In the same way, the simulation and the measurements showed good correlation, taking into account the imprecisions and simplifications. A high confidence level in the entire design cycle — simulation, fabrication, and measurement — is achieved to enable future designs with higher frequencies and larger areas.
The next plot shown in Fig. 10 presents the two FSS boards separated by two different distances, l/4 and l/8 (consi- dering the wavelength correspondent to 6 GHz). It can be seen that the simulation provides a much larger dynamic range than the measurement, due to instrumentation limitations and also the noisy environment where it took place.
The bandwidth is defined as the frequency range with S21 transmittance smaller than −10 dB. The results for the different scenarios are synthesized in Table 1.
From Table 1, it is possible to see that:• For the l/4 separation, the bandwidth is smaller than
that of l/8. This means that, for the 90° separation, the
J. Aerosp. Technol. Manag., São José dos Campos, Vol.8, No 2, pp.137-142, Apr.-Jun., 2016
142Perotoni MB, Andrade LA, Junqueira C
reFerenceSAbdelaziz A (2008) A novel technique for improving the performance of Salisbury screen. PIERS Letters 1:1-8. doi: 10.2528/PIERL07110104
Collin RE, Zucker FJ (1969) Antenna theory: part 2. New York: McGraw-Hill.
Engheta N (2002) Thin absorbing screens using metamaterial surfaces. Proceedings of the IEEE Antennas and Propagation Society International Symposium. doi: 10.1109/APS.2002.1016106
Huang J, Wu TK, Lee SW (1994) Tri-band frequency selective surface with circular ring elements. IEEE Trans Antennas Propag 42(2):166-175. doi: 10.1109/8.277210
Knott EF, Schaffer JF, Tuley MT (1985) Radar cross section. Norwood: Artech House.
Kraus JD, Marhefka RJ (2002) Antennas for all applications. 3rd ed. New York: McGraw-Hill.
Munk BA (2000) Frequency selective surfaces theory and design.
Hoboken: John Wiley & Sons.
Munteanu I, Timm M, Weiland T (2010) It’s about time. IEEE Microwave
Mag 11(2):60-69. doi: 10.1109/MMM.2010.935775
Parker EA, Hamdy SMA (1981) Rings as elements for frequency
selective surface. Electron Lett 17(17):612-614. doi: 10.1049/el:
19810430
Saha G, Kumar C, Srinivasan VV (2015) Frequency selective surface
with improved ring-resonator for flexible design. PIERS C 56:137-144.
doi: 10.2528/PIERC15011905
Singh D, Kumar A, Meena S, Agarwala V (2012) Analysis of frequency
selective surfaces for radar absorbing materials. PIERS B 38(38):297-
314. doi: 10.2528/PIERB11121601