design of solar thermal systems – calculation methods · design of solar thermal systems –...
TRANSCRIPT
Design of Solar Thermal Design of Solar Thermal Systems – Calculation Methods
Werner WeissAEE - Institute for Sustainable TechnologiesA-8200 Gleisdorf, Feldgasse 2AUSTRIA

Dimensioning - ExampleDimensioning - Example
HotelHotel
80 rooms (120 beds in single/double rooms) B = 120
80 % occupation (O) – 96 persons on average
Hot water demand per person (DHW): medium demand (see table for hotels)Hot water demand per person (DHW): medium demand (see table for hotels)
Hot water demand kitchen: 160 litre/day (HWDK):
Cold water: 20°CHot water (storage) 55°CHot water at shower: 50°C
Average Solar Radiation: May - July (for high solar fractions: 75 – 80%)g y y ( g )

Storage Volume “VST”g ST
VSt = [(B * O * DHW) + HWDK ] * 1.2 St [( ) K ]
= [(120 * 0.8 * 40) + 160] x 1.2 = 4,800 liter
Not all sizes are available: 5,000 liter
m = 5 m³
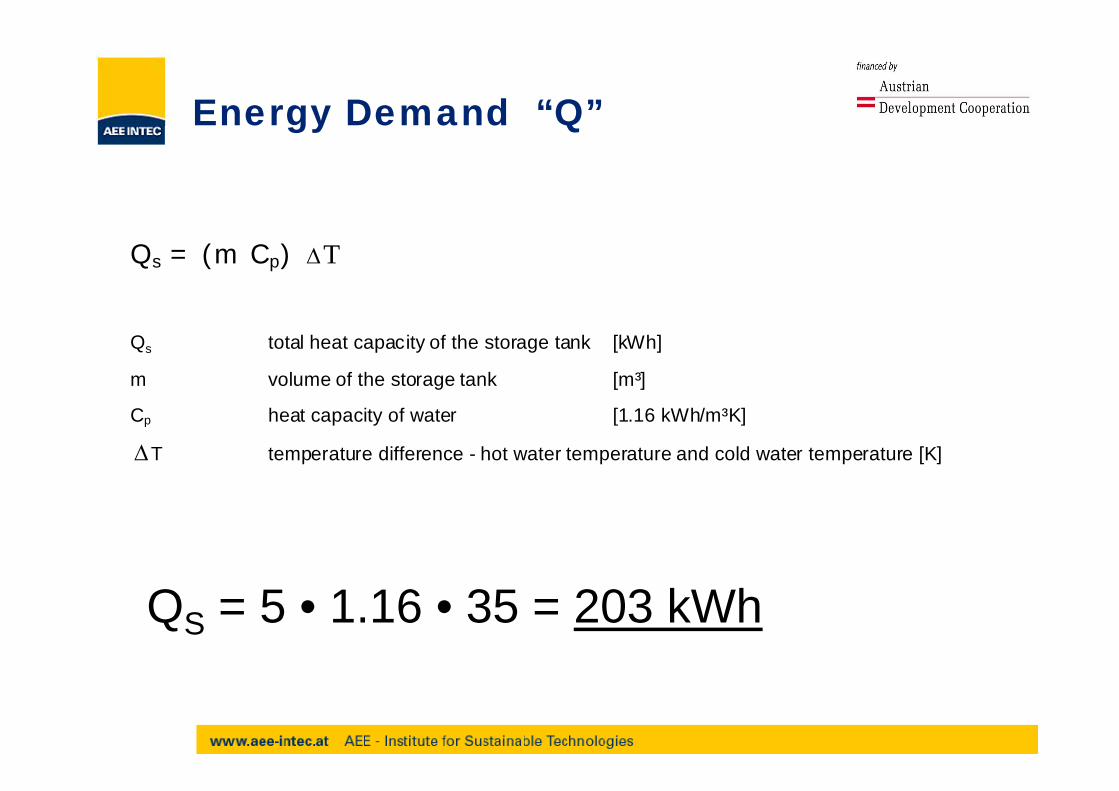
Energy Demand “Q”gy Q
Qs = (m Cp) T
Qs total heat capacity of the storage tank [kWh]
m volume of the storage tank [m³]
Cp heat capacity of water [1.16 kWh/m³K]
T temperature difference - hot water temperature and cold water temperature [K]
QS = 5 • 1.16 • 35 = 203 kWh
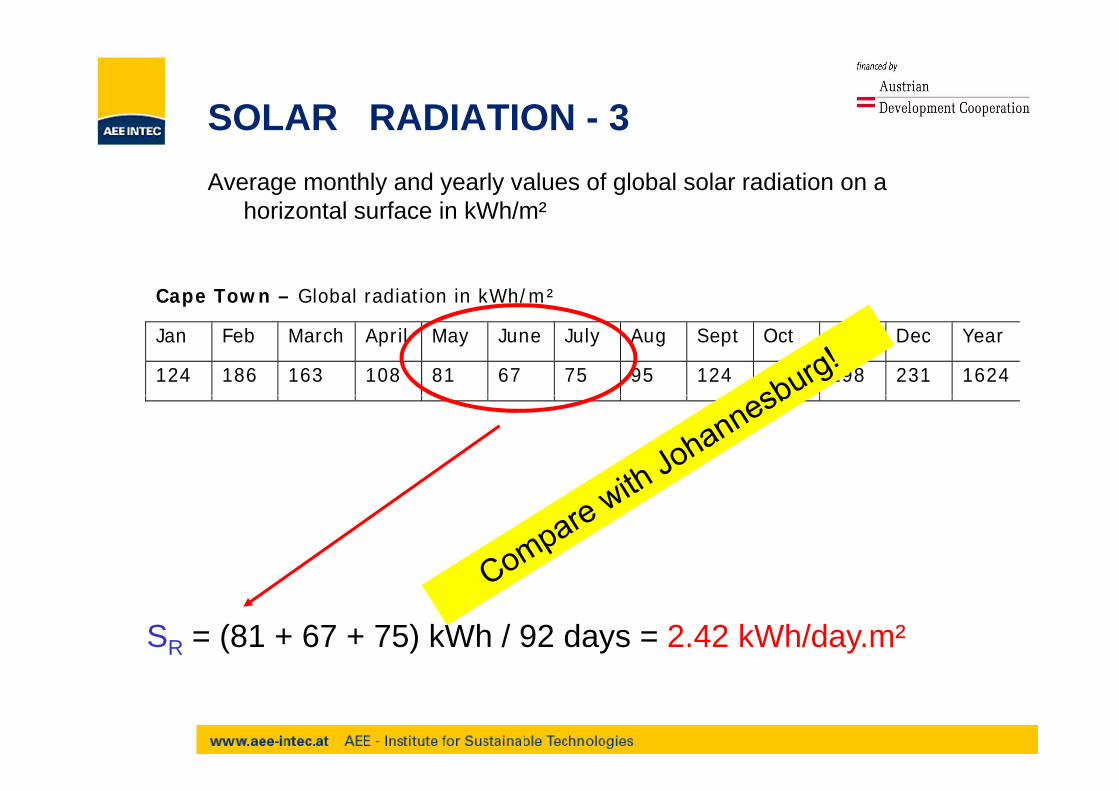
SOLAR RADIATION - 3SOLAR RADIATION 3Average monthly and yearly values of global solar radiation on a
horizontal surface in kWh/m²horizontal surface in kWh/m
Cape Town – Global radiation in kWh/m² p
Jan Feb March April May June July Aug Sept Oct Nov Dec Year
124 186 163 108 81 67 75 95 124 172 198 231 1624
SR = (81 + 67 + 75) kWh / 92 days = 2.42 kWh/day.m²

SOLAR RADIATION - 3SOLAR RADIATION 3
Average monthly and yearly values of global solar radiation on aAverage monthly and yearly values of global solar radiation on a horizontal surface in kWh/m²
J h b Gl b l di ti i kWh/ ² Johannesburg – Global radiation in kWh/m²
Jan Feb March April May June July Aug Sept Oct Nov Dec Year
197 169 165 142 128 112 121 146 162 186 188 201 1917
SR = (128 +112+121) kWh / 92 days = 3.92 kWh/m². day
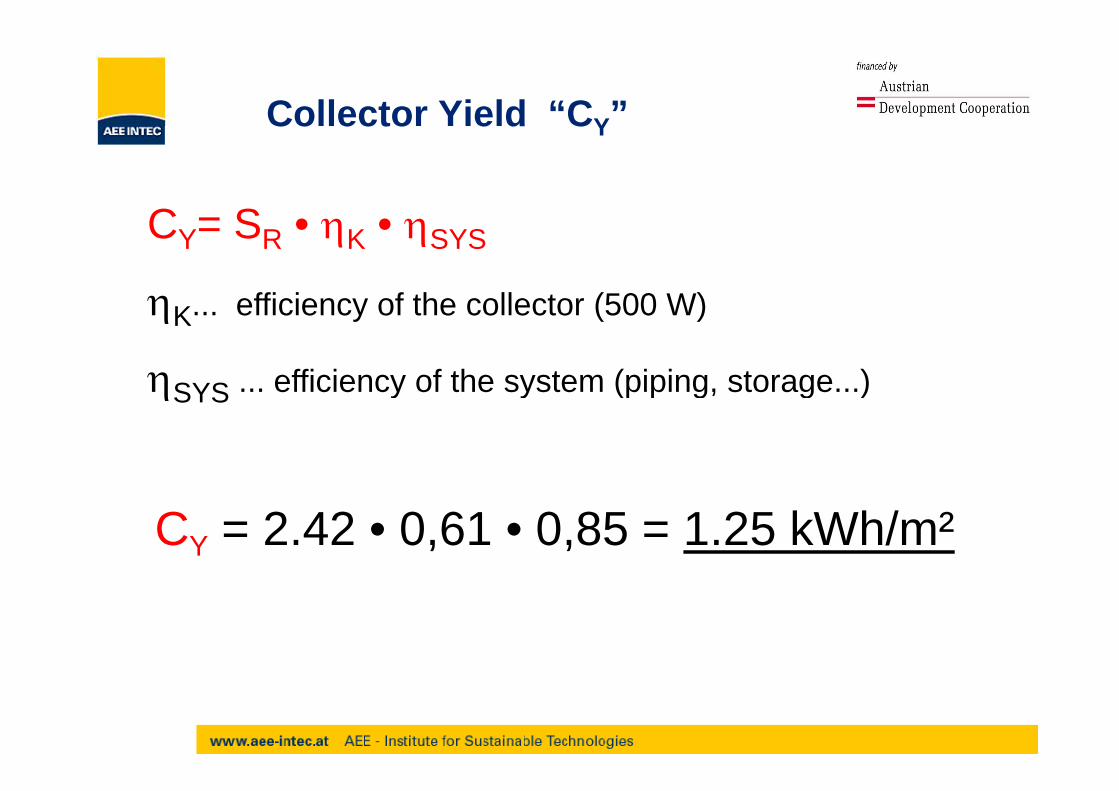
Collector Yield “CY”Co ecto e d CY
C SCY= SR • K • SYS
K efficiency of the collector (500 W)K... efficiency of the collector (500 W)
SYS ... efficiency of the system (piping, storage...)SYS y y (p p g, g )
CY = 2.42 • 0,61 • 0,85 = 1.25 kWh/m²

Collector efficiency curvey
0,7
0,8
Cold water: 20°CHot water (storage) 55°C
0,5
0,6Hot water (storage) 55 C
average dT is 17.5 KRadiation: 500 W
0,3
0,4eta
Radiation: 500 W
0,1
0,2
00 0,04 0,08 0,12 0,16
(TK TA) / GT [Km²/W](TKm-TA) / GT [Km²/W]

Collector Array “CA”y A
CA= Q / CY
CA = 203 / 1.25 = 162 m²
100% solar fraction!
80% Solar fraction ~ 130 m² (91 kW)

Orientation of collectors
Collector orientation
As a general rule, the collector should be facing the equator That means in the southernthe equator. That means in the southern hemisphere facing north and in the northern hemisphere facing southhemisphere facing south.

Tilt of collectors
Latitude[degree]
Best collector tilt in:
June Orientation Sept./March Orientation December Orientation
50 N 26.5 S 50 S 73.5 S
40 N 16.5 S 40 S 63.5 S
30 N 6.5 S 30 S 53.5 S
20 N 3.5 N 20 S 43.5 S
15 N 8.5 N 15 S 38.5 S
10 N 13.5 N 10 S 33.5 S
Equator = 0 23.5 N 0 - 23.5 S
10 S 33.5 N 10 N 13.5 S
15 S 38.5 N 15 N 8.5 S
20 S 43 5 N 20 N 3 5 S20 S 43.5 N 20 N 3.5 S
30 S 53.5 N 30 N 6.5 N
40 S 63.5 N 40 N 16.5 N
50 S 73 5 N 50 N 26 5 N50 S 73.5 N 50 N 26.5 N

Tilt and orientation of collectors (Cape Town)( p )
0%-5% 5%-10% 10%-15% 15%-20% 20%-25%percental mitigation:
75
90
25%-30% 30%-35% 35%-40% 40%-45% 45%-50%percental mitigation:
60
75
atio
n [°
]
45 Incl
ina
-90 -75 -60 -45 -30 -15 0 15 30 45 60 75 9015
30
W NW N NE E
-90 -75 -60 -45 -30 -15 0 15 30 45 60 75 90Azimuth [°]

Tilt and orientation of collectors
Variations of the annual solar yield in [kWh/m²·a] in Cape Town related to different orientationsand azimuth angles. The calculations are based on a solar hot water system with 3m² collector area and
a daily hot water consumption of 150 litre. Calculated solar fraction ~ 97% Inclination [°]
Azimuth [°] 15 30 45 60 75 90
W -90 820.8 802.0 763.6 703.4 616.1 499.5
-75 848.2 850.7 825.7 770.0 681.5 550.9
-60 872.1 891.0 875.0 822.0 726.3 579.0
NW -45 891 6 921 5 907 8 855 2 748 3 582 5NW 45 891.6 921.5 907.8 855.2 748.3 582.5
-30 905.8 941.3 928.5 869.7 744.7 563.7
-15 913.8 951.6 936.3 869.1 726.0 535.1
N 0 916 5 953 5 936 4 863 5 714 0 521 2N 0 916.5 953.5 936.4 863.5 714.0 521.2
15 912.3 947.5 930.3 859.3 718.5 528.4
30 902.0 933.7 916.5 852.7 730.1 553.2
NE 45 886.4 910.6 893.0 834.8 730.4 572.8
60 865.9 878.8 855.2 799.8 707.4 570.7
75 840.9 837.0 806.5 748.5 661.7 544.4
E 90 812.4 788.3 745.1 681.9 601.2 496.9

Dimensioning Example 1Dimensioning – Example 1
Small hot water system
Hot water demand: 500 l/dayCold water: 20°CCo d a e 0 CHot water (storage) 60°C
Dimensioning for 100% solar fraction
Dimensioning Example 2Dimensioning – Example 2
Industry – Bottle Washing
Hot water demand: 10.000 l/dayCold water: 25°CCo d a e 5 CHot water (storage) 80°C
Dimensioning for 70% solar fraction

Tilt and orientation of collectors (Joburg)( g)
90
0%-5% 5%-10% 10%-15% 15%-20% 20%-25%
25%-30% 30%-35% 35%-40% 40%-45% 45%-50%percental mitigation:
75
90
60
inat
ion
[°]
45 Incl
90 75 60 45 30 15 0 15 30 45 60 75 9015
30
-90 -75 -60 -45 -30 -15 0 15 30 45 60 75 90Azimuth [°]
W NW N NE E

Tilt and orientation of collectors (Windhoek)( )
0%-5% 5%-10% 10%-15% 15%-20% 20%-25%25%-30% 30%-35% 35%-40% 40%-45%percental mitigation:
75
90
25%-30% 30%-35% 35%-40% 40%-45%
60
natio
n [°
]
30
45 Incl
in
-90 -75 -60 -45 -30 -15 0 15 30 45 60 75 9015
30
W NW N NE E
Azimuth [°]

Tilt and orientation of collectors (Maputo)( p )
0%-5% 5%-10% 10%-15% 15%-20% 20%-25%
90
0% 5% 5% 10% 10% 15% 15% 20% 20% 25%25%-30% 30%-35% 35%-40% 40%-45%percental mitigation:
60
75
ion
[°]
45 Incl
inat
15
30
W NW N NE E
-90 -75 -60 -45 -30 -15 0 15 30 45 60 75 90
Azimuth [°]
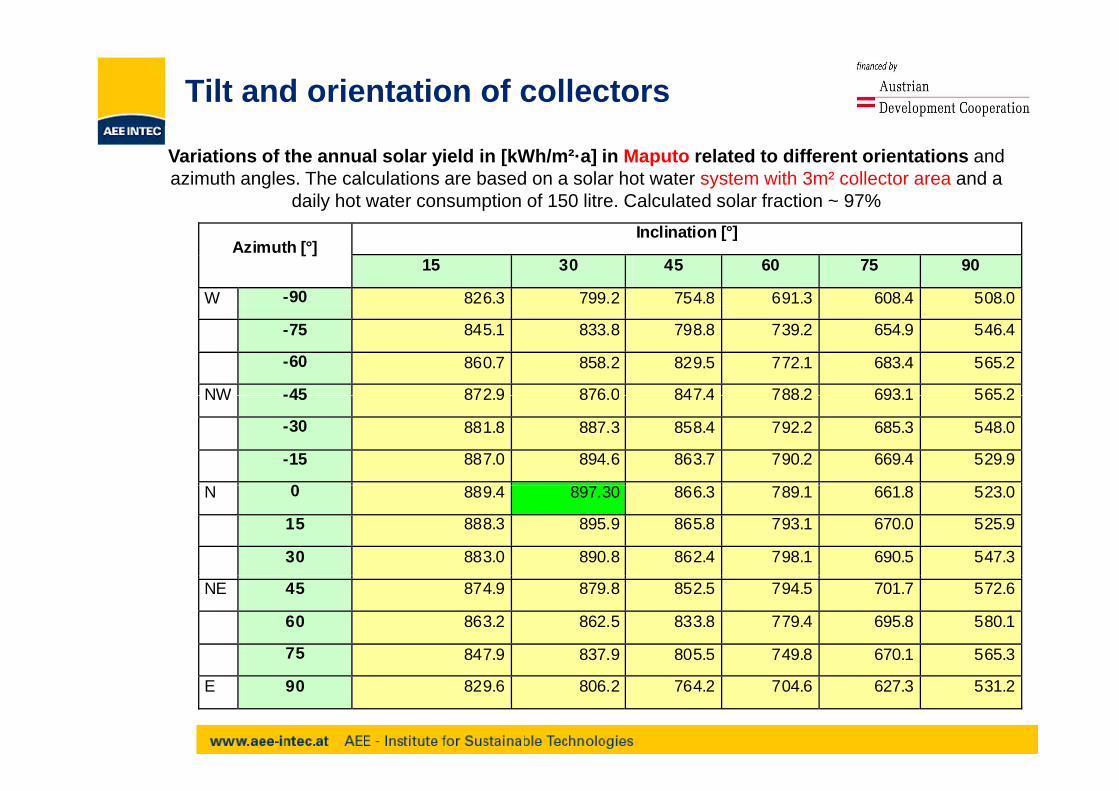
Tilt and orientation of collectors
Variations of the annual solar yield in [kWh/m²·a] in Maputo related to different orientations and azimuth angles. The calculations are based on a solar hot water system with 3m² collector area and a
daily hot water consumption of 150 litre. Calculated solar fraction ~ 97% Inclination [°]
Azimuth [°] 15 30 45 60 75 90
W -90 826.3 799.2 754.8 691.3 608.4 508.0
-75 845.1 833.8 798.8 739.2 654.9 546.4
-60 860.7 858.2 829.5 772.1 683.4 565.2
NW -45 872 9 876 0 847 4 788 2 693 1 565 2NW -45 872.9 876.0 847.4 788.2 693.1 565.2
-30 881.8 887.3 858.4 792.2 685.3 548.0
-15 887.0 894.6 863.7 790.2 669.4 529.9
0N 0 889.4 897.30 866.3 789.1 661.8 523.0
15 888.3 895.9 865.8 793.1 670.0 525.9
30 883.0 890.8 862.4 798.1 690.5 547.3
NE 45 874.9 879.8 852.5 794.5 701.7 572.6
60 863.2 862.5 833.8 779.4 695.8 580.1
75 847.9 837.9 805.5 749.8 670.1 565.3
E 90 829.6 806.2 764.2 704.6 627.3 531.2

Tilt and orientation of collectors
Variations of the annual solar yield in [kWh/m²·a] in Johannesburg related to different orientationsand azimuth angles. The calculations are based on a solar hot water system with 3m² collector area and
a daily hot water consumption of 150 litre. Calculated solar fraction ~ 97% Inclination [°]
Azimuth [°] 15 30 45 60 75 90
W -90 887.9 867.0 824.5 757.1 665.9 549.7
-75 912.3 909.6 879.6 817.0 722.3 595.1
-60 932.3 940.9 914.7 854.0 754.9 614.7
NW -45 947 6 961 3 934 5 868 4 758 1 607 2NW -45 947.6 961.3 934.5 868.4 758.1 607.2
-30 957.9 973.4 942.2 865.1 738.5 576.4
-15 964.2 979.0 944.1 854.6 711.5 545.8
N 0 966 1 982 0 944 8 850 4 701 0 535 9N 0 966.1 982.0 944.8 850.4 701.0 535.9
15 964.8 981.0 946.4 858.2 714.6 545.6
30 959.3 975.8 945.8 870.0 744.0 579.1
NE 45 948.6 964.4 937.8 873.0 766.2 615.8
60 933.6 943.7 918.6 858.7 764.0 629.1
75 913.1 913.3 882.9 823.1 735.2 613.0
E 90 888.1 869.8 830.4 767.0 679.5 566.2

Tilt and orientation of collectors
Variations of the annual solar yield in [kWh/m²·a] in Windhoek related to different orientations and azimuth angles. The calculations are based on a solar hot water system with 3m² collector area and a
daily hot water consumption of 150 litre. Calculated solar fraction ~ 97%
Inclination [°] Azimuth [°]
15 30 45 60 75 90
W 90 982 6 9 2 3 943 6 891 808 2 694 9W -90 982.6 972.3 943.6 891.7 808.2 694.9
-75 999.7 1002.0 981.4 934.7 855.8 739.7
-60 1013.2 1023.3 1005.9 955.4 870.9 748.9
NW -45 1024.0 1038.6 1017.3 958.9 859.9 723.7
-30 1031.5 1045.2 1019.5 948.0 826.5 671.8
-15 1036.1 1049.8 1014.8 928.8 785.2 628.3
N 0 1037.9 1051.0 1012.1 917.5 764.0 609.8
15 1036.9 1049.2 1012.0 923.3 777.5 619.5
30 1033.2 1045.0 1013.7 938.1 817.2 661.9
NE 45 1026.3 1036.8 1010.2 945.3 848.2 714.6
60 1015.8 1022.2 997.6 939.4 854.9 739.7
75 1000 5 998 5 973 2 916 2 836 9 731 275 1000.5 998.5 973.2 916.2 836.9 731.2
E 90 982.3 967.4 932.7 874.3 793.7 691.1