design of reinforced concrete waterways · design of reinforced concrete waterways ... account the...
TRANSCRIPT

Vasco Raio, Instituto Superior Técnico, Lisbon (2012)
1
DESIGN OF REINFORCED CONCRETE WATERWAYS
VASCO MIGUEL DA SAÚDE RAIO
JULY 2012
ABSTRACT: This paper presents a study of the required steps for the design of reinforced concrete waterways. To achieve
this purpose, there are two study-cases, with horseshoe and circular cross-section shapes, inserted in variable
geotechnical conditions. Construction methods used for the construction of RC galleries are presented, taking into
account the typical conditions of this type of structures and the associated details of underground constructions. A linear
elastic analysis is performed in order to determine the inner-forces installed in the structure, with a finite element model
in FE software and also with theoretical results of Beggs method, so they can be compared and the FEM model validated.
At the same time, the rock- structure interaction is taken into account by evaluating its contribution to the overall
behavior of the structure. The design of the study-cases is performed by security checks, according to the Eurocodes,
associated to the most relevant ultimate limit states as well as the serviceability limit states according to the
environmental and service conditions. It is also performed a nonlinear material analysis, with the ICONC software, in order
to evaluate the failure mode and load bearing capacity of the structure, depending on the inclusion or not of stirrups.
Finally it is performed an analysis of the transition between cross-sections with different shapes, circular and rectangular,
where the most important aspects related with the situation are analyzed, with a 3d linear elastic model. The transition is
modeled with shell elements.
KEYWORDS: RC waterways, Rock-structure interaction, Linear analysis, Structural design, Non-linear analysis
1 INTRODUCTION
Tunnel liners are underground structures that provide the
transport of water from a reservoir to a refund area.
Usually they are made either with steel (penstock), or with
reinforced concrete (Figure 1).
Generally, these structures are built as part of dams, in
order to carry the stored water from the artificial lake until
the power plant turbines; thus, one of the fundamental
characteristic of waterways is the fact that the adduction
water pressure represents an important load in the design.
The main goal of this task is to evaluate the required steps
for the analysis and design of RC liners. As these
underground structures are commonly inserted in rock
means, it is also important to consider the interaction
between the structure and the rock, which resists against
inner loads. This consideration could provide more
economic reinforcement ratios.
Figure 1 – Reinforced concrete liner (interior view) (EDP, 2011)
Vasco Raio, Instituto Superior Técnico, Lisbon (2012)
2
2 CONSTRUCTION METHODS
One of the most important steps of an underground
tunnel project is its method of execution; essentially it has
to take into account: (i) the longitudinal extension and (ii)
the geotechnical characteristics of the construction area. A
correct choice increases the economic viability of the
project and the security during the excavation phase.
For galleries inserted in rock means, the most common
execution methods are: (i) the New Austrian tunneling
method (NATM), (ii) Drilling and blasting (traditional
methods) and Tunnel boring machine (TBM) (current
method). The construction is finalized when the final
equilibrium state is achieved, after the final support is
installed.
Figure 2 – NATM excavation stages (Slides da disciplina de Obras Subterrâneas, 2010)
2.1 FINAL SUPPORT
The final support, for TBM, in most cases, is assembled
through pre-casted concrete staves.
For traditional methods of construction, generally, the
final concrete support is casted in situ. Before it, the
reinforcement is installed according to the project
specifications.
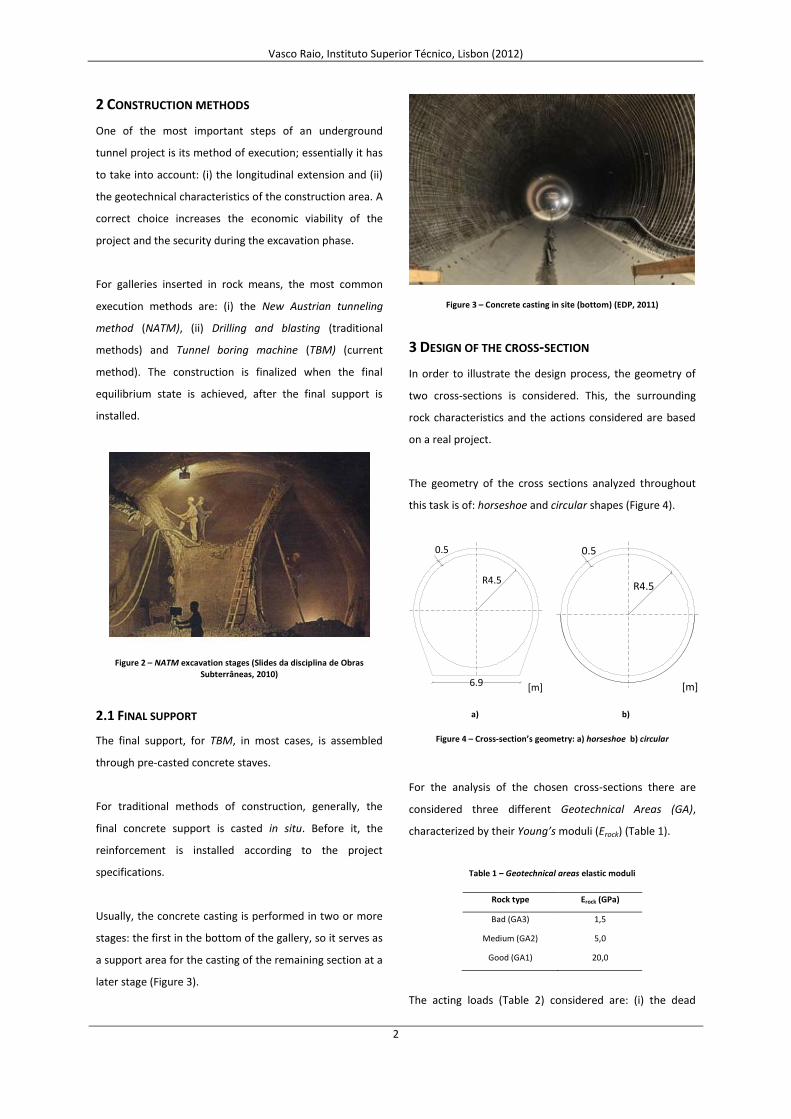
Usually, the concrete casting is performed in two or more
stages: the first in the bottom of the gallery, so it serves as
a support area for the casting of the remaining section at a
later stage (Figure 3).
Figure 3 – Concrete casting in site (bottom) (EDP, 2011)
3 DESIGN OF THE CROSS-SECTION
In order to illustrate the design process, the geometry of
two cross-sections is considered. This, the surrounding
rock characteristics and the actions considered are based
on a real project.
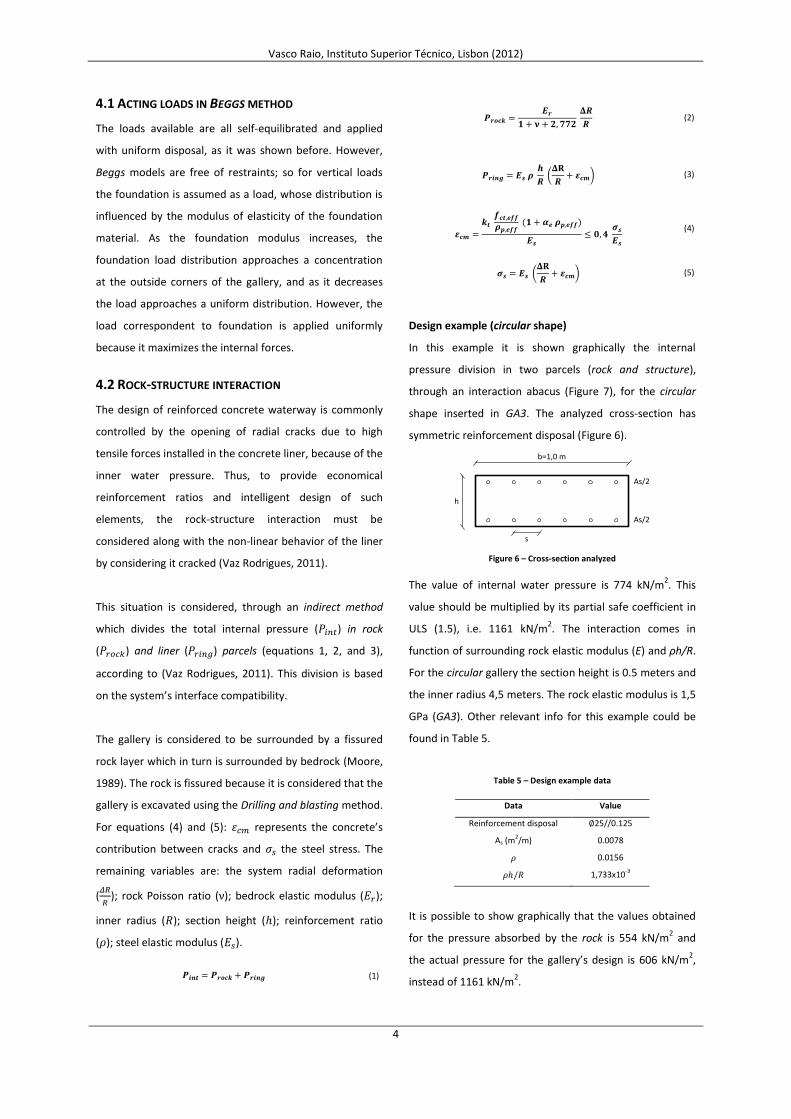
The geometry of the cross sections analyzed throughout
this task is of: horseshoe and circular shapes (Figure 4).
a)
b)
Figure 4 – Cross-section’s geometry: a) horseshoe b) circular
For the analysis of the chosen cross-sections there are
considered three different Geotechnical Areas (GA),
characterized by their Young’s moduli (Erock) (Table 1).
Table 1 – Geotechnical areas elastic moduli
Rock type Erock (GPa)
Bad (GA3) 1,5
Medium (GA2) 5,0
Good (GA1) 20,0
The acting loads (Table 2) considered are: (i) the dead
6.9 [m]
R4.5
0.5
R4.5
[m]
0.5

Vasco Raio, Instituto Superior Técnico, Lisbon (2012)
3
weight of the structure (D), (ii) the surrounding rock
pressure, which is divided in two areas: top of gallery (TR)
and lateral pressures (LR), whose value is half of the top
(Esteulle, Colombet, & Bouvard-Lecoanet, 1992) and also
(iii) the hydrostatic pressures: exterior (Wext), interior
(Wint) (adduction water) and interior due to dynamic
effects (Water hammer). The exterior type occurs due to
rock fragmentation under the groundwater level; its value
is conservatively considered the same of the interior
(under static effects).
The hydrostatic pressures values are determined in
function of the level difference between the center of the
galleries and the water project level considered.
Table 2 – Acting loads
Load type Value (kN/m2)
TR 135
LR 67,5
Wext 774
Wint 774
Wdyn 1125
The actions disposals are shown in Figure 5, for both cross-
sections shapes. The load correspondent to hydrostatic
pressure, as it is referred to the center of the conduit, is
applied uniformly along the cross-section.
a)
b)
Figure 5 – a) horseshoe b) circular; Loads applied: 1) Wint; 2) Wext; 3) LR; 4) TR
For structural design there are considered several limit
states. Load combos for ultimate limit states and
serviceability limit states are shown in Table 3 and Table 4,
respectively.
Table 3 – ULS load combos (conditioning in gray)
Combo D LR TR Wint Wext
ULS 1 1,35 1,50 - - -
ULS 2 1,35 - 1,50 - -
ULS 3 1,50 - - - -
ULS 4 1,35 1,50 1,50 - -
ULS 5 1,35 1,50 - - 1,50
ULS 6 1,35 - 1,50 - 1,50
ULS 7 1,35 1,50 1,50 - 1,50
ULS 8 - - - 1,50 -
ULS 9 1,35 - - 1,50 -
Table 4 – SLS load combos (conditioning in gray)
Combo D LR TR Wint Wext
SLS 1 1,0 1,0 - - -
SLS 2 1,0 - 1,0 - -
SLS 3 1,0 - - - -
SLS 4 1,0 1,0 1,0 - -
SLS 5 1,0 1,0 - - 1,0
SLS 6 1,0 - 1,0 - 1,0
SLS 7 1,0 1,0 1,0 - 1,0
SLS 8 - - - 1,0 -
SLS 9 1,0 - - 1,0 -
4 ELASTIC ANALYSIS WITH BEGGS METHOD
In order to perform the structural design, it is of major
importance the knowledge of the internal forces
originated by the acting loads. The Beggs method (Phillips
& Allen, 1968) provides a set of results, for the internal
forces of cross-sections, whose values are tabulated in
function of the load value and liner slenderness, for
various load conditions and cross-section shapes.
The main contribution of these theoretical results is to
understand, at a first look, the behavior of the studied
galleries; when subjected to the considered load combos
and how inner forces vary according to the geotechnical
mean. On the other hand, it also serves as base for the
FEM modulations, as it is possible to compare the results
obtained and validate the model.
The horseshoe gallery available in Beggs tables is not
completely equal to the case-study. However, it is
considered that it represents a good base for comparison
with the FEM modulation.
1
2
3
4
4
31
2
3 3
4
4
Vasco Raio, Instituto Superior Técnico, Lisbon (2012)
4
4.1 ACTING LOADS IN BEGGS METHOD
The loads available are all self-equilibrated and applied
with uniform disposal, as it was shown before. However,
Beggs models are free of restraints; so for vertical loads
the foundation is assumed as a load, whose distribution is
influenced by the modulus of elasticity of the foundation
material. As the foundation modulus increases, the
foundation load distribution approaches a concentration
at the outside corners of the gallery, and as it decreases
the load approaches a uniform distribution. However, the
load correspondent to foundation is applied uniformly
because it maximizes the internal forces.
4.2 ROCK-STRUCTURE INTERACTION
The design of reinforced concrete waterway is commonly
controlled by the opening of radial cracks due to high
tensile forces installed in the concrete liner, because of the
inner water pressure. Thus, to provide economical
reinforcement ratios and intelligent design of such
elements, the rock-structure interaction must be
considered along with the non-linear behavior of the liner
by considering it cracked (Vaz Rodrigues, 2011).
This situation is considered, through an indirect method
which divides the total internal pressure ( ) in rock
( ) and liner ( ) parcels (equations 1, 2, and 3),
according to (Vaz Rodrigues, 2011). This division is based
on the system’s interface compatibility.
The gallery is considered to be surrounded by a fissured
rock layer which in turn is surrounded by bedrock (Moore,
1989). The rock is fissured because it is considered that the
gallery is excavated using the Drilling and blasting method.
For equations (4) and (5): represents the concrete’s
contribution between cracks and the steel stress. The
remaining variables are: the system radial deformation
(
); rock Poisson ratio ( ); bedrock elastic modulus ( );
inner radius ( ); section height ( ); reinforcement ratio
( ); steel elastic modulus ( ).
(1)
(2)
(
) (3)
(4)
(
) (5)
Design example (circular shape)
In this example it is shown graphically the internal
pressure division in two parcels (rock and structure),
through an interaction abacus (Figure 7), for the circular
shape inserted in GA3. The analyzed cross-section has
symmetric reinforcement disposal (Figure 6).
Figure 6 – Cross-section analyzed
The value of internal water pressure is 774 kN/m2. This
value should be multiplied by its partial safe coefficient in
ULS (1.5), i.e. 1161 kN/m2. The interaction comes in
function of surrounding rock elastic modulus (E) and ρh/R.
For the circular gallery the section height is 0.5 meters and
the inner radius 4,5 meters. The rock elastic modulus is 1,5
GPa (GA3). Other relevant info for this example could be
found in Table 5.
Table 5 – Design example data
Data Value
Reinforcement disposal 25//0.125
As (m2/m) 0.0078
0.0156
1,733x10-3
It is possible to show graphically that the values obtained
for the pressure absorbed by the rock is 554 kN/m2 and
the actual pressure for the gallery’s design is 606 kN/m2,
instead of 1161 kN/m2.
h
b=1,0 m
s
As/2
As/2

Vasco Raio, Instituto Superior Técnico, Lisbon (2012)
5
Figure 7 – Rock-structure interaction abacus (design example) (Vaz Rodrigues, 2011)
4.3 INTERNAL FORCES
In the analysis through Beggs method it is observed that
the internal forces, mainly axial forces, increase
significantly as weaker the Geotechnical Area is; this
happens only for the ULS 8 and ULS 9 load combos, since
the model used is free of restraints and the rock stiffness is
only taken into account through the inner actions. At this
level the horseshoe and circular shapes shows the same
behavior.
As an example there are shown the axial forces diagrams,
according to the Geotechnical Area; in Figure 8 and Figure
9, for horseshoe and circular shapes, respectively (N<0:
tension).
a) GA1
b) GA2
c) GA3
Figure 8 – Horseshoe: Axial forces (red: ULS 7; green : ULS 8; purple: ULS 9)
100
200
300
400
500
600
700
100
200
300
400
500
600
700
0
Prock (kN/m2)
Pring(kN/m2)
σs (Mpa)
100 200 300 400
0.5 1.0 1.5 2.0
DR/R (%o)
E=2
0,0
GP
a
E=7
,5 G
Pa
E=5
,0 G
Pa
E=3
,5 G
Pa
E=2
,0 G
Pa
E=1
,5 G
Pa
E=1,0 GPa
E=0,75 GPa
E=0,5 GPa
E=0,25 GPa
E=0,1 GPa
rh/R=0,156x10-3
rh/R=0,300x10-3
rh/R=0,469x10-3
rh/R=0,625x10-3
rh/R=0,938x10-3
rh/R=1,250x10-3
rh
/R=1
,56
3x1
0-3
rh
/R=2
,15
8x1
0-3
rh
/R=3
,12
5x1
0-3
rh
/R=4
,37
5x1
0-3
11
61
(kN
/m2)
GA3
rh/R=1,810x10-3

Vasco Raio, Instituto Superior Técnico, Lisbon (2012)
6
a) GA1
b) GA2
c) GA3
Figure 9 – Circular: Axial forces (red: ULS 7; green : ULS 8; purple: ULS 9)
5 FINITE ELEMENT ANALYSIS (FEM)
After the analysis with Beggs theoretical results, a 2d finite
element approach is performed. Now it is possible to
model the structures with the case-study’s geometry,
namely the horseshoe gallery.
The modeling is performed with the FE software SAP2000
(CSI, Computers and structures Inc., 2008); the galleries
are modulated as linear frames, with respect to its
centroid, with one meter depth (in the longitudinal
direction) and appropriate mesh discretization (Figure 10);
the criteria used for this, is that the internal forces
shouldn’t vary more than 5%.
a) b)
Figure 10 – Extruded view of FEM models: a) horseshoe; b) circular
5.1 ACTING LOADS ON FE ANALYSIS
The loads are applied in a similar way as in Beggs analysis,
all uniform, with the exception of the foundation load that
is already taken into account with line-springs (see 5.2).
5.2 BOUNDARY CONDITIONS
The way that boundary conditions are applied to the
model depends on how the presence of surroundings is
considered; by using a FEM software it is possible to
consider the rock-structure interaction in different ways:
(i) modeling the rock in finite elements, (ii) using springs
with stiffness proportional to the rock elastic modulus
(hyperstatic reactions method) or (iii) indirectly, by dividing
the internal load in two parcels (rock and structure) (see
4.2).
Since it is a linear elastic analysis, it is possible to consider
the rock mass in the most convenient way for each type of
action; it is decided that for inner actions the indirect
method may be used. It divides the applied load ( ) in
two parcels (equation 6), as it was described before.
(6)
For the reaming actions the simulation of the rock is
considered with the hyperstatic reactions method. This
method consist in the application of non-linear springs
that only work when compressed (Figure 11); whose
stiffness is given by the equation (7) (Esteulle, Colombet, &
Bouvard-Lecoanet, 1992).
Figure 11 – Non-linear springs (only work when compressed) (Esteulle, Colombet, & Bouvard-Lecoanet, 1992)
When the hyperstatic reactions method is used, the line
springs itself provides the model’s support. When the
Krock
(7)

Vasco Raio, Instituto Superior Técnico, Lisbon (2012)
7
indirect method is used, the structure needs to expand
freely, because the presence of the rock is already taken
into account directly in the load applied. Thus, special
boundary conditions may be used for this situation.
5.3 INTERNAL FORCES
It is observed that the internal forces, due to inner actions,
increase significantly as weaker the geotechnical zone is,
as it was noticed in Beggs analysis; now, it happens also
for external loads. In Beggs analysis this aspect was not
considered as the rock stiffness was not taken into
account for external loads. As an example in (Figure 12)
and (Figure 13), there are represented the internal forces
diagrams for horseshoe, inserted in the higher stiffness
geotechnical area (GA1). The diagrams are symmetric
about the vertical centerline.
a) M (kNm/m)
b) N (kN/m)
c) V (kN/m)
Figure 12 – Internal forces diagrams: ULS 7, GA1 (SAP2000)
a) M (kNm/m)
b) N (kN/m)
c) V (kN/m)
Figure 13 - Internal forces diagrams: ULS 8, GA1 (SAP2000)
5.3.1 COMPARISON WITH BEGGS METHOD
By comparing the circular shaped gallery results, for the
internal water and lateral rock actions, the relative error
observed is approximately 5%. In order to validate the
horseshoe shaped gallery model, from the study-case, the
Beggs horseshoe gallery, slightly different from the study-
case, was also modulated. For the same actions the error
varies from 5-7%, in the constant thickness areas, to 15%
in the variable thickness zones.
6 SAFETY CHECKS (SC)
The structural design of the galleries is associated to safety
checks, for each cross-section analyzed, according to the
current regulations, the Eurocodes, namely: EN1990
(Bases to structural projects), EN1991-4 (Actions in silos
and tanks) and EN1992-1-1 (Design of reinforced concrete
structures). Thus, several limit states are evaluated
according to the structure’s geometry and environment
conditions.
It is considered that the actions applied are resisted by the
cross-sections; therefore in the longitudinal direction is
only designed for long-term effects, namely concrete
shrinkage, since the structure is restrained longitudinally.
The materials used are described in Table 6 and the
concrete cover used is 5,0 centimeters, according to the
environment where the galleries are inserted.
Table 6 – Material’s class
Material Class Norm
Steel S500NR -
Concrete C25/30 - Dmax 32 S3 NP EN206-1 (EC2)
6.1 ULTIMATE LIMIT STATES
In ULS it is evaluated: (i) the combined bending and axial
force, (ii) the shear resistance, with and without transverse
reinforcement and also (iii) the interaction between bond
and deviation forces in spalling failures of arch-shaped
members (Figure 14). Cover spalling failures, in arch-
shaped members, are in general originated by the
combination of two phenomena. The first one is the
transverse tensile stresses due to the deviation forces of a
213,4
-2286,3
6211,2
6871,0
179,0
2813,2
7,5
192,9
-377
-382,7
9,9
149,2

Vasco Raio, Instituto Superior Técnico, Lisbon (2012)
8
curved reinforcement. The second one is the tensile
splitting stresses originated by the bond of deformed
reinforcement (Muttoni, Fernandez, & Plumey, 2010). In
order to verify this situation, equation (8) must be
checked, where: (i) db is the radial is the reinforcement bar
diameter, (ii) k is an experimental coefficient that takes
into account the bar deformation, (iii) beff is the effective
width around the bar and (iv) R is the internal radius of the
gallery.
Figure 14 – Spalling failure in arched-shaped member, adapted from (Leonhardt & Monnig, 1979)
(8)
6.2 SERVICEABILITY LIMIT STATES
In SLS it is evaluated the crack opening limitation: (i) along
the cross-section and also (ii) in the longitudinal direction.
Cracking limitation is very important for the structure’s
durability, since the galleries are inserted in a chemically
aggressive environment and in “permanent” contact with
water.
7 NON-LINEAR ANALYSIS
When the loads applied to a concrete structure reach a
certain value, the linear elastic behavior is no longer valid;
this situation happens due to two distinct reasons: (i) In
general, for high loads, deformations are large, which
leads to significant changes in the structure’s geometry
and consequent introduction of second order effects; (ii)
the second reason is related to the occurrence of non-
linearity in the constitutive relations of the materials. The
concrete has low tensile strength and when cracking takes
place the presence of reinforcement becomes relevant
and plays a key role in terms of strength and stiffness of
the piece. In this task, only non-linear material analysis is
performed.
In the SC’s, many times stirrups are not required, for the
load combinations previously considered. In this chapter
the horseshoe shaped gallery is evaluated under two
concentrated loads (Q), applied laterally, to find out if
Qplast can be attained (Figure 15). This two models with
and without stirrups are tested with typical radial
reinforcement (obtained in Safety Checks chapter) (Table
7).
Table 7 – Reinforcement amounts
Reinforcement type Amount
Radial 16 // 20.0 (GA1)
Stirrups 12 // 30.0
The model used (Figure 15) is performed with shell
elements, with three nodes, through ICONC software (EPFL
, 2012), with a 2d analysis. The concrete tensile stress is
neglected as its tensile strength is very low when
compared with the reinforcement steel.
Figure 15 – Horseshoe gallery modulation (ICONC)
The boundary conditions consist in supports along the
base and on top, in order to simulate the presence of rock.
7.1 RESULTS
With the purpose of understanding the structure’s non-
linear behavior, (i) the displacement (D) and (ii) the steel
stress (ss) are evaluated, at point A, which is over the
interior radial reinforcement and in the load direction
q
st=fctm
Q Q

Vasco Raio, Instituto Superior Técnico, Lisbon (2012)
9
(Figure 16). These parameters are evaluated as a function
of the applied load (Q).
Figure 16 – Point A
After the analysis it is noticed that the load-bearing
capacity, for the gallery without stirrups, is approximately
40% less than the gallery with it and it is also associated to
a brittle failure mode. On the other hand, the gallery with
stirrups features a “ductile” behavior as it is displayed in
Figure 17, exploring the structure’s resistant capacity in a
better way.
Figure 17 – Load-displacement plot (Orange: stirrups; Yellow: no stirrups)
8 GEOMETRY OF TRANSITION ANALYSIS
Generally, along with the longitudinal development of
waterways, it is common to observe changes in the shape.
In this task, it is analyzed the geometry of transition
between a rectangular cross-section and a circular one,
with the same geometry of the circular shape previously
studied (Figure 18).
The main goal is to perform a tridimensional analysis of
the galleries and to understand if the structural design
changes a lot when compared with the constant shape
waterways.
Figure 18 – Geometry of transition analyzed
In order to analyze the transition, a 3d elastic analysis is
performed. The structure is modulated with shell
elements, with four nodes each, and the software used is
SAP2000 (Figure 19). The boundary conditions are based
on the hyperstatic reactions method (see 5.2), as area
springs, whose stiffness is considered to be uniform, taking
as radius (R) the square side. This is a conservative
hypothesis as it minimizes the spring’s stiffness and
increases the internal forces in the structure, namely for
internal actions.
Figure 19 – Extruded view of the transition modulation (SAP2000)
After the analysis, the structural design is performed, with
appropriate safety checks (as in the SC’s chapter). Since it
is not possible to use the indirect method of rock-structure
interaction, as the transition hasn’t a circular shape, the
results from this pure elastic analysis may require more
reinforcement amounts than the previous SC’s, for the
constant shape cross-sections.
9 CONCLUSIONS
This thesis presents the required steps for the analysis and
design of underground concrete structures, by studying its
Q D
A
0,5
9,0
4,5
1,5
9,0
[m]

Vasco Raio, Instituto Superior Técnico, Lisbon (2012)
10
details and presenting reinforcement drawing. It is also
based on a real study-case, making this subject less
abstract.
Along this task, several aspects were covered as: (i) the
most relevant constructive processes, (ii) the elastic
analysis, with FEM and theoretical results (Beggs), (iii) the
rock-structure interaction, (iv) the structural design,
according to the current standards and also (v) the non-
linear analysis, that allowed to analyze the structural
behavior of RC waterways through a more realistic
perspective.
10 REFERENCES
Slides da disciplina de Obras Subterrâneas. (2010). Lisboa:
IST.
CSI, Computers and structures Inc. (2008). CSI Analysis
Reference Manual for SAP2000, ETAB and SAFE.
Berkeley, California, USA: CSI.
EDP. (2011). Reforço de potência do Alqueva II. Obtido em
07 de 03 de 2012, de http://www.a-nossa-
energia.edp.pt/centros_produtores/fotos_video
s.php?item_id=82&cp_type=§ion_type=foto
s_videos
EPFL . (Janeiro de 2012). ICONC. Obtido em Janeiro de
2012, de École polytechnique fédérale de
Lausanne: http://i-
concrete.epfl.ch/secure/login.asp
Esteulle, F., Colombet, G., & Bouvard-Lecoanet, A. (1992).
Ouvrages Souterraines: conception, realisation,
entretien. Paris: Presses de l'ecole nationale de
Ponts et chaussées.
Girmsceid, G., & Schexnayder, C. (2002). Drill and Blast
Tunneling Practices. Practice Periodical on
Structural Design and construction, ASCE, 122-
133.
Leonhardt, F., & Monnig, E. (1979). Construções de
Concreto Vol. 3. Rio de Janeiro, Brasil:
Interciência LTDA.
Moore, E. T. (1989). Developing Equation for Elastic
Interaction Analysis of Reinforced Concrete
Tunnel Liner. ASCE, Civil Engineering Guidelines -
Waterways Vol.2, pp. 82-84.
Muttoni, A., Fernandez, M., & Plumey, S. (2010).
Interaction between Bond and Deviation Forces
in Spalling Failures of Arch-Shaped Members
without Transverse Reinforcement. ACI
Structural Journal, 346-354.
Phillips, H. B., & Allen, I. E. (1968). Beggs Deformeter
Stress Analysis of Single-Barrel Conduits. A
Water Ressources Technical Publication,
Engineering Monograph No.14, US department
of the Interior, pp. 10-54.
Vaz Rodrigues, R. (2011). Crack controlled design of RC
pressure Tunnels considering rock-structure
interaction. fib Symposium Prague 2011, session
2B-8: Construction Technology, (pp. 1-4). Prague.