design of efficient catalysts for gasification of
TRANSCRIPT


DESIGN OF EFFICIENT CATALYSTS FOR GASIFICATION OF
BIOMASS-DERIVED WASTE STREAMS IN HOT COMPRESSED
WATER
TOWARDS INDUSTRIAL APPLICABILITY
Dionysius Jacobus Maria de Vlieger

Promotion committee
Prof. dr. G. van der Steenhoven Chairman University of Twente, The Netherlands
Prof. dr. K. Seshan Promoter University of Twente, The Netherlands
Prof. dr. ir. L. Lefferts Promotor University of Twente, The Netherlands
Prof. dr. J.A. Lercher University of Munich, Germany
Prof. dr. J.P. Lange University of Twente, The Netherlands
Prof. dr. S.R.A. Kersten University of Twente, The Netherlands
Dr. A. Zwijnenburg Johnson Matthey, United Kingdom
Dr. B.L. Mojet University of Twente, The Netherlands
The research described in this thesis was conducted in the Catalytic Processes and Materials
(CPM) group at the University of Twente in the Netherlands. Financial support was provided
by Advanced Chemical Techonologies for Sustainability (ACTS) under project number
053.61.023.
ISBN: 978–90–365–3492–5
Cover picture: The cover picture is designed by cum–fine artist Wilma Peperkamp and
represents a Mandala which symbolizes the background of my PhD
study. The core of the Mandala shows a key finding of my research,
which is a Ru/CNT catalyst (HRSEM picture by Mark A. Smithers)
Printed by: Gildeprint Drukkerijen – The Netherlands
Dionysius Jacobus Maria de Vlieger, Enschede, The Netherlands, 2012
All rights reserved. No part of this document may be reproduced or transmitted in any form or
by any means, electronic, mechanical, photocopying, recording, or otherwise, without prior
written permission of the copyright holder.

DESIGN OF EFFICIENT CATALYSTS FOR GASIFICATION OF
BIOMASS-DERIVED WASTE STREAMS IN HOT COMPRESSED
WATER
TOWARDS INDUSTRIAL APPLICABILITY
PROEFSCHRIFT
ter verkrijging van
de graad van doctor aan de Universiteit Twente,
op gezag van de rector magnificus,
prof. dr. H. Brinksma
volgens besluit van het College voor Promoties
in het openbaar te verdedigen
op vrijdag 8 februari 2013 om 16hr45
door
Dionysius Jacobus Maria de Vlieger
geboren op 18 maart 1982
te Hengelo (Ov), Nederland

This dissertation has been approved by the promoters
Prof. dr. K. Seshan
Prof. dr. ir. L. Lefferts

"Ignore the environment. It will go away."
-unknown


Contents
Summary i
Samenvatting v
1 Hydrogen production from biomass derived waste streams 1
1.1 Towards renewable fuels 2
1.2 Biomass as sustainable energy carrier 4
1.3 Aqueous phase reforming of oxygenates 9
1.4 Reaction in sub- and supercritical water 13
1.5 Challenges 15
1.6 Scope and outline of this thesis 16
References 18
2 Experimental 23
2.1 Experimental setup 24
2.2 Catalyst preparation 25
2.3 Catalyst characterization 26
2.4 Definitions and calculations 27
References 29
3 Development of an efficient catalyst for the reforming of 31
ethylene glycol in supercritical water
3.1 Introduction 32
3.2 Experimental 34
3.3 Results and discussion 35
3.4 Conclusions 51
References 52
4 Aqueous phase reforming of ethylene glycol – Risk of 55
intermediates in catalyst performance
4.1 Introduction 56
4.2 Experimental 57
4.3 Results and discussion 58
4.4 Conclusions 73
References 73
5 Carbon nanotubes: a promising catalyst support material 75
for APR of biomass waste in supercritical water
5.1 Introduction 76
5.2 Experimental 78
5.3 Results and discussion 78
5.4 Conclusions 89
References 89
6 Ru/CNT; a commercially promising catalyst for APR of 91
acetic acid in sub- and supercritical water
6.1 Introduction 92
6.2 Experimental 93
6.3 Results and discussion 94
6.4 Conclusions 111
References 111
7 APR of real aqueous phase of flash pyrolysis oil over 113
Ru/CNT catalyst
7.1 Introduction 114
7.2 Experimental 115
7.3 Results and discussion 117
7.4 Conclusions 119
References 120

8 Evaluation and concluding remarks 121
8.1 Evaluation of aqueous phase vs steam reforming 122
8.2 Evaluation of APR integration with bio-refinery 126
8.3 Concluding remarks and future challenges 129
References 130
Publications 133
Acknowledgements 135

Summary
i
Summary
Mankind is on the eve of the greatest challenge this world has ever faced. The energy
required for the globalized living standards of our society depends currently on fossil fuels.
The availability and use of fossil fuels were taken for granted during the last century, but
depletion of cheap oil and the environmental concerns related to combustion of fossil fuels
force us to shift to alternative energy sources. Renewable and sustainable energy carriers must
be developed and implemented in the next decades to sustain our energy needs. A failure to
complete this challenge will have a disastrous impact on our way of living.
Biomass is believed to be a promising renewable energy source for the future.
Conversion of biomass waste to liquid fuels or hydrogen is projected to provide, partly, the
required energy demand. The anticipated intensification of biomass conversion processes will
result in an increase in biomass derived aqueous waste streams (e.g. the aqueous phase of
flash pyrolysis oil). Gasification of these wastes to produce high energy value gases (e.g.
hydrogen) is an interesting way of diminishing waste by making valuable products.
Conventional steam reforming of these biomass derived streams is economically unattractive
because of their high water contents (>80 wt%) and the energy required to carry out the
reactions in gas phase. Aqueous phase reforming (APR) is a recently developed process and
shows promising results for gasification of biomass derived aqueous feeds in liquid phase.
During APR, water is kept in the liquid phase by applying elevated pressures. The exact
reaction conditions of APR have a huge influence on the properties of water, which in turn
affect the catalytic reforming reaction. Especially, an enormous change in properties occurs
when the water is conditioned beyond the supercritical point (> 374 °C and 221 bars). Earlier
work in this field shows the need for stable and active reforming catalysts to make APR of
bio/organic aqueous waste streams a commercially feasible process. The study described in
this thesis focuses on the development of such a catalyst.
Background to the need for sustainable fuels is discussed in detail in Chapter 1. The
role of APR is further discussed in this chapter and the effects of the operating conditions on
the reaction are addressed. The chapter concludes with an evaluation of the current challenges
in APR.
The experimental setup used to study catalytic APR of oxygenates is described in
Chapter 2. The setup is able to perform experiments up to 450 °C and 250 bar in a continuous

Summary
ii
mode by using a fixed bed reactor. Furthermore, catalyst preparation and characterization
methods, analysis methods, and definitions that are used throughout this thesis, are also
described in this chapter.
An initial study to screen promising catalysts for APR of a model bio-oxygenate
molecule, ethylene glycol (EG), is described in Chapter 3. Based on a literature survey,
alumina supported Ir, Pt and Ni catalysts were selected as possible catalysts for this screening
study. These catalysts were tested for catalytic reforming of EG (5 & 15 wt%) in supercritical
water (450°C and 250 bar). The Pt/Al2O3 catalyst showed the highest hydrogen yields
compared to Ir and Ni. Varying the Pt loading between 0.3 and 1.5 wt% showed that the
intrinsic reforming activity increased with decreasing Pt loadings. However, a large negative
effect on the H2 selectivity and catalyst stability was observed with decreasing Pt loading. It
was found that promoting Pt/Al2O3 catalysts with Ni improved H2 yields and enhanced
catalyst stability. Pt-Ni/Al2O3 catalysts showed to be very promising for EG reforming in
supercritical water and this catalyst was selected for further APR studies.
The deactivation mechanism of Pt/Al2O3 during APR of EG and the role of Ni in
enhancing catalyst lifetime and H2 selectivity is discussed in Chapter 4. Methanol, ethanol
and acetic acid were identified as the main liquid products during EG reforming over alumina
supported Pt and Pt-Ni catalysts. The effect of these products on selectivity and catalyst
stability was further studied by APR of these compounds. The high dehydrogenation activity
of Pt-Ni/Al2O3 increased H2 yields during EG reforming by (i) suppressing methane
formation during methanol reforming (a major by-product in EG reforming) and (ii)
suppressing the formation of acetic acid. The latter reason is also found to be the cause for the
enhanced lifetime of Ni promoted Pt/Al2O3 catalysts. Acetic acid causes hydroxylation and
migration of the alumina support, leading to coverage of the catalytic sites and resulting in
deactivation of the catalyst. The instability of the alumina support towards acetic acid in hot
compressed water is a major problem for the feasibility of this technique because acetic acid
will be a major component in many future bio-gasification feed streams (e.g. the aqueous
fraction of pyrolysis oil), and thus stable catalyst supports must be developed.
In Chapter 5, the potential of CNT as catalyst support in APR is demonstrated. Carbon
nanotubes (CNT) are widely recognized for their excellent physical and chemical stability.
Furthermore, their open structure is very interesting for catalytic applications with respect to
diffusion limitations. The performance of Pt decorated CNT was studied as catalyst in

Summary
iii
supercritical water reforming of EG and acetic acid. The remarkable stability of CNT offers
great potential for catalysis in supercritical water. The acetic acid reforming activity of
Pt/CNT catalyst is rather low and requires improvement for commercial applications.
The study described in Chapter 6 aims at the development of a stable catalyst with
commercially relevant catalytic activity for acetic acid gasification in sub- and supercritical
water. The catalytic performance of Ru/CNT catalyst was studied for reforming of acetic acid
(1-25 wt%) in sub- (195-340 °C, 225 bar) and supercritical water (400 °C, 250 bar). Ru/CNT
catalyst showed remarkably stable catalytic performance and commercially relevant reaction
rates for reforming of acetic acid in supercritical water. It was found that the high ionic
product in high temperature subcritical water (300-340 °C) was responsible for Ru over-
oxidation during acetic acid reforming and caused catalyst deactivation. This problem has
been overcome by working under low ionic supercritical water conditions (>374 °C and 221
bar). The high stability and activity of Ru/CNT for acetic acid reforming in supercritical water
paved the way for studying reforming of real biomass derived waste streams under these
conditions.
Supercritical water reforming (400 °C and 250 bar) of a diluted feed stream of the
aqueous phase of flash pyrolysis oil is studied over Ru/CNT catalyst in Chapter 7. It was
found that the reaction conditions caused significant coke/char formation in the preheater.
Blockage of the preheater by coke was prevented by using highly diluted feeds. But even
under those conditions, coke was formed in significant quantities and prevented the
assessment of the Ru/CNT catalyst. Coke formation is a non-catalytic challenge that should
first be addressed before the catalytic performance of Ru/CNT can be assessed. However, the
latter is beyond the scope of this thesis.
The thesis is concluded in Chapter 8 with an evaluation of (i) the APR process in
general and (ii) the integration of the APR process in a bio-refinery to produce the necessary
hydrogen from waste and use it for upgrading of the bio-oil. Current non-catalytic challenges
with APR of the aqueous fraction of pyrolysis oil prevent feasible exploitation of this process.
However, it is projected that the APR technology developed in this thesis is applicable for
reforming of other aqueous bio/organic aqueous waste streams that are produced in large
quantities in the paper and food production industry.
The main achievements of the work described in this thesis, involved the development
of a stable catalyst support for APR in sub- and supercritical water, which formed the basis

Summary
iv
for the design of an efficient APR catalyst for reforming of challenging model compounds.
The developed Ru/CNT catalyst not only showed remarkable stability for supercritical water
APR of acetic acid but also showed commercially relevant reforming rates. Reforming of real
aqueous waste streams revealed that the process is subjected to engineering challenges which
should first be overcome before the developed catalyst can be further assessed.

Samenvatting
v
Samenvatting
De mensheid staat aan de vooravond van één van de grootste uitdagingen aller tijden.
Onze geglobaliseerde samenleving ligt ten grondslag aan de energie verslaving van onze
maatschappij en wordt momenteel gevoed door fossiele brandstoffen. De beschikbaarheid en
gebruik van fossiele brandstoffen werd de afgelopen eeuw als vanzelfsprekend beschouwd,
maar uitputting van goedkope oliebronnen en de milieu aspecten gerelateerd aan de
verbranding van fossiele brandstoffen leiden ertoe dat wij deze energie bronnen in de
toekomst niet langer kunnen aanspreken. Hernieuwbare en duurzame energiedragers moeten
ontwikkeld worden om te voorzien in onze energievraag. Het niet volbrengen van deze
uitdaging zal een enorme impact hebben op onze hedendaagse manier van leven.
Biomassa wordt gezien als een veelbelovende toekomstige bron van duurzame
energie. Omzetting van biomassa-afval naar vloeibare brandstoffen of waterstof kan mogelijk
(gedeeltelijk) voorzien in onze vraag naar duurzame energie. De geanticipeerde toename in
biomassa gerelateerde processen zullen leiden tot een toename van bio-organische waterige
afvalstromen (bijv. de waterige fase van flash pyrolyse olie). Een interessante mogelijkheid
voor het valorizeren van deze afvalstromen is d.m.v. reforming (vergassing) naar hoog
calorische gassen (bijv. H2). Conventionele stoomreforming van deze afvalstromen is
economisch gezien niet uitvoerbaar door de grote hoeveelheid energie die nodig is om deze
stromen (>80 gew.% water) in gas fase te brengen. Waterige fase reforming (WFR) is een
recent ontwikkeld proces voor vergassing van bio/organische waterige voedingstromen.
Tijdens WFR vindt vergassing plaats terwijl de voedingstroom in vloeibare fase gehouden
wordt door het toepassen van verhoogde drukken. De WFR procescondities hebben een grote
invloed op de eigenschappen van het water, en beinvloeden daarmee de katalytische
reforming reactie. Vooral het passeren van het superkritische water punt (> 374 °C en 221
bar) zorgt voor een drastische verandering in water eigenschappen. Reeds uitgevoerde studies
op het gebied van WFR hebben de noodzaak voor een stabiele en actieve vergassings
katalysator aangetoond om vergassing van bio-organische afvalstromen commerciel mogelijk
te maken. Het onderzoek, zoals beschreven in dit proefschrift, is gericht op de ontwikkeling
van een dergelijke katalysator.
Argumenten voor de ontwikkeling en implementatie van duurzame brandstoffen
worden behandeld in Hoofdstuk 1. Verder wordt in dit hoofdstuk de rol van WFR in deze
ontwikkeling besproken en worden de effecten van de reactieconditions op dit proces

Samenvatting
vi
uitgelegd. Dit hoofdstuk sluit af met een evaluatie van de huidige uitdagingen op het gebied
van katalytische WFR.
In Hoofdstuk 2 wordt de experimentele opstelling die gebruikt is voor dit onderzoek
beschreven. De opstelling maakt het mogelijk om WFR te bestuderen tot maximaal 450 °C en
250 bar in een continue modus door gebruik te maken van een fixed-bed reactor. Verder
worden de katalysator bereiding en karakterisatie methoden, analyse methoden, en definities
die in het proefschrift gebruikt zijn, in dit hoofdstuk beschreven.
In Hoofdstuk 3 wordt een initieel katalysator screening onderzoek beschreven, dat als
doel heeft geschikte katalysatoren te identificeren voor WFR van de modelstof ethyleen
glycol (EG) voor de productie van waterstof. Gebaseerd op een literatuur onderzoek zijn Ir, Pt
en Ni op alumina drager geselecteerd als veelbelovende katalysatoren voor dit proces. De
eigenschappen van deze katalysatoren zijn onderzocht voor WFR van EG (5 en 15 gew.%) in
superkritisch water (450 °C en 250 bar). Uit dit onderzoek bleek dat γ-alumina onder deze
omstandigheden omgezet wordt naar boehmiet. Verder gaf de Pt/Al2O3 katalysator de hoogste
waterstof opbrengst in vergelijking met Ir en Ni. Het varieren van de Pt belading tussen 0.3 en
1.5 % toonde aan dat de intrinsieke reforming activiteit toenam met lagere Pt beladingen.
Echter vertoonde een lagere Pt belading een negatief effect op de waterstof selectiviteit en op
de stabiliteit van de katalysator. Promotie van de Pt/Al2O3 katalysator met Ni leidde tot
verhoogde waterstof opbrengsten en stabiliteit. Deze bevindingen tonen aan dat Pt-Ni/Al2O3
een veelbelovende katalysator is voor WFR van EG in superkritisch water en daarom is deze
katalysator geselecteerd voor vervolg onderzoek.
Deactivatie van Pt/Al2O3 tijdens WFR van EG, en de rol van Ni in het verhogen van
de katalysator levensduur en H2 selectiviteit, is bestudeerd en beschreven in Hoofdstuk 4. Het
is gebleken dat de vorming van vloeibare bij-producten tijdens WFR van EG een grote
invloed hebben op de catalytische eigenschappen. Methanol, ethanol en azijnzuur zijn
geidentificeerd als bij-producten tijdens WFR van EG over Pt/Al2O3 en Pt-Ni/Al2O3
katalysatoren. Het effect van deze bij-producten op katalysator gedrag is verder onderzocht.
WFR van deze producten leidde tot de vorming van alkanen. De hoge dehydrogenatie
activiteit van Pt-Ni/Al2O3 zorgde voor hoge waterstof opbrengsten tijdens EG WFR door (1)
het onderdrukken van methaan vorming tijdens methanol reforming (voornaamste bij-product
tijdens EG reforming) en (2) door het onderdrukken van azijnzuur vorming. De laatste reden
ligt ook ten grondslag aan de langere levensduur van Ni bevorderde Pt/Al2O3. Azijnzuur bleek

Samenvatting
vii
verantwoordelijk te zijn voor hydroxylatie en migratie van de alumina drager. Dit leidde tot
bedekking van de katalytische actieve sites met een laagje alumina en had deactivatie van de
katalysator tot gevolg. De instabiliteit van de alumina drager in de aanwezigheid van
azijnzuur is een groot probleem voor de toepasbaarheid van deze techniek, doordat azijnzuur
een belangrijk bestanddeel (10-20 gew.%) zal zijn in toekomstige industriele voedingstromen
(bijv. de waterige fase van flash pyrolyse olie).
In Hoofdstuk 5 wordt de potentie van koolstof nanobuizen (KNB) als katalytisch
drager materiaal voor WFR gedemonstreerd. KNB zijn wereldwijd erkend voor hun grote
fysische en chemische stabiliteit. Verder is de open structuur van KNB zeer interessant voor
katalytische toepassingen vanuit het oogpunt van diffusie limitaties en het afvoeren van
gevormde coke. De katalytische eigenschappen van Pt op KNB zijn onderzocht voor WFR
van EG en azijnzuur in superkritisch water (450 °C en 250 bar). De Pt/KNB katalysator bleek
een opmerkelijk goede stabiliteit te hebben voor deze reacties. Echter, de WFR activiteit van
Pt/KNB is relatief laag en moet verbeterd worden om commerciele toepassingen mogelijk te
maken.
Het werk beschreven in Hoofstuk 6 richt zich op de ontwikkeling van een stabiele
katalysator met commercieel aantrekkelijke activiteit voor WFR van azijnzuur. De
katalytische eigenschappen van Ru/KNB zijn bestudeerd voor WFR van azijnzuur (1-25
gew.%) in sub- (195-340 °C, 225 bar) en superkritisch water (400 °C, 250 bar). Ru/KNB
vertoonde stabiele katalytische eigenschappen tijdens WFR van azijnzuur in superkritisch
water. Het hoge ion product van hoog temperatuur subkritisch water (300-340 °C, 225 bar)
veroorzaakte Ru over-oxidatie tijdens azijnzuur WFR en leidde tot deactivatie van de
katalysator. De goede stabiliteit en activiteit van Ru/KNB voor azijnzuur reforming in
superkritisch water heeft het fundament gelegd voor WFR van echte bio-organische
afvalstromen onder deze condities.
WFR van de waterige phase van flash pyrolyse olie over Ru/KNB is bestudeerd en
beschreven in Hoofdstuk 7. Vorming van significante hoeveelheden coke vond plaats in de
preheater. Zeer verdunde voedingstromen waren noodzakelijk om verstopping van de
voorverwarmer door coke te voorkomen. Maar coke werd zelfs onder deze condities in
significante hoeveelheden gevormd en zorgde ervoor dat de katalytische eigenschappen van
Ru/KNB niet goed beoordeeld kon worden. Coke vorming is een procestechnologisch
probleem en ligt buiten het bereik van dit onderzoek.

Samenvatting
viii
Dit proefschrift wordt afgesloten in Hoofdstuk 8 met een evaluatie van (i) het WFR
proces in zijn algemeenheid en (ii) de integratie van het WFR proces in een bio-raffinaderij
voor het produceren van noodzakelijk waterstof voor het opwaarderen van bio-olie. Non-
katalytische problemen met betrekking tot WFR van de waterige fase van flash pyrolyse olie
staan een commerciele exploitatie van dit proces in de weg. Maar het is voorzien dat de
technologie, die ontwikkelt is zoals beschreven in dit proefschrift, toepasbaar is voor de
reforming van andere waterige bio-organische afvalstromen die in grote hoeveelheden
geproduceerd worden in de papier en voedingsindustrie.
Het belangrijkste resultaat van dit onderzoek is de ontwikkeling van een stabiele
katalysator met commercieel aantrekkelijke activiteit voor reforming van bio-organische
voedingstromen in superkritisch water. Verder is aangetoond dat hoog temperatuur
subkritisch water ontzien moet worden voor reforming reacties. Reforming van de waterige
fase van flash pyrolysis olie is onderheving aan non-katalytische uitdagingen die eerst
opgelost dienen te worden voordat dit proces verder bestudeerd kan worden.


1
Chapter 1
Hydrogen production from biomass derived waste streams
Currently, hydrogen is mostly produced by steam reforming of natural gas and
other fossil feed stocks. Hydrogen is widely used in oil refineries, fertilizer and
food industry. In future, hydrogen based fuel cell will become very important as
a source of power. It is foreseen, that the demand for hydrogen will also increase
in the future for bio-refinery applications. Furthermore, sustainable hydrogen is
expected to (partly) replace peaking fossil fuels and mitigate the environmental
concerns associated with their use. Hydrogen from bio-renewable organic sources
is an elegant solution to meet the projected hydrogen demands in a sustainable
way. Converting aqueous bio/organic waste (>80% water) to hydrogen by
catalytic Aqueous Phase Reforming is an attractive way to simultaneously
diminish waste and produce the highly desired hydrogen sustainably.

Chapter 1
2
1.1 Towards renewable fuels
Currently, 97% of global liquid fuels are derived from crude-oil [1] and almost 87
million barrels of crude oil have to be produced every day to support these energy needs [2].
Future energy needs will increase as a result of the rapid growth in worldwide population,
industrialization and globalization. British Petroleum (BP) calculated world proven oil
reserves to be around 1400 billion barrels. Proven oil reserves are based on known oil
reservoirs that are feasible to exploit from technological and geological point of view. It is
predicted that, at current consumption rates, proven crude-oil reserves will be depleted within
50 years from now [2]. In addition to the proven reserves, there are also unproven reserves
that equal 7 trillion barrels of oil which are subjected currently to technological, economical
or geopolitical challenges that prevent a feasible exploitation [3]. It is predicted by the IEA
(International Energy Agency) that 20-40% of the unproven oil reserves will be technological
feasible to be exploited in the future [4], however from economical viewpoint the feasibility is
questionable.
The future (proven) crude oil will also evolve to a heavier and more sour oil with
higher viscosity and of lower quality [5, 6]. The increase in viscosity makes it more difficult
and costly to extract, transport and process the oil. Furthermore, the heavier molecular
composition of heavy crude oil requires more costly cracking reactions to produce the desired
liquid fuels [5, 6]. In addition, the sulfur content of todays oil is < 2% but is expected to
increase by an average of 0.1 % by the year 2020 [7]. This increase seems small on paper but
has a huge influence on the refining process. Increase of the sulfur content makes the oil more
sour leading to corrosion problems in pipelines. An increase of sulfur is also an environmental
concern. Sulfur in oil derived fuels is responsible for the majority of SOx emissions. SOx is
toxic, causes the formation of acid rain and is responsible for deactivation of automotive
catalytic converters. The Environmental Protection Agency (EPA) has therefore set stringent
SOx exhaust limits of less than 30 ppm. In the near future, this limit is expected to be
tightened to <10 ppm, forcing a better and more costly desulfurization process in refineries
[8]. Desulphurisation requires hydrogen to remove sulphur as hydrogen sulphide.
In the near future, the major concern is not the depletion of global oil reserves, but the
depletion of easy accessible and high quality oil. Oil extraction and processing become
increasingly more difficult and hence more energy intensive. This will cause a dramatic
decrease in the net energy gained for crude oil extraction, making this form of energy

Chapter 1
3
production less attractive. The energy efficiency of oil extraction is usually discussed in terms
of Energy Return over Energy Invested (EROEI) and is defined as the (barrel) units of energy
retrieved per unit of energy invested. Around 1930, oil extraction was cheap in energy with an
EROEI of 100. This number declined to 30 around the year 1970 and is currently around 11
and decreasing rapidly [9]. It is just a matter of time until oil extraction is not profitable
anymore from energy perspective. The same reasons that are responsible for a decreasingly
EROEI also lead to an increase in costs. It is expected that these costs will escalate in such a
way that the consequent high price of crude oil derived fuels will lead to a decline in demand
because consumers can simply not afford these fuels anymore.
The decreasing EROEI and increasing costs of crude oil extraction is expected to
result in a terminally decreasing oil production. The point at which this transition occurs is
called Peak Oil. A lower demand for crude oil derived fuels after the Peak Oil point does not
mean a decreasing demand for energy. Our society is strongly dependent on global economics
which are dictated by global trade of products. Crude-oil derived fuels, which are taken for
granted in our current society, enable transportation of goods globally and hence are the
backbone of globalization. Peak Oil is believed to lead to a reverse globalization because it is
simply too expensive to transport goods. Localization of economics can have a huge impact
on a local society in terms of wealth, living standards and availability of products. Therefore,
the Peak Oil moment is reported by many to be a very crucial point for our society as we
know it today [9-14]. The energy demand that cannot be fulfilled anymore by crude oil
derived fuels has to be replaced by other fuels to keep our society “running” [10]. Many
studies were performed to predict the Peak Oil moment. Some researchers reported that we
passed the Peak Oil moment already, while others say that it is happening around the time of
writing of this thesis (2012) [15, 16] and more positive studies report 2020-2030 to be the
transition point [17, 18]. These studies show that the exact point of Peak Oil is unclear but
that it will likely happen within the next decades. On the other hand, there are reports that
Peak Oil will never happen or at least not in the near future [3] but in general the occurrence
of a Peak Oil event is accepted.
Peak oil is not the only concern involved with crude oil derived fuels. The combustion
of fossil fuels is a major contributor to the accumulation of greenhouse gases in the
atmosphere (e.g. CO2, NOx and SOx) [19, 20]. Global warming (attributed to exhausted
greenhouse gases) was reported to have caused a temperature rise of 0.8 ⁰C in the year 2000
compared to pre-industrial time. A study to assess global warming predicted that another

Chapter 1
4
temperature rise of more than 1 ⁰C compared to the year 2000 will invoke an irreversible
dangerous effect on the Earth’s climate system. Modeling studies predict that this limit is
reached when the CO2 levels in air will be around 450 ppm, which is projected to happen by
the year 2050 [21]. The role of emitted greenhouse gases in global warming is discussed
intensively and the luring danger of global warming on our civilization is widely accepted
[22-26].
Based on the studies above, the next decades will be very important for the society as
we know it today with respect to the depletion of cheap oil and the irreversible environmental
impact associated with the combustion of fossil fuels. It is imperative that a global transition
from fossil fuels to sustainable and renewable energy carriers is realized as soon as possible.
The clock is ticking to ensure a livable planet for future generations!
1.2 Biomass as sustainable energy carrier
Biomass is expected to become one of the major global sustainable energy sources of
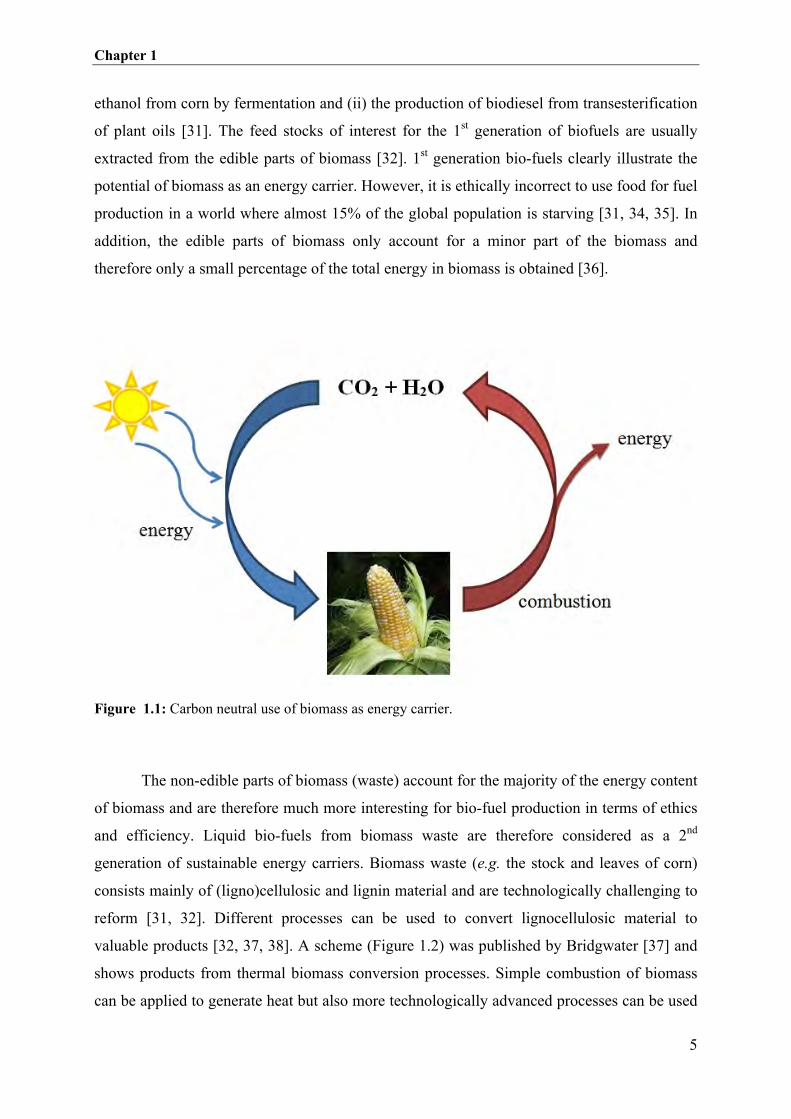
the future that will (partly) replace crude oil derived fuels [27-29]. Emissions of CO2 due to
combustion of biomass derived fuels contribute much less to global warming as the exhausted
carbon originated from the atmosphere (Figure 1.1). Plants and trees convert CO2 and H2O
under influence of sunlight to sugars which form the basis of the biomass material. Biomass
can be considered as a storage material for solar energy. Combustion of biomass material
releases the contained solar energy.
The most interesting way to use biomass as an energy carrier is to convert it to liquid
bio-fuels [27, 30, 31]. Liquid bio-fuels have similar properties as conventional liquid fuels
and can therefore be introduced in our society without the need for major adjustments to the
infrastructure or automotive engines. The conversion of biomass to liquid fuels (BTL-fuels) is
already being studied for decades. The largest advantages of BTL fuels are (i) up to 90%
lower CO2 emissions, (ii) no emissions of fine dust and (iii) very low NOx emissions [27].
The 1st generation of bio-fuels involved the conversion of relatively simple molecules
such as sugars and vegetable oils to produce liquid biofuels [32, 33]. From the viewpoint of
process technology, these biomass components are relatively easy to convert to bio-fuels due
to their simple chemical structure. Examples of such processes are (i) the production of bio-
Chapter 1
5
ethanol from corn by fermentation and (ii) the production of biodiesel from transesterification
of plant oils [31]. The feed stocks of interest for the 1st generation of biofuels are usually
extracted from the edible parts of biomass [32]. 1st generation bio-fuels clearly illustrate the
potential of biomass as an energy carrier. However, it is ethically incorrect to use food for fuel
production in a world where almost 15% of the global population is starving [31, 34, 35]. In
addition, the edible parts of biomass only account for a minor part of the biomass and
therefore only a small percentage of the total energy in biomass is obtained [36].
Figure 1.1: Carbon neutral use of biomass as energy carrier.
The non-edible parts of biomass (waste) account for the majority of the energy content
of biomass and are therefore much more interesting for bio-fuel production in terms of ethics
and efficiency. Liquid bio-fuels from biomass waste are therefore considered as a 2nd
generation of sustainable energy carriers. Biomass waste (e.g. the stock and leaves of corn)
consists mainly of (ligno)cellulosic and lignin material and are technologically challenging to
reform [31, 32]. Different processes can be used to convert lignocellulosic material to
valuable products [32, 37, 38]. A scheme (Figure 1.2) was published by Bridgwater [37] and
shows products from thermal biomass conversion processes. Simple combustion of biomass
can be applied to generate heat but also more technologically advanced processes can be used

Chapter 1
6
to get more valuable products such as liquid biofuels or other bio-chemicals. One widely
studied multistage process is gasification of the biomass to produce syngas which is converted
to liquid fuels by the Fischer Tropsch process [27, 28]. The biggest advantage of this process
is that properties of the fuel can be controlled very well and tuned to specific requirements.
The thermal efficiency of this process is relatively low as the process is energy intensive. In
addition, the cost of producing biodiesel by BTL is higher than for fossil diesel [39].
Figure 1.2: Products from thermal biomass conversion as reported by Bridgwater [37].
A more economically feasible approach than Fischer-Tropsch coupled gasification is
the direct conversion of biomass to pyrolysis-oil via flash pyrolysis [40, 41]. Biomass is
heated in a few seconds to a temperature of ±500 °C in an oxygen-free reactor [37]. During
this process, the lignocellulosic structure of biomass disintegrates to smaller molecules due to
the heat but is not combusted due to the lack of oxygen. Gas, liquid and solid products are
formed during the pyrolysis process. The gas products consist of gases such as COx, CH4 and
H2 and can be combusted to generate heat for the pyrolysis reactor. The solid product consists
mainly of salt which can be used as a fertilizer and char which can be burned to generate heat
for the process. The liquid product formed during pyrolysis is commonly referred to as
pyrolysis oil and consists of a complex mixture of organic compounds with different
polarities and up to 30 wt% of water [37, 42, 43]. The compounds in pyrolysis-oil are usually
distinguished in an organic and an aqueous fraction. Pyrolysis-oil has a few disadvantages
that makes it a low grade fuel compared to fossil fuel; (i) the high oxygen and water content

Chapter 1
7
of bio-oil is responsible for a low heating value, (ii) the low pH caused by the high
concentration of organic acids leads to a corrosive nature of the oil, (iii) chemical and thermal
instability, (iv) immiscible with conventional fuels and (v) high viscosity and surface tension
compromises its applicability [43]. Further processing of pyrolysis oil is necessary to upgrade
the properties to commercially attractive levels [40, 44]. One way to achieve this is to remove
the aqueous fraction from the pyrolysis-oil. The aqueous fraction consists of soluble
oxygenated components such as alcohols, ketones, aldehydes and organic acids. These
components are by definition rich in oxygen -partly oxidized already- and therefore contribute
in a great extent to the low heating value of the pyrolysis oil [45]. In addition, carboxylic
acids such as acetic acid removed by water extraction reduce the corrosive properties of the
oil [43]. The organic fraction of the oil (or in this thesis referred to as bio-oil) can be further
processed to liquid fuels. However, the organic fraction is still rich in oxygen [37] and
therefore has a lower heating value compared to crude oil. Removal of oxygen from bio-oil is
therefore required to increase the energy content. Hydro-de-oxygenation is a process that can
be applied to remove this oxygen in the form of water by treating the bio-oil with expensive
hydrogen [44]. The amount of hydrogen needed for de-oxygenation of the bio-oil is
dependent on the degree of oxidation and the complexity of the molecules in the bio oil. It
was reported by Bridgwater that ± 62 gram of H2 is necessary to achieve full deoxygenation
of 1 kg of bio-oil with an initial 50% oxygen content [46]. An elegant way to (partly) obtain
the necessary hydrogen for upgrading of the oil fraction is to produce hydrogen from the
extracted aqueous fraction [47, 48]. The integration of the bio-oil refinery with hydrogen
production from the aqueous fraction is a promising route to sustainable liquid bio-fuels as
shown in Figure 1.3.
In the future, hydrogen from renewable resources is also projected to partly replace
conventional fuels to reduce anthropogenic CO2 emissions [49]. Hydrogen is expensive and is
sold on the market for >$2200 per ton. The future technology developed for hydrogen
production from the aqueous phase of bio oil is also expected to be applicable for the
production of hydrogen from other bio-organic aqueous waste streams. Production of
hydrogen by eliminating bio-organic waste streams is very attractive from both economic and
environmental viewpoint.

Chapter 1
8
Figure 1.3: Integration of hydrogen production from aqueous waste stream with the bio-oil reformer.

Chapter 1
9
1.3 Aqueous phase reforming of oxygenates
Biomass derived aqueous waste-streams usually contain a variety of water soluble
organic compounds. For instance, the aqueous fraction of flash pyrolysis oil commonly
consist of 80 wt% water and 20 wt% of a complex mixture of different oxygenates such as
aldehydes, ketones, alcohols, acids and sugars [50]. The conversion of aqueous bio/organic
wastes (>80% water) into high heating value products such as hydrogen, syngas (CO/H2) and
methane using conventional reforming processes at lower pressures is energy intensive due to
the need for the evaporation of water. Dumesic and co-workers tackled this problem by
developing the so called “aqueous phase reforming” (APR) process [47, 51, 52], in which the
water is kept in the liquid phase by applying elevated pressures. The concept was
demonstrated for reforming of diluted oxygenate feeds at mild temperatures in pressurized
liquid water (225 – 265 °C, 29 – 56 bar) over supported metal catalysts. The phase diagram of
water is shown in Figure 1.4 and shows the pressures required to keep hot water in the liquid
phase.
Catalytic APR studies with model compounds are carried out to simplify the process
and gain fundamental understanding of catalytic reforming. The knowledge gained from these
fundamental studies can be exploited to improve and design catalysts to favor certain
pathways and products and prevent the formation of others. Important reactions during
reforming are C-H, C-C and C-O bond cleavage. To prevent alkane formation, it is preferred
that every carbon atom is connected to one oxygen atom to enable reforming of the molecule
to CO and H2. Ethylene glycol (EG) is chosen as a model compound to study fundamental
catalytic behavior because it is the smallest molecule (hence avoiding the occurrence of
complicated side reactions) with all carbon atoms bonded to oxygen (preventing intrinsic
methane formation) where both desired and undesired pathways (C-C, C-O and C-H
cleavage) can occur.

Chapter 1Chapter 1Chapter 1
Figure 1.4:
Chapter 1
Figure 1.4:Figure 1.4:Figure 1.4: Phase diagram of water.Phase diagram of water.Phase diagram of water.Phase diagram of water.Phase diagram of water.Phase diagram of water.Phase diagram of water.
1010

Chapter 1
11
The reforming of ethylene glycol has been studied intensively by Dumesic and
colleagues [53] and a reforming mechanism has been proposed by them as shown in Figure
1.5. EG first undergoes dehydrogenation and adsorption on the catalyst surface. The formed
intermediate can further react through two pathways. The desired pathway to form hydrogen
involves C-C cleavage which results in H2 gas and adsorbed CO. Hydrogen yields can be
further increased by the water gas shift reaction (CO + H2O � CO2 + H2). The undesired
pathway involves cleavage of the C-O bond leading to species such as acids and alcohols that
can further undergo sequential reforming to produce alkanes. Other pathways leading to
undesired products include dehydration of ethylene glycol to produce vinyl alcohol.
Sequential hydrogenation of vinyl alcohol results in the formation of ethanol. Direct
hydrogenation of COx can also lead to the formation of CH4 or even higher alkanes through
the Fischer-Tropsch process.
Figure 1.5: Ethylene glycol reforming pathway as suggested by Dumesic et al. [53].
Dumesic et al. [53] reported the thermal dependence of the standard Gibbs free energy
for water gas shift and EG reforming reactions in liquid and vapor phase as shown in Figure
1.6. A negative value for the standard Gibbs free energy (∆G/RT<0) indicates that the process
is spontaneous. The Gibbs free energy of the water gas shift reaction in liquid phase was

Chapter 1
12
reported to be negative and temperature independent in the range 300 – 650 K (27-375 ⁰C). In
case of vapor phase water gas shift reaction, the reaction becomes less favorable at higher
temperatures. The reforming of ethylene glycol in liquid phase compared to vapor phase
becomes more favorable beyond 450 K (175 ⁰C). The advantages of aqueous phase reforming
are (i) no need for evaporation of the water and (ii) the water gas shift activity and reforming
are more favored in liquid phase than in vapor phase at temperatures above 175 ⁰C.
Figure 1.6: Thermodynamic calculations for the reforming of ethylene glycol [53].
Shabaker et al. [51] studied the reaction order of EG reforming at 225 °C and 29 bars.
They found that the reaction order was dependent on the EG feed concentrations. The order
was reported to be 0.5 for 1-4 wt% feed streams and decreased to 0.3 for 10 wt% feed
streams. Furthermore, it was shown that the order for hydrogen production was -0.5 which
indicates that the presence of hydrogen had a weak inhibiting effect on the reaction. An
Activation energy of 100 KJ/mol was calculated for EG reforming at those reaction
conditions.

Chapter 1
13
Typical temperatures for fundamental APR studies of model components (e.g.
ethylene glycol, methanol and sorbitol) are usually performed in the temperature range of
200-265 °C [51, 54]. The reforming of more concentrated feed streams or more complex
oxygenates, that are of more commercial relevance, require higher temperatures to obtain the
reaction rates which are necessary for industrial application [48]. Properties of hot
compressed water are strongly dependent on the exact temperature and pressure of the water
and show a significant influence on the reaction. Increasing the temperature of liquid water
above 374 ⁰C (and 221 bar pressure) brings the water into the supercritical state. A dramatic
change in properties occurs when water becomes supercritical and these offer some other
advantages for the reforming of biomass derived waste streams into gaseous products [48, 55-
57]. Sub- and supercritical water are considered different reaction regimes due to the extreme
differences in properties. Sub- and supercritical water are discussed in more detail in the next
section (section 1.4)
1.4 Reaction in sub- and supercritical water
Aqueous Phase Reforming can be divided in a sub- and a supercritical regime. The
transition from sub- to supercritical water occurs at 374 °C and 221 bars. Properties of sub-
and supercritical water (SCW) vary significantly and will be reflected in reforming reactions.
Kritzer [58, 59] reported the effect of temperature on density, dielectric constant and ionic
product of liquid water as shown in Figure 1.7. It can be seen that density of water decreases
gradually with increasing temperature. However, a drastic decrease in density occurs crossing
the supercritical point. The density beyond the supercritical point is around ± 100 kg / m3. A
further increase in temperature does not affect the density significantly anymore. The
properties of liquid water and compressed gas converge around the supercritical point,
resulting in complete mixture of both phases and the removal of the liquid/gas phase
boundary. The latter is very beneficial for fast rates of heat and mass transfer [48].
Another very important parameter for reactions in hot compressed water is the ionic
product. The dissociation of water is an endothermic process and therefore an increase in
temperature results in a higher ion product. However, at the same time, an increase in
temperature results in lower density which causes a lower ionic solvability [58, 59]. These
two competing phenomena determine the ionic product of hot compressed water. The

Chapter 1
14
behavior of the ionic product can be seen from Figure 1.7 [59]. Initially, the ion product
increases with temperature and reaches a maximum around 300 °C. Under those conditions,
the ion product is ±1000 times higher than under ambient conditions. A further increase in
temperature results in a gradual decrease in ionic product because the decrease in water
density becomes more pronounced. On passing the supercritical point, ionic product decreases
strongly due to the collapse of the water density value. The ionic product of supercritical
water is about a billion times less than under ambient conditions. The high ionic product in
subcritical water can be exploited for acid/based catalyzed reactions. The ionic product can
significantly influence reaction rates and selectivities. On the other hand, the high ionic
product of subcritical water causes a lot of stress on (reactor) materials because the high
amounts of protons and ions are reported to propagate material leaching/corrosion [58, 60].
The low ionic product of supercritical water reduces the corrosive properties of water under
those conditions. However, severe corrosion in SCW is frequently reported (especially at high
temperatures and high densities) and is usually related to the presence of oxidizing species
(e.g. oxygen or halogens) in the feed stream [60].
Figure 1.7: The effect of temperature on the physical properties of liquid water (240 bar) [59].

Chapter 1
15
The polarity of a liquid is a very important factor that determines its salvation
properties. Polarity is strongly dependent on the dielectric constant of water which is again
influenced by the temperature. The effect of temperature on the dielectric constant of water
can be seen in Figure 1.7 and includes a comparison with organic solvents [59]. Under
ambient conditions, water has a high dielectric constant of ± 80 and has therefore a polar
character. Polar compounds such as salts (e.g. NaCl) and polar gases (e.g. NH3, SO2) have a
high solvability in ambient water. An increase in temperature disrupts the hydrogen-bond
network, resulting in a lower dielectric constant and hence polarity. The dielectric constant
just before the supercritical point is 20 and decreases rapidly to less than 5 beyond this point.
The low dielectric constant of supercritical water causes water to behave as a non-polar
solvent. Therefore, organic components (e.g. Lignin and other biomass derived compounds)
and non-polar gases dissolve easily in supercritical water while salts do not. The non-polar
character of supercritical water can be exploited for catalytic reactions to prevent coke
deposition on the catalyst [61].
1.5 Challenges
Many APR studies [47, 62-65] were already undertaken by different research groups
to study the reforming of model compounds under mild subcritical water conditions (175-265
⁰C and 32-56 bar). APR conditions are ideal for fundamental reforming studies; however
reaction rates are relatively slow at these low temperatures and therefore studies are limited to
low concentrated feed solutions or long residence times.
The ultimate goal is to develop a commercial and technologically feasible (catalytic)
process for the production of hydrogen by APR of industrial biomass derived aqueous streams
that contain complex mixtures (15-25 wt%) of oxygenates. Therefore, much higher reaction
rates are required compared to low temperature APR to achieve this goal. Achieving high H2
yields by reforming of high concentrated feeds is not only a matter of increasing the catalytic
reaction rate. Thermodynamics predict an increase in alkane formation for reforming
reactions with higher feed concentrations [66]. Production of alkanes should be avoided as it
competes with the hydrogen yields. Furthermore, low temperature APR is also reported to be
subject to mass transfer limitations which can severely hinder the catalytic reaction for high
feed concentrations. As an example, it was shown by Shabaker and colleagues [51] that APR

Chapter 1
16
of ethylene glycol (225 °C and 29.3 bar) with a 3.4 wt% Pt/Al2O3 (63 – 125 µm particle size)
catalyst was affected by intra-particle mass transfer limitations when an EG feed
concentration of 10 wt% was used.
Catalytic supercritical water reforming is promising for achieving high reforming rates
and overcome mass transfer limitations. Tang et al. [48] published a nice overview of
catalytic supercritical water reforming studies of biomass derived compounds. High reaction
rates for the reforming of concentrated oxygenate streams were reported. However, stability
and selectivity issues with the studied catalysts are serious drawbacks for industrial
exploitation of this process [48]. Catalyst stability issues in hot compressed water are mainly
related to sintering of the supported metal particles [48] or instability of conventional metal
oxides catalyst supports (e.g. Al2O3, TiO2 and ZrO2) [67, 68]. Issues with metal oxide
supports are already experienced at low temperature APR conditions [69].
The challenge to make sub- or supercritical water reforming of biomass derived waste
streams commercially feasible involves the development of catalysts that (i) show high
stability in hot compressed water, (ii) are able to convert high concentrated feed streams under
industrial relevant residence times, and (iii) produce high H2 yields. Fundamental
understanding of the reforming pathways and deactivation mechanisms help in the
development of such catalysts.
1.6 Scope and outline of the thesis
The main objective of this thesis is to develop an efficient catalyst for hydrogen
production by reforming of industrial biomass derived waste streams and in parallel gain more
understanding about reaction pathways and catalyst deactivation mechanisms.
Initial experiments were performed with the model compound Ethylene Glycol (EG)
because of the reasons discussed earlier in section 1.3. Industrial waste streams commonly
have oxygenate concentrations of ±15 wt% and therefore this concentration was chosen as
target for the initial EG reforming experiments.
From literature, it was also clear that long residence times were necessary for
reforming of high concentrated feeds under temperate APR conditions. Residence times in the
catalytic bed should be industrially applicable and this would generally mean that it should be

Chapter 1
17
in the order of seconds. Furthermore, mass transfer was expected to be a problem for
reforming of high concentrated feed streams under mild APR conditions. Therefore, it was
decided to start studying APR under supercritical water conditions to achieve high reaction
rates and overcome mass transfer limitations.
An initial catalyst screening experiment is described in Chapter 3. Potential catalysts
were selected based on a literature study and were studied for reforming of high concentration
EG solutions in SCW (450 ⁰C and 250 bar). The most promising catalyst (Pt/Al2O3) was
further optimized by promoting it with a second metal (Ni). The developed Pt-based catalyst
was found to be very promising for EG reforming at those conditions and is selected for
further studies. This chapter is published in the following manuscript:
D.J.M. de Vlieger, A.G. Chakinala, L. Lefferts, S.R.A. Kersten, K. Seshan and D.W.F.
Brilman, Appl. Catal. B 111-112 (2012) 536-544
The effect of side reactions during catalytic reforming of EG in SCW on the catalytic
performance of the developed alumina supported Pt based catalyst is discussed in Chapter 4.
The effect on H2 yields and catalyst stability of sequential reforming of the identified
byproducts methanol, ethanol and acetic acid is discussed. The reason for catalyst
deactivation in the presence of acetic acid is addressed. This chapter led to the publication of
the following manuscript:
D.J.M. de Vlieger, B.L. Mojet, L. Lefferts and K. Seshan, J. Catal. 292 (2012) 239-245
Chapter 5 addresses the need for new catalytic support materials for acidic feed
streams. The performance of carbon nanotubes (CNT) supported Pt catalysts for SCW
reforming ethylene glycol and acetic acid is discussed. CNT showed to be very stable catalyst
support material for reforming in SCW. Furthermore, it became evident that acetic acid is an
important model compound for which Pt does not show good activity. This chapter resulted in
publication of the subsequent article:
D.J.M. de Vlieger, D.B. Thakur, L. Lefferts and K. Seshan, ChemCatChem 4 (2012)
2068-2074
In Chapter 6, stability and efficiency of Ru-CNT for the catalytic reforming of acetic
acid in sub- and supercritical water was studied. Ru/CNT deactivated in high temperature
subcritical water and the reason for deactivation is discussed. Ru/CNT showed high stability

Chapter 1
18
and commercial attractive activity for the reforming of acetic acid in supercritical water. This
work is submitted for publication and is currently being reviewed.
The high stability and good reforming activity of Ru/CNT catalyst opened the door to
move away from model compounds and study the reforming of real aqueous phase of flash
pyrolysis oil as discussed in Chapter 7. Non-catalytic issues were observed during this study
and prevent a feasible exploitation of APR of certain feed streams at the moment.
Conclusions, concept evaluations and outlook of this study are discussed in Chapter 8.
References
[1] International Energy Agency, World energy outlook (2008)
[2] British Petroleum, Statistical Review of World Energy (2011)
[3] J. Kjarstad, F. Johnsson, Energ. Policy 37 (2009) 441-464.
[4] International Energy Agency, From Resources to reserves (2005)
[5] R. Martninez-Palou, M. Mosqueira, B. Zapata-Rendón, E. Mar-Juárez, C. Bernal-
Huicochea, J. de la Cruz Clavel-López, J. Aburto, J. Pet. Sci. Eng. 75 (2011) 274-282.
[6] D.K. Olsen, E.B. Ramzel, Fuel 71 (1992) 1391-1401.
[7] G. Houlton, Global Crude oil supply and quality trends, COQA San Antonio (2011)
[8] H.R. Mortaheb, F. Ghaemmaghami, B. Mokhtarani, Chem. Eng. Res. Des. 90 (2012)
409-432.
[9] L. Hughes, J. Rudolph, Curr. Opin. Environ. Sustainability 3 (2011) 225-234.
[10] F. Curtis, Ecol. Econ. 69 (2009) 427-434.
[11] W.P. Nel, C.J. Cooper, Energ. Policy 36 (2008) 1096-1106.
[12] P. Hanlon, G. McGartney, Public Health 122 (2008) 647-652.
[13] C. Lutz, U. Lehr, K.S. Wiebe, Energ. Policy In Press (10.1016/j.enpol.2012.05.017)
[14] G. Bridge, Geoforum 41 (2010) 523-530.
[15] G. Maggio, G. Cacciola, Fuel 98 (2012) 111-123.
[16] K. Aleklett, M. Höök, K. Jakobsson, M. Lardelli, S. Snowden, B. Söderbergh, Energ.
Policy 38 (2010) 1398-1414.
[17] D.L. Greene, J.L. Hopson, J. Li, Energ. Policy 34 (2006) 515-531.
[18] S. Sorrell, J. Speirs, R. Bentley, A. Brandt, R. Miller, Energ. Policy 38 (2010) 5290-
5295.

Chapter 1
19
[19] C. Anastasi, R. Hudson, V.J. Simpson, Energ. Policy 18 (1990) 936-944.
[20] J. Dignon, Atmos. Environ. A-Gen. 26 (1992) 1157-1163.
[21] L. Chiari, A. Zecca, Energ. Policy 39 (2011) 5026-5034.
[22] M.F. Akorede, H. Hizam, M.Z.A. Ab Kadir, I. Aris, S.D. Buba, Renew. Sust. Energ.
Rev. 16 (2012) 2747-2761.
[23] G.R. Walther, E. Post, P. Convey, A. Menzel, C. Parmesan, T.J.C. Beebee, J.M.
Fromentin, O. Hoegh-Guldberg, F. Bairlein, Nature 416 (2002) 389-395.
[24] T. Abbasi, M. Premalatha, S.A. Abbasi, Renew. Sust. Energ. Rev. 15 (2011) 891-894.
[25] D.G. Kessel, J. Pet. Sci. Eng. 26 (2000) 157-168.
[26] K. Sipila, A. Johansson, K. Saviharju, Bioresource Technol. 43 (1993) 7-12.
[27] P.K. Swain, L.M. Das, S.N. Naik, Renew. Sust. Energ. Rev. 15 (2011) 4917-4933
[28] D.O. Hall, J.I. House, Sol. Energ. Mat. Sol. C. 38 (1995) 521-542.
[29] T. Gul, S. Kypreos, H. Turton, L. Barreto, Energ. 34 (2009) 1423-1437.
[30] M. Grahn, C. Azar, K. Lindgren, G. Berndes, D. Gielen, Biomass Bioenerg. 31 (2007)
747-758.
[31] P.S. Nigam, A. Singh, Prog. Energ. Combus. 37 (2011) 52-68.
[32] S.N. Naik, V.V. Goud, P.K. Rout, A.K. Dalai, Renew. Sust. Energ. Rev. 14 (2010)
578-597.
[33] A. Demirbas, App. Energ. 86 (2009) s108-s117.
[34] G.R. Timilsina, A. Shrestha, Energy 36 (2011) 2055-2069.
[35] H.N. Lazarides, Procedia Food Sci. 1 (2011) 1854-1860.
[36] L.O. Pordesimo, B.R. Hames, S. Sokhansanj, W.C. Edens, Biomass Bioenerg. 28
(2005) 366-374.
[37] A.V. Bridgwater, D. Meier, D. Radlein, Org. Geochem. 30 (1999) 1479-1493.
[38] T. Damartzis, A. Zabaniotou, Renew. Sust. Energ. Rev. 15 (2011) 366-378.
[39] K. Sunde, A. Brekke, B. Solberg, Forest Pol. Econ. 13 (2011) 591-602.
[40] A.V. Bridgwater, Biomass Bioenerg. 38 (2012) 68-94.
[41] M.M. Wright, D.E. Daugaard, J.A. Satrio, R.C. Brown, Fuel 89 (2010) S2-S10.
[42] J. Xie, D. Su, X. Yin, C. Wu, J. Zhu, Int. J. Hydrogen Energ. 36 (2011) 15561-15572.
[43] Q. Lu, W.Z. Li, X.F. Zhu, Energ. Convers. Manage. 50 (2009) 1376-1383.
[44] P.M. Mortensen, J. D. Grunwaldt, P.A. Jensen, K.G. Knudsen, A.D. Jensen, Appl.
Catal. A 407 (2011) 1-19.
[45] S. Zhang, Y. Yan, T. Li, Z. Ren, Bioresource Tech. 96 (2005) 545-550.
[46] A.V. Bridgwater, Catal. Today 29 (1996) 285 – 295.

Chapter 1
20
[47] R.D. Cortright, R.R. Davda, J.A. Dumesic, Nature 418 (2002) 964-967.
[48] Y. Guo, S.Z. Wang, D.H. Xu, Y.M. Gong, H.H. Ma, X.Y. Tang, Renew. Sust. Energ.
Rev. 14 (2010) 334-343.
[49] A. Tanksale, J.N. Beltramini, G.M. Lu, Renew. Sust. Energ. Rev. 14 (2010) 166-182.
[50] J.A. Medrano, M. Oliva, J. Ruiz, L. Garcia, J. Arauzo, J. Anal. Appl. Pyrol. 85 (2009)
214-225.
[51] J.W. Shabaker, R.R. Davda, G.W. Huber, R.D. Cortright, J.A. Dumesic, J. Catal. 215
(2003) 344-352.
[52] G.W. Huber, J.W. Shabaker, S.T. Evans, J.A. Dumesic, Appl. Catal. B 62 (2006) 226-
235.
[53] R.R. Davda, J.W. Shabaker, G.W. Huber, R.D. Cortright, J.A. Dumesic, Appl. Catal.
B 43 (2003) 13-26.
[54] R.R. Davda, J.W. Shabaker, G.W. Huber, R.D. Cortright, J.A. Dumesic, Appl. Catal.
B 56 (2005) 171-186.
[55] Y. Matsumura, T. Minowa, B. Potic, S.R.A. Kersten, W. Prins, W.P.M. van Swaaij, B.
van de Beld, D.C. Elliott, G.G. Neuenschwander, A. Kruse, M.J. Antal jr., Biomass
Bioenerg. 29 (2005) 269-292.
[56] A. Yamaguchi, N. Hiyoshi, O. Sato, K.K. Bando, M. Osada, M. Shirai, Catal. Today
146 (2009) 192-195.
[57] M.H. Waldner, F. Krumeich, F. Vogel, J. Supercrit. Fluid. 43 (2007) 91-105.
[58] P. Kritzer, J. Supercrit. Fluid. 29 (2004) 1-29.
[59] P. Kritzer, E. Dinjus, Chem. Eng. J. 83 (2001) 207-214.
[60] P.A. Marrone, G.T. Hong, J. Supercrit. Fluid. 51 (2009) 83-103.
[61] J.B. Muller, F. Vogel, J. Supercrit. Fluid. 70 (2012) 126-136.
[62] F.Z. Xie, X.W. Chu, H.R. Hu, M.H. Qiao, S. R. Yan, Y. L. Zhu, H.Y. He, K.N. Fan,
H.X. Li, B.N. Zong, X.X. Zhang, J. Catal. 241 (2006) 211-220.
[63] A.V. Tokarev, A.V. Kirilin, E. V. Murzina, K. Eränen, L.M. Kustov, D.Y. Murzin,
J.P. Mikkola, Int. J. Hydrogen Energ. 35 (2010) 12642-12649.
[64] R.L. Manfro, A.F. da Costa, N.F.P. Ribeiro, M.M.V.M. Souza, Fuel Process. Technol.
92 (2011) 330-335.
[65] A.O. Menezes, M.T. Rodrigues, A. Zimmaro, L.E.P. Borges, M.A. Frago, Renew.
Energ. 36 (2011) 595-599.
[66] R.R. Davda, J.A. Dumesix, Angew. Chem. Int. Edit. 42 (2003) 4068-4071.
[67] A.J. Byrd, R.B. Gupta, Appl. Catal. A 381 (2010) 177-182.
Chapter 1
21
[68] P. Azadi, R. Farnood, Int. J. Hydrogen Energ. 36 (2011) 9529-9541.
[69] R.M. Ravenelle, J.R. Copeland, W.G. Kim, J.C. Crittenden, C. Sievers, ACS Catal. 1
(2011) 552-561.

22

23
Chapter 2
Experimental
The experimental setup used for this study is described in detail in this Chapter.
Catalyst preparation and characterization, and methods used for analysis of feed
and product streams, are discussed. Furthermore, the definitions and calculations
used for this study are explained.

Chapter 2
24
2.1 Experimental setup Two similar experimental setups were used for the study that is discussed in this
thesis. Initial experiments (used for Chapter 3) were performed on a reforming setup which
was available in the TCCB group (University of Twente). Follow-up studies were performed
on a setup that was built for our research group CPM. The design of this setup was a direct
copy from the setup used at the TCCB group and dimensions were therefore similar. However
a few differences exist between the two setups, which are related to external apparatus and
discussed below.
Figure 2.1 shows the schematic diagram of the continuous flow aqueous phase
reformer used for the experiments in Chapter 3. Feed streams of oxygenates (typical
concentrations in the range of 1 - 30 wt% were used depending on the experiment) were
preheated to reaction conditions. After preheating, the solution entered a 63 cm long reactor
(ID = 7 mm) in which the catalyst was placed. The reactor effluent was cooled down to room
temperature with a counter-current heat exchanger and pressure was reduced by a back
pressure regulator to atmospheric pressure. A glass bottle was used to allow the separation of
gas and liquid products. The flow rate of the liquid reactor effluent was monitored using a
balance under the glass vessel. The amount of gas produced was measured with an Actaris
Gallus 2000 gas meter. Products in gas phase were determined by a Varian CP-4900 Micro
GC using MS5 and PPQ columns. Argon was used as carrier gas for both columns and this
configuration enabled us to detect CO levels above 0.1 v/v%. Gas analysis was subject to a
relative error of 1% per component. Carbon content analysis of the feed solution and the
liquid product was conducted using an Interscience Flash 2000 Organic Elemental Analyzer.
The total liquid effluent was analyzed after the reaction by a Shimadzu HPLC to identify the
liquid products formed during the reforming reaction. The HPLC was equipped with a RID-
10A detector and an Aminex HPX-87H (300x7.8mm) column. The latter was operated at 35
ºC. An aqueous solution of 0.005 M H2SO4 was used as elutant phase and was flown at a rate
of 0.600 mL. min-1. Sample volumes of 20 µl were injected into the column.
The experiments performed after Chapter 3 were conducted on the cloned setup at
CPM. The only differences between the experimental setups were that (i) gas production was
measured by a Brooks SLA-5860S gas meter which was calibrated for N2. Gas phase analysis
was used in combination with theoretical gas response conversion factors (H2 = 1.01, O2=
0.993, CO = 1.00, CO2= 0.70, CH4= 0.72, C2H6 = 0.50, C2H4 = 0.60) to correct for the actual

Chapter 2
25
gas production, (ii) High pressure ISCO pumps (model 500D) were used to feed reactants
and, (iii) carbon concentrations in the feed solution and the liquid effluent were determined by
an online Shimadzu TOC-VCSH analyzer (rel. error of 1% was applicable per TOC analysis).
2.2 Catalyst preparation
2.2.1 Catalyst preparation of metal oxide supported catalysts
Extrudates of γ-alumina (BASF AL-3992) were crushed and sieved to obtain particles
within a size range of 300-600 µm and were used as catalyst support. H2PtCl6•6H2O, IrCl4 and
Ni(NO3)2•6H2O precursors (analytical grade > 99.9%) were obtained from Alfa Aesar. Mono-
and bi-metallic catalysts were prepared by wet (co) impregnation. The desired amount of
precursor(s) was dissolved in water and added to the γ-alumina support (weight ratio
H2O/alumina = 1.8). The water was evacuated under vacuum at 100 °C. Catalysts made with
Cl containing precursors were treated at 100 °C for 5 h (10 °C min-1) under hydrogen (100
mL. min-1 H2 and 100 mL. min-1 N2) to remove any residual Cl [1]. Materials were finally
calcined at 500°C for 15 h (10 °C min-1) under air (200 mL. min-1).
2.2.2 Catalyst preparation of carbon nanotubes supported catalysts
Carbon nanotubes were obtained from ‘carbon NT&F 21®’ and used as catalyst
support without further purification. The properties of this material were provided by the
manufacturer and are given in Table 2.1. Pt and Ru decorated CNT were prepared by
impregnation. The metal precursors H2PtCl6•6H2O and Ru(NO)(NO3)3 (analytical grade >
99.9%) were obtained from Alfa Aesar. The desired amount of precursor was dissolved in
acetone and added to the CNT support (10 mL. of acetone per 1.0 gram of CNT). The acetone
was removed by evaporation in a vacuum oven. The temperature of the oven was increased at
a rate of 5 °C min-1 to a temperature of 100 °C under atmospheric pressure and subsequently
dried overnight at this temperature in reduced pressure (0.2 bar). Synthesized CNT supported
catalysts were further treated at 500 °C for 15 h (10 °C min-1) in hydrogen (100 mL min-1, 50
v/v% H2 in N2, 1 bar).

Chapter 2
26
Table 2.1 Properties of CNT
Purity (%) > 90
Diameter (nm) ~ 80-150
Length (µm) ~ 30
Amorphous carbon (%) < 5
Special surface area (m2/g) ~ 20
Thermal conductivity < 2000
2.3 Catalyst characterization
The following analysis methods were used to characterize fresh and used catalyst:
XRF analysis: Metal loadings on catalysts supports were determined using a Philips X-ray
fluorescence spectrometer (PW 1480).
BET analysis: Surface areas of the catalysts were measured applying the BET method on an
ASAP 2400 (Micromeritics).
TEM imaging: TEM images were taken on a JEOL 2010F equipped with EDX.
SEM imaging: SEM images were taken on a Zeiss 1550 HR-SEM.
CO-Chemisorption: Metal dispersions were determined with pulse CO chemisorption at room
temperature on 100 mg of alumina catalyst using a Micromeritics Chemisorb 2750. CO/Metal
stoichiometric ratios of 1 were assumed for all the catalysts. Before pulsing, the catalyst was
reduced in H2 at 400°C for 1 h and cooled down in helium to room temperature subsequently.
Average metal particle sizes for monometallic catalysts were calculated based on dispersion
values, assuming hemispherical particle shape.
TGA-MS analysis: Spent catalysts were analyzed by TGA-MS to determine any coke
deposits on the surface. Argon with 1 v/v% O2 was flown over the catalyst while the
temperature was increased from 25 to 800°C. The weight of the catalyst was monitored by
TGA and the composition of the gas output was analyzed by MS.

Chapter 2
27
Raman Spectroscopy: Raman spectroscopy of catalysts were recorded at ambient conditions
on a Bruker Senterra in a frequency range of 65 – 4000 cm-1 with a resolution of 9 – 13 cm-1.
A laser wavelength of 532 cm-1 with 10 mW and 5 mW power was used for alumina and CNT
supported catalysts, respectively.
XRD analysis: X-ray diffraction (XRD) patterns were collected over the range 2θ = 20 – 90°
on a Brooker D2 Phaser using Cu Kα1 radiation source.
TPR analysis: Catalysts (100mg) studied by TPR were first heated up to 500°C in oxygen
(5% O2 / 95% He) and then cooled down to room temperature in argon to remove any
moisture from the surface. TPR experiments were carried out in a 10 ml/min hydrogen flow
(5% H2 / 95% Ar) and the temperature was increased to 10°C min-1. Consumption of
hydrogen was taken as measure of reduction and plotted as function of temperature.
FT-IR spectroscopy: FT-IR spectra of alumina supported catalysts were taken on a Bruker
Tensor 27 with 4 cm-1 resolution and using a 5 mm aperture. Spectra were taken in the range
of 600 to 4000 cm-1 and averaged over 64 scan.
XPS spectroscopy: XPS spectra of the catalysts were obtained on a Quantera SXM from
Physical Electronics with an Al Kα X-Ray source (monochromatic at 1486.6 eV).
2.4 Definitions and calculations
Definitions and calculations used for this study are discussed in this section. The
catalyst performance is presented in terms of (i) carbon to gas conversion (sometimes referred
to as gasification efficiency), (ii) selectivities to gas phase products (gas purity), and (iii)
catalyst stability. The exposure time of feed stream on the catalyst is reported in terms of
weight hourly space velocities (WHSV). The catalyst activity is also discussed in terms of
Turn over Frequency (TOF, min-1).
Carbon to gas conversion: Carbon to gas conversion can be determined directly from the GC
and gas production results, however the many assumptions (e.g. ideal gas law) and parameters
involved in this method compromises the accuracy of this direct approach. Therefore, it was
decided to use an indirect approach with better accuracy. In this method, carbon to gas
conversion is defined as the percentage of carbon in the feed that is transformed to carbon in
gaseous products (COx, hydrocarbons) and is calculated according to

Chapter 2
28
"���������" ����"���������"���������������������
"���������" ���× 100%. Carbon removed from the feed
can either go to gas phase products or to coke. This method assumes that the amount of
carbon transformed to coke is negligible compared to the amount of carbon in gas phase. In
selected cases this was corrected for by estimating the amount of carbon deposited in solid
phase. Carbon contents in liquid streams were determined with a Shimadzu TOC–Vcsh
analyzer. A relative error of 1% was applicable per TOC analysis, resulting in a 2% error
(relatively) in the conversion number. The target of this study is to produce high heating value
gases and therefore conversion of gasified carbon is reported only and transformation to other
liquid products is not taken into account in the conversion.
Gas phase selectivities: Selectivity to carbon containing gas phase products ( i = COx, CH4
and C2+) were calculated according !"#"$. &% ="C")��*��)��)
"+")�,�*-��× 100%. The selectivity to
carbon containing gas phase products indicates the purity of the produced gas and is
calculated based on the distribution of carbon in these molecules. Side-reactions leading to
carbon containing molecules in the liquid phase were not taken into account for selectivity
calculations.
Selectivity to hydrogen is defined as the percentage of the maximal theoretical amount
of hydrogen formed based on the gasified carbon and is expressed as !"#"$. ./% =
01�����*�23��2
+4���)�,�*-��×5
66× 100%. The reforming ratio (RR) is the maximum amount of H2
(incl. water gas shift reaction) that can be produced per gasified carbon atom (H2/CO2). The
RR for ethylene glycol and acetic acid reforming is 2.5 and 2.0, respectively, as shown below.
RR for ethylene glycol is 5/2
C2H6O2 → 3 H2 + 2 CO (optimal reforming)
2 CO + 2 H2O → 2 H2 + 2 CO2 (WGS)
C2H6O2 → 5 H2 + 2 CO2 (overall optimal reaction)
RR for acetic acid is 4/2
CH3-COOH → 2 H2 + 2 CO (optimal reforming)
2 CO + 2 H2O → 2 H2 + 2 CO2 (WGS)
CH3-COOH + 2H2O → 4 H2 + 2 CO2 (overall optimal reaction)

Chapter 2
29
Weight hourly space velocities: Weight hourly space velocities (WHSV) indicate the grams
of oxygenates fed to the reactor per gram of catalyst per hour.
Turn over frequencies: Turn over frequencies (TOF) were calculated for the monometallic
catalysts based on the metal dispersions and is defined as the number of respective molecules
produced/reacted per active catalytic site per minute.
References
[1] D. Radivojevic, K. Seshan, L. Lefferts, Appl. Catal. A 301 (2006) 51-58.

Chapter 2
30
Figure 2.1: Schematical drawing of the experimental setup
31
Chapter 3
Development of an efficient catalyst for the reforming of
ethylene glycol in supercritical water
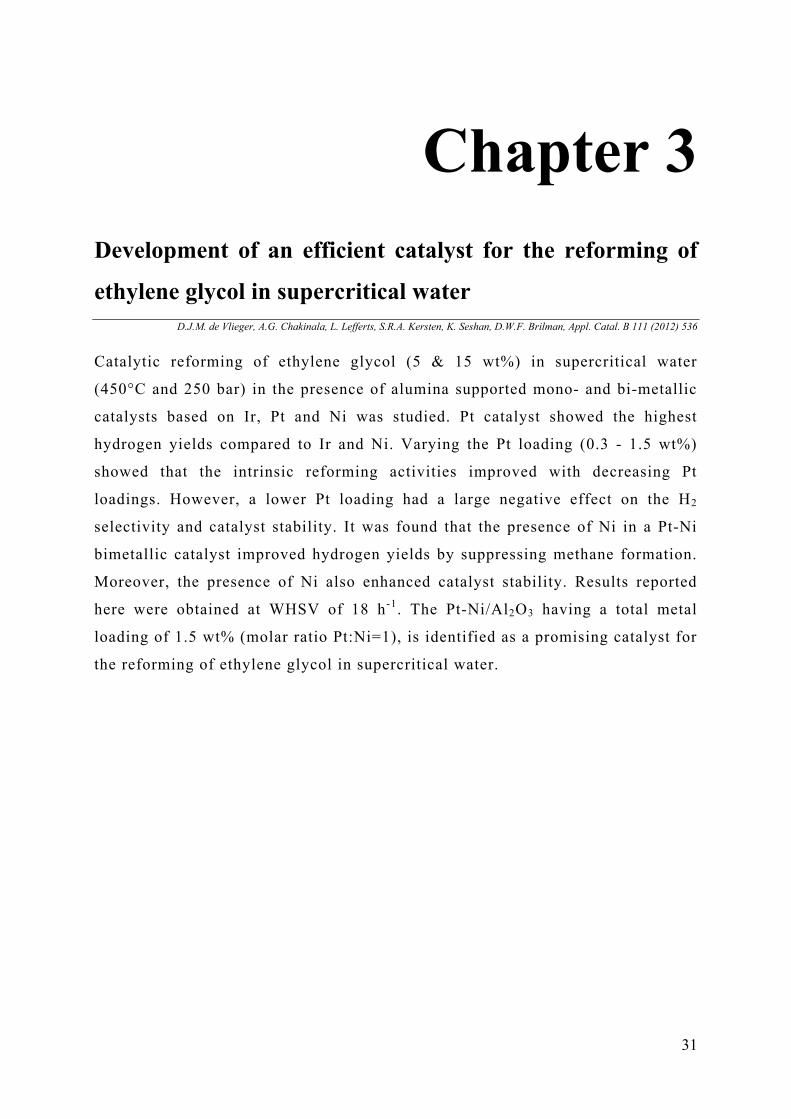
D.J.M. de Vlieger, A.G. Chakinala, L. Lefferts, S.R.A. Kersten, K. Seshan, D.W.F. Brilman, Appl. Catal. B 111 (2012) 536
Catalytic reforming of ethylene glycol (5 & 15 wt%) in supercritical water
(450°C and 250 bar) in the presence of alumina supported mono- and bi-metallic
catalysts based on Ir, Pt and Ni was studied. Pt catalyst showed the highest
hydrogen yields compared to Ir and Ni. Varying the Pt loading (0.3 - 1.5 wt%)
showed that the intrinsic reforming activities improved with decreasing Pt
loadings. However, a lower Pt loading had a large negative effect on the H2
selectivity and catalyst stability. It was found that the presence of Ni in a Pt-Ni
bimetallic catalyst improved hydrogen yields by suppressing methane formation.
Moreover, the presence of Ni also enhanced catalyst stability. Results reported
here were obtained at WHSV of 18 h-1. The Pt-Ni/Al2O3 having a total metal
loading of 1.5 wt% (molar ratio Pt:Ni=1), is identified as a promising catalyst for
the reforming of ethylene glycol in supercritical water.

Chapter 3
32
3.1 Introduction
As discussed in Chapter 1, aqueous phase reforming (APR) of bio/organic feeds is a
promising technique for the production of renewable hydrogen. Commercially interesting
feeds, such as the aqueous phase of flash pyrolysis oil, typically contain oxygenate
concentrations in the range of 15 - 20 wt%. Nakamura et al. [1] reported that complete
conversion of feeds containing at least 15 wt% oxygenates is required to be economically
viable under supercritical APR conditions.
Under low temperature APR conditions, thermodynamics favor selectivity towards
alkanes in preference to hydrogen [2]. Increasing the temperature shifts the thermodynamic
equilibrium towards hydrogen at the expense of methane. However, large amounts (~ 50%) of
alkanes are still favored up to temperatures of 400 °C [2]. Hydrogen and alkanes are formed
through different pathways (section 1.3) and therefore catalysts are required to control the
reforming reaction kinetically to obtain higher hydrogen yields. The target of this study is the
development of such a catalyst for the production of hydrogen from bio/organic feeds, taking
into account commercially relevant parameters such as feed concentrations and residence
times. The initial study described in this chapter is focused on the reforming of the model
compound, ethylene glycol, due to the reasons discussed in section 1.3. Catalyst design should
take into account (i) high gasification rates, and (ii) minimization of alkane formation.
Further, minimizing coke formation and catalyst deactivation is of importance for practical
applications.
It was shown earlier in section 1.3, that catalysts for APR should be active for C-C
bond cleavage in order to be able to decompose the organic molecules and they should further
enhance the Water Gas Shift (WGS) reaction (Eq. 1) to maximize hydrogen yields.
Methanation (Eq. 2) and Fischer Tropsch (Eq. 3) are undesired side reactions, as they
consume the desired product, H2. In order to suppress these reactions, catalysts should not be
active for C-O bond breaking [3]. Lower alkane selectivities are therefore expected for
catalysts with low affinity towards C-O bond dissociation.
Water-Gas-Shift: CO + H2O → CO2 + H2 Eq. 1
Methanation: COx + (2+x) H2 → CH4 + xH2O Eq. 2
Fischer-Tropsch: CO + 2H2 → -CH2- + H2O Eq. 3

Chapter 3
33
In 2003, Davda et al. [3] reported the relative activities of different metals for C-C, C-
O bond dissociation, and for WGS reaction. They reported high C-C bond breaking activities
for Ir, Ru and Ni. Therefore, these metals might be promising catalysts for breaking down
oxygenates. Adsorbed oxygenate fractions on the catalyst surface resulting from C-C bond
dissociation undergo dehydrogenation, yielding H2 and CO [3]. Follow-up reactions, such as
methanation and WGS, strongly control the final hydrogen yield. Ir showed very low
methanation activity but in contrast to Ru and Ni, almost no WGS activity was reported.
Furthermore, Ru and Ni were reported to have high activities for methane formation [3].
Many APR studies with Ru-based catalysts confirm the tendency of Ru to form
alkanes. For instance, silica supported Ru catalyst was reported to be an active catalyst for
APR of ethylene glycol but the gas formed was very rich in methane [4]. Byrd et al. [5]
reported complete conversion of a 40 wt% glycerol solution during APR (750 - 800°C) over
Ru/Al2O3 catalyst, but also observed the formation of considerable amounts of undesired
methane. Kersten et al. [6] observed full conversion for reforming of a 17 wt% glucose
solution to methane rich product gas at 600 °C using a 3 wt% Ru/TiO2 catalyst. The high
tendency of Ru to form alkanes makes it an unsuitable catalyst candidate to achieve high H2
yields during APR of ethylene glycol.
Ni based catalysts have been explored frequently for gasification of oxygenates (e.g.
glucose, phenol, methanol) under supercritical water conditions [7-10]. Ni based catalysts are
generally active for gasification, but often tend to deactivate due to sintering and or coke
formation [7-8]. Selectivities to hydrogen and methane vary significantly in the studies
reported and the choice of support seems to have a strong influence [11]. An unsupported Ni
metal wire gave high hydrogen selectivities when methanol was used as reactant [8]. Ni is
relatively cheap compared to other (noble) metals and is therefore also a very interesting
option from an economical viewpoint.
Another very promising catalytically active metal for APR is Pt. Stable catalytic
performance with high activity and selectivity towards hydrogen has been reported over Pt/γ-
Al2O3 catalyst for APR of different model oxygenates, namely methanol, ethylene glycol,
glycerol and sorbitol [12-14]. Based on the activity for C-C bond breaking [3], Pt is not
expected to be a good candidate to decompose oxygenates during APR. However, Pt does
show a relatively high activity for WGS [3], indicating that the rate determining step in APR

Chapter 3
34
of ethylene glycol might be related to the water-gas-shift reaction. Furthermore, methanation
is reported to be very low on Pt [3].
Based on the information available for APR, and discussed above in terms of H2/CH4
selectivities and maximizing hydrogen yields, three monometallic catalyst systems Ir, Ni and
Pt were chosen for the reforming of the model compound ethylene glycol in supercritical
water. Alumina is chosen as catalyst support material due to (i) its relatively high thermo-
physical stability and (ii) its ability to activate water, which is required for the bi-functional
APR mechanism. Development of a bimetallic Pt-Ni catalyst for the efficient production of
hydrogen from ethylene glycol is discussed.
3.2 Experimental
3.2.1 Catalyst preparation and characterization
Alumina supported Ir, Ni, Pt and Pt-Ni (molar ratio 1:1) catalysts were prepared as
described in section 2.2.1. Fresh and used catalysts were characterized by XRF, BET, CO-
chemisorption, XRD, TGA-MS, TPR and TEM imaging. These techniques are further
described in detail in section 2.3.
3.2.2 Catalytic testing
The supercritical water reformer, analysis techniques and definitions used for this
study are described in detail in Chapter 2. A 2 mL. min-1 flow of ethylene glycol (≥99%
Sigma Aldrich) solution was preheated to 450°C at a pressure of 250 bar. After preheating,
the solution entered the reactor in which 1.0 g of catalyst was placed. The reaction was
performed at 450 °C and 250 bars. Under these conditions water is in the supercritical regime.
Weight hourly space velocities of EG for reforming of 5 and 15 wt% ethylene glycol solutions
were 5.9 and 17.8 h-1, respectively. The residence time in the catalytic bed was 1.3 seconds
[density of water at reaction conditions (here: T=450 °C and P=250 bars) is 109 kg/m3].

Chapter 3
35
3.3 Results and discussion
3.3.1 Catalyst characterization results
Characteristics of the catalysts studied are given in Table 3.1. All fresh catalysts had
surface areas of ±200 m2/g, similar to that for the alumina used. All catalysts showed a
decrease in surface areas to ±20 m2/g when subjected to supercritical water. This decrease was
found to happen during the initial stage of the reaction (within the first 15 minutes) and is
caused by the collapse of mesopores (± 50-200 Å) as can be seen from the pore volume
distribution plots of the fresh and used 1.15-0.35 wt% Pt-Ni/γ-Al2O3 catalysts (Figure 3.1 and
3.2).
The collapse of pores (and the consequent decrease in surface area) can be attributed
to a phase change of the γ-Al2O3 to boehmite AlO(OH)x as can be seen from the XRD
patterns of the fresh and used 1.15-0.35 wt% Pt-Ni/γ-Al2O3 catalysts as shown in Figure 3.3.
For the fresh catalyst, diffraction peaks located at 2θ = 45.8° and 66.8° are attributed to γ-
Al2O3. Multiple peaks emerged for the catalyst after exposure to supercritical water and these
correspond to the dominant phase of Boehmite, indicating hydrolysis of the support. Weaker
reflections of alpha phase were also noticed. Similar observations regarding the phase change
of γ-Al2O3 in hot compressed water were reported by many authors [5, 15-17]. The phase
change occurred during start-up of the reaction and therefore the reactions were performed in
the presence of catalysts after stabilization of alumina. It was reported earlier by Wawrzetz et
al. [18] that the phase change from γ-Al2O3 to Boehmite did not cause blocking or
deactivation of the catalytic sites.
Table 3.1: Catalyst characterization results for fresh catalysts.
Catalyst supported
on γγγγ-alumina
Loading
(%)
Dispersion
(%)*
Average Particle
Size (nm)
Surface area
(m2/g)
Ni 1.31 1 78 196 Ir 1.41 15 7.2 195 Pt 1.45 68 1.6 196 Pt 0.60 85 1.3 199 Pt 0.30 87 1.2 197 Pt-Ni 1.17-0.33 n.d. n.d. 198 Pt-Ni 0.60-0.20 n.d. n.d. 197 Pt-Ni 0.30-0.10 n.d. n.d. 200
* Determined by CO chemisorption; n.d – Not determined

Chapter 3
36
Figure 3.1: Pore size distribution (red line) and cumulative pore volume (green line) of fresh Pt/Al2O3 catalyst.
Figure 3.2: Pore size distribution (red line) and cumulative pore volume (green line) of Pt/Al2O3 catalyst that was subjected to supercritical water (450 °C and 250 bar).

Chapter 3
37
Figure 3.3: XRD spectra of fresh Pt-Ni (Pt-1.15% and Ni-0.35%) bimetallic catalyst (below) vs. spent Pt-Ni catalyst.
Metal dispersions measured by CO chemisorption (Table 3.1) were low for the Ir and
Ni catalysts implying large particle sizes of 7.2 nm and 78 nm, respectively. TPR experiment
showed that the most dominant Ni species in Ni/γ-Al2O3 was NiAl2O4. A temperature of
around 800-1000 °C was necessary to reduce this species under hydrogen at atmospheric
pressure. These high reduction temperatures can be the reason for the low Ni dispersions
measured, as the NiAl2O4 could not be reduced under the conditions used for the
chemisorption experiment.
The monometallic Pt catalysts showed comparatively higher metal dispersions
measured by CO chemisorption (Table 3.1). A lower dispersion was found for the highest Pt
loading, indicating larger particles (±1.5 nm) for the highest Pt loading. A TEM image of the
fresh 1.5 wt% Pt/Al2O3 catalyst is shown in Figure 3.4a. Dark spots with a sub-nanometer
diameter can be seen and EDX confirmed the presence of Pt in these regions. These dark
spots were not visible in areas were Pt was not indicated by EDX and are therefore attributed
to the mass induced contrast between Pt and Alumina.

Chapter 3
38
Figure 3.4: TEM images (5 nm scale) of fresh alumina supported a) 1.5 wt% Pt/γ-Al2O3 and b) 1.15-0.35 wt% Pt-Ni catalysts.
a)
b)

Chapter 3
39
In the case of bimetallic catalysts, determining dispersions separately for Pt and Ni is
not straight forward and were not determined. A TEM image of the fresh 1.5 wt% Pt-Ni
containing catalyst is shown in Figure 3.4B. Again dark spots were observed on the alumina
support. The size of these spots was also sub-nanometer in diameter and is also attributed to
Pt or Pt-Ni particles. The presence of only Pt was observed in some areas but Ni was always
found together with Pt and shows that Ni deposits in the neighborhood of Pt, indicating
interactions between Pt and Ni. TEM imaging indicates that the metal particles (Pt and Pt-Ni)
on both catalysts are sub-nanometer in diameter.
The nature of the interactions between Pt and Ni on the bimetallic Pt-Ni catalysts was
studied by TPR. Mutual influences between Pt and Ni can vary from:
1. no interactions, Pt and Ni are not situated near each other
2. weak interactions, Pt and Ni are close together
3. strong interaction, Pt-Ni alloy formation
The TPR profiles of 0.3 wt% Pt/Al2O3, 0.3 wt% Ni/Al2O3 and 0.3-0.1 wt% Pt-Ni/Al2O3 are
shown in Figure 3.5. Pt/Al2O3 showed only one reduction peak at 227°C which can be
attributed to the reduction of PtIV(OH)xCly to metallic Pt [19]. Ni/Al2O3 showed a large
reduction peak between 800 °C and 1000 °C which can be attributed to NiAl2O4 [20]. In the
case of the Pt-Ni catalyst, reduction temperatures of 235, 326, 405, 516 and 809°C were
observed. The reduction peak at 809°C is attributed to NiAl2O4 [20], indicating that some of
the added Ni was inactive during the reaction due to strong interaction with the alumina
support. Reduction peaks at 405 and 516°C indicate large and smaller NiO particles,
respectively [21]. The Pt reduction is shifted to a higher temperature of 235°C when Ni was
present on the catalyst. This shift is assigned to interactions between Pt and Ni. However, the
strength of this interaction is unknown. Also a reduction peak around 326°C was observed
and this is assigned to Ni that is strongly interacting with Pt as Pt is reported to lower the
reduction temperature of NiO by facilitating hydrogen which is necessary for the reduction of
Ni [22]. Based on the TPR results, it can be concluded that various degrees of interaction
between Pt and Ni exist on the Pt-Ni catalysts, varying from no interaction to strong
interaction.

Chapter 3
40
Figure 3.5: TPR profiles of fresh alumina supported Pt(0.3 wt%), Ni(0.3 wt%) and Pt-Ni(0.3–0.1 wt%) catalysts.
3.3.2 Catalytic reforming results
The thermodynamic gas composition equilibrium [23] for different ethylene glycol
feed concentrations (5 - 30 wt%) at 450 °C and 250 bar is shown in Figure 3.6. Under the
reaction conditions used in this study, CH4 is the favored product with a selectivity of 54% for
5 wt% EG and increased slightly at the expense of hydrogen with increasing feed
concentration.
Results of the catalytic experiments with 5 wt% EG for the alumina supported Ni, Ir,
and Pt catalysts, are shown in Table 3.2. Carbon to gas conversion is taken as measure for the
gasification activity. Remaining carbon from the feed is either in coke or in the liquid product
(EG, plus other carbon containing species). No significant gasification activity for EG was
observed in a blank experiment (no catalyst) or with the alumina support only. For the
catalytic experiments, it can be seen from Table 3.2 that the sum of carbon to gas conversion
and carbon remaining in liquid indicate good carbon balances for the Ni and Pt –based
catalyst (102% and 106%, respectively). However, the carbon balance of the Ir-based catalyst
was only accounted for ~70%. The missing ±30% was likely carbon deposited on the catalyst
as coke.

Chapter 3
41
Figure 3.6: Thermodynamic chemical equilibrium composition for different feed concentrations ranging from 5 – 30 wt% of ethylene glycol reformed in supercritical water at 450 °C and 250 bar (symbols with solid trend lines represent selectivity and dotted trend lines represent yield).
The catalytic reforming experiments show that at comparable metal loadings Pt was
the most active. The Ni based catalyst showed the lowest carbon to gas conversion of 6%. Ir
catalyst gave a conversion of 27%. Pt catalyst showed near complete conversion of EG to gas
phase products. These results are in line with Davda et al. [14], who also found Pt to be more
active than Ir.
In the case of Ni catalyst, we have used a low loading of 1.5 wt% for comparison with
the other catalysts in the study. Other studies report usually much higher Ni loadings (~20
wt%). These catalysts were initially very active but underwent rapid catalyst deactivation. It is
therefore difficult to compare our results with these studies [7, 14]. Furthermore, NiO clusters
formed during calcination can undergo strong interaction with the alumina support, leading to
the formation of stable NiAl2O4. Steam reforming and water gas shift activity is related to the
presence of reduced Ni metal particles. The NiAl2O4 phase is stable under most reforming
conditions and does not contribute to catalyst activity. The previously reported TPR
experiment showed that the most dominant Ni species on the support was NiAl2O4. Since the
Ni concentration is low in the studied catalyst, this is the only species to be expected.

Chapter 3
42
Catalysts containing larger amounts of Ni usually show both NiO and NiAl2O4 phases [20]. A
temperature in the range of 800-1000°C was necessary to reduce NiAl2O4 under hydrogen.
Thus, the low activity of the studied Ni catalyst compared to Ir and Pt catalysts is due to the
presence of Ni as inactive NiAl2O4.
Table 3.2: Experimental data for the reforming of 5 wt% ethylene glycol (WHSV 5.9 h-1) at 450°C and 250 bar using 1.5 wt% Ni, Ir and Pt supported on γ-alumina.
1.5 wt% Ni 1.5 wt% Ir 1.5 wt% Pt
Carbon to gas (%) 6 27 100 Carbon in liquid (%) 96 45 6
Selectivity (%)
H2 26 35 87 CO2 31 30 94 CO 55 40 1 CH4 1 24 4 C2+ 13 6 1
Yield (mol gas / mol feed)
H2 0.08 0.61 4.24 CO2 0.04 0.20 1.78 CO 0.06 0.29 0.01 CH4 0.00 0.18 0.07 C2+ 0.00 0.01 0.01
N.B. C2+ gases include C2H4, C2H6, C3H6 and C3H8.
Table 3.2 also gives selectivities to the various gas products observed. The target in
this study is to achieve a high selectivity towards hydrogen by (i) maximizing water gas shift
and (ii) minimizing methane formation. Both the Ni and Pt catalysts showed low selectivities
for methane formation (<4%). Low methanation activity (CH4 <4%) and high WGS activity
(CO/CO2 = 0.01) (see Table 3.2) resulted in the high selectivity for hydrogen (87%) as
observed for the Pt catalyst. From Table 3.1 it is seen that metal dispersions for Pt is about 4
times higher than Ir and this is also reflected in EG conversion. This implies similar intrinsic
activities (TOF) for both Ir and Pt for EG gasification. However, Ir catalyst showed the
highest selectivity towards methane (24%) and also showed high amounts of carbonaceous
deposits. Based on the results so far Pt/Al2O3 showed the best activity, highest selectivity to
H2, -and minimal methane formation.

Chapter 3
43
Optimizing the Pt loading without compromising the EG conversion is interesting
from an environmental point of view and from the point of cost of Pt. Table 3.3 shows the
result of the influence of Pt loading on the catalyst performance for the reforming of 5 wt%
EG. Characterization results of these catalysts are summarized in Table 3.1. It can be seen
from Table 3.3 that even the use of the catalyst with lowest Pt loading (0.3 wt%) resulted in
near complete conversion of EG. Additional experiments with higher EG concentrations (15
wt%) and at higher space velocities (17.8 h-1) were carried out. The results of these
experiments are given in Table 3.4. As expected, a lower overall conversion for the reforming
of 15 wt% EG solution to carbon containing gaseous products was obtained, under
comparable reaction conditions. Interestingly, EG conversion levels were found to be in the
same range (42 ˗ 48 mol%) for all the three Pt catalysts.
Table 3.3: Experimental data for the reforming of 5 wt% ethylene glycol (WHSV 5.9 h-1) at 450°C and 250 bar using 0.3, 0.6 and 1.5 wt% Pt supported on γ-alumina.
0.3wt% Pt 0.6wt% Pt 1.5wt% Pt
Carbon to gas (%) 95 99 100 Carbon in liquid (%) 4 2 6
Selectivity (%) H2 76 85 87 CO2 84 87 94 CO 1 1 1 Alkanes (CxHy)
15 12 5
Table 3.4: Experimental data for the reforming of 15 wt% ethylene glycol (WHSV 17.8 h-1) at 450°C and 250 bar using 0.3, 0.6 and 1.5 wt% Pt supported on γ-alumina.
0.3wt% Pt 0.6wt% Pt 1.5wt% Pt
Carbon to gas (%) 48 48 42 Carbon in liquid (%) 58 59 61
Selectivity (%) H2 42 51 80 CO2 50 60 79 CO 20 14 14 Alkanes (CxHy)
30 26 7

Chapter 3
44
Hydrogen selectivities were lower in the case of experiments with higher EG
concentrations (15 wt%). Davda et al. [3-4, 14] also reported that a shift towards CO and CH4
occurs with increasing ethylene glycol concentrations. Lower oxygenate concentrations in the
feed favor the formation of higher yields of hydrogen, while at higher concentrations,
increased levels of COx and H2 cause consecutive (hydrogen consuming) methane formation.
Increased methane formation was observed for all the three Pt catalysts, but was more
pronounced for the catalysts with lowest Pt loading. During 15 wt% EG reforming, the two
catalysts with lowest Pt loading (0.3 and 0.6 wt%) showed hydrogen selectivities that were
almost half of that observed for the experiments with lower EG (5 wt%) concentration.
Interestingly, in the case of the 1.5 wt% Pt catalyst, the selectivity towards methane and
hydrogen changes only marginally in favor of methane during reforming of higher EG
concentration feeds.
The high CO selectivities observed during reforming of high concentrated EG feeds,
suggest that hydrogen yields can be further increased by increasing WGS activity of the
catalyst. The HPLC analysis of the liquid reactor effluent from the reforming reaction with
0.3 wt% Pt catalyst, indicated the presence of ethylene glycol and other intermediate
compounds such as aldehydes, carboxylic acids and alcohols.
The intrinsic rates for reforming and hydrogen formation, in the case of experiments
with 15 wt% EG, were calculated for the three monometallic Pt catalysts and are summarized
in Table 3.5. Apparent TOF for EG reforming was found to be more than four times higher
for the catalyst with 0.3 wt% Pt loading, compared to the catalyst with 1.5 wt% Pt loading.
The higher activity (TOF) of the former can be a consequence of (i) the Pt particle structure
effect (smaller particles are more active) or (ii) the higher Pt dispersion brings more Pt sites in
the vicinity of the support as required in bi-functional catalysts, as explained below. It has
been reported earlier [11] that the boundary between alumina and Pt is thought to be the
active catalytic area for reforming since alumina also plays a role in the reforming reaction.
Reforming and WGS reactions involve oxidation with oxygen from water molecules. This
mechanism should involve splitting/activation of water molecules [24]. Pt is normally inert
for water activation under typical gasification conditions [25]. On the other hand, alumina is
able to activate water by forming hydroxyl groups, which are necessary for the reforming
reactions. Therefore reactive Pt sites should be in close proximity of alumina. Decreasing the
particle size will increase the amount of Pt sites neighboring alumina and therefore increasing
the overall reforming activity [24].

Chapter 3
45
Table 3.5: TOF’s for the reforming of 15 wt% ethylene glycol (WHSV 17.8 h-1) and hydrogen production at 450°C and 250 bar using 0.3, 0.6 and 1.5 wt% Pt supported on γ-alumina.
Pt Loading
(%) Dispersion (%)
Average
Particle Size
(nm)
TOF EG
15wt% EG
(min-1)
TOF H2
15 wt% EG
(min-1)
0.30 87 1.2 173 359 0.60 85 1.3 87 219 1.45 68 1.6 41 163
However, the increase in EG TOF is not proportional with the increase in H2 TOF, (4
vs 2). Results in Table 3.5 seem to indicate that lower Pt loadings (with smaller Pt particles)
tend to favor methane formation. Lehnert et al. [16] showed that aqueous phase reforming of
glycerol was structure sensitive over Pt/Al2O3 catalysts. They observed that the selectivity
towards CO and CH4 increased with decreasing Pt particle size. They suggested that smaller
particle sizes have more steps in the structure and these favor CO and CH4 formation. C-C
cleavage is suggested to occur on the face atoms while C-O cleavage is favored on steps and
edges [16]. Thus, in full agreement with the former, smaller Pt particle size can be responsible
for the increase in methane formation.
Conditions during APR in hot compressed water are corrosive and aggressive. Catalyst
deactivation is a serious issue and lifetimes can be short due to leaching, sintering (Ostwald
ripening) of metal particles and coking. The stability of the catalyst is therefore very critical
for practical applications. The EG conversions to gas phase products and selectivities for the
three monometallic Pt catalysts during a 9 h life test are shown in Table 3.6 for the reforming
of 15 wt% EG. The Pt catalyst with the highest Pt loading (1.5 wt%) showed stable
performances with respect to activity (42%) and selectivities (H2 selectivity of 80%) during 9
h time-on-stream. Lower Pt loadings were less stable. The catalyst with lowest Pt loading (0.3
wt%) showed an initial conversion of 48%. However, the conversion gradually dropped to
31% after 9 h time-on-stream. In parallel to the deactivation, hydrogen selectivity improved at
the expense of lower CH4 formation.
One reason for deactivation can be the loss of metal from the catalyst by leaching.
XRF analysis of the liquid products showed, however, no presence of metals. In addition,
metal loadings for the fresh and used catalysts were found to be the same, verifying that
leaching of Pt and alumina support during the reaction was insignificant.

Chapter 3
46
Table 3.6: Stabilities of Pt catalysts for the reforming of 15 wt% ethylene glycol (WHSV 17.8 h-1) at 450°C and 250 bar using 0.3, 0.6 and 1.5 wt% Pt supported on γ-alumina.
Pt loading
(%)
Time
(h)
Conversion
(%)
Selectivity (%)
H2 CO2 CO CH4 C+
0.3 0.5 48 42 50 20 22 8 9.0 31 72 57 36 5 3
0.6 0.5 48 51 60 14 19 7 9.0 36 73 66 22 8 4
1.5 0.5 42 80 79 14 4 3 9.0 42 82 80 15 2 3
Catalyst deactivation by coking was studied by attempting regeneration of a used 0.3
wt% Pt/Al2O3 catalyst by burning off any possible coke deposits. The catalyst was taken out
of the reactor after being used for 9 h for the reforming of 15 wt% EG. The used catalyst was
re-oxidized in air at 500 °C for 5 h to burn off any coke species. After this treatment the
catalyst was again used for the reforming of 15 wt% EG and no changes in activity or
selectivities were observed compared to the properties before the regeneration attempt. This
indicates that deactivation was not induced by coking. Furthermore, presence of coke on the
catalysts was studied by TGA-MS. Spent Pt catalysts used for the reforming of 15 wt% EG all
showed 12 ± 1 % weight loss at 513 ± 3°C. The MS results showed that the weight loss was
due to the release of H2O. For all catalysts, release of comparable quantities of water was
observed. H2O is formed during dehydration via recombination of hydroxyl groups on the
alumina support. Presence of coke on the catalysts was also not indicated by the TGA-MS
technique.
An indication for deactivation can be inferred from the selectivity data presented in
Table 3.6. With deactivation the selectivity towards hydrogen improved and methane
formation decreased. As discussed earlier [16], the Pt particle size is believed to influence the
reforming activity and selectivity towards hydrogen and methane. Larger Pt particles tend to
favor the formation of hydrogen, but are less active for EG reforming in contrast to smaller Pt
particles that are very active for EG reforming but favor the formation of methane. In line
with these arguments, we suggest that the dominant deactivation mechanism is related to the
increase of the average size of active Pt particles during the reaction. Pt particle growth during
the reaction is a likely cause of deactivation. Initially, the catalyst showed a high activity and
a higher selectivity towards methane. During the reaction the average size of active Pt

Chapter 3
47
particles are believed to grow, resulting in a lower reforming activity and increased selectivity
towards H2. We can only suggest that the relatively large Pt particle size in the catalyst with
the highest Pt loading is the reason for the stability with time. The deactivation mechanism
will be studied in more detail in Chapter 4.
From the results discussed so far we have shown that full conversion of a 5 wt%
ethylene glycol solution to gas phase products could be achieved with high selectivity towards
hydrogen using alumina supported Pt catalysts. For higher EG concentration (15 wt%) feeds,
loss of hydrogen was observed at the expense of more methane formation. Using lower Pt
loadings showed a negative effect on the hydrogen selectivity for the reforming of 15 wt%
ethylene glycol solution. In addition the catalyst with lower Pt loadings deactivated during the
reaction. The 1.5 wt% Pt/Al2O3 showed to be the best catalyst in terms of stability and
hydrogen selectivity for the reforming of a 15 wt% ethylene glycol solution. However, the
intrinsic activity of the Pt active sites was still low.
Reforming of solutions with higher EG concentrations to give high hydrogen
selectivities are commercially interesting but this requires modification of the Pt catalysts as
seen above. In case of the catalysts with lower Pt loadings the hydrogen selectivity and
stability should be addressed. For the catalyst with the highest Pt loading the intrinsic activity
should be improved. Ni/Al2O3 was not a very interesting catalyst with respect to EG
conversions and H2 yields, although Ni/Al2O3 showed the lowest CH4 formation rate. Thus,
Ni addition to monometallic Pt catalysts can be expected to improve hydrogen yields. Huber
et al. [13] already reported that addition of Ni to a Pt/Al2O3 catalyst significantly increased the
H2 selectivity by suppressing CH4 formation and at the same time also enhanced EG
reforming activity. Furthermore, Ni is also an active metal for steam reforming and for the
water gas shift reaction (necessary to enhance hydrogen yields) and is a cheaper substitute for
Pt [26, 27]. Possible synergetic effects of Ni addition to Pt catalysts were investigated for the
reforming of ethylene glycol in supercritical water.
Details of the Pt catalysts modified with Ni are given in Table 3.1. The conversions
and selectivities for the three Pt-Ni bi-metallic catalysts are shown in Table 3.7 for the
reforming of 15 wt% ethylene glycol. Addition of Ni induced a significant improvement on
the performance of the catalyst. All Pt-Ni catalysts showed stable conversions and
selectivities for the reforming of 15 wt% EG during 9 h time-on-stream. In contrast to the 0.3

Chapter 3
48
wt% Pt catalyst (Table 3.6) no deactivation was observed with the 0.3-0.1 wt% Pt-Ni catalyst
during 9 h time-on-stream.
Table 3.7: Stabilities of Pt-Ni catalysts for the reforming of 15 wt% ethylene glycol (WHSV 17.8 h-1) at 450°C and 250 bar using 0.3, 0.6 and 1.5 wt% Pt supported on γ-alumina.
Catalyst
loading (%) Time
(h) Conversion
(%)
Selectivity (%)
H2 CO2 CO CH4 C+
0.3 - 0.1 Pt-Ni 0.5 50 77 77 18 4 1 9.0 50 79 78 17 3 1
0.6 - 0.2 Pt-Ni 0.5 63 84 88 8 3 1 9.0 60 85 88 8 3 1
1.15 - 0.35 Pt-Ni 0.5 79 83 91 3 4 1 9.0 77 86 90 5 4 1
Another positive effect was observed on the hydrogen selectivity by addition of Ni.
All tested Pt-Ni catalysts showed high H2 selectivities with remarkably low CH4 selectivities
(maximum 3 - 4%). Addition of Ni to the catalyst with lowest Pt loading (0.3 - 0.1 Pt-Ni)
almost doubled the hydrogen selectivity as a result of suppressing methane formation. In the
case of Pt and Pt-Ni catalysts comparable initial concentrations of CO were observed. In case
of Pt-Ni catalyst the CO2 concentrations are much higher compared to the mono-metallic Pt
catalyst. This is an indication that in presence of Ni, CO underwent a water gas shift reaction
instead of a methanation reaction. The role of Ni in that case is to prevent hydrogenation of
COx due to the intrinsic water gas shift activity of Ni.
Noble metals such as Pt are not capable of activating water for the water gas shift
reaction and therefore require an active support material (in this case alumina) that provides
the water activation. Ni however is capable of both activating water and CO in the water gas
shift reaction without the need for a support. This occurs via NiO formation with water [28].
This intrinsic water gas shift activity of Ni can be the reason for the synergetic effect observed
in bi-metallic Pt-Ni catalysts.
Remarkably, from Table 3.7, it can be seen that 1.15-0.35 wt% Pt-Ni catalyst is two
times as active as the monometallic counterpart (1.5 wt% Pt) with very high selectivity
towards hydrogen (86%). The catalyst is also very stable. Based on calculations, Huber et al.
[13] speculated that Pt-Ni catalysts have lower heats of H2 and CO adsorption compared to
pure Pt catalysts, causing lower surface coverage of adsorbed H2 and CO and therefore

Chapter 3
49
minimize methanation of CO and allowing more sites to be accessible for the reactant to
undergo reforming.
The carbon to gas conversion of 15 wt% EG and the hydrogen selectivities for the
three monometallic Pt catalysts and three bi-metallic Pt-Ni catalysts with different metal
loadings during a 9 h reaction time are shown in Figure 3.7. It is evident from the figure that
the bi-metallic catalysts showed higher conversions and stable hydrogen selectivities than the
monometallic catalysts. Furthermore, the higher activities of Pt-Ni catalysts show that the
reactions with the mono-metallic Pt catalysts were not affected by mass diffusion limitations.
Figure 3.7: Activity and stability of monometallic Pt and bi-metallic Pt-Ni catalysts for the reforming of 15 wt% EG at 450°C and 250 bar.
The influence of EG concentration ranging from 5 – 30 wt% on the product gas
selectivity and gasification efficiency with Pt-Ni (Pt – 1.15 wt% and Ni – 0.35 wt%) is shown
in Figure 3.8. The carbon to gas conversion decreased from 100 to 60% with increasing
concentration from 5 to 30 wt%. This indicates that under the conditions studied maximum
reforming capacity is reached. Decreasing the space velocity (either by increasing the amount
of catalyst or decreasing the feed flow) should give complete conversion of high EG

Chapter 3
50
concentrations. The H2 and CO2 selectivities decreased while the CO, CH4 and C2+
selectivities increased with the EG concentration. However, with 30 wt% EG concentration,
the carbon to gas conversions remained constant during 3 h experimental run but the CO
selectivity increased marginally indicating a decrease in water gas shift activity (Figure 3.9).
The bimetallic Pt-Ni/Al2O3 catalyst studied here, shows extremely good activity, is
stable and very selective to hydrogen. This catalyst shows promise for practical applications.
The role of intermediates formed in the catalytic performance of the alumina supported Pt and
Pt-Ni catalysts, is studied in the next chapter.
Figure 3.8: The influence of ethylene glycol concentration and its corresponding space velocities on the product gas selectivity and gasification efficiency in the presence of alumina supported Pt-Ni (1.15 wt% Pt, 0.35% Ni) catalyst at 450°C and 250 bar (arrows indicate axis direction).

Chapter 3
51
Figure 3.9: The gasification efficiency and the product gas selectivity as function of time, during reforming of 30 wt% ethylene glycol with alumina supported Pt-Ni (1.15 wt% Pt, 0.35% Ni) catalyst at 450°C and 250 bar (arrows point towards axis direction).
3.4 Conclusions
In this chapter, the catalytic properties of alumina supported Pt, Ir and Ni catalysts
were studied for the reforming of ethylene glycol in supercritical water. Pt catalyst showed the
highest hydrogen yields compared to Ir and Ni. The bi-functional reforming mechanism
involved with APR over alumina supported Pt catalysts requires water activation. Water
activation happens on the alumina support through the formation of hydroxyl groups. Smaller
Pt particles were found to give higher intrinsic reforming activities due to a larger interfacial
(metal/support) area, which enabled better interaction between the reforming fragments on the
Pt and the hydroxyl groups on alumina support. On the other hand, smaller Pt particles were
found to be responsible for lower hydrogen selectivities due to increased methane formation.
Methane can be formed by either dehydration of EG, and/or by the hydrogenation of COx. A
new developed Pt-Ni bimetallic catalyst shows enhanced hydrogen yields by suppressing
methane formation. The new Pt-Ni catalyst also shows two times more activity compared to a
monometallic Pt catalyst due to supposed lower CO coverage caused by the presence of Ni
and an enhanced accessibility to Pt sites for reforming. Moreover, the addition of Ni also

Chapter 3
52
enhanced catalyst lifetime and stable catalytic performances were observed for the reforming
of ethylene glycol under supercritical water conditions.
References
[1] A. Nakamura, E. Kiyonaga, Y. Yamamura, Y. Shimizu, T. Minowa, Y. Noda, Y.
Matsumura, J. Chem. Eng. Jpn. 41 (2008) 1-12.
[2] J. Xie, D. Su, X. Yin, C. Wu, J. Zhu, Int. J. Hydrogen Energ. 36 (2011) 15561-15572.
[3] R.R. Davda, J.W. Shabaker, G.W. Huber, R.D. Cortright, J.A. Dumesic, Appl. Catal.
B 43 (2003) 13-26.
[4] R.R. Davda, J.W. Shabaker, G.W. Huber, R.D. Cortright, J.A. Dumesic, Appl. Catal.
B 56 (2005) 171-186.
[5] A.J. Byrd, K.K. Pant, R.B. Gupta, Fuel 87 (2008) 2956-2960.
[6] S.R.A. Kersten, B. Potic, W. Prins, W.P.M. van Swaaij, Ind. Eng. Chem. Res. 45
(2006) 4169-4177.
[7] Y. Guo, S.Z. Wang, D.H. Xu, Y.M. Gong, H.H. Ma, X.Y. Tang, Renew. Sust. Energ.
Rev. 14 (2010) 334-343.
[8] G.J. DiLeo, P.E. Savage, J. Supercrit. Fluids 39 (2006) 228-232.
[9] T. Furusawa, T. Sato, H. Sugito, Y. Miura, Y. Ishiyama, M. Sato, N. Itoh, N. Suzuki,
Int. J. Hydrogen Energ. 32 (2007) 699-704.
[10] I.G. Lee, S.K. Ihm, Ind. Eng. Chem. Res. 48 (2008) 1435-1442.
[11] J.W. Shabaker, G.W. Huber, R.R. Davda, R.D. Cortright, J.A. Dumesic, Catal. Lett. 88
(2003) 1-8.
[12] R.D. Cortright, R.R. Davda, J.A. Dumesic, Nature 418 (2002) 964-967.
[13] G.W. Huber, J. W. Shabaker, S.T. Evans, J.A. Dumesic, Appl. Catal. B 62 (2006) 226-
235.
[14] R.R. Davda, J.A. Dumesic, Angew. Chem. Int. Ed. 42 (2003) 4068-4071.
[15] N. Luo, X. Fu, F. Cao, T. Xiao, P. Edwards, Fuel 87 (2008) 3483-3489.
[16] K. Lehnert, P. Claus, Catal. Commun. 9 (2008) 2543-2546.
[17] R.M. Ravenelle, J.R. Copeland, W-G. Kim, J.C. Crittenden, C. Sievers, ACS Catal. 1
(2011) 552-561.
[18] A. Wawrzetz, B. Peng, A. Hrabar, A. Jentys, A.A. Lemonidou, J.A. Lercher, J. Catal.
269 (2010) 411-420.

Chapter 3
53
[19] H. Lieske, G. Lietz, H. Spindler, J. Volter, J. Catal. 81 (1983) 8-16.
[20] C. Li, Y.W. Chen, Thermochim. Acta 256 (1995) 457-465.
[21] J. Zielinski, J. Catal. 76 (1982) 157-163.
[22] J. Arenas-Alatorre, A. Gomez-Cortes, M. Avalos-Borja, G. Diaz, J. Phys. Chem. B.
109 (2004) 2371-2376.
[23] A.G. Chakinala, D.W.F Brilman, W.P.M. van Swaaij, S.R.A. Kersten, Ind. Eng.
Chem. Res. 49 (2009) 1113-1122.
[24] K. Takanabe, K. Aika, K. Inazu, T. Baba, K. Seshan, L. Lefferts, J. Catal. 243 (2006)
263-269.
[25] D.C. Grenoble, M.M. Estadt, D.F. Ollis, J. Catal. 67 (1981) 90-102.
[26] B. Matas Guell, I.V. Babich, L. Lefferts, K. Seshan, Appl. Catal. B 106 (2011) 280-
286.
[27] J.H. Lin, P. Biswas, V.V. Guliants, S. Misture, Appl. Catal. A 387 (2010) 87-94.
[28] J.R. Rostrup-Nielsen, Catalytic Steam Reforming. ISBN: 3-540-12665-1 Springer-
Verlag Berlin Heidelberg New York Tokyo, 1984.

54
55
Chapter 4
Aqueous Phase Reforming of Ethylene Glycol – Role of
intermediates on catalyst performance
D.J.M. de Vlieger, B.L. Mojet, L. Lefferts and K. Seshan, J. Catal. 292 (2012) 239
Liquid product formation during the aqueous catalytic reforming of ethylene
glycol (EG) was studied up to 450 ºC and 250 bar pressure. Methanol, ethanol
and acetic acid were the main liquid by-products during EG reforming in the
presence of alumina supported Pt and Pt-Ni catalysts. The effects of these by-
products on selectivity and catalyst stability were further investigated by
studying reforming of these components. Reforming of these products was shown
to be responsible for the formation of alkanes. The high dehydrogenation activity
of Pt-Ni catalysts lead to high H2 yields during EG reforming by (i) suppressing
the formation of methane during methanol reforming (a major by-product of EG
reforming) and (ii) suppressing the formation of acetic acid. In addition, the
decrease in acetic acid formation showed a positive effect on catalyst lifetime.
Acetic acid was found to be responsible for hydroxylation of the Al2O3 support,
leading to migration and coverage of the metal particles by Al(OH)x and resulting
in deactivation of the Pt-based catalysts.

Chapter 4
56
4.1 Introduction
Many studies on the catalytic reforming of model oxygenates under APR conditions
have been reported recently [1-5]; ethanol, ethylene glycol, glycerol are typical examples.
Information on mechanistic sequences that take place during APR is limited, and in the case
of ethylene glycol (EG), Dumesic et al. [5] suggested that reforming is initiated via
dehydrogenation and formation of an adsorbed oxygenate (acetylinic, dialcohol type)
intermediate. In a desired sequence, C-C bond cleavage and subsequent water gas shift leads
to CO2 and H2. However, rearrangement/desorption of the oxygenate intermediate leads to
acids and/or one C-O bond scission to formation of alcohols. Sequential reforming of acids
and alcohols often cause formation of alkanes as by-products. In addition, direct
hydrogenation of COx formed also give CH4 or higher alkanes through the Fischer-Tropsch
reaction [5]. These parallel routes lower the hydrogen yield during APR, which is a serious
drawback.
Deactivation and instability of the catalyst are other issues during APR. Activity loss
during APR is often associated with loss of catalytic sites (leaching, sintering) or blockage by
carbonaceous species but specific details are not available in literature. However, in the case
of high temperature gas-phase steam reforming of oxygenates, reasons for catalyst
deactivation were identified [6-12]. For example, coke deposition caused by oligomerization
of olefins formed was reported to be an issue during steam reforming of ethanol [6, 7].
Formation of unsaturated CxHy species via dehydrogenation reactions is often proposed as a
precursor to coke [8-10]. Our group has shown earlier that acetic acid is converted to acetone
during steam reforming, which further reacts to form coke precursors such as di-
acetonealcohol, mesityl oxide or mesitylene [11]. The product CO can also disproportionate
exothermically to form carbon through the Boudouard reaction (2CO→CO2+C) [12].
As discussed in Chapter 3, Pt/Al2O3 catalyst showed reforming rates for APR of
ethylene glycol that are very attractive for commercial application. However, this catalyst was
found to deactivate during the reaction. Pt/Al2O3 also gave lower H2 selectivity due to the
formation of alkanes. Furthermore, it was shown in Chapter 3 that presence of Ni in the
Pt/Al2O3 catalyst suppressed the above problems such as catalyst deactivation and high
amounts of alkane formation and provided the basis for the development an efficient catalyst.

Chapter 4
57
In this study, the role of intermediates that are formed during APR of ethylene glycol
on the formation of alkanes is studied. Further, the reason for the loss of activity is
investigated in relation to intermediates formed during reactions. Correlations thus drawn are
discussed in relation to the promotion of Pt/Al2O3 with Ni. Improving catalyst stability and at
the same time enhancing hydrogen selectivity at the expense of alkanes for the reforming of
ethylene glycol is essential in the design of an efficient APR catalyst.
4.2 Experimental
4.2.1 Catalyst preparation and characterization
Alumina supported Pt and Pt-Ni (molar ratio 1:1) catalysts were prepared as described
in section 2.2.1. Catalysts were characterized by XRF, BET, CO-chemisorption, TEM
imaging, FT-IR and Raman spectroscopy. Further details regarding catalyst characterization
are discussed in section 2.3. Details of the catalysts used for this study are summarized in
Table 4.1.
Table 4.1: Characteristics of the catalysts studied
Catalyst Metal Loading by
XRF (wt %)
Average metal particle Size
(nm)
BET Surface
area (m2/g)
γ-Al2O3 - - 200
Pt/γ-Al2O3 1.45 ≤ 1 (TEM) 1.6 (CO-chemisorption)
198
Pt-Ni/γ-Al2O3 1.15 Pt - 0.35 Ni ≤ 1 (TEM) 198
4.2.2 Catalytic testing
The experimental setup and applied definitions are described in detail in Chapter 2. A
2 mL. min-1 flow of 1 wt% oxygenate solution (ethylene glycol (≥ 99.9%, Sigma-Aldrich),
acetic acid (≥ 99.9%, Merck), methanol (≥ 99.9%, Merck), or ethanol (≥ 99.9%, Merck)) was
first preconditioned to the operating conditions (275 °C and 200 bars) before it entered the
reactor in which 1.0 g of catalyst was placed. The reforming reactions were studied during 5h
time-on-stream. Products in the liquid reactor effluent were determined by HPLC.

Chapter 4
58
4.3 Results and discussion
4.3.1 AP reforming of ethylene glycol
Reforming of aqueous bio-organic streams is only interesting for commercial
applications when feeds with high oxygenate concentrations (> 15 wt%) can be used.
However, larger concentrations of intermediates and products formed under these conditions
can lead to extensive secondary reactions. Thus, two sets of reforming experiments were
carried out with 1.5 wt% Pt/Al2O3 catalyst; (1) 20 wt% ethylene glycol (EG) solution was
studied in supercritical water (450 ⁰C and 250 bar) and (2) a 1 wt% EG solution was studied
at similar conversions obtained by using milder reaction conditions (275 ⁰C and 200bar). The
obtained results are shown in Table 4.2.
Table 4.2: Conversions and alkane selectivities for ethylene glycol reforming under different conditions in the presence of 1.5 wt% Pt/Al2O3.
[EG]
wt%
Reaction
Temp. (°°°°C)
Reaction
Press. (bar)
WHSV
(h-1)
Conversion
to gas (%)
Conversion to
liquid (%)
Alkanes
in gas (%)
20 450 250 24 74 15.4 16.9 1 275 200 1.2 78 11.7 0.3
Conversion to gas and liquid phase products are mentioned separately in Table 4.2 to
allow a good comparison of the gasification efficiency. Total EG conversion to liquid and gas
products was ±90% for both reactions with the remaining carbon being unconverted EG.
Carbon balances were complete within an error margin of 5%. It can be seen that at the higher
EG concentration and higher temperature, the amount of carbon containing products in liquid
phase increased. Alkane formation is also higher under these conditions. The alkane
formation was much lower in the experiment with 1 wt% EG. In both cases, componential
HPLC analysis of the liquid reactor effluent showed that (in addition to unconverted EG)
three other main components were present in the reactor effluent. These were acetic acid,
methanol and ethanol.
As discussed previously, components such as acids and alcohols are often suggested as
precursors for the formation of alkanes. Further, we also stated (Chapter 3) that addition of Ni
to Pt/Al2O3 suppressed formation of alkanes during reforming of EG. In order to probe the
role for Ni, a detailed componential HPLC analysis of the liquid reactor effluents of 1 wt%

Chapter 4
59
EG reforming (275 ⁰C and 200 bar) in the presence of Pt or Pt-Ni catalysts was carried out.
The results are shown in Figure 4.1.
Figure 4.1: Liquid by products during catalytic reforming of 1 wt% ethylene glycol at 375 ⁰C and 200 bar (WHSV = 1.2 h-1). Results for alumina supported Pt and Pt-Ni catalysts showed conversions to gas phase of 78 and 88%, respectively.
It is seen from Figure 4.1 that the reactor effluent in presence of the Ni-promoted
catalyst showed the same by-products (acetic acid, methanol and ethanol). The concentrations
of methanol and ethanol in the reactor effluent were not influenced significantly by the
presence of Ni. However, the concentration of acetic acid was found to be three times lower
for the Ni-promoted catalyst.
At this point, it is useful to recall the mechanistic sequences proposed in the literature
for APR of EG by Dumesic et al. [5]. It is suggested, without experimental evidence, that
dehydrogenation of EG over Pt is the first step in the reforming pathway. During this step the
hydrogen atoms from the hydroxyl groups are removed by O-H cleavage on the Pt surface

Chapter 4
60
[13]. In an optimal situation, the resulting adsorbed •O-CH2-CH2-O• species is further
dehydrogenated and undergoes C-C cleavage to form adsorbed CO [13]. The adsorbed
intermediate species •O-CH2-CH2-O• can also undergo rearrangement over the acidic γ-Al2O3
support to form acetic acid [5]. However, in another study (Chapter 5), we also observed the
formation of acetic acid during APR of EG using a carbon-supported Pt catalyst. The
chemical inertness of this type of support material excludes the rearrangement of •O-CH2-
CH2-O• over the support to form acetic acid. The ionic nature of hot compressed water is
reported to catalyze organic reactions in the aqueous phase, such as the Cannizzaro reaction
[14] and isomerization reactions [15]. As discussed later in this chapter, the Cannizzaro-
derived reaction is not a dominant contributor to acetic acid formation. The isomerization
reaction (either catalyzed by the support or by the ions from the liquid water) of adsorbed •O-
CH2-CH2-O• is suggested to be responsible for the majority of acetic acid formed.
Competition between dehydrogenation and isomerization of adsorbed •O-CH2-CH2-O•
dictates the relative formation of hydrogen and acetic acid. Dehydrogenation will be catalyzed
by metals (Pt, Ni) and and isomerization would be assisted by an acidic oxide (in this case γ-
Al2O3 support).
The role of Ni in the suppression of acetic acid formation (Figure 4.1) can be inferred
from DFT calculations by Skoplyak and Barteau [13] which predicted “increased” binding
energies for adsorbed species derived from ethylene glycol on the surface monolayer Ni-Pt
(111) as compared to Pt (111). We conclude that the increased binding energies of oxygenate
intermediate lead to longer residence times on the metal and result in increased
dehydrogenation activity. It would be useful to estimate the energetics for the two routes
(dehydrogenation vs. isomerization) on Pt and Pt-Ni bimetallic surfaces by theory, but that is
beyond the scope of the current study. In addition, the dissociation of the O-H bond is
suggested to be the rate-limiting step in the conversion of ethylene glycol [13]. The higher
dehydrogenation activity of the Pt-Ni catalyst results in faster dehydrogenation of the O-H
groups and hence a higher overall reforming rate. This is in agreement with earlier studies
[16] and our own results (Chapter 3) where Pt-Ni/Al2O3 catalysts showed higher conversions
for the reforming of ethylene glycol than Pt/Al2O3.

Chapter 4
61
4.3.2 APR of model compounds
Aqueous phase reforming experiments with liquid products formed during the APR of
EG was carried out using individual components (Figure 4.2). Reforming experiments (with
acetic acid, methanol, or ethanol) were conducted at 275 ºC and 200 bar in the presence of
Pt/Al2O3 or Pt-Ni/Al2O3. Feed concentrations of 1 wt% were used so as to work in the same
concentration range as the liquid by-products formed during EG reforming experiments. For
example, a total conversion of 15% to methanol, ethanol and acetic acid was observed during
the reforming of 20 wt% EG (Table 4.2), resulting in a total concentration of 3 wt% liquid by-
products. As the three were in the same range, concentration of each was fixed for further
experiments at 1 wt%.
Blank reforming experiments (275 °C and 200 bar) with methanol, ethanol and acetic
acid without catalysts showed conversions below 5%. In the presence of Pt/Al2O3 and Pt-
Ni/Al2O3 catalysts, conversions were in the range of 50-80% (Figure 4.2). For methanol the
conversion was around 60% (Fig. 4.2A) and for ethanol higher, ±80% (Fig. 4.2B). The higher
reforming activity of ethanol on both catalysts may be related to the reforming sequences that
take place. The initial step in the reforming of aliphatic alcohols involves the dissociation of
the O-H bond resulting in adsorbed methoxy or ethoxy species on the Pt surface [17, 18].
Similar dissociation energies are reported [19] for breaking the O-H bond in these alcohols
and can therefore not be responsible for the difference in reforming activity. During reforming
of alcohols, hydrogen formation requires the formation of adsorbed carbon monoxide which
can undergo WGS to form H2 and CO2. In the case of methanol to form CO, it is necessary for
the adsorbed methoxy species to undergo three C-H bond cleavages. For ethanol, the adsorbed
ethoxy species must undergo two C-H and one C-C bond cleavage. Further it is suggested that
the cleavage of the C-C bond in ethanol leads to an adsorbed methyl species [18]. We
speculate that the different routes to decompose the alcohols may be the reason for the
difference in reactivity. For the reforming of acetic acid (Figure 4.2C), initial conversion
levels of ±50% were obtained. However, the conversion decreased rapidly with time for both
the Pt and Pt-Ni catalysts, this will be discussed later on in the manuscript.

Chapter 4
62
Figure 4.2: Conversion to gas phase for reforming (275 °C and 200 bar) of 1 wt% methanol (A), ethanol (B) or acetic acid (C) using 1.5 wt% Pt/Al2O3 (o) and 1.15-0.35 wt% Pt-Ni/Al2O3 (▪) catalysts.

Chapter 4
63
4.3.3 Alkane formation during APR
The formation of alkanes during the catalytic reforming of acetic acid, methanol and
ethanol are shown in Figure 4.3. The selectivity towards alkanes (mainly methane) was found
to be the highest (±47%) during acetic acid reforming. For the reforming of methanol a
selectivity of 8% towards CH4 was observed for the Pt catalyst. In the case of ethanol
reforming the Pt catalyst showed a CH4 selectivity of ±20%. The higher amounts of methane
observed during ethanol reforming is attributed probably to the CHx fragment formed by C-C
bond breaking of ethanol [17] on the Pt surface. CHx fragments can recombine with adsorbed
H atoms on the Pt surface to form methane. A similar sequence is also suggested for acetic
acid on Pt based catalysts [11, 20]. In the case of methanol, C-O bond breaking is necessary to
generate these adsorbed CHx species that lead to the production of methane. High C-C bond
breaking activities for Pt during reforming of ethanol and low activity for C-O bond breaking
[5] during reforming of methanol can explain the observed differences for methane formation.
Figure 4.3: Formation of alkane during the catalytic reforming of 1 wt% acetic acid, methanol and ethanol at 275 °C and 200 bar. Conversions to gas phase (conv.) are mentioned in the Figure.

Chapter 4
64
For methanol reforming with the Pt-Ni catalyst almost no methane was formed (Figure
4.3). Methanol was found to be one of the major products during the reforming of EG (Figure
4.1) which explains why Pt-Ni/Al2O3 catalyst shows almost no methane formation in
agreement with earlier studies [16] and our own results (Chapter 3). The lower methane
production observed during methanol reforming in the presence of Pt-Ni can be explained by
the enhanced dehydrogenation activity of Pt-Ni catalyst [13], favoring C-H cleavage instead
of C-O cleavage in methanol. Promoting the Pt catalyst with Ni did not affect the alkane
(methane) selectivity for acetic acid or ethanol reforming as can be expected from the
reforming routes. Reforming of these compounds inherently lead to CH3 species on the
catalyst surface, which is a precursor for methane formation. In case of methanol reforming,
the intermediate CH3O must undergo C-O cleavage to form CH3 (and hence methane).
Methane formation during methanol reforming can be prevented by avoiding C-O cleavage.
4.3.4 Catalyst deactivation
Reforming experiments with 1 wt% methanol (Figure 4.2A) and ethanol (Figure 4.2B)
solutions showed stable activity levels for both Pt and Pt-Ni catalysts. Catalysts used for
acetic acid reforming deactivated during the reaction (Figure 4.2C). Both catalysts showed
similar deactivation rates. The catalysts lost all activity after 3 hrs on stream with final
conversion levels (~5%) being similar to the reforming experiment without a catalyst.
Deactivation of the catalyst with acetic acid is commonly observed in reforming
reactions [11]. The formation of methane resulting from acetic acid decomposition is reported
in literature to be a possible cause for deactivation of catalysts [21]. It is suggested that C-H
bond breaking in methane further results in CHx species (1≤x≤2) on the catalytic surface.
These fragments can further oligomerize to coke species [11]. However, catalysts used for
ethanol reforming were found to be stable while also producing high amounts of methane
(20%). It is also known that Pt and Ni catalysts are stable for the reforming of methane.
Therefore, it is concluded that methane-induced deactivation is unlikely and the dominant
deactivation pathway is due to other causes.
Further, liquid products formed during the APR of acetic acid, methanol and ethanol
were determined to find any role for them in catalyst deactivation. During acetic acid
reforming, a conversion of 7% to liquid by-products was observed for the Pt catalyst. By-

Chapter 4
65
products were identified as formaldehyde and iso-propanol. For ethanol, a conversion of ±6%
to liquid by-products was found for the Pt catalyst. The main product was acetic acid, and the
remaining was acetaldehyde (<0.5%). The Cannizzaro reaction (disproportionation of an
aldehyde to alcohol and carboxylic acid) could be responsible for some of the acetic acid
formed during ethanol reforming. The Pt and Pt-Ni catalysts studied did not influence the
amount of acetic acid and acetaldehyde formed during ethanol reforming, while during EG
reforming, the amount of acetic acid was strongly dependent on the type of catalyst. This
shows that the Cannizzaro-derived reaction is not a dominant contributor to acetic acid
formation during EG reforming.
No liquid by-products were observed during methanol reforming. Interestingly,
presence of Ni in the Pt-Ni catalyst did not show any significant differences on the type or
amount of secondary liquid by-products during reforming of acetic acid, methanol or ethanol
compared to the mono-metallic Pt catalyst. No apparent conclusions can thus be derived from
these experiments.
In the case of the Pt/Al2O3 catalyst that deactivated during acetic acid reforming, CO-
chemisorption experiments showed a Pt dispersion of only 0.03% (fresh catalysts 67%),
indicating that almost all accessible Pt surface area was lost. Loss of catalytic metal by
leaching, metal particle growth by sintering and coke formation are common causes for loss
of catalytic surface and hence deactivation of catalysts. XRF elemental analysis of the
deactivated Pt/Al2O3 catalyst used for acetic acid reforming showed that no Pt was lost by
leaching from the catalyst. Sintering is a thermo-physical effect and therefore dictated by the
operating conditions (temperate and pressure). Catalyst stability was not affected during
reforming of methanol and ethanol when the reaction was performed at the similar operating
conditions as for acetic acid reforming, thus excluding sintering as cause of catalyst
deactivation. The formation of coke on the surface of Pt based catalysts during steam
reforming of acetic acid is often reported [11]. Carbon deposits on the deactivated Pt/Al2O3
catalyst which was used for aqueous reforming of acetic acid was studied by TGA-MS up to a
temperature of 800 ⁰C in oxygen (1 v/v% O2 in N2). No weight loss attributed to the removal
of carbonaceous deposits was observed during the experiment, indicating that carbonaceous
deposits were not present on the catalyst. IR and Raman experiments (discussed below) also
did not show presence of any carbonaceous species. In addition, regeneration of the
deactivated Pt catalyst used for acetic acid reforming was attempted by oxygen treatment (up
to 500 ⁰C) but the treated catalyst did not regain activity for the reforming of EG. Based on

Chapter 4
66
these results, carbonaceous deposits as cause for catalyst deactivation can also be ruled out.
Under conventional gas-phase reforming conditions, it is well accepted that steam reforming
of acetic acid can lead to coke formation via intermediates involving acetone, diacetone
alcohol, and mesitylene [11, 22, 23]. Hot compressed water has a high tendency to dissolve
organic species, including carbonaceous deposits [24, 25]. Carrying out reforming in hot
compressed water therefore plays an important role in keeping the catalytic surface clean of
any coke deposits that prevent accessibility of oxygenates to catalytic sites.
Raman spectroscopy was used to study Pt catalysts used for reforming of methanol,
acetic acid and water only (blank experiment). Raman spectra were taken at room temperature
in air. The obtained spectra are shown in Figure 4.4. The spectra were normalized based on
the most pronounced Raman band at 362 cm-1 for easy comparison. In all three cases, Raman
spectra of the used catalysts showed five sharp adsorption bands in the range of 65-4000 cm-1.
These bands are attributed to Boehmite [26, 27], which is formed as a result of the phase
change of the γ-Al2O3 support in our catalyst when subjected to hot compressed water [see
Chapter 3]. The three bands at 362, 494 and 672 cm-1 are attributed to vibrational modes of
the Boehmite Al-O bond [26]. The two other adsorption bands, located at 3212 and 3076
cm-1, are attributed to stretching vibrations of O-H bonds [26]. A weak band at 3565 cm-1 is
visible in the spectra of the acetic acid reforming catalyst and this band can be attributed to
hydroxyl groups with a higher acidity. Interestingly, the ratio between the normalized bands at
362 cm-1 and the OH bands at 3076 and 3212 cm-1 show clearly that more hydroxyl species
are present on the deactivated Pt catalyst compared to the active catalysts.
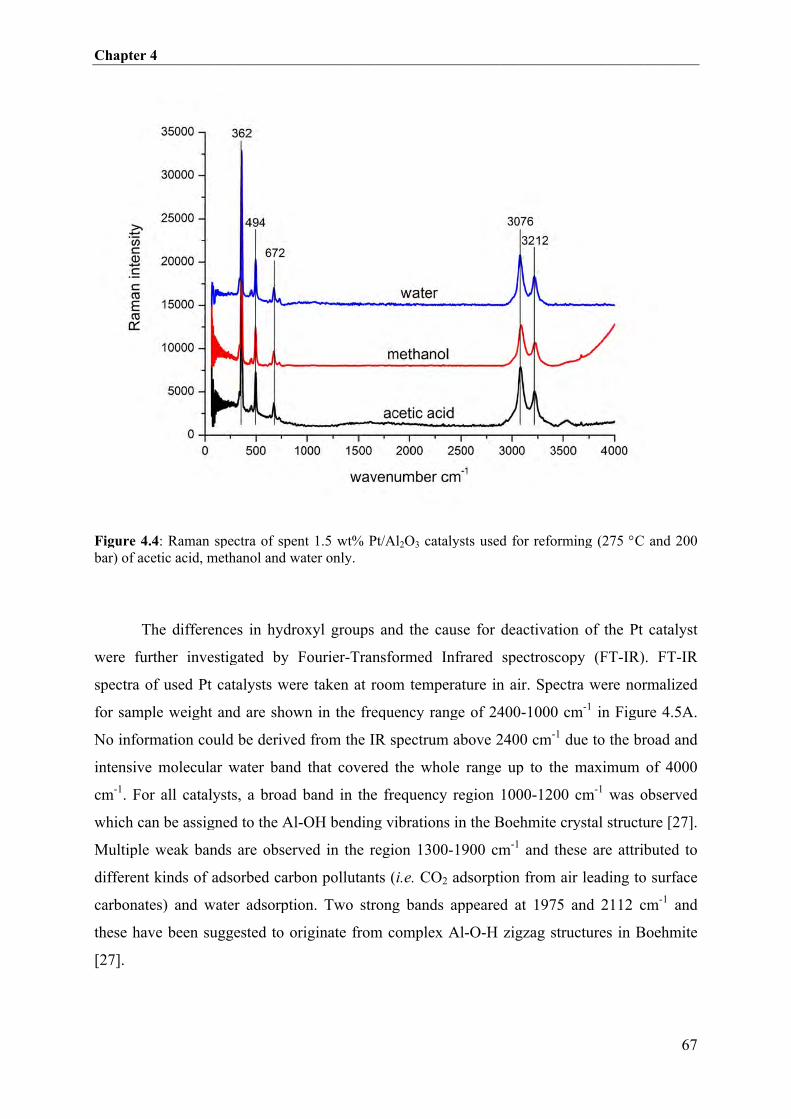
Chapter 4
Figu
bar)
were
spe
for sample weight and are shown in the frequency range of 2400
No information coul
intensive molecular water band that covered the whole range up to the maximum of 4000
cm
which
Mu
diffe
ca
these
[27
Chapter 4
Figure 4.4
bar) of
were
spectra of
for sample weight and are shown in the frequency range of 2400
No information coul
intensive molecular water band that covered the whole range up to the maximum of 4000
cm-1. For all catalysts, a broad band in the frequency region 1000
which
Multiple weak bands are observed in the region 1300
differ
carbonates)
these
27].
Chapter 4
re 4.4
of acetic acid
The differences in hydroxyl groups and the cause for de
were further investigated by F
tra of
for sample weight and are shown in the frequency range of 2400
No information coul
intensive molecular water band that covered the whole range up to the maximum of 4000
. For all catalysts, a broad band in the frequency region 1000
which c
tiple weak bands are observed in the region 1300
rent kinds of adsorbed carbon pollutants (
bonates)
these have been
Chapter 4
re 4.4: Raman spectracetic acid
The differences in hydroxyl groups and the cause for de
further investigated by F
tra of
for sample weight and are shown in the frequency range of 2400
No information coul
intensive molecular water band that covered the whole range up to the maximum of 4000
. For all catalysts, a broad band in the frequency region 1000
can be assigned to the Al
tiple weak bands are observed in the region 1300
ent kinds of adsorbed carbon pollutants (
bonates)
have been
: Raman spectracetic acid
The differences in hydroxyl groups and the cause for de
further investigated by F
tra of used
for sample weight and are shown in the frequency range of 2400
No information coul
intensive molecular water band that covered the whole range up to the maximum of 4000
. For all catalysts, a broad band in the frequency region 1000
an be assigned to the Al
tiple weak bands are observed in the region 1300
ent kinds of adsorbed carbon pollutants (
bonates) and water adsorption
have been
: Raman spectracetic acid
The differences in hydroxyl groups and the cause for de
further investigated by F
used
for sample weight and are shown in the frequency range of 2400
No information coul
intensive molecular water band that covered the whole range up to the maximum of 4000
. For all catalysts, a broad band in the frequency region 1000
an be assigned to the Al
tiple weak bands are observed in the region 1300
ent kinds of adsorbed carbon pollutants (
and water adsorption
have been
: Raman spectracetic acid, methanol and water only.
The differences in hydroxyl groups and the cause for de
further investigated by F
Pt catalysts were taken at room temperature in air. Spectra were normalized
for sample weight and are shown in the frequency range of 2400
No information coul
intensive molecular water band that covered the whole range up to the maximum of 4000
. For all catalysts, a broad band in the frequency region 1000
an be assigned to the Al
tiple weak bands are observed in the region 1300
ent kinds of adsorbed carbon pollutants (
and water adsorption
have been suggeste
: Raman spectr, methanol and water only.
The differences in hydroxyl groups and the cause for de
further investigated by F
Pt catalysts were taken at room temperature in air. Spectra were normalized
for sample weight and are shown in the frequency range of 2400
No information could be derived from the IR spectrum above 2400 cm
intensive molecular water band that covered the whole range up to the maximum of 4000
. For all catalysts, a broad band in the frequency region 1000
an be assigned to the Al
tiple weak bands are observed in the region 1300
ent kinds of adsorbed carbon pollutants (
and water adsorption
suggeste
: Raman spectra of, methanol and water only.
The differences in hydroxyl groups and the cause for de
further investigated by F
Pt catalysts were taken at room temperature in air. Spectra were normalized
for sample weight and are shown in the frequency range of 2400
d be derived from the IR spectrum above 2400 cm
intensive molecular water band that covered the whole range up to the maximum of 4000
. For all catalysts, a broad band in the frequency region 1000
an be assigned to the Al
tiple weak bands are observed in the region 1300
ent kinds of adsorbed carbon pollutants (
and water adsorption
suggeste
a of, methanol and water only.
The differences in hydroxyl groups and the cause for de
further investigated by F
Pt catalysts were taken at room temperature in air. Spectra were normalized
for sample weight and are shown in the frequency range of 2400
d be derived from the IR spectrum above 2400 cm
intensive molecular water band that covered the whole range up to the maximum of 4000
. For all catalysts, a broad band in the frequency region 1000
an be assigned to the Al
tiple weak bands are observed in the region 1300
ent kinds of adsorbed carbon pollutants (
and water adsorption
suggested to
a of spent 1.5 wt% Pt/Al, methanol and water only.
The differences in hydroxyl groups and the cause for de
further investigated by F
Pt catalysts were taken at room temperature in air. Spectra were normalized
for sample weight and are shown in the frequency range of 2400
d be derived from the IR spectrum above 2400 cm
intensive molecular water band that covered the whole range up to the maximum of 4000
. For all catalysts, a broad band in the frequency region 1000
an be assigned to the Al
tiple weak bands are observed in the region 1300
ent kinds of adsorbed carbon pollutants (
and water adsorption
d to
spent 1.5 wt% Pt/Al, methanol and water only.
The differences in hydroxyl groups and the cause for de
further investigated by F
Pt catalysts were taken at room temperature in air. Spectra were normalized
for sample weight and are shown in the frequency range of 2400
d be derived from the IR spectrum above 2400 cm
intensive molecular water band that covered the whole range up to the maximum of 4000
. For all catalysts, a broad band in the frequency region 1000
an be assigned to the Al-OH bending
tiple weak bands are observed in the region 1300
ent kinds of adsorbed carbon pollutants (
and water adsorption
originate from complex Al
spent 1.5 wt% Pt/Al, methanol and water only.
The differences in hydroxyl groups and the cause for de
further investigated by Fourier
Pt catalysts were taken at room temperature in air. Spectra were normalized
for sample weight and are shown in the frequency range of 2400
d be derived from the IR spectrum above 2400 cm
intensive molecular water band that covered the whole range up to the maximum of 4000
. For all catalysts, a broad band in the frequency region 1000
OH bending
tiple weak bands are observed in the region 1300
ent kinds of adsorbed carbon pollutants (
and water adsorption. Two strong bands appeared at 1975 and 2112 cm
originate from complex Al
spent 1.5 wt% Pt/Al, methanol and water only.
The differences in hydroxyl groups and the cause for de
ourier
Pt catalysts were taken at room temperature in air. Spectra were normalized
for sample weight and are shown in the frequency range of 2400
d be derived from the IR spectrum above 2400 cm
intensive molecular water band that covered the whole range up to the maximum of 4000
. For all catalysts, a broad band in the frequency region 1000
OH bending
tiple weak bands are observed in the region 1300
ent kinds of adsorbed carbon pollutants (
. Two strong bands appeared at 1975 and 2112 cm
originate from complex Al
spent 1.5 wt% Pt/Al, methanol and water only.
The differences in hydroxyl groups and the cause for de
ourier-Transformed Infrared spectroscopy (FT
Pt catalysts were taken at room temperature in air. Spectra were normalized
for sample weight and are shown in the frequency range of 2400
d be derived from the IR spectrum above 2400 cm
intensive molecular water band that covered the whole range up to the maximum of 4000
. For all catalysts, a broad band in the frequency region 1000
OH bending
tiple weak bands are observed in the region 1300
ent kinds of adsorbed carbon pollutants (
. Two strong bands appeared at 1975 and 2112 cm
originate from complex Al
spent 1.5 wt% Pt/Al
The differences in hydroxyl groups and the cause for de
Transformed Infrared spectroscopy (FT
Pt catalysts were taken at room temperature in air. Spectra were normalized
for sample weight and are shown in the frequency range of 2400
d be derived from the IR spectrum above 2400 cm
intensive molecular water band that covered the whole range up to the maximum of 4000
. For all catalysts, a broad band in the frequency region 1000
OH bending vibrations
tiple weak bands are observed in the region 1300
ent kinds of adsorbed carbon pollutants (
. Two strong bands appeared at 1975 and 2112 cm
originate from complex Al
spent 1.5 wt% Pt/Al2O
The differences in hydroxyl groups and the cause for de
Transformed Infrared spectroscopy (FT
Pt catalysts were taken at room temperature in air. Spectra were normalized
for sample weight and are shown in the frequency range of 2400
d be derived from the IR spectrum above 2400 cm
intensive molecular water band that covered the whole range up to the maximum of 4000
. For all catalysts, a broad band in the frequency region 1000
vibrations
tiple weak bands are observed in the region 1300
ent kinds of adsorbed carbon pollutants (i.e.
. Two strong bands appeared at 1975 and 2112 cm
originate from complex Al
O3 catalyst
The differences in hydroxyl groups and the cause for de
Transformed Infrared spectroscopy (FT
Pt catalysts were taken at room temperature in air. Spectra were normalized
for sample weight and are shown in the frequency range of 2400
d be derived from the IR spectrum above 2400 cm
intensive molecular water band that covered the whole range up to the maximum of 4000
. For all catalysts, a broad band in the frequency region 1000
vibrations
tiple weak bands are observed in the region 1300
i.e. CO
. Two strong bands appeared at 1975 and 2112 cm
originate from complex Al
catalyst
The differences in hydroxyl groups and the cause for de
Transformed Infrared spectroscopy (FT
Pt catalysts were taken at room temperature in air. Spectra were normalized
for sample weight and are shown in the frequency range of 2400
d be derived from the IR spectrum above 2400 cm
intensive molecular water band that covered the whole range up to the maximum of 4000
. For all catalysts, a broad band in the frequency region 1000
vibrations
tiple weak bands are observed in the region 1300
CO2
. Two strong bands appeared at 1975 and 2112 cm
originate from complex Al
catalyst
The differences in hydroxyl groups and the cause for de
Transformed Infrared spectroscopy (FT
Pt catalysts were taken at room temperature in air. Spectra were normalized
for sample weight and are shown in the frequency range of 2400
d be derived from the IR spectrum above 2400 cm
intensive molecular water band that covered the whole range up to the maximum of 4000
. For all catalysts, a broad band in the frequency region 1000
vibrations in
tiple weak bands are observed in the region 1300-1900 cm
2 adsorption from air lea
. Two strong bands appeared at 1975 and 2112 cm
originate from complex Al-
catalysts used for reforming (
The differences in hydroxyl groups and the cause for de
Transformed Infrared spectroscopy (FT
Pt catalysts were taken at room temperature in air. Spectra were normalized
for sample weight and are shown in the frequency range of 2400
d be derived from the IR spectrum above 2400 cm
intensive molecular water band that covered the whole range up to the maximum of 4000
. For all catalysts, a broad band in the frequency region 1000
in the Boehmite
1900 cm
adsorption from air lea
. Two strong bands appeared at 1975 and 2112 cm
-O-
used for reforming (
The differences in hydroxyl groups and the cause for de
Transformed Infrared spectroscopy (FT
Pt catalysts were taken at room temperature in air. Spectra were normalized
for sample weight and are shown in the frequency range of 2400
d be derived from the IR spectrum above 2400 cm
intensive molecular water band that covered the whole range up to the maximum of 4000
. For all catalysts, a broad band in the frequency region 1000
the Boehmite
1900 cm
adsorption from air lea
. Two strong bands appeared at 1975 and 2112 cm
-H zigzag structures in
used for reforming (
The differences in hydroxyl groups and the cause for deactivation of the Pt catalyst
Transformed Infrared spectroscopy (FT
Pt catalysts were taken at room temperature in air. Spectra were normalized
for sample weight and are shown in the frequency range of 2400
d be derived from the IR spectrum above 2400 cm
intensive molecular water band that covered the whole range up to the maximum of 4000
. For all catalysts, a broad band in the frequency region 1000
the Boehmite
1900 cm-1
adsorption from air lea
. Two strong bands appeared at 1975 and 2112 cm
H zigzag structures in
used for reforming (
activation of the Pt catalyst
Transformed Infrared spectroscopy (FT
Pt catalysts were taken at room temperature in air. Spectra were normalized
for sample weight and are shown in the frequency range of 2400-1000 cm
d be derived from the IR spectrum above 2400 cm
intensive molecular water band that covered the whole range up to the maximum of 4000
. For all catalysts, a broad band in the frequency region 1000-
the Boehmite1 and these are attributed to
adsorption from air lea
. Two strong bands appeared at 1975 and 2112 cm
H zigzag structures in
used for reforming (
activation of the Pt catalyst
Transformed Infrared spectroscopy (FT
Pt catalysts were taken at room temperature in air. Spectra were normalized
1000 cm
d be derived from the IR spectrum above 2400 cm-
intensive molecular water band that covered the whole range up to the maximum of 4000
-1200 cm
the Boehmite
and these are attributed to
adsorption from air lea
. Two strong bands appeared at 1975 and 2112 cm
H zigzag structures in
used for reforming (
activation of the Pt catalyst
Transformed Infrared spectroscopy (FT
Pt catalysts were taken at room temperature in air. Spectra were normalized
1000 cm-1 due to the broad and
intensive molecular water band that covered the whole range up to the maximum of 4000
1200 cm
the Boehmite crystal
and these are attributed to
adsorption from air lea
. Two strong bands appeared at 1975 and 2112 cm
H zigzag structures in
used for reforming (
activation of the Pt catalyst
Transformed Infrared spectroscopy (FT
Pt catalysts were taken at room temperature in air. Spectra were normalized
1000 cm-1
due to the broad and
intensive molecular water band that covered the whole range up to the maximum of 4000
1200 cm
crystal
and these are attributed to
adsorption from air lea
. Two strong bands appeared at 1975 and 2112 cm
H zigzag structures in
used for reforming (2
activation of the Pt catalyst
Transformed Infrared spectroscopy (FT
Pt catalysts were taken at room temperature in air. Spectra were normalized 1 in Figure
due to the broad and
intensive molecular water band that covered the whole range up to the maximum of 4000
1200 cm-1
crystal structure [
and these are attributed to
adsorption from air leading to surface
. Two strong bands appeared at 1975 and 2112 cm
H zigzag structures in
275
activation of the Pt catalyst
Transformed Infrared spectroscopy (FT-IR). FT
Pt catalysts were taken at room temperature in air. Spectra were normalized
in Figure
due to the broad and
intensive molecular water band that covered the whole range up to the maximum of 4000
was observed
structure [
and these are attributed to
ding to surface
. Two strong bands appeared at 1975 and 2112 cm
H zigzag structures in
75 °C and 200
activation of the Pt catalyst
IR). FT
Pt catalysts were taken at room temperature in air. Spectra were normalized
in Figure
due to the broad and
intensive molecular water band that covered the whole range up to the maximum of 4000
was observed
structure [
and these are attributed to
ding to surface
. Two strong bands appeared at 1975 and 2112 cm
H zigzag structures in Boehmite
C and 200
activation of the Pt catalyst
IR). FT
Pt catalysts were taken at room temperature in air. Spectra were normalized
in Figure
due to the broad and
intensive molecular water band that covered the whole range up to the maximum of 4000
was observed
structure [
and these are attributed to
ding to surface
. Two strong bands appeared at 1975 and 2112 cm-
Boehmite
C and 200
activation of the Pt catalyst
IR). FT-
Pt catalysts were taken at room temperature in air. Spectra were normalized
in Figure 4.5
due to the broad and
intensive molecular water band that covered the whole range up to the maximum of 4000
was observed
structure [27
and these are attributed to
ding to surface -1 and
Boehmite
67
C and 200
activation of the Pt catalyst
-IR
Pt catalysts were taken at room temperature in air. Spectra were normalized
5A.
due to the broad and
intensive molecular water band that covered the whole range up to the maximum of 4000
was observed
27].
and these are attributed to
ding to surface
and
Boehmite
67
C and 200
activation of the Pt catalyst
IR
Pt catalysts were taken at room temperature in air. Spectra were normalized
A.
due to the broad and
intensive molecular water band that covered the whole range up to the maximum of 4000
was observed
].
and these are attributed to
ding to surface
and
Boehmite

Chapter 4
68
Figure 4.5-A: FT-IR spectra of 1.5 wt% Pt/Al2O3 catalysts used for reforming (275 °C and 200 bar) of acetic acid, methanol and water only.
Figure 4.5-B: Differences between FT-IR spectra of 1.5 wt% Pt/Al2O3 catalysts used for reforming (275 °C and 200 bar) of acetic acid or methanol and water only.

Chapter 4
69
FT-IR spectra of the used catalysts were subtracted from each other as shown in
Figure 4.5B to study differences in chemical groups on the surfaces of the used Pt catalysts.
Subtracting the spectrum of the catalyst that was exposed to only water from that of aqueous
methanol solution resulted in a more or less flat line, indicating that the surface composition
of the active catalysts (used for methanol and water only) are similar. Subtracting the
spectrum of the catalyst subjected to only water from the spent deactivated acetic acid catalyst
resulted in 3 strong bands; one lattice vibration in the region 1000-1200 cm-1 and two sharp
OH related bands located at 1975 and 2112 cm-1. Also in the Raman spectra, the acetic acid
treated sample showed the highest O-H intensity (Figure 4.4). These results indicate the
presence of a highly hydroxylated type of Boehmite in the acetic acid deactivated catalyst
compared to the active catalyst used in methanol APR.
A cause for deactivation of the catalyst can be inferred from the increased number of
hydroxyl groups. It is known that the stability of the Al2O3 surface strongly depends on the
pH of the medium [28]. Acids are reported to cause dissolution of Al2O3 [29] and this is an
important process that can affect catalyst performance. The dissolution rate of metal oxide
supports increases at lower pH values and involves protonation of Al-O-Al bonds to form Al-
OH. Further protonation and/or rearrangement of oxide ligands are responsible for dissolution
of Al2O3 [29]. The increase in hydroxyl groups on the surface of the catalysts used for acetic
acid reforming indicates that the surface structure of Al2O3 is affected by acetic acid.
Dissociation constants for acids are much higher in hot compressed water compared to normal
water [25], and therefore, we propose that acetic acid behaves as a stronger acid in hot
compressed water resulting in protonation and sequential leaching of the alumina surface. In
hot compressed water, where solubility of inorganic oxide materials is low, it can be expected
that hydroxylated alumina that leached off can be re-deposited on the catalyst. Figure 4.6
shows the TEM image of the Pt deactivated catalyst. The Pt particle and the lattice distances
of the Al2O3 are clearly visible. The Al2O3 lattice distance is measured in the picture to be
0.7nm. The Pt particle is covered by a layer that shows the same lattice distances of 0.7 nm as
alumina, indicating that the Pt is covered by alumina. From these results, it is concluded that
the cause of deactivation of the Pt catalyst is coverage of catalytic Pt sites by hydroxylated
alumina layer.
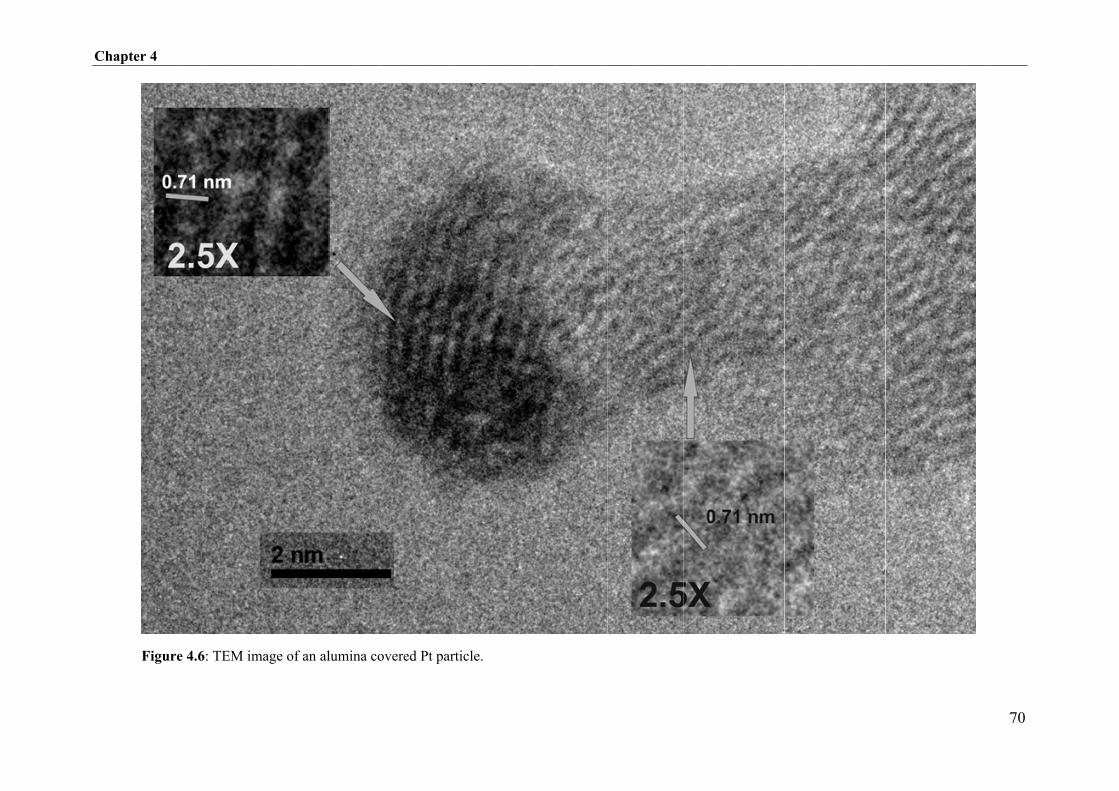
Chapter 4
Chapter 4
Chapter 4
Figure
Chapter 4
Figure Figure 4.64.6: TEM image of an alumina covered Pt particle.TEM image of an alumina covered Pt particle.TEM image of an alumina covered Pt particle.TEM image of an alumina covered Pt particle.TEM image of an alumina covered Pt particle.TEM image of an alumina covered Pt particle.TEM image of an alumina covered Pt particle.TEM image of an alumina covered Pt particle.TEM image of an alumina covered Pt particle.TEM image of an alumina covered Pt particle.TEM image of an alumina covered Pt particle.TEM image of an alumina covered Pt particle.
7070

Chapter 4
71
Although the exact mechanism responsible for coverage of the Pt particle by alumina
is not yet known, we showed here that this mechanism likely involved hydroxylation of the γ-
Al2O3/Boehmite support and is propagated by a strong acidic environment, resulting from the
high proton dissociation of acids in hot compressed water.
4.3.5 Reaction pathways
The reaction pathways involved in the reforming of ethylene glycol proposed by
Dumesic et al. [5] have been adapted with the new insights obtained from this study. The
resulting extended reaction sequences are proposed in Figure 4.7. Modifications include
formation of methanol from ethanol and deactivation by acetic acid. We have identified
methanol as an important liquid by-product. Methanol can be formed during the reforming of
ethanol as a result of C-C bond cleavage. Reforming of methanol can either lead to methane
or to hydrogen and the preferential route is controlled by the dehydrogenation activity of the
catalyst. The formation of acetic acid, ethanol and methanol during the reforming of EG is
considered undesired because consecutive reactions involving these compounds are
responsible for the formation of alkanes (mainly methane). In addition, the presence of acetic
acid can cause deactivation of the catalyst. The formation of liquid by-products and alkanes
mainly result from C-O bond cleavage, dehydration and hydrogenation reactions. The
pathway to high hydrogen yields involves dehydrogenation of ethylene glycol. Competition
between dehydrogenation and isomerization of the adsorbed intermediate to acetic acid
determines the selectivity toward alkanes (and hence H2 yields). Addition of Ni to alumina
supported Pt catalysts increased the dehydrogenation activity. As a consequence, a decrease in
the formation of alkanes and improved stability was accomplished by suppressing acetic acid
formation.

Chapter 4
72
Figure 4.7: Schematical representation of reaction pathways during reforming of ethylene glycol.

Chapter 4
73
4.4 Conclusions
We identified methanol, ethanol and acetic acid as the main liquid by-products during
the reforming of ethylene glycol in hot compressed water in the presence of Al2O3 supported
Pt and Pt-Ni catalysts. Side-reactions involving these liquid by-products lead to the formation
of high amounts of methane. Acetic acid was shown to be responsible for the deactivation of
Pt and Pt-Ni catalysts by hydroxylation of the Al2O3 surface. Re-deposition of the dissolved
alumina on the catalyst leads to the blocking of catalytic Pt sites and hence deactivation of the
catalyst. The increased dehydrogenation activity of the Pt-Ni catalyst was found to suppress
the formation of acetic acid during ethylene glycol reforming and thereby increasing the H2
selectivity and catalyst lifetime.
References
[1] J.W. Shabaker, G.W. Huber, J.A. Dumesic, J. Catal. 222 (2004) 180-191.
[2] A.O. Menezes, M.T. Rodrigues, A. Zimmaro, L.E.P. Borges, M.A. Fraga, Renew.
Energ. 36 (2011) 595-599.
[3] B. Roy, K. Loganathan, H.N. Pham, A.K. Datye, C.A. Leclerc, Int. J. Hydrogen
Energ. 35 (2010) 11700-11708.
[4] A. Wawrzetz, B. Peng, A. Hrabar, A. Jentys, A.A. Lemonidou, J.A. Lercher, J. Catal.
269 (2010) 411-420.
[5] R.R. Davda, J.W. Shabaker, G.W. Huber, R.D. Cortright, J.A. Dumesic, Appl. Catal.
B 56 (2005) 171-186.
[6] P.D. Vaidya, A.E. Rodrigues, Chem. Eng. J. 117 (2006) 39-49.
[7] A.L. Alberton, M.M.V.M. Souza, M. Schmal, Catal. Today 123 (2007) 257-264.
[8] D.L. Trimm, Catal. Today 37 (1997) 233-238.
[9] F. Frusteri, S. Freni, V. Chiodo, L. Sparado, G. Bonura, S. Cavallaro, J. Power
Sources 132 (2004) 139-144.
[10] V. Klouz, V. Fierro, P. Denton, H. Katz, J.P. Lisse, S. Bouvot-Mauduit, C. Mirodatos,
J. Power Sources 105 (2002) 26-34.
[11] K. Takanabe, K. Aika, K. Seshan, L. Lefferts, Chem. Eng. J. 120 (2006) 133-137.
[12] K.O. Christensen, D. Chen, R. Lodeng, A. Holmen, Appl. Catal. A 314 (2006) 9-22.
[13] O. Skoplyak, M.A. Barteau, J.G. Chen, Surf. Sci. 602 (2008) 3578-3587.

Chapter 4
74
[14] M. Osada, M. Watanabe, K. Sue, T. Adschiri, K. Arai, J. Supercrit. Fluids 28 (2004)
219.
[15] J. An, L. Bagnell, T. Cablewski, C.R. Strauss, R.W. Trainor, J. Org. Chem. 62 (1997)
2505.
[16] G.W. Huber, J. W. Shabaker, S.T. Evans, J.A. Dumesic, Appl. Catal. B 62 (2006) 226-
235.
[17] A. Erdohelyi, J. Rasko, T. Kecskes, M. Toth, M. Dömök, K. Baan, Catal. Today 116
(2006) 367-376.
[18] S. Sa, H. Silva, L. Brandao, J.M. Sousa, A. Mendes, Appl. Catal. B 99 (2010) 43-57.
[19] S.J. Blanksby, G.B. Ellison, Acc. Chem. Res. 36 (2003) 255-263.
[20] B. Matas Guell, I. Babich, K. Seshan, L. Lefferts, J. Catal. 257 (2008) 229-231.
[21] M.M.V.M. Souza, M. Schmal, Appl. Catal. A 281 (2005) 19-24.
[22] X. Hu, G. Lu, Appl. Catal. B 99 (2010) 289-297.
[23] A.C. Basagiannis, X.E. Verykios, Appl. Catal. B 82 (2008) 77-88.
[24] Y. Guo, S.Z. Wang, D.H. Xu, Y.M. Gong, H.H. Ma, X.Y. Tang
Renew. Sustain. Energy Rev., 14 (2010), p. 334
[25] P.E. Savage, J. Supercrit. Fluid. 47 (2009) 407-414.
[26] H.D. Ruan, R.L. Frost, J.T. Kloprogge, J. Raman. Spectrosc. 32 (2001) 745-750.
[27] A.B. Kiss, G. Keresztury, L. Farkas, Spectrochim. Acta A 36 (1980) 653-658.
[28] J.A. Yopps, D.W. Feurstenau, J. Colloid Sci. 19 (1964) 61-71.
[29] B. Kasprzyk-Hordern, Adv. Colloid. Interfac. 110 (2004) 19-48.

75
Chapter 5
Carbon nanotubes: a promising catalyst support material
for APR of biomass waste in supercritical water
D.J.M. de Vlieger, D.B. Thakur, L. Lefferts and K. Seshan, ChemCatChem, (2012)
Catalytic aqueous phase reforming (APR) under supercritical water (SCW)
conditions is very promising for the production of renewable chemicals from
biomass. Stability issues of catalyst support materials in SCW are a major
setback for these reactions and stall the further development and industrial
exploitation of this technique. The development of stable catalytic support
materials for reactions in SCW is therefore of much importance. Carbon
nanotubes (CNT) are widely recognized for their significant physical and
chemical stability, high heat conductivity and open structure. These properties
are already explored for different applications. In this work, we show that CNT
to be a promising stable catalyst support material for reactions in SCW. The
efficiency of Pt/CNT as catalyst for the production of hydrogen by reforming of
ethylene glycol and acetic acid in SCW was studied and illustrates the
applicability of CNT as catalyst support in SCW.
Chapter 5
76
5.1 Introduction
Aqueous Phase Reforming (APR) under supercritical water (SCW) conditions (>374
⁰C and 221 bar) has gained interest as a reaction medium due to the special properties it
possesses [1-3]. SCW as reaction medium is especially promising for the production of
renewable chemicals from biomass due to (i) its high tendency to dissolve bio-organic
materials and (ii) overcome mass transfer limitations induced by these large molecules [4-7].
Catalysts are mandatory in the APR process to achieve commercially relevant yields
of the desired products (e.g. H2). The majority of APR studies reported [2, 6, 8, 9] were
performed with metal oxide (e.g. Al2O3, TiO2, and MgO) supports on which a noble metal
(e.g. Pt, Pd and Ru) was deposited. For example, it was shown in chapter 3 and 4 that
Pt/Al2O3 is a promising catalyst for the production of “green” hydrogen by sub- and
supercritical water reforming of ethylene glycol (>80% water).
However, catalyst stability issues related to the alumina support are common during
APR. The first problem involves a phase change of γ-Al2O3 to Boehmite (Al(OOH)) due to
hydration by the hot compressed water as discussed in Chapter 3 and 4. Boehmite has a much
lower surface area (± 20 m2/g) compared to γ-alumina (200 m2/g) and this is due to the
collapse of mesopores (pore diameters of 50-200 Å) during the phase transition. Metal
particles deposited inside these pores can be encapsulated during the collapse, making these
catalytic sites inaccessible for reaction. In addition, this phase transition also propagates
sintering of the metal particles due to the lower surface area of the support. However, since
this transition is rapid, only an initial activity drop is observed and Pt/Boehmite is stable for
APR of non-acidic oxygenates as discussed in Chapter 3 and 4. In the case of APR of acidic
oxygenates, e.g. acetic acid, we have shown in Chapter 4 that further hydroxylation of the
alumina surface occurs and migration of these species resulted in the coverage of the Pt metal
particles. This makes the metal particles inaccessible and results in loss of activity. It should
be taken into account that acidic by-products can be formed during APR of non-acidic
oxygenates (e.g. acetic acid formation during APR of ethylene glycol (EG)) and thus catalyst
deactivation induced by the presence of organic acids is a real issue. There are two options to
overcome this; (i) suppress acid formation or (ii) design supports which are stable. We have
shown in Chapter 4 that promotion of Pt/Al2O3 with a second metal (Ni) suppressed the
formation of acetic acid by a factor of 3 during APR of EG, but acetic acid formation could
not be prevented fully. Moreover, a majority of biomass derived aqueous streams contain

Chapter 5
77
acidic components. For instance, acetic acid is a major component (10 to 20 wt%) in the
aqueous fraction of pyrolysis oil [10]. The presence of carboxylic acids cannot be avoided and
therefore other catalyst support materials, e.g. carbon based, are possible alternatives.
Activated (amorphous) carbon (AC) is used frequently for reactions in hot compressed
water due to its physical-chemical stability. For instance, Ni or Ru on AC have been studied
for gasification of bio-oxygenates such as glucose, phenol, lignin and cellulose [11-14].
However, the micro-porosity which dominates AC, make them susceptible to pore blockage
by coke which is unavoidably formed during APR of biomass streams [15]. Further, the
micro-porosity can also cause diffusion limitations for the larger biomass molecules [11, 16,
17].
All these stability issues indicate that conventional metal oxides or activated carbon
are not suitable as catalytic support materials in APR of biomass derived waste. Thus, the
development of stable materials is of great importance for the commercial feasibility of APR.
Carbon Nanomaterials (CNM), either Carbon Nano Fibers (CNF) or Tubes (CNT),
have attracted a lot of interest in the past decade due to their physical and chemical properties
[18-22]. Especially in the field of heterogeneous catalysis, CNM have exhibited promising
performance as structured catalyst support materials for different catalytic reactions [23, 24].
CNM are not only reported to be very stable materials due to their crystalline nature but their
open structure (large external geometric surface areas, absence of micro and meso-pores) is
very beneficial for mass transfer and it decreases the chance of pore blockage by coke. Taylor
et al. used Ni decorated CNT for SCW gasification of cellulose in a batch process but the
stability of the catalyst was not discussed [25]. Chang et al. showed earlier that multiwall
carbon nanotubes were oxidized by SCW, leading to thinning of the tube walls and collapse
of the tube openings. This phenomenon was much more severe when an oxidizing agent such
as oxygen was present [26]. However, destruction of the macro CNT structure was not
reported.
In this chapter studied, the stability of Pt decorated CNT (Pt/CNT) in supercritical
water is studied and furthermore its applicability as catalyst for SCW reforming of ethylene
glycol and acetic acid is illustrated. To the best of our knowledge, this is the first study where
the efficiency of Pt/CNT as catalyst for SCW reforming is assessed.

Chapter 5
78
5.2 Experimental
5.2.1 Catalyst preparation and characterization
CNT supported Pt catalysts were prepared according section 2.2.2. Catalysts were
characterized by XRF, BET, SEM imaging, XRD, XPS and Raman spectroscopy. Further
details regarding catalyst characterization are discussed in section 2.3.
5.2.2 Supercritical water reformer
The experimental setup and applied definitions are described in detail in Chapter 2.
Undecorated CNT and Pt/CNT were exposed to supercritical water for 6 hrs (450 ºC and 250
bar) to study the effect of SCW on the structure and morphology of the CNT. The catalytic
activity of Pt/CNT was studied for the reforming of either a 5 wt% ethylene glycol (EG) or 1
wt% acetic acid (HOAc) solution. A 2mL. min-1 flow of the respective oxygenate feed was
first preconditions to supercritical water conditions (450 ºC and 250 bar) before it entered the
reactor in which 0.1 gr of Pt/CNT catalyst was placed.
5.3 Results and discussion
5.3.1 Stability of CNT in SCW
CNT were subjected to SCW (450 ⁰C and 250 bar) for 6 hrs to study the effect on the
morphology. The SEM image of the pristine CNT (Figure 5.1A) shows clusters of entangled
tubes with open ends. Exposure to SCW did not affect the bulk morphology of CNT (Figure
5.1B). Moreover, collapse of the tube walls is not observed and the openings at the end of
tubes are still clearly visible, which is in agreement with Chang et al. [26]. No indication of
pitting or damage of the CNT walls was observed. The effect of SCW on the structural quality
(crystallinity) of CNT was studied with Raman spectroscopy and the spectra of the pristine
and SCW exposed CNT are shown in Figure 5.1C. Three peaks were observed in the Raman
spectra and were located at 1346, 1574 and 2685 cm-1. The most prominent peak (1574 cm-1)
is attributed to the G-band which is characteristic for defect-free sp2 hybridized carbon
systems. The peak located at 1365 cm-1 is attributed to the defect induced D-band of sp2

Chapter 5
79
carbon systems. Quantifying disorder in a graphene monolayer is usually made by analyzing
the ID/IG intensity ratio between the disorder-induced D-band and the Raman allowed G-band.
In this case, the ratio was calculated to be ±0.7 for pristine CNT and did not vary after treating
the CNT with SCW. The peak positions were similar for both the pristine and spent CNT,
confirming that the high crystallinity of the tubes was not affected after SCW exposure.
surface element CNT pristine CNT exposed
C (%) 99.3 99.2 O (%) 0.7 0.8
Figure 5.1: High resolution SEM images of CNT before (A) and after exposure (B) to supercritical water (450 °C, 250 bar, 6h). Raman Spectra (C) and XPS derived results (D) of the pristine and SCW exposed CNT.
C
D
A B

Chapter 5
80
XPS was further used to study the effect of SCW on the surface of the tubes in more
detail. XPS results of pristine as well as SCW exposed CNT are tabulated in Figure 5.1D and
shows the atomic distribution of surface species. The surface oxygen concentration of pristine
CNT did not vary significantly after exposure to SCW, which shows that the amount of
oxygen containing groups did not increase due to exposure to SCW. Extensive
functionalization of the carbon support by SCW is therefore excluded. These results indicate
that CNT are very stable in SCW.
The chemical inertness of CNM is attributed to the structured graphene sheet, which is
the building block of CNM. Graphene sheets have a planar honeycomb structure of a one
atom thick layer of sp2-hybridized carbon atoms, which are considered the strongest among
all atomic bonds. CNM are entirely made up of these bonds and this explains their good
chemical stability. Surface modifications of CNM have been studied for different applications
but very severe conditions have to be used to affect the surface of CNM. For instance
subjecting CNM to concentrated nitric acid is used for functionalization of the CNM surface
to make it hydrophilic, illustrating the harsh conditions necessary to overcome the chemical
inertness of CNM [27]. The hydrophobic nature of CNM is not a problem in SCW as SCW
behaves like an organic solvent and hence good wettability of CNM is expected.
5.3.2 Stability of Pt-CNT in SCW
The stability of CNT in SCW was shown in the previous section. For catalytic
purposes it is important to decorate the CNM with an active catalytic metal. Metal loss
compromises the catalyst efficiency and hence strong bindings between the metal and the
CNM supports are vital. In this regard, it is known from literature that Pt-C hybridization is
possible between Pt and π orbitals of C-atoms in graphene sheets, resulting in strong Pt-
support bonds [28].
The effect of SCW (450 ⁰C, 250 bar) on stability of Pt decorated CNT was studied.
XRF elemental analysis of the synthesized Pt-CNT showed that the Pt loading was 8 wt%.
This amount seems high compared to metal loadings (1-3 wt%) of conventional catalysts.
However, the low density of CNT is responsible for the seemingly high Pt loading on Pt-
CNT. The absolute amount of Pt per volume of Pt-CNT is in the same range as for
conventional catalysts. No difference in Pt content of the pristine and SCW exposed Pt-CNT
was observed by XRF analysis. In addition, the reactor effluent was analysed by XRF to study

Chapter 5
81
the presence of Pt. The total liquid reactor effluent (800ml) was collected and concentrated to
5 mL by evaporation. The XRF detection limit for Pt in water is 70 mg.L-1 and this means that
Pt in the concentrated reactor effluent is only detectable when at least 5% of the total amount
of deposited Pt (8 mg) leached from the CNT support. XRF analysis of the reactor effluent did
not show any Pt, indicating that leaching was below 5%. The XRF results of the SCW
exposed Pt-CNT and reactor effluent indicate that leaching of the Pt metal from the CNT
support was negligible during the reaction and can be contributed to the strong interaction
between Pt and CNT [28].
High resolution SEM images of pristine and SCW exposed Pt-CNT were taken (Figure
5.2A-B) to study the Pt particles. Pt nanoparticles with a size of ±11 nm were visible on both
the pristine and exposed Pt-CNT, indicating that Pt particle growth was not significant during
SCW exposure. XRD spectra of pristine and exposed Pt-CNT were taken (Figure 5.2C) to
study the Pt particles in more detail.
The Scherrer equation was applied to the Pt(111) diffraction line (Figure 5.2C) to
calculate average Pt particle sizes. Similar Pt particles sizes of ±11 nm were calculated for
both the pristine and SCW exposed Pt-CNT, which are in agreement with SEM observations.
Raman spectra of the pristine and exposed Pt-CNT (Figure 5.2D) showed the same absorption
bands as undecorated CNT (Figure 5.1C). The relative intensities of the ID/IG absorption
bands were calculated to be 0.70 and 0.75 for the pristine and SCW exposed Pt-CNT,
respectively. The comparable values indicate that the surface structure (crystallinity) of Pt-
CNT was not affected by SCW, which was also the case for undecorated CNT (Figure 5.1C).
Therefore, it can be concluded that decorating the CNT with Pt does not affect the SCW
stability of the material.
XPS results of the pristine and exposed Pt-CNT are tabulated in Figure 5.2E and from
this it can be seen that the oxygen content of Pt-CNT increased after exposure to SCW, while
an increase was not observed in the case of undecorated CNT (Figure 5.1D). The increase in
oxygen might indicate oxidation of Pt by SCW. However, noble metals such as Pt are not able
to be oxidized by water under conventional reforming conditions [29]. Also Pt oxidation by
SCW is contradicting the work of Crittenden and Parsons, where reduction of a PtO2 catalyst
to Pt0 was observed in SCW [30].

Chapter 5
82
surface element CNT pristine CNT exposed
C (%) 98.0 97.3 O (%) 1.2 2.0 Pt (%) 0.8 0.7
Figure 5.2: High resolution SEM images of Pt-CNT before (A) and after exposure (B) to supercritical water (450 ⁰C, 250 bar, 6hr); XRD diffractograms (C), Raman spectra (D) and XPS derived results (E) of the pristine and spent Pt-CNT.
A B
E
D
C

Chapter 5
83
The effect of SCW exposure on Pt oxidation state and loading were studied in more
detail from the XPS spectra (shown in Figure 5.3). The XPS spectrum for the Pt 4f(5/2 and 7/2)
emission bands of the pristine Pt-CNT are shown in Figure 5.3A. Pt is characterized by the
doublet with binding energies (BE) of 71.68 eV (4f7/2) and 74.98 eV (4f5/2), showing a
binding energy difference of 3.3 eV between the maximum intensities of both bands. This
corresponds to the characteristics of Pt0, illustrating that majority of Pt species on pristine Pt-
CNT are metallic [31]. The XPS lines of Pt of the SCW exposed catalyst (Figure 5.3B) show
the binding energies of Pt 4f7/2 and Pt 4f5/2 at 71.67 and 74.97 eV, respectively. These values
are similar to the XPS lines of Pt on pristine Pt-CNT (Figure 5.3A), indicating that the
electronic properties associated with changes in oxidation state of Pt have not been affected
by SCW, confirming the stability of Pt/CNT catalyst. The XPS spectrum of the SCW exposed
Pt-CNT revealed a very weak band at 288 eV (not shown), which indicates the presence of
C=O groups. The observed increase in oxygen on the SCW exposed Pt-CNT (Figure 5.2E) is
therefore related to marginal functionalization of the CNT, which was likely facilitated by Pt
under the studied conditions.
In addition to Pt 4f spectra for pristine and SCW exposed Pt-CNT, C 1s spectra were
also recorded (not shown here). On the basis of the ratios of area under Pt 4f and C 1s peaks,
the amounts of Pt present on CNT before and after SCW exposure can be compared
qualitatively. The values of these ratios (i.e. Pt/C) were estimated to be 0.0079 and 0.0074 for
pristine and used catalyst, respectively. This shows that there is no significant variation in the
amount of platinum supported on CNT after SCW exposure. This is also in good agreement
with the XRF results, which showed no loss of Pt. Additionally, the Pt size remained
unchanged as confirmed by XRD and high resolution SEM analysis. Together with XPS these
results indicate that the dispersion of Pt had not been affected due to the exposure of catalyst
to SCW conditions and it is substantially stable.

Chapter 5
84
Figure 5.3: XPS spectrum of the Pt 4f photoemission from the PT-CNT catalyst (A) before and (B) after exposure to SCW.
A
B

Chapter 5
85
5.3.3 Activity of Pt-CNT for ethylene glycol reforming in SCW
Catalytic reforming of a 5 wt% ethylene glycol (EG) solution was studied at 450 °C
under 250 bar pressure. In the absence of a catalyst a conversion of only 5% was observed. A
similar conversion was obtained when undecorated CNT were used as catalyst, indicating that
undecorated CNT do not show catalytic activity for EG reforming. The catalytic properties of
Pt decorated CNT were studied for the EG reforming reaction. The conversion, selectivity
towards gas phase products and formation of liquid by-products were followed for 6 hrs and
the results are shown in Figure 5.4. A conversion of 85% (Figure 5.4A) was obtained in the
presence of Pt-CNT and is remarkably higher compared to the non-catalyzed reaction,
illustrating the good catalytic activity of this material. The reforming of EG was highly
selective to H2 and CO2 in presence of Pt-CNT. Formation of CO was not observed by the
GC, indicating that CO levels were below 0.1 v/v%. The low amounts of alkanes formed were
mainly CH4.
HPLC analysis of the reactor effluent (Figure 5.4B) was conducted to identify liquid
by-products formed during EG reforming. In addition to EG, six other compounds were
observed in the reactor effluent and were identified as formic acid, acetic acid, acetaldehyde,
methanol, ethanol and iso-propanol. The sum of carbon in these compounds was in agreement
(± 5%) with the TOC value of the liquid reactor effluent, showing that all carbon was
accounted for by HPLC analysis.
In chapter 4, we showed that a Pt/Al2O3 catalyst deactivated completely within 3 hrs
time-on-steam during reforming of a 1 wt% acetic acid solution. No deactivation of the Pt-
CNT catalyst was observed during 6 hrs time-on-stream for the EG reforming experiment
even though a significant amount of acetic acid (0.2 wt% in reactor effluent) was formed as
by-product.
The activity and stability of Pt-CNT during acetic acid reforming was studied in more
detail and is discussed in the next section.

Chapter 5
86
Figure 5.4: Graphical representation of (A) Conversion (�) and selectivity to H2 (●), CO2 (�) and CH4 (�) (B) Concentration of ethylene glycol (EG), formic acid (FA), acetic acid (HOAc), acetaldehyde (HAc), methanol (Meth) and iso-propanol (Iso-P) in reactor effluent, for the reforming of 5 wt% ethylene glycol in supercritical water (450 ⁰C and 250 bar) using Pt-CNT catalyst.
A
B

Chapter 5
87
5.3.4 Properties of Pt-CNT for SCW reforming of acetic acid
Pt-CNT were studied for the reforming of 1 wt% acetic acid in SCW (450 ⁰C and 250
bar). This acetic acid concentration was chosen because it was found earlier (Chapter 4) that
this concentration induces deactivation of conventional catalysts. A conversion of 3% was
observed when no catalyst or only the undecorated CNT were used. Conversion and gas phase
selectivities were monitored for 6 hrs during the reforming of the acetic acid solution over Pt-
CNT and the results are shown in Figure 5.5A. Gasification conversion of acetic acid was
around 58% and is rather low compared to the EG experiment. The acetic acid reforming
mechanism is different than for EG, which is the likely reason for the difference in activity.
The low acetic acid gasification activity of Pt-CNT indicates that Pt is a poor choice for
reforming of acetic acid. Optimizing the metal for acetic acid reforming is discussed in the
next chapter. The stoichiometry of acetic acid reforming (CH3-COOH � CH4 + CO2) predicts
a CH4 and CO2 selectivity of 50%. The selectivity towards alkanes was found to be slightly
lower, while a higher CO2 selectivity of 55% was observed (Figure 5.5A). Furthermore,
hydrogen was formed during the reaction. These observations indicate that other reactions
(e.g. methane reforming) also occurred. No components other than acetic acid were observed
in the liquid reactor effluent.
Conversions and selectivities were stable during the entire experiment (Figure 5.5A),
indicating that the catalyst did not deactivate under the tested reforming conditions. XRF
analysis of the used Pt-CNT catalyst showed similar Pt loadings compared to fresh Pt-CNT,
confirming that Pt leaching did not occur. Furthermore, Raman spectroscopy (Figure 5.5B) of
the used Pt-CNT showed a similar spectrum with an ID/IG intensity ratio of 0.69. As
discussed before, the ID/IG intensity ratio of pristine Pt-CNT was 0.70. The comparable ID/IG
ratios of the pristine and used Pt-CNT indicate that the crystallinity of the material was not
affected significantly by acetic acid in SCW. XPS analysis of the Pt-CNT catalyst used for
acetic acid reforming showed an oxygen concentration of 9%. This value is slightly higher
than the 2% that was found for SCW exposed Pt-CNT (Figure 5.2E). These results indicate
that acetic acid in SCW caused a marginal amount of oxidation of the CNT support. However,
the macro structure and crystallinity of the CNT was not affected as discussed earlier and
therefore, it is concluded that Pt decorated CNT are stable catalysts for acetic acid reforming
reactions in SCW.
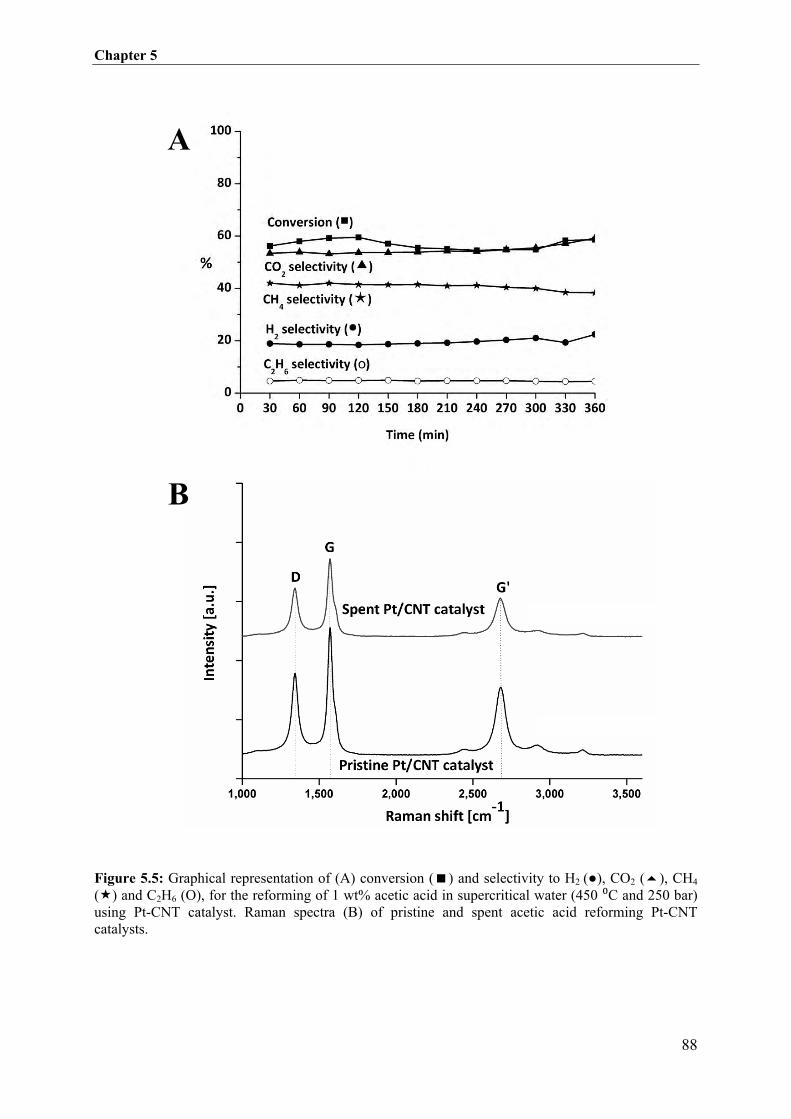
Chapter 5
88
Figure 5.5: Graphical representation of (A) conversion (�) and selectivity to H2 (●), CO2 (�), CH4 (�) and C2H6 (Ο), for the reforming of 1 wt% acetic acid in supercritical water (450 ⁰C and 250 bar) using Pt-CNT catalyst. Raman spectra (B) of pristine and spent acetic acid reforming Pt-CNT catalysts.
A
B

Chapter 5
89
5.4 Conclusions
It is shown in this chapter that Pt decorated and undecorated carbon nanotubes are very stable
in supercritical water. As an illustration of its applicability, the efficiency of Pt/CNT catalyst
was demonstrated for the model reforming reactions of ethylene glycol and acetic acid in
supercritical water. The physical and chemical stability of CNT offer new possibilities for
catalytic reactions in supercritical water
References
[1] P.E. Savage, J. Supercrit. Fluids 47 (2009) 407-414.
[2] Y. Guo, S.Z. Wang, D.H. Xu, Y.M. Gong, H.H. Ma, X.Y. Tang, Renew. Sust. Energ.
Rev. 14 (2010) 334-343.
[3] G. Brunner, J. Supercrit. Fluids 47 (2009) 373-381.
[4] J.M.L. Penninger, G.J.J. Maass, M. Rep, Int. J. Hydrogen Energ. 32 (2007) 1472-
1476.
[5] R.D. Cortright, R.R. Davda, J.A. Dumesic, Nature 418 (2002) 964-967.
[6] R.R. Davda, J.W. Shabaker, G.W. Huber, R.D. Cortright, J.A. Dumesic, Appl. Catal.
B 56 (2005) 171-186.
[7] A. Tanksale, J.N. Beltramini, G.M. Lu, Renew. Sust. Energ. Rev. 14 (2010) 166-182.
[8] A.O. Menezes, M.T. Rodrigues, A. Zimmaro, L.E.P. Borges, M.A. Frago, Renew.
Energ. 36 (2011) 595-599.
[9] P. Azadi, R. Farnood, Int. J. Hydrogen Energ. 36 (2011) 9529-9541.
[10] F.H. Mahfud, F.P. Van Geel, R.H. Venderbosch, H.J. Heeres, Separ. Sci. Technol. 43
(2008) 3056-3074.
[11] I.G. Lee, S.K. Ihm, Ind. Eng. Chem. Res. 48 (2008) 1435-1442.
[12] A. Sharma, I. Saito, H. Nakagawa, K. Miura, Fuel 86 (2007) 915-920.
[13] A. Yamaguchi, N. Hiyoshi, O. Sato, M. Osada, M. Shirai, Energ. Fuel. 22 (2008)
1485-1492.
[14] X. Hao, L. Guo, X. Zhang, Y. Guan, Chem. Eng. J. 110 (2005) 57-65.
[15] N.Z. Muradov, T.N. Veziroglu, Int. J. Hydrogen Energ. 30 (2005) 225-237.
[16] E.E. Iojoiu, M.E. Domine, T. Davidian, N. Guilhaume, C. Mirodatos, Appl. Catal. A
323 (2007) 147-161.

Chapter 5
90
[17] S. Czernik, R. Evans, R. French, Catal. Today 129 (2007) 265-268.
[18] J.F. Silvain, C. Vincent, J.M. Heintz, N. Chandra, Compos. Sci. Technol. 69 (2009)
2474-2484.
[19] S.M. Jang, J. Miyawaki, M. Tsuji, I. Mochida, S.H. Yoon, Carbon 47 (2009) 3383-
3391.
[20] R. Ströbel, J. Garche, P.T. Moseley, L. Jörissen, G. Wolf, J. Power Sources 159 (2006)
781-801.
[21] S. Perathoner, M. Gangeri, P. Lanzafame, G. Centi, Kinet. Catal. 48 (2007) 877-883.
[22] A.L.M. Da Silva, L.V. Mattos, J.P. den Breejen, J.H. Bitter, K.P. de Jong, F.B.
Noronha, Catal. Today 164 (2011) 262-267.
[23] J.K. Chinthaginjala, J.H. Bitter, L. Lefferts, Appl. Catal. A 383 (2010) 24-32.
[57] D.B. Thakur, R.M. Tiggelaar, Y. Weber, J.G.E. Gardeniers, L. Lefferts. K. Seshan,
Appl. Catal. B 102 (2011) 243-250.
[58] A.D. Taylor, G.J. Dileo, K. Sun, Appl. Catal. B 93 (2009) 126-133.
[59] J.Y. Chang, A. Ghule, J.J. Chang, S.H. Tzing, Y.C. Ling, Chem. Phys. Lett. 363
(2002) 583-590.
[60] S.D. Gardner, C.S.K. Singamsetty, G.L. Booth, G.R. He, C.U. Pittman Jr, Carbon 33
(1995) 587-595.
[61] T. Kondo, Y. Iwasaki, Y. Honma, Y. Takagi, S. Okada, J. Nakanmura, Phys. Rev. B.
80 (2009) 233408.
[62] K. Takanabe, K. Aika, K. Seshan, L. Lefferts, J. Catal. 227 (2004) 101-108.
[63] R.C. Crittendon, E.J. Parsons, Organometallics, 13 (1994) 2587-2591.
[64] J. F. Moulder, W. F. Stickle, P. E. Sobol, K. D. Bomben, Handbook of X-ray
Photoelectron Spectroscopy, Perkin-Elmer Corporation, Eden Prairie (1992).

91
Chapter 6
Ru/CNT; a commercially promising catalyst for APR of
acetic acid in sub- and supercritical water
Catalytic reforming of biomass derived waste streams in sub- and supercritical water is a
promising process for the production of sustainable hydrogen. Acetic acid will be a major
component (up to 20 wt%) in many anticipated gasification feed streams (e.g. the aqueous
fraction of pyrolysis oil). Conventional supported (e.g. alumina) catalysts deactivate in
presence of acetic acid rapidly due to coking and metal/support leaching and hence other
catalytic systems must be developed to make this process industrially feasible. Carbon
nanotubes (CNT) are very resistant to deactivation during acetic acid reforming in
supercritical water and are therefore very suitable as catalyst support. Ru is anticipated to
show very high activity for acetic acid reforming and therefore the catalytic performance of
Ru/CNT was studied for acetic acid (1-25 wt%) reforming in sub- (195-340 °C, 225 bar) and
supercritical water (400 °C, 250 bar). Ru/CNT showed remarkable stability and high
reforming activity in low ionic water (supercritical water and low temperature (≤270 °C)
subcritical water). Near complete reforming of a 25 wt% acetic acid solution in supercritical
water (400 °C, 250 bar) was achieved during 7 h time-on-stream at commercially relevant
conditions. Ru oxidation in high ionic medium (subcritical water ≥300 °C) was responsible
for deactivation of the Ru/CNT catalyst and therefore this regime should be avoided for
catalytic reforming. The high stability of Ru/CNT for acetic acid reforming in supercritical
water has paved the way for studying reforming of real biomass derived waste streams under
these conditions.

Chapter 6
92
6.1 Introduction
Catalytic APR of bio/organic aqueous feeds is a promising technique for the production
of “green” hydrogen [1]. The development of efficient catalysts is essential for commercial
exploitation of this process. Acetic acid is a major component (±10 wt%) in many future bio-
gasification feed streams (e.g. aqueous fraction of pyrolysis oil) [2] and is therefore a relevant
model compound. Catalytic APR of acetic acid is very challenging for catalyst stability due to
the reasons discussed in Chapter 5.
In Chapter 5, it was shown that Pt decorated carbon nanotubes (CNT) exhibit stable
catalytic performance for APR of acetic acid in supercritical water. CNT were shown
promising as catalyst support because of (i) its resistance to acetic acid in supercritical water
and (ii) the open structure of the material and lack of meso- and micro-pores suppress
deactivation of the catalyst by coke blockage. However, the acetic acid reforming activity of
Pt was too low to be commercially interesting and must be improved for industrial use. The
study described in this chapter, investigates replacement of Pt with a more catalytically active
metal for acetic acid reforming.
Steam reforming of acetic acid is reported to involve initial formation of acetate (1) or
acyl (2) species on the metal surface by either C-O or O-H bond cleavage [3]. Further C-C
cleavage of the acetate and acyl species is necessary to decompose the molecule to C1 species
and achieve complete gasification. Davda et al. [4] concluded from information available in
the literature that Ru and Ni are very promising metals for C-O, and C-C bond cleavage.
The chemical inertness of CNT makes anchoring of metals on them difficult. Kondo et
al. [5] reported that hybridization of the empty or filled 5d orbitals with the anti-bonding π
orbitals of the CNT can result in strong bonds. From the selected catalyst metals (Ni, Ru) for
acetic acid reforming, Ni is susceptible to leaching in acidic APR conditions. In agreement,
our own studies showed that all Ni was removed from Ni/CNT catalyst under APR conditions
(400 °C, 250 Bar). Ru, a more noble metal, is reported to be more inert under these
conditions. Sutter et al. [6] reported that graphitic layers on Ru show a distinctive lowering of
work function (electron ionisation from the Fermi levels to vacuum) compared to clean Ru or
graphene, indicating electron transfer from the metal to the carbon network. The latter causes
strong bonding between the Ru metal and carbon support. Therefore Ru is promising with
respect to reforming activity and stability and hence Ru decorated CNT (Ru/CNT) catalyst

Chapter 6
93
was studied for acetic acid (HOAc) gasification in sub- and supercritical water. This is
essential for developing catalysts for reforming of aqueous waste streams which contain
carboxylic acids.
6.2 Experimental
6.2.1 Catalyst preparation and characterization
CNT supported Ru catalysts were prepared as described in section 2.2.2. Catalysts
were characterized by XPS, XRF, BET, HR-SEM imaging, and Raman spectroscopy.
Detailed information about the applied analysis techniques is discussed in section 2.3.
6.2.2 Catalytic testing
The experimental reforming setup used for this study is described in section 2.1.
Glacial acetic acid was purchased from Merck (purity of ≥ 99.9%) and was used to prepare
solutions of 1, 5, 15 or 25 wt% acetic acid. The reactor was filled with 0.10 gr of Ru/CNT
catalyst. Respective acetic acid solutions were flown at a rate of 2 mL. min-1 to the reformer.
Weight Hourly Space Velocities (WHSV) were calculated to be 18, 90, 269 and 448 per hour,
respectively. The aqueous flow was first preconditioned to the operating conditions
(subcritical water max. 340 °C and 225 bar, supercritical water 400 °C and 250 bar) before it
entered the reactor. The residence time in the catalytic bed was 12 seconds when the reactor
was operated at 340 °C (225 bar, water density ~700 g/L) and 3 seconds when the reaction
was carried out at 400 °C (250 bar, water density ~150 g/L). The reforming reactions were
run for 7 h and conversion and gas phase selectivity values were determined every 30
minutes.

Chapter 6
94
6.3 Results and discussion
6.3.1 Catalyst preparation and characterization
Figures 6.1 and 6.2 show the HR-SEM images of undecorated CNT and fresh
Ru/CNT, respectively. The openings of the tubes are clearly visible in both images. A Ru
metal loading of 11.1 wt% was found for the freshly prepared Ru/CNT by XRF analysis. The
Ru particles are visible as white spots on the walls of the CNT and the majority of the
particles are in the size range of 3˗5 nm but few larger particle agglomerates up to 40nm were
also observed.
Figure 6.1: HR-SEM image of fresh undecorated CNT
Figure 6.2: HR-SEM image of fresh Ru/CNT
6.3.2 APR of acetic acid over Ru/CNT
Reforming of a 1 wt% acetic acid solution in the absence of a catalyst (blank
experiment) in high temperature subcritical water (340 °C and 225 bar) or supercritical water

Chapter 6
95
(400 °C and 250 bar) showed very low carbon to gas conversions, 2% and 4%, respectively.
The same conversions were obtained when undecorated CNT were used as catalyst, indicating
that CNT do not possess catalytic activity for acetic acid reforming under the studied
conditions. Acetic acid reforming reactions over Ru/CNT were followed for 7 h time-on-
stream and the conversion as function of time is depicted in Figure 6.3. An initial conversion
of ±97 % was obtained for APR of a 25 wt% acetic acid solution in supercritical water (400
°C and 250 bar). The acetic acid reforming activity of Ru/CNT is remarkably high compared
to Pt/CNT. For instance, in Chapter 5 we reported that Pt/CNT (8 wt% Pt, 11nm Pt particles)
showed a conversion of only 60% for supercritical water reforming (450 °C and 250 bar) of 1
wt% acetic acid, while in this work we were able to obtain near complete conversion of 25
wt% acetic acid reforming at a lower temperature of 400 °C (250 bar) and similar WHSV.
Thus choice of Ru allows overcoming the low activity associated with the Pt based catalysts,
one of the key objectives of the work described in this chapter.
Figure 6.3: Acetic acid reforming in low ionic water over Ru/CNT catalyst. Reforming of 1 wt% HOAc solution in low temperature subcritical water (270 °C and 225 bar) and reforming of 25wt% HOAc solution in supercritical water (400 °C and 250 bar).

Chapter 6
96
The reason for the high acetic acid reforming activity of Ru can be inferred from the
(limited) studies on reforming mechanisms in aqueous medium. Hu et al. [7] conducted DFT
calculations on reforming of formic acid (HCOOH) in gas and aqueous phase over different
noble metal surfaces (Pt, Pd, Rh, Au). They showed that the preferred reforming pathway was
dependent on the type of reaction medium. In aqueous phase, the formation of aqueous
CHOO- through de-protonation by water is the first step in reforming. The next step is
adsorption of the ion on the metal surface, followed by dissociation of the C-H bond to form
CO2. In parallel, the protonated water donates a proton to the catalyst metal surface, where it
combines with the hydride subtracted from HCOO- to form H2 [7]. If we assume that the
mechanism for aqueous reforming of acetic acid, which is a similar type of molecule as
formic acid, follows an analogous route as formic acid, we can hypothesize that de-protonated
acetic acid (CH3CHOO-) adsorbs on the catalyst metal surface, followed by C-C bond
breaking to produce CO2 and adsorbed CH3-. The latter can recombine with a proton to form
CH4. This mechanism is basically decarboxylation of acetic acid which is in agreement with
Watanabe et al. [8]. The rate limiting step during aqueous formic acid reforming is reported
[7] to be the recombination of protons and is, dependent of the metal, either limited by proton
diffusion or the actual recombination to form molecular H2. Proton diffusion and H2
formation rates on Pt are reported to be the fastest of all metals [9]. However, it was shown in
this thesis that the acetic acid reforming activity of Ru is much higher than for Pt, implying
that diffusion/recombination of protons is not the rate determining step in acetic acid
reforming.
The rate determining step in acetic acid reforming is therefore different than during
formic acid and must be related to the only mechanistical difference between acetic acid and
formic acid reforming. In case of formic acid, the dissociation of the C-H bond of adsorbed
H-COO is necessary to achieve complete decomposition and is reported to be facile on Pt and
is therefore not rate limiting during formic acid reforming. In case of acetic acid reforming, C-
C bond dissociation is required instead of C-H cleavage to achieve decomposition of the
respective adsorbed ion (CH3-COO). From this, we believe that C-C dissociation is rate
determining in acetic acid reforming. It is reported [4] that Ru has much higher activity for
C-C bond dissociation than Pt and this would explain the observed high APR activity of
Ru/CNT for acetic acid. This high activity shown by Ru/CNT makes it a very promising
option for commercial applications.

Chapter 6
97
6.3.3 Stability of Ru/CNT
Catalyst stability is a major concern for reforming in sub- and supercritical water. The
work described in Chapter 5 shows that Pt/CNT catalyst is stable during supercritical water
reforming of acetic acid. Ru/CNT has the advantage of higher activity and at the same time
also showed stable APR activity for the conversion of acetic acid under supercritical
conditions (400°C, 250 bar, Figure 6.3). However, sub- and supercritical water are considered
different reaction regimes due to the extreme differences in water properties [10, 11]. The
ionic product in supercritical water is much lower (Kw=10-24) than in the supercritical regime.
The high ionic product in high temperature subcritical water (Kw=10-11) is reported to cause
leaching of metals and catalyst stability can be severely affected by this [11]. Carrying out the
reaction under the more challenging conditions allows to see if both Ru and CNT remain
intact in the catalytic system. Furthermore, reactions at lower temperatures (subcritical water)
are favorable for process economics.
First the catalyst was studied for reforming of a 1 wt% acetic acid solution in low
temperature subcritical water (270 °C and 225 bar) for 7 h time-on-stream (Figure 6.3). The
initial conversion was 72% and decreased marginally to 67 % during the first 30 minutes of
the reaction and maintained this conversion for the remainder of the reaction. Under these
conditions the ionic product (Kw) is still not very high (Kw=10-13).
For practical application, higher oxygenate concentrations are appropriate and in order
to get appreciable conversions higher temperatures will be necessary in order to be able to
work under industrially relevant residence times (<1 min). However, as the temperatures
approach supercritical water conditions the ionic product increases drastically with a
maximum around 350 °C (Kw=10-11). The good stability of Ru/CNT catalysts in low
temperature subcritical water allowed for studying reforming at higher temperatures (still
subcritical) to achieve higher activity. Results of such tests are shown in Figure 6.4.
The catalytic reforming of 5 wt% acetic acid (300 °C and 225 bar) showed an initial
conversion of 57% but this decreased to 28% after 7 h time-on-stream. The catalyst
deactivated and lost more than 50% of its activity. The catalyst was also tested for the
reforming of 15 wt% acetic acid in subcritical water at a still higher temperature (340 °C and
225 bar) and the result is shown in Figure 6.4. Almost complete conversion is observed at the
beginning of the reaction but decreased to 65% within 4 h time-on-stream.

Chapter 6
98
Figure 6.4: Acetic acid reforming in high ionic water over Ru/CNT catalyst. Reforming of 5 wt% HOAc solution in low temperature subcritical water (300 °C and 225 bar) and reforming of 15wt% HOAc solution in supercritical water (340 °C and 225 bar).
Figure 6.5: Stability of acetic acid reforming (1, 15 and 25 wt%) at different temperatures under 225 bar. The ionic product of water (Kw) under the respective conditions is mentioned in the figure. Activity of the catalyst is normalized with respect to the initial activity.

Chapter 6
99
Deactivation of the Ru/CNT catalyst was observed only during acetic acid (HOAc)
reforming in high temperature subcritical water (5wt% HOAc at 300 °C, and 15 wt% HOAc
at 340 °C) as summarized in Figure 6.5. This is probably related to the high ion product under
those conditions. In general, catalyst deactivation can be related to changes in the support
(morphological) and/or active metal (e.g. leaching, loss of surface area by sintering or coke
deposition, or changes in oxidation state). A detailed analysis of changes in CNT and Ru was
taken up and the reasons for deactivation discussed below.
Morphological/structural changes: The obtained BET results of the fresh and used catalysts
are shown in Table 6.1. Freshly prepared Ru/CNT showed a comparable surface area as
undecorated CNT. Also the used Ru/CNT catalysts showed comparable surface areas as the
fresh catalyst, indicating that the surface morphology of CNT was not affected significantly
by the reaction environment.
Table 6.1: Surface area of fresh and used Ru/CNT.
Conditions of Ru/CNT catalyst BET surface area (m2/g)
Fresh 46.4
Subcritical water reforming (225 bar)
1 wt% HOAc reforming (270 °C) 40.1
5 wt% HOAc reforming (300 °C) 39.1
15 wt% HOAc reforming (340 °C) 42.3
Supercritical water reforming (250 bar)
25 wt% HOAc reforming (400 °C) 41.1
HR-SEM images of the fresh and used Ru/CNT catalysts (Figures 6.6-9) were taken to
study the effect of the reaction environment on the morphology of the CNT in more detail.
The SEM images of the used catalysts do not show any signs of damage to the CNT walls.
The openings of the CNT are clearly visible and did not collapse during the reaction and no
pitting on the surface of the CNT is observed.

Chapter 6
100
Figure 6.6: HR-SEM image of used Ru/CNT (1 wt% HOAc, 270 °C and 225 bar).
Figure 6.7: HR-SEM image of used Ru/CNT ( 5 wt% HOAc, 300 °C and 225 bar).
Figure 6.8: HR-SEM image of used Ru/CNT (15 wt% HOAc, 340 °C and 225 bar).
Figure 6.9: HR-SEM image of used Ru/CNT (25 wt% HOAc, 400 °C and 250 bar).

Chapter 6
101
Raman spectroscopy is commonly used to study crystallinity of carbon nano-materials
(either fibers or tubes). Raman spectra of the fresh and used CNT are shown in Figure 6.10.
No bands were visible below 1000 cm-1 and above 3500 cm-1 and therefore spectra are only
shown in the frequency range of 1000-3500 cm-1. All spectra were normalized to enable a
better visual comparison of the peak intensities. Normalization was done based on the most
intense band frequency (1556 cm-1) of the fresh Ru/CNT. In the spectra Raman bands
observed at 1556 cm-1 (G band) and 1340 cm-1 (D band) are attributed to defect free and
defect induced sp2 hybridized carbon system, respectively [12]. Intensity ratio of the D, G
bands (ID/IG) is typically used to assess changes in the crystallinity of graphitic carbon
materials. G’ band in the spectra (2680 cm-1) is an overtone of D-band [12]. There are four
other overtones (2LO, 2G, T+D, D’) which are weak and are also not particularly critical for
estimating crystallinity of the CNTs and thus are not discussed in detail.
.
Figure 6.10: Raman spectra of the CNT based catalysts used for acetic acid reforming.

Chapter 6
102
The values of ID/IG were determined for the fresh and used CNT based catalysts and
are tabulated in Table 6.2. The D/G band intensity ratio is 0.87 for fresh undecorated CNT
and a similar number was obtained after decorating the CNT with Ru, indicating that the
impregnation method did not induce defects in the CNT structure. The used Ru/CNT catalysts
have similar D/G ratios compared to fresh Ru/CNT, showing that exposure of Ru/CNT to
acetic acid in sub- or supercritical water did not cause a significant increase in defects in the
CNT structure.
Table 6.2: Disorder in the carbon system (Raman spectr. ratio Id/Ig) and crystallinity (XRD FWHM CNT(002)) of fresh and used Ru/CNT catalysts.
The effect of the reaction on the crystallinity of the CNT was further investigated by
X-Ray diffraction (XRD). Figure 6.11 shows the XRD patterns in the 2Θ range of 10-90° for
the catalysts. The fresh CNT showed a strong diffraction line at 25° which corresponds to the
graphene (002) plane [13, 14]. Further, the strong diffraction line of the CNT (100) plane was
observed at 44° in addition to weaker bands above 50°. It can be seen from Figure 6.11 that
XRD patterns for the fresh and used CNT based catalysts are similar.
The diffraction line corresponding to the (002) plane originates from the hexagonal sp2
hybridized carbon network which is considered the building block of CNT [15]. This line is
used to study changes in the crystallinity of the CNT by comparing Full-With at Half
Maximum (FWHM). A change in FWHM is indicative of structural changes in the grain size
and hence a change in crystallinity (line broadening corresponds to loss in crystallinity). The
FWHM values of the fresh and used CNT based catalysts are shown in Table 6.2. Similar
FWHM values were found for the fresh and used catalysts, indicating that the crystallinity of
Catalyst ID/IG FWHM CNT(002)
Fresh CNT 0.87 1.13 Fresh Ru/CNT 0.89 1.15
Ru/CNT in subcritical water reforming (225 bar)
1wt% HOAc, 270 °C 0.88 1.14
5wt% HOAc, 300 °C 0.89 1.14
15wt% HOAc, 340 °C 0.85 1.16
Ru/CNT in supercritical water reforming (250 bar)
25wt% HOAc, 400 °C 0.86 1.14

Chapter 6
103
the CNT support was not affected by exposure to hot compressed, acidic (acetic acid) water.
The results discussed so far show that CNT is a very stable catalyst support material for the
full range of studied reaction conditions. This shows the versatility of the material for
application in corrosive and aggressive reaction media.
Figure 6.11: XRD patterns of the CNT based catalysts used for acetic acid reforming for 2Θ in the 10-90° range.
Ruthenium leaching: Under the conditions employed in APR, metal leaching can be a
common cause for catalyst deactivation. Ru content of the used catalysts was determined by
XRF analysis and the results are shown in Table 6.3. It can be seen that the Ru loadings of the
used Ru/CNT catalysts were up to 20% lower compared to the fresh catalyst, including the
cases where the catalyst performance was stable. These results suggest that Ru leaching took
place at the very beginning of the reaction and did not influence catalytic activity.
Typically, Ru loss became more pronounced for the subcritical water experiments at
higher temperatures (300 °C, 225 bar). The catalyst deactivation in this case (± 50 % loss in
activity during acetic acid reforming, Figure 6.4) cannot be explained fully by the ~10% Ru
loss if it is assumed that catalyst activity is proportional to the Ru content. Note that Ru

Chapter 6
104
particle size did not change (Figures 6.2 and 6.7, Table 6.3) during the reaction as discussed
in the next section. Furthermore, a 20% Ru loss was observed for the acetic acid reforming
experiment in supercritical water, while stable catalytic performances were observed. It is
believed that weakly bonded Ru is removed during the startup of the reaction and that the
remaining strongly bound Ru is not affected during the reaction itself. Although the initial Ru
loss is not seen in the catalytic performance during acetic acid reforming, it probably
decreased the starting catalytic activity. Initial Ru leaching can be suppressed by enhancing
the anchoring. Functionalization of the CNT support prior Ru impregnation is reported to play
an important role in stronger Ru/CNT bonds [16].
Table 6.3: Ru loading of fresh and used Ru/CNT.
Conditions of Ru/CNT catalyst Ru loading by XRF
(wt%)
Ru particle size (nm)
Fresh 11.1 1.8
Subcritical water reforming (225 bar)
1 wt% HOAc reforming (270 °C) 10.5 1.9
5 wt% HOAc reforming (300 °C) 10.3 1.8
15 wt% HOAc reforming (340 °C) 9.2 1.8
Supercritical water reforming (250 bar)
25 wt% HOAc reforming (400 °C) 9.3 1.9
Ruthenium sintering: TEM images (Figures 6.2, 6.6-9) showed the stability of the Ru
particles during APR. Ru particles ranged from 3-5 nm for fresh catalysts and after use. In the
XRD patterns of the catalysts, Ru(100) line at 2Θ=38° [17] was clearly observed (Figure
6.11). Ru particle size calculated based on Scherrer equation (FWHM) showed no appreciable
growth of particle size after use. The analysis gave an average Ru particle size of ± 2 nm in all
cases, indicating at least that appreciable Ru particle growth did not occur during the reaction
in hot compressed, acidic water. Catalyst deactivation by loss of Ru surface area is excluded
because sintering/agglomeration of Ru particles was not observed.
Coke formation: Further, coke formation is another problem that is often reported to be the
cause of catalyst deactivation, especially during acetic acid steam reforming [18, 19]. The
changes in the ratio of Raman spectral bands intensities (ID/IG) has been used to follow
aromatization (graphitization) when heating poorly organized carbon [20]. Extending this
argument, deposition of crystalline or amorphous coke on CNT should change the (ID/IG) ratio

Chapter 6
105
of fresh CNT catalyst. No difference in (ID/IG) was observed for the deactivated catalyst and
therefore coke did not contribute to the deactivation of the studied catalysts. This is not
surprising as the high solvability of non-polar compounds (e.g. coke) in sub- and especially
supercritical water helps in keeping the catalyst surface clean of coke and therefore plays an
important role in preventing catalyst deactivation by coking [10, 21].
Deactivation analysis: Reasons for deactivation of Ru/CNT catalyst just below supercritical
condition (300-340 °C, 225 bar) needs further attention. In this context, XPS analysis results
are shown in Table 6.4. Undecorated CNT have an atomic carbon concentration of ± 99%
with oxygen being the remaining 1%. The oxygen is most likely related to oxygenate
functional groups on the CNT surface. A small increase in oxygen concentration was
observed for freshly prepared Ru/CNT in comparison to undecorated CNT. The oxygen
concentration on the surface of the catalysts used for reforming is subcritical water increased
significantly compared to fresh Ru/CNT. The catalysts used for supercritical water reforming
of 25 wt% acetic acid showed a very low oxygen concentration. A maximum oxygen
concentration was found for the experiment conducted at 300 °C with 5 wt% acetic acid. To
recall, this is the case where the Ru/CNT showed pronounced deactivation.
The Ru 3d5/2 peak position in the XPS spectra of fresh and used Ru/CNT catalysts
were studied in more detail to determine the oxidation state of Ru. All catalysts showed the
presence of Ru0 (280.5 eV) and Ru4+ (281.3 eV). No other Ru oxidation states were observed.
The ratio between metallic Ru and Ru4+ (Ru0/Ru4+) was calculated and the values are shown
in Table 6.4. It can be seen that the relative amount of metallic Ru decreased for the
experiments where the catalyst showed deactivation (300-340 °C, 225 bar) and indicates an
increase in oxidized Ru species under those conditions. The experiment conducted in
supercritical water (catalyst stable) showed that the oxidation state of Ru on the used Ru/CNT
catalyst was more towards the metallic state.

Chapter 6
106
Table 6.4: XPS results of fresh and used Ru/CNT catalysts, showing the atomic surface concentrations (C, O) and oxidation level of Ru.
Atomic concentration (%)
C O Ru0/Ru4+
Fresh CNT 98.95 ±0.14 1.05 ±0.14 - Fresh Ru/CNT 96.01 ±0.59 3.24 ±0.46 4.0
Ru/CNT in subcritical water reforming (225 bar)
1 wt% HOAc, 270 °C 92.96 ±1.75 6.23 ±1.79 4.5
5 wt% HOAc, 300 °C 89.64 ±1.29 9.73 ±1.40 3.7
15 wt% HOAc, 340 °C 93.50 ±1.04 5.83 ±0.98 3.3
Ru/CNT in supercritical water reforming (250 bar)
25 wt% HOAc, 400 °C 96.71 ±0.18 2.87 ±0.16 4.3
Assmann et al. reported that catalytically active Ru particles consist of a metallic Ru0
core which is surrounded by a thin shell of RuO2 [22]. Deactivation of Ru catalysts is
frequently reported under strong oxidizing reaction conditions [23, 24] and is reported to be
caused by Ru over-oxidation [24, 25]. Reduction of the deactivated Ru catalyst was conducted
to attempt reactivation of the catalyst. The deactivated catalyst was taken out of the reactor
and reduced in H2 (400 °C) and tested again for the reforming of 5% acetic acid. It was found
that most of the activity was regained after the reduction treatment (Figure 6.12). This result
supports the conclusion that deactivation of Ru/CNT was caused by Ru over-oxidation.
It is not surprising that the Ru/CNT catalyst is more stable in supercritical water than
in high temperature subcritical water. The high ion product in high temperature subcritical
water causes Ru oxidation of the catalyst by the water. Supercritical water is a milder
environment for catalysts due to the lower ion product and also higher coke solubility
properties [10, 11]. The low ion product of supercritical water plays a very important role in
preventing Ru oxidation of the Ru/CNT catalyst during reforming of very high concentrated
acetic acid solutions.
Ru/CNT catalyst showed stable and active catalytic performance for acetic acid
reforming in supercritical water and low temperature (≤270 °C) subcritical water. In the next
section, catalyst performance of Ru/CNT was studied in more detail for the reforming of
acetic acid under those stable regimes.
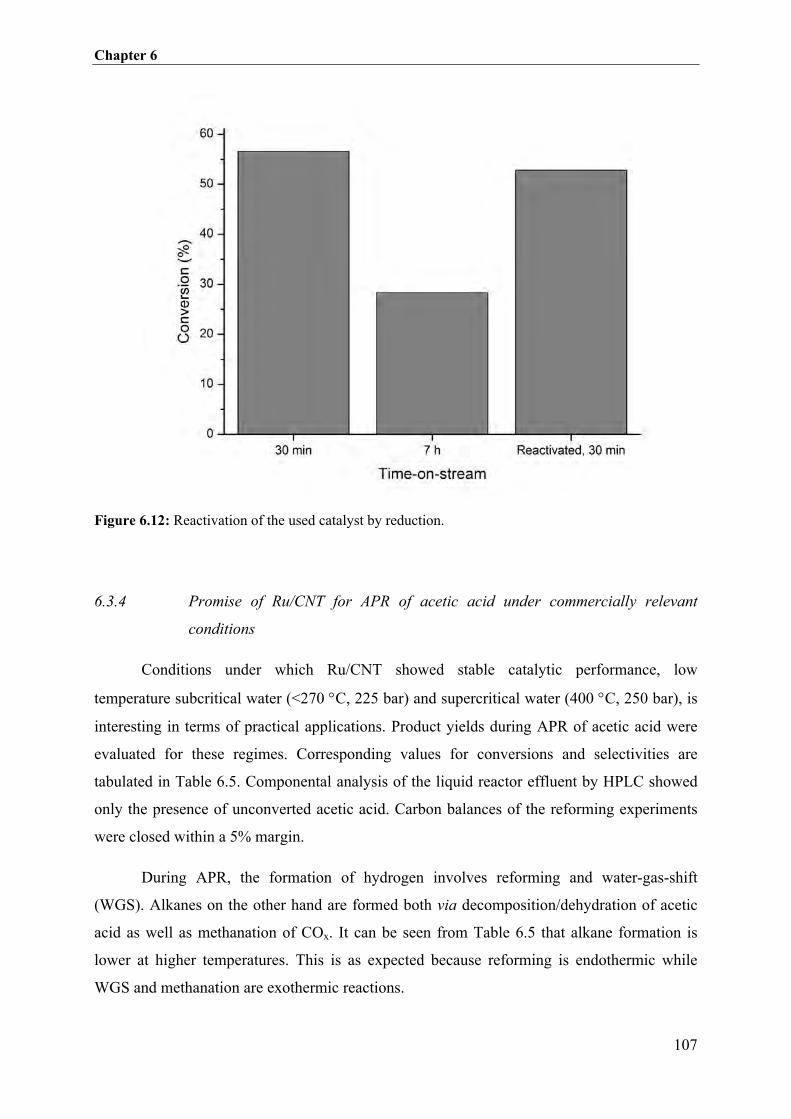
Chapter 6
107
Figure 6.12: Reactivation of the used catalyst by reduction.
6.3.4 Promise of Ru/CNT for APR of acetic acid under commercially relevant
conditions
Conditions under which Ru/CNT showed stable catalytic performance, low
temperature subcritical water (<270 °C, 225 bar) and supercritical water (400 °C, 250 bar), is
interesting in terms of practical applications. Product yields during APR of acetic acid were
evaluated for these regimes. Corresponding values for conversions and selectivities are
tabulated in Table 6.5. Componental analysis of the liquid reactor effluent by HPLC showed
only the presence of unconverted acetic acid. Carbon balances of the reforming experiments
were closed within a 5% margin.
During APR, the formation of hydrogen involves reforming and water-gas-shift
(WGS). Alkanes on the other hand are formed both via decomposition/dehydration of acetic
acid as well as methanation of COx. It can be seen from Table 6.5 that alkane formation is
lower at higher temperatures. This is as expected because reforming is endothermic while
WGS and methanation are exothermic reactions.

Chapter 6
108
Table 6.5: Results for the reforming of 1 and 25 wt% acetic acid over Ru/CNT in low temperature subcritical water (195-270 °C, 225 bar) and supercritical water (400 °C, 250 bar), respectively.
Temperature /
Pressure
(°°°°C / bar)
Gasification
Conversion (wt %)
Selectivity (%)
H2 CO2 CH4 C2+
195 / 225 3.0 10.9 22.7 77.2 0.1 210 / 225 8.1 5.1 31.9 67.9 0.2 225 / 225 19.1 4.7 38.5 61.3 0.2 240 / 225 33.8 4.8 42.9 56.9 0.2 255 / 225 49.4 5.4 48.4 51.4 0.2 270 / 225 67.5 6.8 48.9 50.9 0.2 400 / 250● 95.4 18.9 62.3 35.8 1.9
● Reforming was performed on 25 wt% acetic acid solution. All other experiments were conducted with 1wt% acetic acid solution.
N.B. Carbon balances of the reforming experiments were complete within a margin of 5%.
Watanabe et al. [8] reported that acetic acid reforming in water involves a
decarboxylation mechanism in which the alkyl species (CHx) formed undergoes subsequent
reforming / WGS to give hydrogen. From decarboxylation stoichiometry, a CH4:CO2 ratio of
1:1 is expected from acetic acid when other reactions are excluded. The formation of higher
amounts of methane during reforming indicate that methanation of COx occurred (Table 6.5).
An increase in CO2 formation at the expense of CH4 was observed with increasing
temperatures. The selectivities towards CO2 and CH4 stabilized around the stoichiometric
value expected (50%), indicating that the endothermic reforming became more dominant at
higher temperatures.
Figure 6.13 shows the Arrhenius plot which is based on the 1 wt% reforming
experiments shown in Table 6.5. Two separate trend lines could be drawn through the data
points, indicating separate kinetic regimes. The slope of the linear fit of the data points in the
range 240-270 °C is 0.5 times the slope of the fit of the low temperature (195-225 °C) data
points. This value is characteristic for catalytic reactions that are affected by internal diffusion
limitations. However, the used catalyst CNT support has an open structure and does not have
micro or mesopores and therefore internal mass transfer limitations cannot be relevant for this
type of support. The observed change is due to a change in kinetics/reactions during the
reforming of acetic acid.

Chapter 6
109
Figure 6.13: Arrhenius plot of catalytic reforming of 1 wt% acetic acid over Ru/CNT catalyst in the temperature range of 195-270 °C and under 225 bar pressure.
An activation energy of 108 KJ mol-1 is calculated for the temperature region of 195 –
225 °C. At the lower temperatures, methane formation was also dominant as seen from
selectivities (Table 6.5). Reported activation energies in the range of 94 – 224KJ mol-1 for
CO2 methanation on Ru-based catalysts shows a large spread [26].
A lower activation energy of 53 KJ mol-1 was found for the reforming at higher
temperatures. A lower range of activation energies of 55 – 171 KJ mol-1 were reported for
acetic acid reforming [27] over Ru based catalysts. At the higher temperatures, selectivities
approached the expected stoichiometric values of CH4 and CO2 for acetic acid reforming by
decarboxylation. This shows that methanation of CO2 species was suppressed at higher
temperatures and that acetic acid reforming through decarboxylation was dominant. We
suggest that preferences for certain reaction pathways (methanation vs reforming) are
temperature dependent and the reason for different activation energies at different
temperatures.

Chapter 6
110
A CO2 and CH4 selectivity of 62 and 36 % was found for supercritical water reforming
of 25 wt% acetic acid, respectively. The supercritical water reforming of the high
concentrated 25 wt% acetic acid showed a much higher H2 and CO2 selectivity compared to
the stoichiometric expectance while the CH4 selectivity was remarkably lower (Table 6.5).
These results indicate that methane reforming to produce H2 and CO2 took place and is in line
with the aforementioned kinetic observations. Based on the acetic acid reforming
stoichiometry (50%) and taking into account the production of C2+ (1.9%), it was calculated
that 12.3% of methane was converted to other carbon containing molecules. Complete
methane reforming (incl. water gas shift) involves the production of one CO2 molecule per
molecule of CH4 (CH4 + 2H2O � CO2 + 4 H2). The observed decrease in methane is
proportional to the increase in CO2 and therefore it is possible that methane reforming was a
parallel reaction during the supercritical water reforming of acetic acid over Ru/CNT catalyst.
Table 6.6: Comparison of catalytic performance of Pt- and Ru decorated CNT for acetic acid reforming in supercritical water.
Conversion
(%)
Selectivity (%)
H2 CO2 CO CH4 C2+
Pt/CNT[Chapter 5]
1wt% HOAc, 450 °C and 250 bar ± 58% 18 54 0 42 4
Ru/CNT 25wt% HOAc, 400 °C and 250 bar
± 95% 19 62 0 36 2
The catalytic performance of Pt/CNT for reforming of 1wt% acetic acid in
supercritical water (450 °C, 250 bar) was studied in Chapter 5. These results are compared
with the performance of Ru/CNT here (Table 6.6). As discussed earlier, the conversion
obtained with Ru/CNT is much higher compared to Pt/CNT, while the reaction temperature is
50 °C lower. Alkane selectivities were similar / even marginally lower for a much higher
acetic acid concentration (1 vs 25 wt%) and at a lower temperature. These observations are
remarkable because (i) alkane formation is reported to increase with feed concentrations
(Chapter 3 and [28]) and (ii) lower temperatures usually favor methanation. The final aim is
to obtain high yields of H2 but the decarboxylation mechanism of acetic acid reforming,
produces alkanes inherently. An integrated or separate methane reforming step is necessary to
upgrade hydrogen yields. The Ru/CNT catalyst shows significant methane reforming activity

Chapter 6
111
as described earlier and forms a promising basis for further optimization of the hydrogen
yields.
6.4 Conclusions
Catalytic Aqueous Phase Reforming (APR) is an attractive process for reforming of
industrially relevant aqueous feeds (up to 20 wt% organics), which typically contain large
amounts of acetic acid. In this work, Ru/CNT catalyst was studied for APR of acetic acid and
showed promising results. The high ion product of subcritical water in the temperature range
300-340 °C was found to be responsible for deactivation of the Ru/CNT catalyst by over-
oxidation of Ru. Deactivation of the catalyst was prevented by performing the reaction in low
ionic supercritical water. Stable catalytic properties of Ru/CNT were observed for reforming
of acetic acid in supercritical water (400 °C and 250 bar). Under those conditions, Ru/CNT
showed very high reaction rates that enabled the conversion of high concentration acetic acid
solutions at commercially relevant residence times. The catalytic properties of Ru/CNT are
very promising for supercritical water reforming of industrial feeds, such as the aqueous
phase of flash pyrolysis oil.
References
[1] R.D. Cortright, R.R. Davda, J.A. Dumesic, Nature 418 (2002) 964-967.
[2] K. Sipila, E. Kuoppala, L. Fagernas, A. Oasmaa, Biomass Bioenerg. 14 (1998) 103-
113.
[3] K.I. Gursahani, R. Alcala, R.D. Cortright, J.A. Dumesic, Appl. Catal. A 222 (2001)
369-392.
[4] R.R. Davda, J.W. Shabaker, G. W. Huber, R. D. Cortright, J. A. Dumesic, Appl. Catal.
B 43 (2003) 13-26.
[5] T. Kondo, Y. Iwasaki, Y. Honma, Y. Takagi, S. Okada, J. Nakamura, Phys. Rev. B 80
(2009) 233408.
[6] P.W. Sutter, J.I. Flege, E.A. Sutter, Nature 7 (2008) 1485-1492.

Chapter 6
112
[7] C. Hu, S-W. Ting, K-Y. Chan, W. Huang, Int. J. Hydrog. (2012) In Press, DOI:
1016/j.ijhydene.2012.08.035
[8] M. Watanabe, H. Inomata, R.L. Smith jr., K. Arai, Appl. Catal. A 219 (2001) 149-156.
[9] L. Kristinsdottir, E. Skulason, Surf. Sci. 606 (2012) 1400-1404.
[10] J. Kritzer, E. Dinjus, Chem. Eng. J. 83 (2001) 207-214.
[11] J. Kritzer, J. Supercrit. Fluid. 29 (2004) 1-29.
[12] M.S. Dresselhaus, G. Dresselhaus, R. Saito, A. Jorio, Phys. Rep. 409 (2005) 47-99.
[13] S. Collins, R. Brydson, B. Rand, Carbon 40 (2002) 1089-1100.
[14] K. Ishimaru, T. Hata, P. Bronsveld, T. Nishizawa, Y. Imamura, J. Wood. Sci. 53
(2007) 442-448.
[15] A. Aqel. K.M.M.A. El-Nour, R.A.A. Ammar, A. Al-Warthan, Arab. J. Chem. 5 (2012)
1-23.
[16] P. Serp, M. Corrias, P. Kalck, Appl. Catal. A 253 (2003) 337-358.
[17] T.K. Lin, S.J. Chang, B.R. Huang, K.T. Lam, Y.S. Sun, M. Fujita, Y. Horikoshi, J.
Electrochem. Soc. 153 (2006) G677-G680.
[18] K. Takanabe, K. Aika, K. Seshan, L. Lefferts, Chem. Eng. J. 120 (2006) 133-137.
[19] D. Wang, D. Montane, E. Chornet, Appl. Catal. A 143 (1996) 245-270.
[20] D. Espinat, H. Dexpert, E. Freund, G. Martino, M. Couzi, P. Lespase, F. Cruege, Appl.
Catal. 16 (1985)
[21] J.B. Muller, F. Vogel, J. Supercrit. Fluid. 70 (2012) 126-136.
[22] J. Assmann, D. Crihan, M. Knapp, E. Lundgren, E. Loffler, M. Muhler, V. Narkhede,
H. Over, M. Schmid, A.P. Seitsonen, P. VArga, Angew. Chem. Int. Ed. 44 (2005)
917-916.
[23] N.W. Cant, P.C. Hicks, B.S. Lennon, J. Catal. 54 (1978) 372-383.
[24] K. Villani, C.E.A. Kirschhock, D. Liang, G. van Tendeloo, J.A. Martens, Angew.
Chem. Int. Ed. 45 (2006) 3106-3109.
[25] J. Assman, V. Narkhede, N.A. Breuer, M. Muhler, A.P. Seitsonen, M. Knapp, D.
Crihan, A. Farkas, G. Mellau, H. Over, J. Phys. Condens. Matter 20 (2008) 184017.
[26] P. Panagiotopoulou, D.I. Kondarides, X.E. Verykios, Appl. Catal. B 88 (2009) 470-
478.
[27] A.C. Basagiannis, X.E. Verykios, Int. J. Hydrogen Energ. 32 (2007) 3343-3355.
[28] R.R. Davda, J.A. Dumesic, Angew. Chem. Int. Edit. 42 (2003) 4068-4071.

113
Chapter 7
APR of real aqueous phase of flash pyrolysis oil over
Ru/CNT catalyst
In this chapter, supercritical water reforming (400 °C and 250 bar) of a diluted
feed stream of the aqueous phase of flash pyrolysis oil is studied over Ru/CNT
catalyst. It was found that the reaction conditions caused significant coke/char
formation in the preheater. Formation of such carbonaceous material was likely
catalyzed by the high ionic product of the subcritical water regime in the
preheater. Highly diluted feeds were necessary to prevent blockage of the
preheater by coke, but coke formation was still significant under these conditions
and prevented the assessment of the Ru/CNT catalyst. Coke formation is a non-
catalytic challenge and should first be solved before this process can be studied
further.

Chapter 7
114
7.1 Introduction
Catalytic APR of the aqueous phase of flash pyrolysis oil is an interesting route for the
production of renewable hydrogen [1]. A major concern for the feasibility of this process is
the availability of stable catalysts with commercially relevant activities [2]. Performing the
APR reaction in supercritical water is necessary to achieve commercially relevant reaction
rates (Chapter 3 and 6) by providing the necessary thermal energy and allowing fast mass
transfer rates [2]. Furthermore, the stability of catalysts benefits from the low ionic product
(Chapter 6) and the coke solvability properties of supercritical water.
Conventional metal oxide catalyst supports are studied frequently for APR because
they enable high reforming rates by providing hydroxyl groups which are required for the bi-
functional reforming mechanism. For instance, it was shown in this thesis that reforming rates
for ethylene glycol were much higher for Pt supported on Al2O3 (Chapter 3) compared to
carbon (Chapter 5). Alumina is considered one of the most stable metal oxide catalyst
supports but Al2O3-supported APR catalysts were found to deactivate in presence of acetic
acid (Chapter 4). Many commercially interesting feeds contain large amounts of acetic acid.
For instance, acetic acid is a major component of pyrolysis oil with concentration above 10
wt% [3, 4]. Therefore conventional alumina supported catalysts are not suitable for APR of
such feeds. High surface area carbon is a more stable catalyst support in the presence of acetic
acid. However, the micro- and mesoporous structure of this type of carbon support is very
susceptible to deactivation by pore blockage by coke [5]. Coke formation during acetic acid
reforming is reported frequently [6, 7] and therefore this type of support is also not suitable
for reforming of the aqueous phase of pyrolysis oil.
It was demonstrated in Chapter 5 and 6 that carbon nanotubes (CNT) are very stable in
supercritical water, even in the presence of high concentrations of acetic acid. Furthermore,
the open structure of CNT helps to (i) prevent catalyst deactivation by coke pore blockage and
(ii) enables high mass transfer rates. CNT supported Ni, Pt and Ru catalysts were studied for
APR of acetic acid (Chapter 5 and 6) in supercritical water. It was found that only Pt and Ru
decorated CNT were stable for this reaction. Pt showed a lower activity towards acetic acid
reforming (Chapter 5). However, Ru/CNT catalyst showed commercially interesting acetic
acid reforming rates (Chapter 6). The properties of the developed Ru/CNT catalyst paved the
way for APR of commercially applicable bio/organic feeds. APR of the aqueous phase of

Chapter 7
115
flash pyrolysis oil was studied in supercritical water over Ru/CNT catalyst and the results are
described in this chapter.
7.2 Experimental
7.2.1 Catalyst preparation and characterization
CNT supported Ru catalysts were prepared according section 2.2.2. The Ru/CNT
catalyst used for the study in this Chapter was taken from the same batch as used in Chapter 6.
Therefore, catalyst characterization details (XRF, BET, SEM imaging, XRD, XPS and Raman
spectroscopy) can be seen in chapter 6. Further details regarding catalyst characterization are
discussed in section 2.3, Chapter 2.
7.2.2 Supercritical water reformer
The experimental setup and applied definitions are described in detail in Chapter 2. A
2mL. min-1 flow of the respective feed was first preconditioned to operating conditions (400
ºC and 250 bar) before it entered the reactor in which 0.1 gr of Ru/CNT catalyst was placed.
7.2.3 Fractionating flash pyrolysis oil
Pyrolysis oil was obtained from the TCCB group (University of Twente, The
Netherlands) and was produced by VTT Technical Research Centre of Finland. Figure 7.1
shows the fractionation process of the pyrolysis oil. The pyrolysis oil was extracted with
water (volume ratio water:oil = 10 : 1) to remove the water soluble fraction of the oil. The
obtained water fraction is referred to as aqueous phase. The aqueous phase was filtered until a
clear liquid was obtained. Brown particles were formed in the following days (probably by
agglomeration of very small particles that were not removed during filtration) and therefore
the liquid was again filtered after two weeks. The liquid phase stayed clear after this second
filtration but as a precaution was filtered again before it was used for the reforming reaction.
The carbon content of the water phase was determined by TOC analysis just before the

Chapter 7
116
reforming experiment and was found to be 26.0 g / L. The pH of the aqueous solution was
2.8, indicating the presence of large amounts of carboxylic acids.
Figure 7.1: Fractionating of pyrolysis oil in aqueous and organic phase.
The organic phase was very sticky and had a very high viscosity. Acetone was used to
dilute the organic phase to decrease the viscosity to enable handling of the material for further
characterization. The energy content of the pyrolysis product (incl. the aqueous phase) was
determined by bomb calorimetry to be 18 MJ. Kg-1. After fractionation, the energy content of
the organic phase showed to be 28 MJ. Kg-1 (this value is minus the acetone dilution). The
energy value of the organic phase is still much lower than crude oil and shows the need for
aqueous fraction in H2O
(1:10) unfiltered
aqueous fraction in H2O
(1:10) filtered
pyrolysis product
(16 MJ/Kg)
oil fraction in
acetone (1:10)
oil fraction in acetone
(2:1)
(28 MJ/Kg)
phase
separation

Chapter 7
117
further upgrading, for instance by hydrogenation. Hydro-deoxygenation, where the oxygen
content of the oil is reduced by hydrotreating, helps to improve the qualities of the organic
phase, viz., (i) decrease acidity by removing acidic components, (ii) improve stability by
minimizing aldehydes and ketones, which have the tendency to polymerize during storage,
and (iii) improve hydrogen content (H/C ratio) of the organic phase and improve its energy
content. This is the background purpose of the current study where it is attempted to generate
hydrogen required for the hydrotreating from the aqueous waste, via aqueous phase
reforming.
7.3 Results and discussion
Supercritical water reforming (400 ºC and 250 bar) of the aqueous phase (water:oil=10
: 1) was first studied in the absence of a catalyst. But the experiment had to be stopped after 1
h due to a large pressure drop between the pump and the inlet of the reactor. Inspection of the
setup showed that the preheater was blocked by coke. Coke was also observed on the walls of
the reactor but was much less than the amounts present in the preheater. The compounds in
the aqueous phase of pyrolysis oil were highly functionalized [8] and it is believed that the
conditions in the preheater propagated polymerization reactions leading to coke formation.
Gas phase analysis showed the formation of large amounts of COx (70% CO2 and 10% CO in
gas product), indicating that coke formation involved decarboxylation and/or decarbonylation
[9, 10].
Carbonaceous material can be formed (i) thermally, or (ii) catalytically by the metal of
the preheater wall, or (iii) catalytically by the high ion product of the subcritical water in the
preheater. The fact that coke was formed in the largest quantity in the preheater indicates that
the first two reasons can be excluded and that coke formation was likely initiated by the
(subcritical) water properties in the preheater. The preheater brings the feed to supercritical
water conditions (> 374 °C and 221 bar) and has to go through the subcritical regime to reach
the supercritical state. The ionic product of subcritical water increases with temperature and
reaches a maximum of Kw=10-11 around 300-350 °C [11]. The high ionic product of
subcritical water is reported to catalyze many reactions, including acid/base catalyzed
decarboxylation [12, 13] and coupling/polymerization reactions [13], and might be the reason
for the high amounts of coke formed in the preheater. Supercritical water has a low ionic

Chapter 7
118
product (Kw=10-24) and is a good solvent for non-polar compounds such as coke [11].
Therefore, coke formation in parts of the setup that operate under supercritical water
conditions is expected to be lower and this is in agreement with the experimental
observations. Coke formation was not observed during reforming of ethylene glycol and
acetic acid (Chapter 3 ˗ 6), indicating that other molecules in the aqueous phase are likely
more susceptible to form coke.
The aqueous phase was diluted even more (water:oil=30 : 1) to suppress the formation
of coke to prevent coke blockage of the preheater. This feed was again used for reforming in
supercritical water (400 ºC and 250 bar). A blank experiment (without catalyst) was first
conducted to study coke formation and gasification activities. No significant pressure drop
was observed during 6 h reaction time. The results of the blank reforming experiment are
shown in Table 7.1. The gas formed was again very high in COx (Table 7.1). Analysis of the
reactor effluent showed that 49% of the carbon in the feed remained in the liquid phase after
the reforming reaction. Carbon in gas phase accounted for 11% of removed carbon from the
feed, resulting in a carbon balance closure of only 60%. The missing 40% of carbon was
transformed to coke. Inspection of the setup after the reaction revealed that coke deposition
took place during the experiment on the walls of the preheater and the reactor. However, the
quantity of coke was not near enough to cause blockage. Not all coke formed accumulated in
the setup. The liquid reactor effluent showed the presence of many black particles which sank
to the bottom of the glass vessel. These particles were likely coke that was dissolved initially
in the supercritical water and came out of the solution when the conditions were relieved.
Table 7.1: Reforming of aqueous phase of bio oil (water:oil=30) at 400 °C and 250 bar over Ru-CNT catalyst.
Reaction Carbon removed from
liquid (%)
Selectivity gas phase (%)
H2 CH4 C2+ CO2 CO
Blank 51% (11% gas, 40% coke)
12.7 8.5 0.9 67.5 23.1
Ru-CNT 30 min
54% (28% gas, 26% coke)
5.4 9.7 0.7 69.8 19.8
Ru-CNT 6 hr
50% (26% gas, 25% coke)
5.6 11.1 0.7 67.8 20.5

Chapter 7
119
Catalytic reforming over Ru/CNT catalyst was studied next under the same reaction
conditions and the results are shown in Table 7.1. A similar amount of carbon was removed
from the liquid feed during the catalytic reaction compared to the blank experiment. However,
the use of Ru/CNT catalyst increased the amount of gas produced and reduced the amount of
coke formed. The composition of gas formed were stable during 6 h time-on-stream. It is
difficult to assess catalyst performance when coke is formed in such large quantities. These
results indicate that a great engineering challenge exists in preventing coke formation in the
preheater and reactor. This problem should first be overcome before the catalytic performance
of the Ru/CNT catalyst can be tested reliably.
After the reaction, an attempt was made to remove the catalyst from the reactor for
analysis. Both the preheater and the reactor showed the presence of significant amounts of
coke. No visible distinction could be made between the coke and the carbon-based catalyst
after removal of these solids and post mortum analysis of the catalyst was therefore not
possible.
7.4 Conclusions
The catalytic performance of Ru/CNT for supercritical water reforming (400 °C and
250 bar) of the aqueous phase of flash pyrolysis oil was studied. Coke was formed during the
reaction and caused blockage of the preheater when mildly diluted feeds were used. Coke
formation was likely catalyzed by the high ionic product of the subcritical water
regime in the preheater and involved decarboxylation and decarbonylation
reactions. Highly diluted feeds were necessary to prevent coke blockage of the preheater
during a 6 h experiment. However, even under those conditions, coke formation was
significant and prevented an assessment of the catalytic performance of Ru/CNT. Coke
formation outside the catalyst zone is a challenge for reactor design and should first be solved
before a catalytic process can be applied further.

Chapter 7
120
References
[1] R.D. Cortright, R.R. Davda, J.A. Dumesic, Nature 418 (2002) 964-967.
[2] Y. Guo, S.Z. Wang, D.H. Xu, Y.M. Gong, H.H. Ma, X.Y. Tang, Renew. Sust. Energ.
Rev. 14 (2010) 334-343.
[3] K. Sipila, E. Kuoppala, L. Fagernas, A. Oasmaa, Biomass Bioenerg. 14 (1998) 103-
113.
[4] A. Demirbas, Fuel Process. Technol. 88 (2007) 591-597.
[5] N.Z. Muradov, T.N. Veziroglu, Int. J. Hydrogen Energ. 30 (2005) 225-237.
[6] K. Takanabe, K. Aika, K. Seshan, L. Lefferts, Chem. Eng. J. 120 (2006) 133-137.
[7] D. Wang, D. Montane, E. Chornet, Appl. Catal. A 143 (1996) 245-270.
[8] D. Mohan, C.U. Pittman, P.H. Steele, Energ. Fuels 20 (2006) 848-889.
[9] M. Watanabe, H. Inomata, R.L. Smith Jr., K. Arai, Appl. Catal. A 219 (2001) 149-
156.
[10] J. Gornay, L. Coniglio, F. Billaud, G. Wild, J. Anal. Appl. Pyrolysis 87 (2010) 78-84.
[11] J. Kritzer, J. Supercrit. Fluid. 29 (2004) 1-29.
[12] S. E. Hunter, P.E. Savage, Chem. Eng. Sci. 59 (2004) 4903-4909.
[13] N. S. Kus, Tetrahedron 68 (2012) 949-958.

121
Chapter 8
Evaluation and concluding remarks.
The thesis is concluded in this chapter. The first part of this chapter evaluates the
developed catalytic aqueous phase reforming (APR) technique. APR is compared with
conventional steam reforming (SR) in terms of energetics, thermodynamics, catalysis and
material considerations. APR of bio/organic feeds in supercritical water showed to be favored
above SR. Furthermore, the conceptual integration of the APR process in a bio-refinery is
assessed with respect to hydrogen economics. The main achievements of the work described
in this thesis are assessed in the second part of this chapter with respect to commercial
relevance and future challenges. The developed Ru/CNT catalyst shows commercially
attractive properties for APR of bio/organic feeds in supercritical water. However, current
non-catalytic challenges with APR of the aqueous fraction of pyrolysis oil prevent feasible
exploitation of this process. It is projected that the APR technology developed in this thesis is
applicable for reforming of other bio/organic aqueous waste streams that are produced in large
quantities in the paper and food industry.

Chapter 8
122
8.1 Evaluation of aqueous phase vs steam reforming
Steam Reforming (SR) [1-3] and Aqueous Phase Reforming (APR) [4-6] are two
processes that are studied frequently for gasification of the aqueous fraction of bio-oil. SR is
the more conventional process which is already being applied in industry for decades (e.g.
steam reforming of natural gas) [7-8]. SR of aqueous feeds (>80 wt% water) is subjected to a
few issues that led to the development of the APR process [4, 9]. For instance, SR of aqueous
feeds is reported to be economically unfeasible because of their high water contents and the
energy required to carry out the reforming in gas phase [9]. This problem is overcome in APR
by keeping the water in the liquid phase by applying elevated pressures.
Furthermore, SR and APR conditions have very different thermo-physical properties
that affect catalysis differently. For instance, the phase of the reaction medium can affect
mass transfer rates and catalyst stability [10-11]. In this section, SR and the developed
catalytic APR techniques are compared and evaluated in terms of energetics,
thermodynamics, catalysis and technological challenges.
Energetics: Commercially interesting bio-feeds typically have water contents
typically > 80 wt% [12]. SR of suchs streams is commonly performed at temperatures of 700
°C and 30 bar pressure [13]. It was shown in Chapter 6 that near complete conversion of such
streams can be accomplished in APR at a temperature of 400 °C and 250 bars pressure. Steam
tables [14] were used to determine system enthalpies for SR and APR at those relevant
reaction conditions (SR: 700 °C and 30 bar, and APR: 400 °C and 250 bar) to compare
energetics of both processes.
It was calculated, that an energy of 3.7 MJ is required to condition 1 kg of water from
ambient (25 °C, 1 bar) to gas phase SR conditions (700 °C and 30 bar), while only 2.6 MJ is
required to bring 1 kg of water to APR conditions (400 °C and 250 bar). It should be taken
into account that these calculations were based on water only and that conditioning of
oxygenates in the feed should also be considered. The majority of typical oxygenates (e.g.
ethanol, glycerol, acetic acid) found in commercially interesting feeds have Enthalpies of
Vaporation that are similar to water [15] and therefore the energetic calculations performed
for pure water do not have to be adjusted for this parameter. Another parameter involved in
these calculation are the specific heat capacities, which for oxygenates are typically half the
value of that for water. Based on the aforementioned considerations, it was calculated that a

Chapter 8
123
20 wt% oxygenate feed would require an energy of 3.3 MJ/Kg to bring it to SR conditions
and 2.3 MJ/Kg in case of APR. These calculations show that energetics favor APR conditions
above that for SR. Furthermore, produced hydrogen is sometimes used for applications that
require pressurized hydrogen [16-17]. Hydrogen produced during APR is already pressurized
and this eliminates some of the energy required for the compression of the hydrogen for the
respective application.
Thermodynamics: The different reaction conditions of SR (700 °C) and APR (400
°C) cause that different products are thermodynamically favored per technique. Reforming of
oxygenates results in the production of CO, which consequently can undergo (i) methanation
or (ii) water gas shift (WGS). The aim of this process is to produce H2 and therefore
methanation (hydrogen consumption) is undesired, while WGS is desired.
Luo et al. [18] calculated thermodynamics for APR of different oxygenates, taking
into account reforming, (reversed) water gas shift ((R)-WGS) and methanation reactions.
They calculated that low temperature (227 °C) APR favors the formation of undesired
methane by methanation of CO. An increase in temperature makes the exothermic
methanation reaction less favorable, favoring the formation of H2 and CO. In addition, CO
formation at higher temperatures becomes even more favored due to the endothermic
reforming and R-WGS reaction.
The slightly exothermic WGS reaction plays an important role in achieving maximum
hydrogen yields but becomes less favorable to form hydrogen at higher temperatures. The
methanation reaction (H= -206.2 KJ/mol) is more exothermic in nature than WGS (H= -41.1
KJ/mol) and therefore an increase in temperature has a larger influence on methanation
equilibrium than WGS. Maximum hydrogen yields are favored in the situation where the
reaction temperature is high enough to suppress methane formation but on the other hand is
low enough to favor hydrogen formation by WGS. It was shown by Lu et al. [19] that H2 and
CO2 formation was favored around 500 °C during supercritical water reforming of glycerol.
The APR studies described in this thesis were performed in a similar temperature range and
hence in a thermodynamically favored environment for hydrogen production.
The high temperatures typically applied in SR suppress (i) methane formation by COx
methanation and (ii) hydrogen formation by WGS. Hence, conditions used for SR favor the
formation of H2 and CO [20-21].

Chapter 8
124
Mass transfer rates and residence times: Diffusion rates are very important for
catalysts as they control the amount of reactants supplied to the catalytic sites. Slow diffusion
rates might result in low reforming rates, while the full catalytic potential of the catalyst is not
used. SR is performed in gas phase and diffusion rates in gas are much higher than in water.
No reports were found that SR of aqueous feed stocks was limited by mass transfer.
However, it was reported by Shabaker et al. [22] that reforming of a 10 wt% ethylene
glycol feed under APR conditions (225 °C and 30 bar) was subjected to diffusion limitations.
Mass transfer problems were overcome by working in supercritical water (>374 C and 221
bar). The density of supercritical water is much lower than water under ambient conditions
and therefore diffusion rates are higher [10-11]. Mass transfer rates were sufficiently high
during the supercritical water reforming experiments that are described in this thesis. Near
complete gasification was obtained at commercially relevant residence times during
supercritical water APR of (i) 15 wt% ethylene glycol (Chapter 3) and (ii) 25 wt% acetic acid
feed (Chapter 6). Supercritical water is important to achieve the required diffusion rates that
are necessary to obtain high gasification rates at low residence times.
Residence times in the catalytic bed indicate the time that reactants are subjected to
catalysts. Long residence times are economically unattractive because they result in either (i)
higher amounts of catalysts necessary (and hence the need for a bigger reactor) or (ii) lower
feed throughput and hence lower product yields. Commercially attractive residence times for
SR of aqueous streams are typically in the order of seconds [23]. It was calculated for APR of
a 25 wt% acetic acid feed (Chapter 6) that near complete gasification was obtained at a
residence time of 3 seconds when the reaction was carried out at 400 °C (250 bar, water
density ~150 g/L). Hence, APR can be performed at similar residence times as SR and APR is
therefore very promising in this respect for commercial application.
Catalyst stability: A very important factor in catalysis is the stability of the catalyst.
Catalyst instability is a common problem in SR [24-27]. The high temperature (~700 °C) used
for SR is frequently reported to induce sintering of the catalytic metal particles and the
consequent loss in catalytic surface area causes catalyst deactivation [24-25]. Particle growth
does not only result in lower catalytic activities but it can also change product selectivities
[28]. Sintering in APR is less of an issue due to the lower reaction temperatures used.
Another serious problem during SR is formation and deposition of carbonaceous
species on the catalyst, which causes blockage of catalytic sites and hence deactivation of the

Chapter 8
125
catalyst [26-27]. Coke formation was not observed during APR of ethylene glycol and acetic
acid (Chapter 5 and 6) as a result of the solvation properties of hot compressed water, which
increase for non-polar compounds with increasing temperature [29]. The solvation properties
of supercritical water are comparable to dichloromethane and hence inherent coke solvability
in this medium is high [29]. Furthermore, the high diffusion rates in supercritical water ensure
that dissolved coke is directed away from the catalyst [10, 29]. Although coke solvability in
supercritical water is inherently high, it should be taken into account that the amount of coke
that can be dissolved is limited by the low density of supercritical water. These considerations
indicate that APR has a big advantage over SR in preventing catalyst deactivation by coke.
On the other hand, problems with catalyst deactivation in APR are also observed and
are related to process conditions which are not applicable for SR [Chapter 4 and 6].
Hydroxylation of conventional alumina catalyst support was observed during APR of acetic
acid (275 °C and 200 bars) and was attributed to increased acidity of acetic acid under these
conditions (high ionic product). The hydroxylated alumina was found to migrate and deposit
on catalytic sites, resulting in a total coverage of these sites and thereby making them
inaccessible for reactants. The aforementioned mechanism results in deactivation of the
catalyst as discussed in Chapter 4. Furthermore, Ru/CNT catalyst deactivated during acetic
acid reforming in high temperature subcritical water (300 – 350 °C, 225 bars) as discussed in
Chapter 6. It was found that the high ionic product of subcritical water caused over-oxidation
of Ru and thereby causing deactivation the catalysts. Performing APR in supercritical water
overcame these problems due to the much lower ionic product of this medium. Based on these
arguments, it can be concluded that APR in supercritical water is preferred in warranting
catalyst stability.
Material considerations: The stability of materials used for the experimental setup is
much more challenged under APR conditions than under SR [30]. The high ionic product of
subcritical water is known to cause material failure by corrosion/leaching induced cracking
[30]. These problems are not observed in supercritical water because the ionic product is
much lower in this regime [30]. However, the presence of oxidizing agents (especially,
halogen-based inorganic oxidizers) in supercritical water is reported to cause severe corrosion
of the majority of materials [30]. However, strong oxidizers are not expected to be present in
bio/organic feeds. Furthermore, it was also reported [30] that stable/inert materials exist for
every supercritical water application. Due to the reason described above, APR of bio/organic
feeds in supercritical water is expected not to be a problem with respect to material stability.

Chapter 8
126
However, it should be noted that supercritical water setups always have parts that operate
under subcritical water conditions. Finding materials with long term stability in subcritical
water is believed to be one of the challenges of this reaction. Material choice is therefore a
very important factor in APR.
The comparison of energetic, thermodynamics, catalysis and material consideration for
typical APR and SR conditions were evaluated and showed that APR is preferred for
reforming of bio/organic feeds as long as the reaction is carried out in supercritical water.
8.2 Evaluation of APR integration with Bio-refinery
Fractionation of the pyrolysis oil in an organic and aqueous phase is the first step in
obtaining high heating value bio-oil. The next step to upgrade the heating value involves de-
oxygenation of the organic phase with hydrogen. APR of the aqueous phase of pyrolysis oil is
an interesting route to produce the required hydrogen for de-oxygenation of the organic phase.
A concept for the integration of APR in a bio-refinery was proposed in Chapter 1 (Figure 1.3).
In this section, this concept is evaluated in terms of hydrogen economics. The maximum
amount of hydrogen that can be obtained theoretically by APR of the aqueous feed is
compared with the amount of hydrogen required to upgrade the bio-oil fraction to commercial
relevant heating values. Venderbosch et al. [31] published an overview of the composition of
a typical bio-oil and these values will be used for the evaluation of this concept. The relevant
data is summarized in Table 8.1.
Table 8.1: Composition of a typical bio-oil [31].
component fraction wt% average molecular composition (wt%)
C H O
Water soluble Acids, Alcohols 10 36 6 58 Ether-solubles 10 60 6 34 Ether-insolubles 30 46 6 48 H2O 25 - Water insolubles 25 66 7 27

Chapter 8
127
It can be seen from Table 8.1 that 25 wt% of the pyrolysis oil is the desired organic
phase that is of interest for the production of liquid bio-fuels. The remaining 75 wt% consists
of low heating value and water soluble compounds (oxygenates + H2O), and is referred to as
the aqueous fraction. The oxygenates account for 50 wt% of the pyrolysis oil and these have a
weight averaged composition of C=46.8, H= 6.0 and O=47.2 %. The oxygenates in the
aqueous phase are of interest for hydrogen production by APR.
First, it is calculated how much hydrogen can be formed during APR of the
aforementioned feed. The assumption is made that maximum hydrogen yields are achieved
during APR and this implies that (i) all hydrogen atoms in the oxygenate recombine to
molecular hydrogen and (ii) carbon undergoes full oxidation by water to form CO2 and H2
(water gas shift reaction). The oxygenates (which represent 50 wt% of the pyrolysis oil)
contain 6 wt% hydrogen, indicating that 30 gram (or 15 mol) of H2 can be produced per Kg of
initial pyrolysis oil. Furthermore, hydrogen can also be formed by the water gas shift reaction.
During WGS, carbon is oxidized by water to form H2. A single carbon atom can undergo two
oxidations by water (C + H2O → CO + H2, and CO + H2O → CO2 + H2) and therefore, in the
optimal case, two hydrogen molecules can be formed per carbon atom. However, the carbon
in the oxygenates is already partly oxidized and this should be taken into account when
calculating the maximum hydrogen yield potential. It can be calculated for the oxygenates
that the molar ratio of oxygen/carbon is 0.77, while fully oxidized carbon has oxygen/carbon
ratio of 2. This indicates that 1.23 molecules of hydrogen can be formed per carbon atom in
case of optimal hydrogen yields. Oxygenates are for 46.8 wt% composed out of carbon,
indicating that the water-soluble oxygenate fraction (50 wt% of pyrolysis oil) contains ~19
moles of carbon per kg of pyrolysis oil. This indicates that another 23 moles of H2 can be
produced by complete oxidation of the already partly oxidized carbon. The above
considerations show that a total of 48 moles of H2 can be produced maximally from the
aqueous fraction of 1 Kg of pyrolysis oil.
Next, the amount of hydrogen required for upgrading of the organic phase of pyrolysis
oil is calculated. The pyrolysis oil is composed of 25 wt% organic phase. This phase is of
interest for liquid bio-fuel production, but needs to be upgraded first by de-oxygenation to
increase the heating value. During this process, oxygen in the organic compounds is
hydrogenated and removed from the molecule in the form of water. Two hydrogen atoms are
necessary to remove one oxygen atom in the form of water (O + 2H → H2O). The oxygen
content in the organic phase is 27 wt%, indicating that 68 gram (or 4.2 mol) of atomic oxygen

Chapter 8
128
needs to be removed from the organic phase of 1 Kg of pyrolysis oil. These calculations show
that 4.2 moles of molecular hydrogen (H2) are necessary to accomplish full de-oxygenation of
the organic phase. Bridgwater [32] reported similar relative hydrogen amounts for this process
(8 moles of hydrogen to fully de-oxygenate 250 grams of organic phase that was composed of
50 wt% oxygen). Competing side-reactions (e.g. hydrogenation of unsaturated bonds) during
de-oxygenation might increase the required hydrogen amounts to achieve full de-oxygenation.
It was calculated earlier in this section that maximum H2 yields of 48 moles can be produced
from the aqueous phase of 1 Kg of pyrolysis oil. These calculations show that the amount of
hydrogen obtained from the aqueous phase is enough for full de-oxygenation (ignoring
hydrogenation side reactions) of the organic phase, when the hydrogen selectivity for the
reforming for the aqueous fraction is at least 10%. The integration of APR to generate
hydrogen from the aqueous phase of pyrolysis oil to upgrade the organic phase is graphically
presented in Figure 8.1, and shows to be conceptually feasible.
Figure 8.1: Hydrogen economic of APR integration in a bio-refinery.

Chapter 8
129
8.3 Concluding remarks and future challenges
Catalytic Aqueous Phase Reforming (APR) of bio/organic feeds is an interesting route
for the production of renewable hydrogen as discussed in detail throughout this thesis.
However, the lack of efficient APR catalysts is one of the issues that prevented commercial
exploitation of this process. The need for efficient APR catalyst was addressed in this thesis
and resulted in the following achievements:
• Development of efficient Pt-Ni/Al2O3 catalyst for APR of ethylene glycol in
supercritical water at commercially relevant concentrations and reaction rates (Chapter
3).
• Identifying acetic acid as a threat for the stability of alumina-based catalysts (Chapter
4).
• Identifying the role of Ni in Pt-Ni/Al2O3 catalysts in enhancing hydrogen yields and
extending catalyst lifetime during APR of ethylene glycol (Chapter 4).
• Realizing that metal oxide supports are not suitable for APR of bio/organic feeds that
contain carboxylic acids (Chapter 4).
• Development of a stable catalyst (Pt/CNT) for APR of ethylene glycol and acetic acid
in supercritical water (Chapter 5). However, reaction rates were too low for
commercial purposes.
• Development of a stable catalyst (Ru/CNT) with commercially attractive gasification
rates for APR of acetic acid in supercritical water (Chapter 6).
• Realization that APR in subcritical water is very challenging for catalyst and material
stability. Therefore, APR in supercritical water is preferred (and also necessary to
achieve the required reaction rates) (Chapter 6).
• APR of real aqueous feed (aqueous phase of flash pyrolysis) showed that non-catalytic
challenges should be solved first before the developed Ru/CNT can be assessed for
this process (Chapter 7).
These achievements are a giant step towards the commercial feasibility of APR of
bio/organic feed streams. However, two challenges remain which should first be solved
before this process can be commercially employed. The first challenge is related to catalytic
performance. The developed Ru/CNT catalyst is very promising for reforming of bio/organic

Chapter 8
130
feeds in supercritical water in terms of stability and gasification rates. However, the desired
product is hydrogen and reforming of oxygenates that do not have every carbon atom
connected to oxygen (e.g. acetic acid), favor alkane formation inherently. Optimization of the
hydrogen yields should be performed by either (1) improving the alkane reforming in the
reactor by modifying the used catalyst or (2) integrate an alkane reforming step after the
gasification reaction.
Coke formation before the APR of bio/organic feeds was found to cause blockage of
the experimental setup. This problem is a non-catalytic challenge that should be addressed
before APR can be commercially applied for these bio/organic feeds. Pretreatment of the feed
might be required to remove the coke-precursors. At this moment, the exact coke-precursors
are not identified yet. Acetic acid is a notorious coke-precursor in steam reforming. However,
coke formation during APR of highly concentrated acetic acid solutions was not observed.
Future studies should be focused first at identifying the pathways/compounds involved in
coke formation. Once these are known, solutions to prevent coke formation can be developed.
Currently, the food and paper industry produce large amounts of bio/organic waste. These
streams might be less susceptible to form coke and might therefore be promising feed streams
for gasification by APR. The commercial relevance of gasification of such feeds is not only
limited to producing valuable products but it will simultaneously diminish/clean these waste
streams.
References
[1] C. Yan, F. Cheng, R. Hu, P. Fu, Int. J. Hydrogen Energ. 35 (2010) 2612-2616.
[2] A. Basagiannis, X. Verykios, Catal. Today 127 (2007) 256-264.
[3] J.A. Medrano, M. Oliva, J. Ruiz, L. Garcia, J. Arauzo, Energy 36 (2011) 2215-2224.
[4] R.D. Cortright, R.R. Davda, J.A. Dumesic, Nature 418 (2002) 964.
[5] J. Xie, D. Su, X. Yin, C. Wu, J. Zhu, Int. J. Hydrogen Energ. 36 (2011) 15561-15572.
[6] Y. Guo, M.U. Azmat, X. Liu, Y. Wang, G. Lu, Appl. Energ. 92 (2012) 218-223.
[7] R. Navarro, M. Pena, J. Fierro, Chem. Rev. 107 (2007) 3952-3991.
[8] S. Adhikir, S. Fernando, A. Haryanto, Energ. Convers. Manage. 50 (2009) 2600-2604.
[9] R.R. Davda, J.W. Shabaker, G.W. Huber, R.D. Cortright, J.A. Dumesic, Appl. Catal.
B 56 (2005) 171-186.

Chapter 8
131
[10] Y. Guo, S.Z. Wang, D.H. Xu, Y.M. Gong, H.H. Ma, X.Y. Tang, Renew. Sust. Energ.
Rev. 14 (2010) 334-343.
[11] J. Kritzer, J. Supercrit. Fluid. 29 (2004) 1-29.
[12] A. Nakamura, E. Kiyonaga, Y. Yamamura, Y. Shimizu, T. Minowa, Y. Noda, Y.
Matsumura, J. Chem. Eng. Jpn. 41 (2008) 1-12.
[13] S. A. Chattanathan, S. Adhikari, N. Abdoulmoumine, Renew. Sust. Energ. Rev. 16
(2012) 2366-2372.
[14] http://enpub.fulton.asu.edu/ece340/pdf/steam_tables.PDF
[15] J.S. Chickos, W.E. Acree Jr. J. Phys. Chem. Ref. Data 32 (2003) 515.
[16] S.P. Cicconardi, A. Perna, G. Spazzafumo, Int. J. Hydrogen Energ. 29 (2004) 457-551.
[17] B. Sun, D. Zhang, S. Liu, Int. J. Hydrogen Energ. 37 (2012) 13088-13091.
[18] N. Luo, F. Cao, X. Zhao, T. Xiao, D. Fang, Fuel 86 (2007) 1727-1736.
[19] Q. Yan, L. Guo, Y. Lu, Energ. Convers. Manage. 47 (2006) 1515-1528.
[20] N. Wang, N. Perret, A. Foster, Int. J. Hydrogen Energ. 36 (2011) 5932-5940.
[21] H. Chen, Y. Ding, N. T. Cog, B. Dou, V. Dupont, M. Ghadin, P.T. Williams, Renew.
Energ. 36 (2011) 779-788.
[22] J.W. Shabaker, R.R. Davda, G.W. Huber, R.D. Cortright, J.A. Dumesic, J. Catal. 215
(2003) 344-352.
[23] J. Nisamameenate, D. Atong, V. Sricharoenchaikul, Adv. Sci. Lett. 12 (2012) 872-876.
[24] J. Sehested, J. Catal. 217 (2003) 417-426.
[25] H. Devianto, Z.L. Li, S.P. Yoon, J. Han, S.W. Nam, T.H. Lim, H. Lee, Int. J.
Hydrogen Energ. 35 (2010) 2591-2596.
[26] K. Takanabe, K. Aika, K. Seshan, L. Lefferts, Chem. Eng. J. 120 (2006) 133-137.
[27] D.L. Trimm, Catal. Today 37 (1997) 233-238.
[28] K. Lehnert, P. Claus, Catal. Commun. 9 (2008) 2543-2546.
[29] P. Kritzer, E. Dinjus, Chem. Eng. J. 83 (2001) 207-214.
[30] P. Kritzer, J. Superc. Fluid. 29 (2004) 1-29.
[31] R.H. Venderbosch, A.R. Ardiyanti, J. Wildschut, A. Oasmaa, H.J. Heeres, J. Chem.
Tech. Biotech. 85 (2010) 674-686.
[32] A.V. Bridgwater, Catal. Today 29 (1996) 285-295.

132

Publications
133
Publications
Journal Papers
● D.J.M. de Vlieger, A.G. Chakinala, L. Lefferts, S.R.A. Kersten, K. Seshan and D.W.F.
Brilman. Hydrogen from ethylene glycol by supercritical water reforming using
alumina supported noble and base metal catalysts. Applied Catalysis B:
Environmental 111 – 112 (2012) 536 – 544
● D.J.M. de Vlieger, B.L. Mojet, L. Leffert and K. Seshan. Aqueous phase reforming of
ethylene glycol – Role of intermediates in catalyst performance. Journal of Catalysis
292 (2012) 239 – 245
● D.J.M. de Vlieger, D.B. Thakur, L. Lefferts and K. Seshan; Carbon nanotubes: A
promising catalyst support material for supercritical water gasification of biomass
waste. ChemCatChem 4 (20120) 2068 – 2074
● D.J.M. de Vlieger, L. Lefferts and K. Seshan; Ru decorated carbon nanotubes; a
commercially promising catalyst for reforming bio-based acetic acid in sub- and
supercritical water. Submitted to Journal of Catalysis

Publications
134
Oral Proceedings
● Carbon nanotubes: the promising solution to catalytic problems in supercritical water.
15th International Catalysis Congress, 1 – 6 July 2012, Munich-Germany
● Carbon nanotubes as catalyst support material for reactions in supercritical water.
Carbocat-V, 28 – 30 June 2012, Brixen-Italy.
● Carbon nanotubes: Promising support material for catalytic reactions in supercritical
water. Netherlands Catalysis and Chemistry Conference, 5 – 7 March 2012,
Noordwijkerhout – The Netherlands
● Renewable hydrogen from aqueous organic wastes – Risk of intermediates on catalyst
performance for aqueous phase reforming of ethylene glycol. TransACTS, 31 January
– 1 February 2012, Lunteren – The Netherlands
● The Effect of Liquid By-Products on the performance of Alumina Supported Pt and Pt-
Ni catalysts during Ethylene Glycol reforming. Netherlands Process Technology
Symposium, 24-26 October 2011, Papendal – The Netherlands
● Hydrogen from supercritical water reforming of ethylene glycol using alumina
supported metal catalysts, Netherlands Catalysis and Chemistry Conference, 28
February – 2 March 2011, Noordwijkerhout – The Netherlands
● Hydrogen from supercritical water reforming of ethylene glycol using alumina
supported metal catalysts. COST Congress, 20 – 21 January 2011, Utrecht – The
Netherlands
● Hydrogen from supercritical water reforming of ethylene glycol using alumina
supported metal catalysts, TransACTS, 12 January - 13 January 2011, Lunteren – The
Netherlands

Acknowledgements
135
Acknowledgements
After 4 years of hard work, my scientific journey reached a new apogeum by completing the
PhD thesis that you are now holding in your hands. I learned a lot in those years and was
guided and directed by the many discussions and collaboration that I had with supervisors,
colleagues and even with people outside the field of expertise. This section is therefore
dedicated to the people that shared their time, enthusiasm and expertise with me so I could
make biased decisions regarding directions and steps to bring this scientific journey to a good
end.
Seshan, a sincere gratitude goes to you, my daily supervisor. The door of your office was
always open for scientific discussions as well as informal chitchat. Your relaxed character and
pragmatic way of working always took away any worries that I had concerning my project.
Seshan, you gave me guidance during my project and moreover I learned a lot from you,
especially regarding technical writing. Dear Seshan, thank you again, I learned from the best!
Leon, I would like to thank you for offering me the opportunity to do my PhD at CPM and
furthermore for the many scientific discussions that we had, which helped me to decide the
right directions of my project. Your yearly BBQs were always a pleasure to attend.
Barbara, thank you for the many scientific discussions. You taught me a lot, especially to be
very critical about the interpretation of results (remember the wrongly identified coke in the
Raman Spectra!). Your cheering and motivating character brings life to CPM.
I also want to express my gratitude to Anand Chakinala, Wim Brilman and Sascha Kersten for
the fruitful collaborations and discussions that led to a publication in Applied Catalysis.
My gratitude also goes to Benno Knaken and Karst van Bree for building (and repairing) my
setup. Furthermore, Bert Geerdink, I would like to thank you for the technical support in the
lab and for your help with computer/multi-media related issues. It was always a pleasure to
work with you.
A special thanks goes to my room-mates Masoud, Marijana and Hrudya. Masoud, I always
found your stories about Iran interesting and I hope that the Iranese future will be bright and
without troubles. I’m sure that you and Fatimeh will be able to go to the place that you desire!
Marijana and Hrudya, it was never boring with you in the room. I wish you guys all the best
with finishing your PhD.

Acknowledgements
136
Louise, thank you for all the XRF and BET measurements. I am glad that you reached a new
high score with the number of yearly measurements. That shows how important your job is
and how much we rely on your expertise. I always enjoyed talking to you. I wish you all the
best and I’m sure that you will enjoy the time after your retirement. In the near future, I do
expect to read in the newspapers that you became national Bridge champion.
Karin, thank you for all the help in the lab and for all the chemisorptions and BET
measurement that you performed for me. I always enjoyed talking to you and still regret that
we missed each other in the Monastry in Seeon. All the best for the future.
I would also like to thank Gerard Kip, Rico Keim, and Mark Smithers for performing XPS,
TEM and SEM experiments.
I supervised three student during my PhD and I want to thank them for their contributions to
my project. Yasmin, Ifeanyi and Kaisa, Thank you! Kaisa I wish you all the best with the PhD
position that you accepted in the CPM group. Yasmin and Ifeanyi, I wish you all the best with
your scientific careers.
Bart, Thank you for the scientific discussions that we had regarding my work. I wish you all
the best in your career with Johnson Mathhey.
Digvijay, thank you for all the interesting stories about the Indian social and political system.
Furthermore, I want to thank you for the fruitful scientific collaboration. After a few wines
during one of the conferences, we decided to undertake a very interesting interdisciplinary
project which resulted in novel results which were published in ChemCatChem. I wish you,
Aabha and Yashwardhan a happy and bright future.
Patrick, I started my career in CPM under your supervision and soon I followed your
footsteps and accepted a PhD position in the same group. Thank you for your guidance during
my master project and showing me the fun of doing research.
Ruben, thank you for being my friend and paranimph. You were ready to help everybody,
anywhere, anytime! I really appreciate your friendliness and your active character. Your
sporting skills always amazed me…from cycling, running, and darts… to hitting the bulls-eye
two times!

Acknowledgements
137
Mr. Reed, You bold buddy! Thank you for being my friend and paranimph. I highly
appreciate it. You always amazed me with your retarded stories and your English humor. Also
bear in mind that your furry vermin friends can’t have a better keeper than you!
Furthermore, I want to thank all my (former) colleagues Arie, Son, Sergio, Lianne, Maaike,
Raman, Songbo, Cristina, Chau, Shilpa, Rao, Yingyang, Tom, Arturo, Joline, Lidy, Sabine,
Roger, Kamilla, José, Yejun. Zeljko, Igor, Martine, Inga, Gacia, Kumar, Davide and Berta,
for the enjoyable time in CPM.
At last, I would like to thank my family for their support and given confidence. A special
thanks goes to my mother Wilma for developing and drawing the Mandala that is presented
on the cover of this thesis. The meaning of the Mandala is described on the inside of the
cover. Wilma, I know that you struggled a lot with the geometry of the leafs but you did a
great job! It is an honor to use your drawing on the front cover. At last I want to show my
deepest gratitude to my girl Astrid who was always standing on my side. You have been a
great support and motivator and you are the reason that I was never stressed out because you
always knew how to comfort me with your love! Thank you!

138

139

140
