design of an orthodontic torque simulator for measurement ... · design of an orthodontic torque...
TRANSCRIPT

1
Design of an Orthodontic Torque Simulator for
Measurement of Bracket Deformation
G W Melenka1, D S Nobes1, P W Major2 and J P Carey1
1Mechanical Engineering, Faculty of Engineering, University of Alberta,
Edmonton Alberta T6G 2G8, Canada
2Department of Dentistry, Faculty of Medicine and Dentistry, University of
Alberta, Edmonton Alberta, T6G 2N8, Canada
E-mail: [email protected]
Abstract
The design and testing of an orthodontic torque simulator is described that reproduces the effect of
archwire rotation on orthodontic brackets. This unique device is capable of simultaneously
measuring the deformation and loads applied to an orthodontic bracket due to archwire rotation.
Archwire rotation is used by orthodontists to correct the inclination of teeth within the mouth.
This orthodontic torque simulator will provide knowledge of the deformation and loads applied to
orthodontic bracket that will aide clinicians by describing the effect of archwire rotation on
brackets. This will also impact that design on new archwire\bracket systems by providing an
assessment of performance. Deformation of the orthodontic bracket tie wings is measured using a
digital image correlation process to measure elastic and plastic deformation. The magnitude of
force and moments applied to the bracket though the archwire is also measured using a six-axis
load cell. Initial tests have been performed on two orthodontic brackets of varying geometry to
demonstrate the measurement capability of the orthodontic torque simulator. The demonstration
experiment shows that a Damon Q bracket had a final plastic deformation after a single loading of
0.022mm while the Speed bracket deformed 0.071mm. This indicates that the Speed bracket
plastically deforms 3.2 times more than the Damon Q bracket for similar magnitude of applied
moment. The demonstration experiment demonstrates that bracket geometry affect the
deformation of orthodontic brackets and this difference can be detected using the orthodontic
torque simulator.
Keywords: Orthodontic Bracket, deformation, contact-free optical displacement
measurement, digital image correlation

2
Introduction
Braces and archwires are used by orthodontists to correct teeth misalignment (malocclusions)
within the dental arch [1]. Braces are typically worn for over two years and patients require
regular checkups to monitor and adjust the realignment progress [2]. Braces consist of a series of
brackets that are bonded to the crown of individual teeth and an archwire which passes between
each and is ligated to the brackets. Tooth motion for re-alignment is achieved by applying forces
and moments to the crown of the tooth through the interaction archwire with the bracket. Short
term tooth movement results from the stimulation of the periodontal ligament (PDL), the
connective tissue which attaches the tooth to the alveolar bone [1, 3]. Forces applied through the
tooth’s crown apply pressure and cause deformation of the PDL. Pressures applied to the PDL are
alleviated initially by creep-like internal fluid flow, which is then followed by the resorption and
apposition of alveolar bone to support the tooth in its post-loading position [1, 3]. Tooth
movement is therefore the result of the mechanical interaction of the archwire with the bracket.
Several studies have examined archwire rotation in a bracket to investigate bracket deformation
and if permanent distortion of the bracket is possible [4-8]. These studies have measured brackets
before and after an applied archwire rotation and investigation of the changes in the shape of the
brackets have been used to determine if permanent deformation of the bracket is present. Several
of these studies have made reference to bracket deformation but the deformation was not
quantified [4, 5, 7]. One study measured the permanent change in titanium and stainless steel
bracket slot profile before and after archwire rotation using a stereomicroscope to quantify bracket
deformation [6]. This study was limited to only measuring permanent change to the bracket slot
and an assessment of the measurement resolution was not given. The findings from this study
indicate that plastic deformation occurs to orthodontic brackets due to a 45° archwire rotation.
Similarly, another study measured bracket deformation at a variety of archwire rotation angles [8].
Bracket deformation was measured optically using a stereomicroscope and a protractor with a
reported resolution of 0.2°. These studies are limited since they are unable to determine the
applied moment where permanent deformation begins to occur.
The effect of incremental archwire twist on the loads experienced by orthodontic brackets has also
been examined [9-11] by measuring the bulk forces and moments applied to the bracket by an
archwire using load cells connected to the bracket. These approaches are limited in that it is
unresolved whether the bracket under goes elastic and plastic deformation, what the interaction
mechanism is between the archwire and the bracket, and what properties of the mechanical
coupling are important. These unresolved questions complicate the development of a model which
would be used to optimize the mechanical system.
The small size, complicated geometries, and complex loading conditions of orthodontic brackets
means that most conventional measurement methods are impractical. To investigate the
deformation of a bracket as an archwire is rotated within the bracket slot an optical method has
been developed, designed, and constructed at the University of Alberta through a collaboration
between the Department of Mechanical Engineering and Department of Dentistry. This has been

3
coupled to an existing torque measurement device used to measure the forces and moments
applied to brackets [9]. A CCD camera and a full-field digital image correlation (DIC)
measurement based system was added to this device in order to measure the displacement of
bracket tie wings [12]. This device has also been used to demonstrate the deformation of self-
ligating brackets and to compare geometrically similar titanium and stainless steel brackets [13,
14]. The testing apparatus comprises of a 6-axis load cell which measures forces and torques
applied to a test bracket and using the DIC-based imaging system to measures displacement /
bracket-archwire interaction. This device allows for the simulation of the rotation of an archwire
within a bracket slot and can be used to measure the deformation that occurs to these brackets
which can be correlated to applied loads. Understanding the loads that are applied to orthodontic
brackets and the deformation of the brackets is required to improve treatment efficiency and to
generate models of the interaction of bracket-archwire-tooth for system optimization. Therefore,
the deformation of orthodontic brackets should be measured for varying archwire angulations,
bracket geometries, archwire size and ligation method in order to provide orthodontists with
information on bracket behavior due to archwire rotation.
The objectives of this paper is to detail the design and development of this novel DIC-based
measurement technique used with a modified torque measurement device and assess the level of
systematic error associates with the instrumentation within the context of a practical and clinical
case-study application. A comparison will be made between the systematic measurement errors to
the variability in orthodontic brackets to investigate sources of variability in results. An example
test set comparing two styles of bracket will also be discussed to highlight system capability.
Description of Orthodontic Bracket Deformation
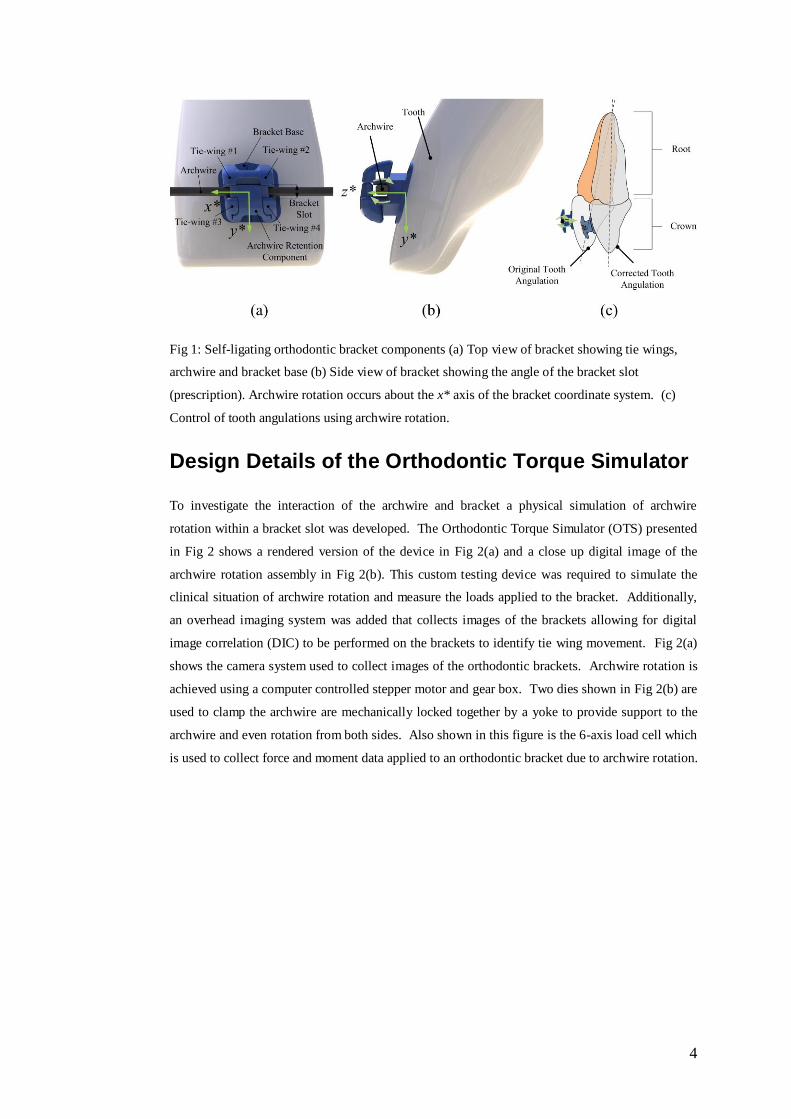
Pictorial schematics of a classically shaped orthodontic bracket are shown in Fig 1 which consists
of a base, tie wings and an archwire slot in reference to a central incisor tooth. The base is bonded
to the tooth using a dental adhesive. The tie wings provide a retentive means to hold an archwire
within the bracket slot for this style of bracket using either elastic ligation or stainless steel ligature
wires. Alternatively different designs of brackets use self-ligation which include a movable
component used for the same purpose without the need for additional ligation [15]. It can be seen
in Fig 1 that for a coordinate system attached to the bracket (x*,y*,z*) the x* axis is defined as
parallel to the archwire, the y* axis is defined as the direction of lateral motion of the bracket tie
wings due to archwire rotation and the z* axis defines the direction from the base of the
orthodontic bracket to the top of the bracket tie wings. Archwire rotation occurs about the x* axis
and the angle of archwire rotation is defined as . The figure also shows the relative size of the
bracket/archwire system compared to the tooth and the complex geometry of the bracket. Change
of anterior tooth inclination is achieved by rotating an archwire within an orthodontic bracket slot
as shown in Fig 1(c). This figure shows the initial and final tooth angulations. Control over the
amount of tooth inclination is necessary in orthodontic treatment in order to maintain post
treatment stability and to maintain a healthy alignment of the teeth and is carried out by applying
different magnitudes of torque [1, 16].
4
Fig 1: Self-ligating orthodontic bracket components (a) Top view of bracket showing tie wings,
archwire and bracket base (b) Side view of bracket showing the angle of the bracket slot
(prescription). Archwire rotation occurs about the x* axis of the bracket coordinate system. (c)
Control of tooth angulations using archwire rotation.
Design Details of the Orthodontic Torque Simulator
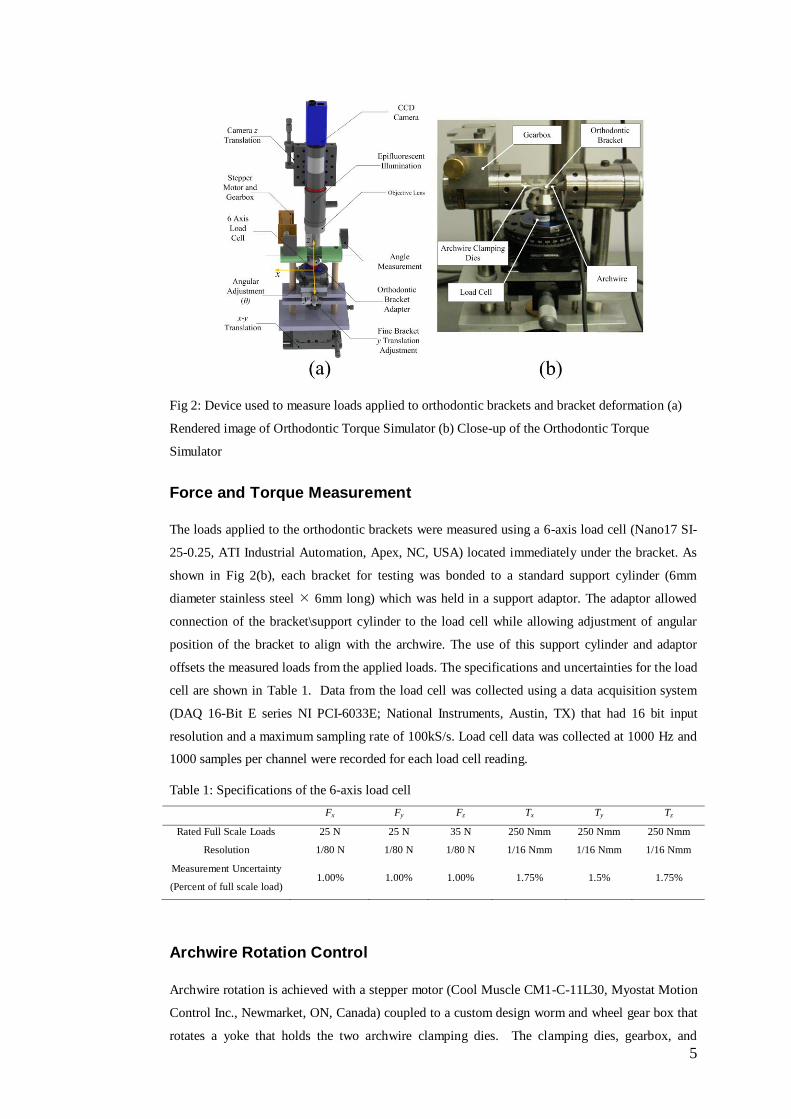
To investigate the interaction of the archwire and bracket a physical simulation of archwire
rotation within a bracket slot was developed. The Orthodontic Torque Simulator (OTS) presented
in Fig 2 shows a rendered version of the device in Fig 2(a) and a close up digital image of the
archwire rotation assembly in Fig 2(b). This custom testing device was required to simulate the
clinical situation of archwire rotation and measure the loads applied to the bracket. Additionally,
an overhead imaging system was added that collects images of the brackets allowing for digital
image correlation (DIC) to be performed on the brackets to identify tie wing movement. Fig 2(a)
shows the camera system used to collect images of the orthodontic brackets. Archwire rotation is
achieved using a computer controlled stepper motor and gear box. Two dies shown in Fig 2(b) are
used to clamp the archwire are mechanically locked together by a yoke to provide support to the
archwire and even rotation from both sides. Also shown in this figure is the 6-axis load cell which
is used to collect force and moment data applied to an orthodontic bracket due to archwire rotation.
5
Fig 2: Device used to measure loads applied to orthodontic brackets and bracket deformation (a)
Rendered image of Orthodontic Torque Simulator (b) Close-up of the Orthodontic Torque
Simulator
Force and Torque Measurement
The loads applied to the orthodontic brackets were measured using a 6-axis load cell (Nano17 SI-
25-0.25, ATI Industrial Automation, Apex, NC, USA) located immediately under the bracket. As
shown in Fig 2(b), each bracket for testing was bonded to a standard support cylinder (6mm
diameter stainless steel 6mm long) which was held in a support adaptor. The adaptor allowed
connection of the bracket\support cylinder to the load cell while allowing adjustment of angular
position of the bracket to align with the archwire. The use of this support cylinder and adaptor
offsets the measured loads from the applied loads. The specifications and uncertainties for the load
cell are shown in Table 1. Data from the load cell was collected using a data acquisition system
(DAQ 16-Bit E series NI PCI-6033E; National Instruments, Austin, TX) that had 16 bit input
resolution and a maximum sampling rate of 100kS/s. Load cell data was collected at 1000 Hz and
1000 samples per channel were recorded for each load cell reading.
Table 1: Specifications of the 6-axis load cell
Fx Fy Fz Tx Ty Tz
Rated Full Scale Loads 25 N 25 N 35 N 250 Nmm 250 Nmm 250 Nmm
Resolution 1/80 N 1/80 N 1/80 N 1/16 Nmm 1/16 Nmm 1/16 Nmm
Measurement Uncertainty
(Percent of full scale load) 1.00% 1.00% 1.00% 1.75% 1.5% 1.75%
Archwire Rotation Control
Archwire rotation is achieved with a stepper motor (Cool Muscle CM1-C-11L30, Myostat Motion
Control Inc., Newmarket, ON, Canada) coupled to a custom design worm and wheel gear box that
rotates a yoke that holds the two archwire clamping dies. The clamping dies, gearbox, and

6
archwire are shown in Fig 2(b). The gear system is designed with a 1:96 gear ratio and a 3.75°
rotation (1000 stepper motor counts) represents one revolution of the worm gear. The backlash in
the gear system is less than the 0.05° resolution of a inclinometer (model T2-7200-1N; US Digital,
Vancouver, Wa.) which was used for monitoring only. Archwire rotation was defined by the input
to the stepper motor which was achieved via serial communication from the control PC and
custom software.
Bracket Position Control
Two translation stages were used to adjust the x-y position of the entire torque assembly
underneath the imaging system (LT01 Translation Stage, Thor Labs, Newton NJ, USA) as shown
in Fig 2(a) allowing for the bracket to be centered in the camera field of view. A translation stage
was also used to control the height (z) of the camera above the orthodontic bracket. Additionally,
a translation stage with a micrometer shown in Fig 2(b) was used to control the position of the
bracket (MT01 Translation Stage, Thor Labs, Newton NJ, USA). This precision translation stage
allows for control over the bracket y-position and ensures the archwire can be placed within the
bracket slot while minimizing any initial forces or moments. A rotation stage controlling rotation
about the z*-axis was used to ensure the bracket slot is also parallel to the archwire (PR01 Rotation
Stage, Thor Labs, Newton NJ, USA).
Bracket Imaging
An imaging system composing of a CCD camera (piA2400 12gm, Basler Vision Technologies,
Exton, PA, USA) connected to a long working distance microscope (55-908 MMS R4, Edmund
Optics, Barrington, NJ, USA) collected images at 2448 × 2050 pixels and 12-bit resolution. The
objective lens viewed the top of the bracket, normal to the archwire rotation axis at its nominal
working distance of 67mm. Test specimens are illuminated using epi-illumination (MVO®
MMS® In-Line Attachment 56-244, Edmund Optics, Barrington, NJ, USA) to provide even
illumination across the field of view.
Bracket/Load Cell Force Torque Conversion
The load cell measures forces and moments at the origin of its coordinate system (x,y,z) as defined
in Fig 3. This figure shows a close up render image of the relationship of the load cell to the
bracket with the bracket cylinder and mounting adapter. To determine forces and moments
applied directly to the bracket by the archwire, a force/moment coordinate transformation is
required. The offset of the bracket from the origin of the load cell is measured using a commercial
coordinate measurement machine (FaroArm, FARO USA, Lake Mary, FL, USA). The
relationship of the two coordinate systems requiring the transformation from the load cell (x,y,z) to
the bracket (x*,y*,z*) is illustrated in Fig 3. The offset of the orthodontic bracket from the load
cell comprises of a displacement in the x, y and z-directions as well as a rotation about the z-axis, θ
as shown in Fig 3(b).

7
Fig 3: Load cell and bracket coordinate systems. (a) Offset of orthodontic bracket from load cell (b) Coordinate
system transformation showing displacement, rotation about the z axis and the angle indicating the direction of
archwire rotation.
The transformation of measured forces and torques to bracket forces and torques can be defined as:
zbracket
ybracket
xbracket
zbracket
ybracket
xbracket
f
f
f
m
m
m
bracketF
(1)
where,
sincossinsincoscos xLCyLCyLCzLCxLCxbracket ffzxmxyfmm
sincossincossincos yLCxLCxLCyLCzLCybracket ffzmmyxfm
xLCyLCzLCzbracket yfxfmm
sincos yLCxLCxbracket fff
sincos xLCyLCybracket fff
zLCzbracket ff
This relationship converts forces and moments measured at the load cell (i.e fxLC, the load cell
force in the x-direction, mxLC the load cell moment about the x-axis) to forces and moments at the
bracket (i.e. fxbracket,, bracket force in x*-direction, mxbracket,, bracket moment about the bracket x*-
axis). The load cell to bracket transformation equation was determined using a transformation
between coordinate frames utilized for robot manipulators [17]. This equation shows that the
8
forces and moments experienced by the bracket depend on the offset of the bracket from the center
of the load cell and the rotation of the bracket relative to the load cell.
Orthodontic Torque Simulator Experiment
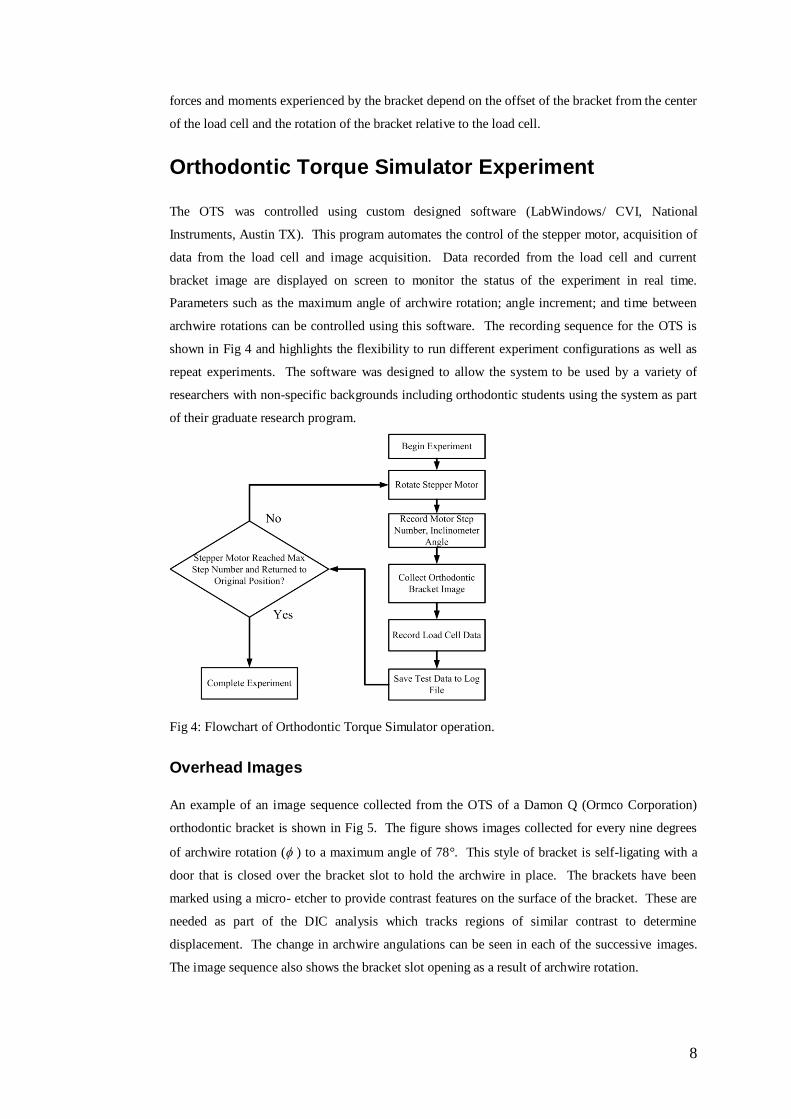
The OTS was controlled using custom designed software (LabWindows/ CVI, National
Instruments, Austin TX). This program automates the control of the stepper motor, acquisition of
data from the load cell and image acquisition. Data recorded from the load cell and current
bracket image are displayed on screen to monitor the status of the experiment in real time.
Parameters such as the maximum angle of archwire rotation; angle increment; and time between
archwire rotations can be controlled using this software. The recording sequence for the OTS is
shown in Fig 4 and highlights the flexibility to run different experiment configurations as well as
repeat experiments. The software was designed to allow the system to be used by a variety of
researchers with non-specific backgrounds including orthodontic students using the system as part
of their graduate research program.
Fig 4: Flowchart of Orthodontic Torque Simulator operation.
Overhead Images
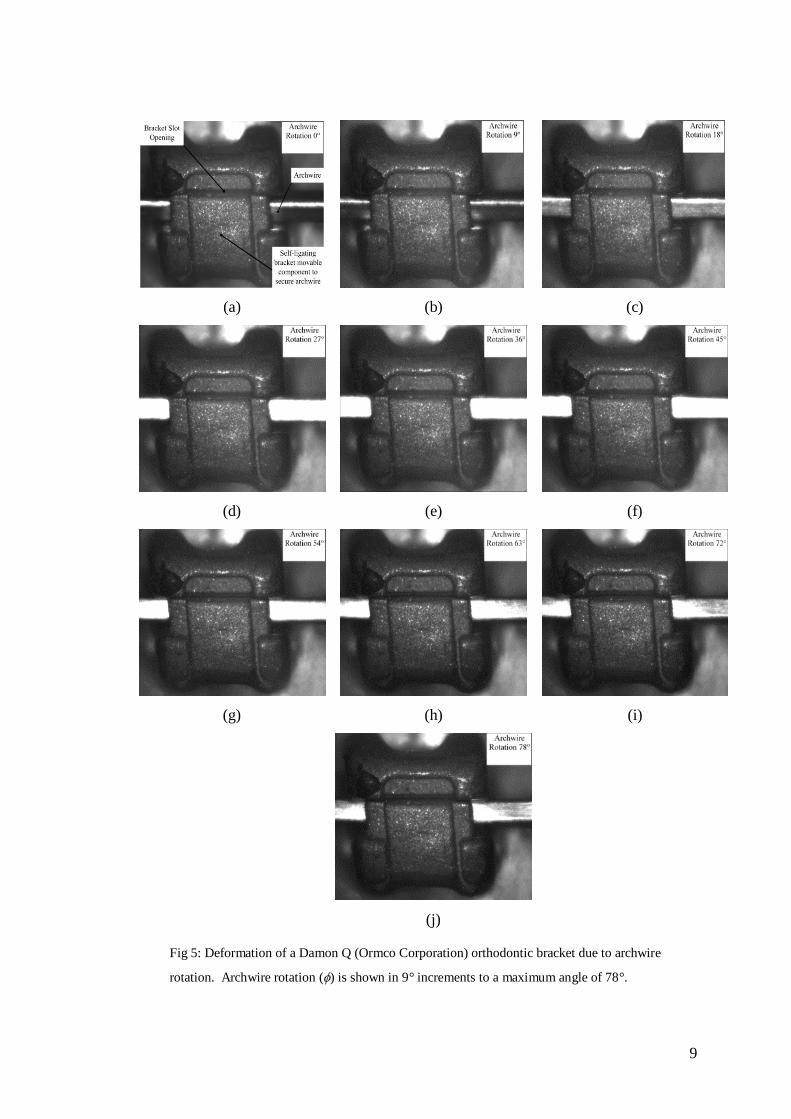
An example of an image sequence collected from the OTS of a Damon Q (Ormco Corporation)
orthodontic bracket is shown in Fig 5. The figure shows images collected for every nine degrees
of archwire rotation ( ) to a maximum angle of 78°. This style of bracket is self-ligating with a
door that is closed over the bracket slot to hold the archwire in place. The brackets have been
marked using a micro- etcher to provide contrast features on the surface of the bracket. These are
needed as part of the DIC analysis which tracks regions of similar contrast to determine
displacement. The change in archwire angulations can be seen in each of the successive images.
The image sequence also shows the bracket slot opening as a result of archwire rotation.
9
(a)
(b)
(c)
(d)
(e)
(f)
(g)
(h)
(i)
(j)
Fig 5: Deformation of a Damon Q (Ormco Corporation) orthodontic bracket due to archwire
rotation. Archwire rotation () is shown in 9° increments to a maximum angle of 78°.

10
A profile image of an orthodontic bracket is shown in Fig 6. Profile images of orthodontic
brackets were examined to show the variability in bracket slot sizes [18]. The main image in the
figure shows a bracket before an archwire has been rotated in the bracket slot using the OTS.
Overlaid on this image is the outline of the same bracket after archwire rotation showing bracket
deformation in the x* and z* directions defined in Fig 1. Fig 6 shows that there is localized
deformation (notching) where the archwire contacts the bracket slot. Archwire rotation and the
torque caused by its rotation can result in both elastic and plastic deformation to the orthodontic
bracket tie wings [6]. Deformation of the orthodontic brackets can alter how the bracket behaves
due to archwire rotation. An understanding of bracket deformation is necessary to ensure that the
desired amount of force is applied to a tooth [7].
Fig 6: Profile image of an orthodontic bracket showing the original bracket and the outline of a
deformed bracket.
Measured Bracket Force/ Moment
In addition to collecting images of orthodontic brackets for successive archwire wire rotation, load
cell data is also collected. Load cell data was synchronized with the acquired bracket images
allowing for bracket deformation and applied moment to be compared. The measurement that is
of most interest to practitioners is the amount of torque applied to the orthodontic bracket caused
by pure archwire rotation (mxbracket). Load cell data for a typical 0.019 × 0.025” stainless steel wire
(Ormco Corporation) archwire and a self-ligating Damon Q (Ormco Corporation, Orange,
California, USA) bracket-archwire combination is shown in Fig 7 for the determined forces and
moments respectively. The need for the bracket / load cell transformation as illustrated in Fig 3 is
required to determine the forces and moments that occur at the bracket instead of at the load cell.
The computed transformed forces and moments are also plotted in Fig 7 for comparison with raw
data.
Measurement of a test bracket has been performed to illustrate the force/torque conversion and the
propagation of errors that result from this transformation [19]. Measurements of the test bracket
offset from the load cell are show in Table 2. Several sources of uncertainty have been identified
which will contribute to the errors associated with the load cell/ bracket transformation, including
the load cell force fxLC, fyLC, fzLC; load cell moment mxLC, myLC, mzLC; bracket offset Δx, Δy, Δz and

11
bracket angular offset θ measurement. The uncertainty for the load cell measurements are show in
Table 1. Also the FaroARM uncertainty which were used to calculate the bracket/ load cell offset
listed in Table 2. Error propagation analysis was carried out in order to account for the uncertainty
in the load cell / bracket transformation. Equation 2 shows that the load cell / bracket
transformation is a function of Δx, Δy, Δz θ, fxLC, fyLC, fzLC, mxLC, myLC, and mzLC. Equation 2 also
shows that the uncertainty in the load cell / bracket transformation is a function of the uncertainty
of the offset of the bracket from the load cell (Δx, Δy, Δz, θ) and the uncertainty in the load cell
measurement (fxLC, fyLC, fzLC, mxLC, myLC, mzLC). The individual uncertainties were used to find the
total uncertainty in the load cell / bracket transformation.
zLCyLCxLCzLCyLCxLCbracket mmmfffzyxfF ,,,,,,,,,
zLCyLCxLCzLCyLCxLCbracket mmmfffzyxF uuuuuuuuuufu ,,,,,,,,,
(2)
n
bracketbracket
n
bracketbracket
F
x
F
x
F
x
F
x
F
mm
n
bracket
1
1
1
6,2,1;10,2,1 mn
2/1
1
2
,
n
i
FFFibracketimbracketmbracket
uu 6,2,1;10,2,1 mn
Table 2: Bracket offset from load cell measurements and uncertainty.
Measurement Measured Offset Uncertainty
Δx -0.4047mm ±0.018mm
Δy 0.7673mm ±0.018mm
Δz 17.650mm ±0.018mm
θ 3° ±0.5°
The maximum measurement uncertainty for the measured bracket forces and moments are
summarized in Table 3. The uncertainty for the bracket forces and moments was determined by
performing an error propagation analysis based on the ASME Power Test Codes (PTC) 19.1 Test
Uncertainty test standard discussed in [19]. The uncertainty in the bracket moment mxbracket is
indicated by error bars in Fig 8. The value of mxbracket is the main focus of the OTS measurement
system. This value represents the measured moment that has been applied to the bracket due to
archwire rotation. The OTS is designed to apply a pure rotation to the orthodontic bracket. In
orthodontic pure archwire rotation is known as torque expression [20]. The measured load cell
data shows that the magnitude of torque is largest about the x*-axis this can be seen in Fig 7(b).

12
Fig 8 shows changes in applied torque during a loading-unloading cycle, which indicate permanent
deformation in the bracket.
Table 3: Maximum bracket force and torque measurement uncertainty
Max
mxbracket
Uncertainty
Max
mybracket
Uncertainty
Max
mzbracket
Uncertainty
Max fxbracket
Uncertainty
Max fybracket
Uncertainty
Max fzbracket
Uncertainty
(%) (%) (%) (%) (%) (%)
1.44 2.79 2.33 2.18 1.17 1.45
Fig 7: Load cell transformation showing transformed and measured forces and moments , (a)
transformed and measured force (fx,fy,fz). (b) transformed and measured moments (mx,my,mz).

13
Fig 8: Load cell transformation showing transformed and measured mx as well as effect of
increasing and decreasing archwire rotation. Error bars are shown to demonstrate the uncertainty
in the mxbracket measurement.
The magnitude of force applied to the bracket as well as mybracket and mzbracket are small compared to
mxbracket as shown in Fig 7. While mxbracket is the dominate and intentional moment introduced into
the system, measured values for the other moments, mybracket and mzbracket are due to variations in the
bracket slot dimensions and the ability to visually align the bracket slot with the archwire. The
measured moment mybracket shows a distinct change at an angles of 48° and 51°. This change can
also be seen in Fig 9, a detailed set of images about the angle where there is a shift in the position
of the bracket. At these angles the corner of the archwire begins to engage the archwire retention
component and apply a load to in the z*-direction of the bracket thus causing a sharp change in the
measured moment mybracket and a sharp change also occurs to the measured force fxbracket. This
relaxes with increased rotation of the archwire and is believed to be a result of the archwire
repositioning within the slot. Additionally, all forces measured by the load cell are small with
respect to the applied moment (mxbracket). Fig 7 (b) shows that typical forces measured by the load
cell range between -2.5 and 1.5N. The measured moment mxbracket will be used to along with the
digital image processing method to better describe the bracket/archwire interaction.
14
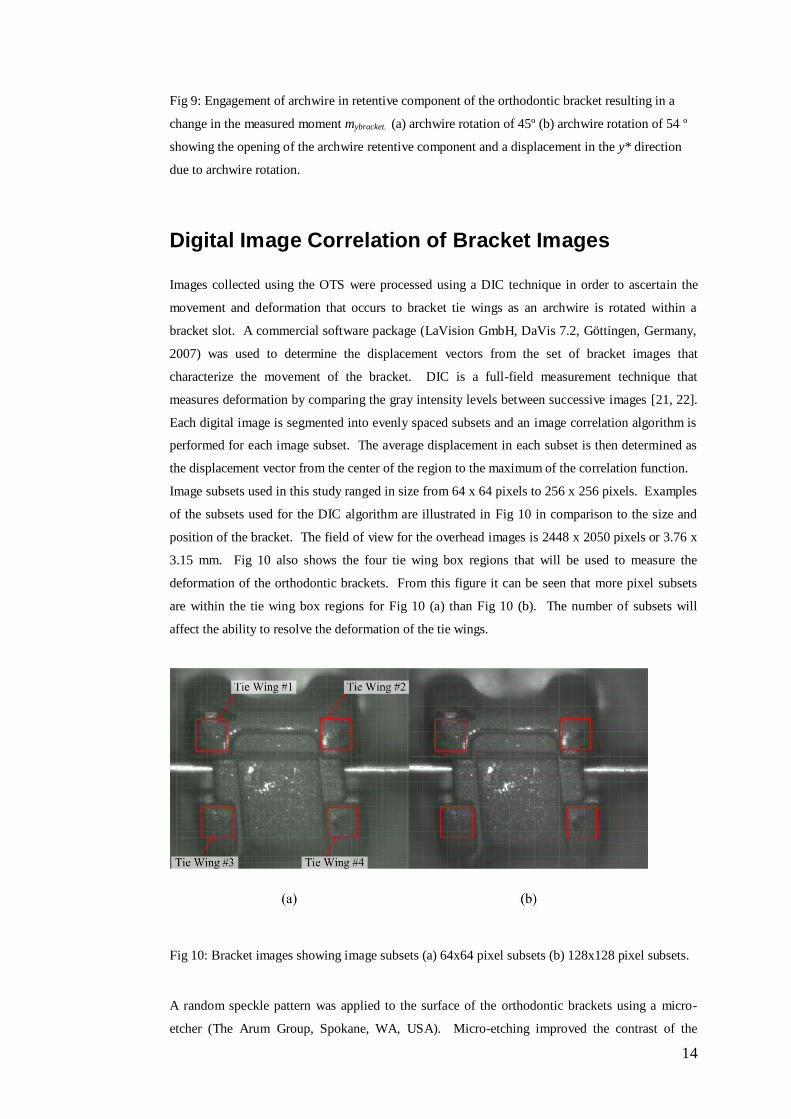
Fig 9: Engagement of archwire in retentive component of the orthodontic bracket resulting in a
change in the measured moment mybracket. (a) archwire rotation of 45º (b) archwire rotation of 54 º
showing the opening of the archwire retentive component and a displacement in the y* direction
due to archwire rotation.
Digital Image Correlation of Bracket Images
Images collected using the OTS were processed using a DIC technique in order to ascertain the
movement and deformation that occurs to bracket tie wings as an archwire is rotated within a
bracket slot. A commercial software package (LaVision GmbH, DaVis 7.2, Göttingen, Germany,
2007) was used to determine the displacement vectors from the set of bracket images that
characterize the movement of the bracket. DIC is a full-field measurement technique that
measures deformation by comparing the gray intensity levels between successive images [21, 22].
Each digital image is segmented into evenly spaced subsets and an image correlation algorithm is
performed for each image subset. The average displacement in each subset is then determined as
the displacement vector from the center of the region to the maximum of the correlation function.
Image subsets used in this study ranged in size from 64 x 64 pixels to 256 x 256 pixels. Examples
of the subsets used for the DIC algorithm are illustrated in Fig 10 in comparison to the size and
position of the bracket. The field of view for the overhead images is 2448 x 2050 pixels or 3.76 x
3.15 mm. Fig 10 also shows the four tie wing box regions that will be used to measure the
deformation of the orthodontic brackets. From this figure it can be seen that more pixel subsets
are within the tie wing box regions for Fig 10 (a) than Fig 10 (b). The number of subsets will
affect the ability to resolve the deformation of the tie wings.
Fig 10: Bracket images showing image subsets (a) 64x64 pixel subsets (b) 128x128 pixel subsets.
A random speckle pattern was applied to the surface of the orthodontic brackets using a micro-
etcher (The Arum Group, Spokane, WA, USA). Micro-etching improved the contrast of the

15
bracket images which has an important effect of the strength and shape of the resultant correlation
peak used to determine movement in successive images. A comparison between a bracket with
and without speckling is shown in Fig 11. This figure also shows the corresponding correlation
peak for the brackets with and without speckling. From this figure it is evident that a pronounced
correlation peak exists for the micro-etched bracket whereas the correlation peak for the bracket
without micro-etching is not as distinct. The DIC algorithm will calculate a peak maximum which
represents the average displacement within the image subset. A peak detection algorithm is used
to locate that maximum within the cross-correlation function and its location within the 2-D
function is the magnitude and direction of movement. Examples of the correlation peak generated
from the cross correlation algorithm are shown in Fig 11 (c) and (d). The pronounced correlation
peak in Fig 11(d) shows that a strong correlation can be found between bracket image frame (i)
and (i + 1) which can be easily be detected by the peck detection section of the DIC system.
Conversely, a strong correlation peak does not exist for the bracket image shown in Fig 11(a) [23]
where similar high intensity light values measured by the CCD over a majority of the bracket due
to its high reflection broaden the correlation peck. Image data of this type can skew the position of
the maximum correlation resulting in a false peak detection that does not represent average
movement within the subset. Therefore, all brackets which were examined using the OTS were
micro-etched prior to testing. Several processing schemes [21, 22] are available that can be used
to improve the accuracy of the DIC algorithm. These algorithms allow for subset window off-set
as well as single / multiple pass approaches. The effect of subset window offset and single/
multiple pass approaches are discussed below.
Fig 11: Preparation of orthodontic brackets (a) Bracket without micro-etching (b) Bracket with
micro-etching. (c) Correlation peak for bracket without micro- etching (d) Correlation peak for
bracket with micro- etching.

16
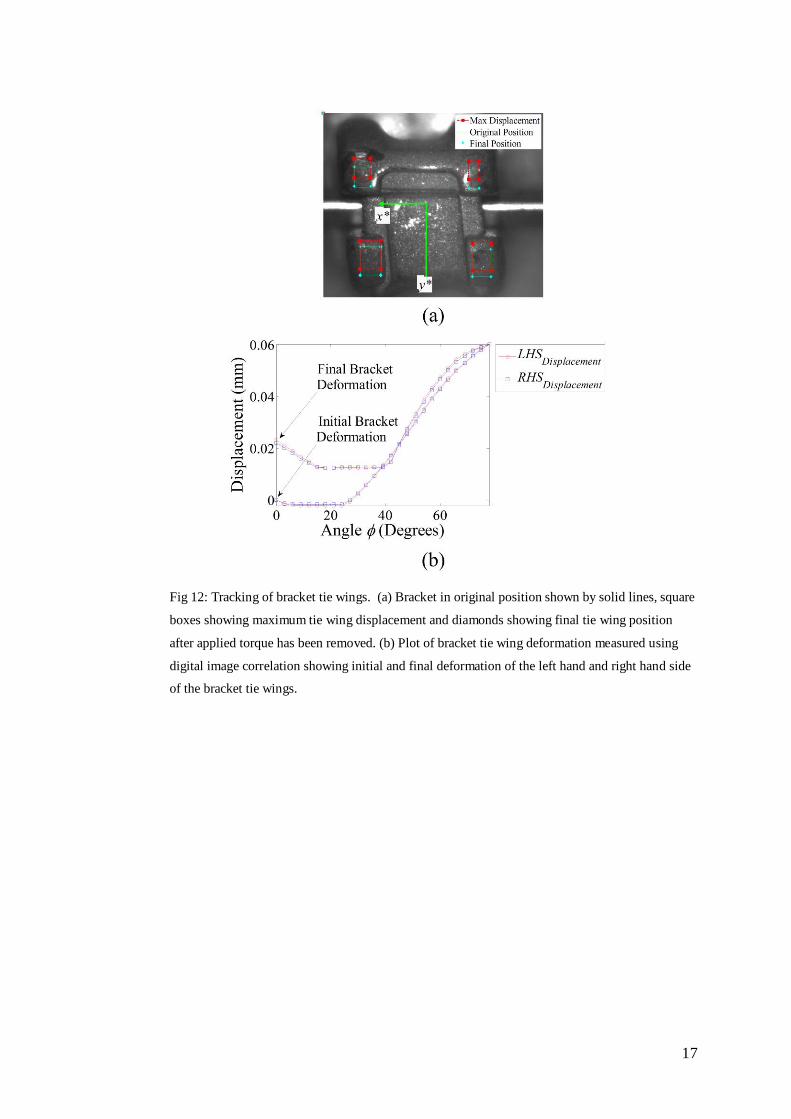
Bracket tie wing separation was investigated by tracking a defined region for each tie wing as
shown in Fig 12(a). The initial region for each tie wing is shown in the figure as a clean box. The
measured displacement in the y*-direction was determined by averaging the displacement results
for the smaller subsets within the defined regions shown in the figure. As the archwire is rotated
within the bracket slot relative motion exists between tie wings. Additionally, bulk motion is
observed as the entire bracket moves due to the applied loads from archwire rotation and
relaxation of the support cylinder within the support adaptor. The maximum movement of the
bracket tie wings is shown in Fig 12(a) by the position of the boxes with solid squares. Once the
archwire reaches the prescribed maximum angle the archwire rotates back to the start position.
The final position of the bracket tie wings is shown by the boxes with closed diamonds where it
can be seen that the final position of the tie wings is slightly offset from the original position
indicating permanent bracket deformation has occurred. The change in average displacement in
the y* direction between the top left and bottom left boxes for Tie Wing #1 and Tie Wing #3 as
well as the top right and bottom right brackets of Tie Wing #2 and Tie Wing #4 was used to
determine the deformation of the orthodontic brackets this can be seen in Fig 12(b). This figure
shows the difference between the average displacement of Tie Wing #1 and Tie Wing #3 that
occurred between these two tie wings in the y*-direction and is denoted as LHSDisplacement.
Similarly the average displacement of Tie-Wing#2 and Tie Wing #4 is denoted as RHSDisplacement.
Fig 12(b) shows that there is both hysteresis and permanent deformation occurred to the bracket
due to archwire rotation. Fig 12(b) also shows the result for the displacement of the left and hand
right hand tie wing displacement are similar therefore only the LHSDisplacement will be used for the
remainder of this discussion to compare the deformation of brackets of varying geometry.
Equation (3 details the calculation of the bracket tie wing displacement in the y* direction. In this
equation TieWingntDisplaceme denotes the average displacement of the defined regions for Tie
Wings 1, 2, 3 and 4 in the y* direction.
31 TieWingTieWingntDisplaceme ntDisplacementDisplacemeLHS
42 TieWingTieWingntDisplaceme ntDisplacementDisplacemeRHS (3)
17
Fig 12: Tracking of bracket tie wings. (a) Bracket in original position shown by solid lines, square
boxes showing maximum tie wing displacement and diamonds showing final tie wing position
after applied torque has been removed. (b) Plot of bracket tie wing deformation measured using
digital image correlation showing initial and final deformation of the left hand and right hand side
of the bracket tie wings.

18
DIC Method Sources of Error
There are a number of potential sources of error that exist when using a DIC technique. Errors can
result from either the measurement devices or due to factors associated with the DIC processing
technique [24]. Examples of measurement device errors are the lighting quality, optical lens
distortion and test specimen out-of-plane motion. Errors related to the correlation technique are
speckle pattern quality, subset size and correlation algorithm used.
The errors associated with the DIC technique were quantified by collecting an image of a bracket
from the OTC and then applying artificial displacements to the digital image with a custom
program (The MathWorks, Inc., Matlab, Natick, MA, USA). The images were artificially
displaced in increments of 1 pixel (1.538 μm) to a maximum displacement of 20 pixels (30.76
μm). This method is commonly used to quantify errors associated with the digital image
correlation process [24-26]. A Damon Q (Ormco Corporation, Orange, ;California, USA) bracket
was used to assess the accuracy of the digital image correlation process.
The artificial displacement technique allows for the assessment of the digital image correlation
algorithm, image subset size and quality of the speckle pattern. The overhead images collected
were processed using a commercial code (LaVision GmbH DaVis 7.4. Gottingen, Germany;
2007). The resolution of the DIC process depends on the size of interrogation window used as
shown in Fig 10, magnification of the image, speckle pattern and lighting. The measurement
resolutions for the case investigated are shown in Table 4 [27].
19
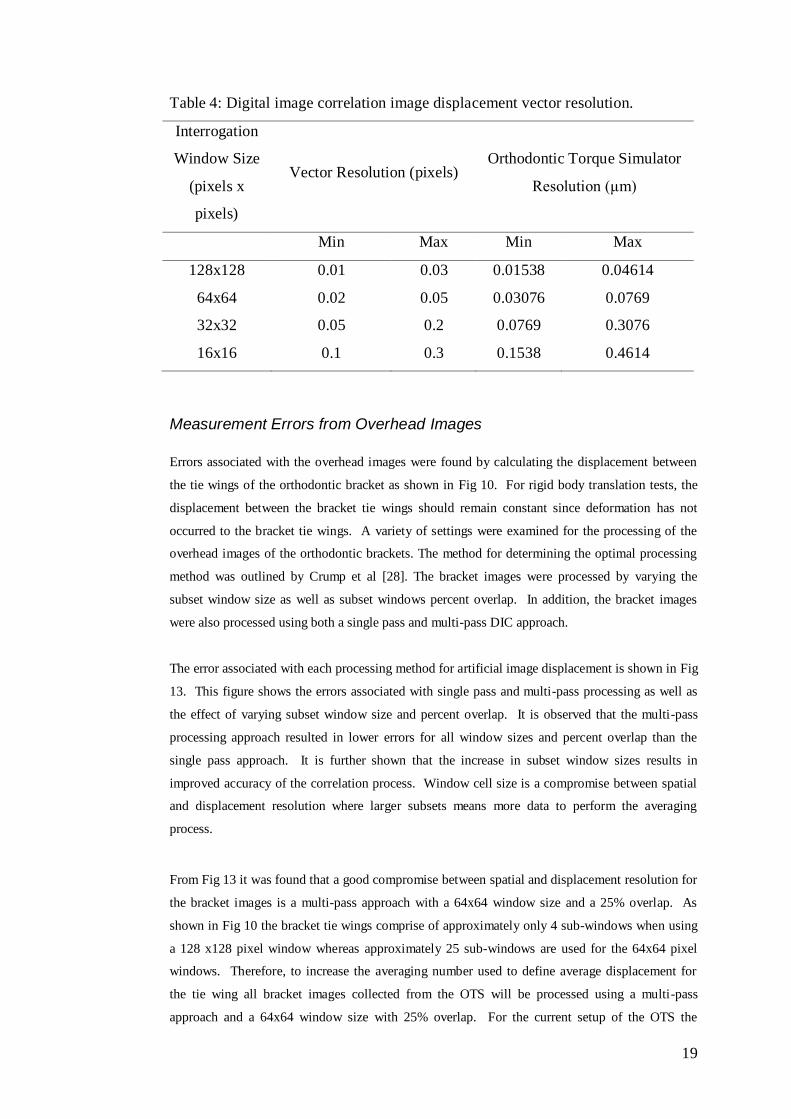
Table 4: Digital image correlation image displacement vector resolution.
Interrogation
Window Size
(pixels x
pixels)
Vector Resolution (pixels) Orthodontic Torque Simulator
Resolution (μm)
Min Max Min Max
128x128 0.01 0.03 0.01538 0.04614
64x64 0.02 0.05 0.03076 0.0769
32x32 0.05 0.2 0.0769 0.3076
16x16 0.1 0.3 0.1538 0.4614
Measurement Errors from Overhead Images
Errors associated with the overhead images were found by calculating the displacement between
the tie wings of the orthodontic bracket as shown in Fig 10. For rigid body translation tests, the
displacement between the bracket tie wings should remain constant since deformation has not
occurred to the bracket tie wings. A variety of settings were examined for the processing of the
overhead images of the orthodontic brackets. The method for determining the optimal processing
method was outlined by Crump et al [28]. The bracket images were processed by varying the
subset window size as well as subset windows percent overlap. In addition, the bracket images
were also processed using both a single pass and multi-pass DIC approach.
The error associated with each processing method for artificial image displacement is shown in Fig
13. This figure shows the errors associated with single pass and multi-pass processing as well as
the effect of varying subset window size and percent overlap. It is observed that the multi-pass
processing approach resulted in lower errors for all window sizes and percent overlap than the
single pass approach. It is further shown that the increase in subset window sizes results in
improved accuracy of the correlation process. Window cell size is a compromise between spatial
and displacement resolution where larger subsets means more data to perform the averaging
process.
From Fig 13 it was found that a good compromise between spatial and displacement resolution for
the bracket images is a multi-pass approach with a 64x64 window size and a 25% overlap. As
shown in Fig 10 the bracket tie wings comprise of approximately only 4 sub-windows when using
a 128 x128 pixel window whereas approximately 25 sub-windows are used for the 64x64 pixel
windows. Therefore, to increase the averaging number used to define average displacement for
the tie wing all bracket images collected from the OTS will be processed using a multi-pass
approach and a 64x64 window size with 25% overlap. For the current setup of the OTS the

20
measurement resolution is 0.0769μm (Table 4) since an interrogation window of 64x64 was used
for the processing of the overhead bracket images. The maximum error found for the multi-pass
approach for a window size of 64x64 with a 25% overlap was 0.09% whereas the maximum error
for the single pass approach was 0.23%.
Fig 13: Effect of window size on overhead images with artificial displacement (a) Single pass
processing (b) Multi pass processing.
Using the defined regions shown in Fig 12, the bracket tie-wing displacement results for 30
Damon Q brackets measured using the OTS is shown in Fig 14 (a). Shown in Fig 14 (b) is the
average deformation and computed standard deviations for the same 30 Damon Q brackets tested
with the OTS. This figure shows the large variation that exists between brackets. The orthodontic
bracket tie wing displacement as the archwire is rotated in the bracket slot is shown in Fig 14(c).
This figure shows the displacement of the bracket tie wings for a single Damon Q bracket as well
as error bars indicating the uncertainty in the DIC technique. It can be seen that permanent
deformation occurred to all the orthodontic brackets since the initial and final tie wing
displacement are not the same. The important observation from these figures is that the uncertainty
from the optical measurement method is significantly less than the variability found between
individual brackets.

21
0 20 40 60 80-0.02
0
0.02
0.04
0.06
0.08
Angle (Degrees)
Dis
pla
cem
ent
(mm
)
(a)
0 20 40 60 80-0.02
0
0.02
0.04
0.06
0.08
Angle (Degrees)Av
erag
e D
isp
lace
men
t (m
m)
(b)
0 20 40 60 80-0.02
0
0.02
0.04
0.06
0.08
Angle (Degrees)
Dis
pla
cem
ent
(mm
)
(c)
Fig 14: Orthodontic bracket displacement results (a) Bracket displacement plots for all 30 brackets
(b) Average of multiple bracket displacement results showing standard deviation for the 30
brackets. (c) Single bracket displacement showing error bars resulting from DIC accuracy
Orthodontic Bracket Comparison
Two orthodontic brackets of different geometry were compared to exhibit the difference seen for
bracket deformation and moment applied due to archwire rotation using the OTS. The brackets
were compared to demonstrate the measurement capability of the OTS and to show how varying
bracket geometry affects bracket deformation. Both brackets were tested using a 0.4826x0.635mm
(0.019 × 0.025”) stainless steel wire. Both brackets are maxillary right incisor (U1R) with a

22
nominal slot width of 0.5588mm (0.022”). Shown in Fig 15 are the Damon Q and Speed brackets
used for this comparison. From this figure the difference in bracket geometry can be readily seen.
Both brackets are self-ligating meaning that no elastic ligature or steel ties are required to hold the
archwire in the bracket slot. The two brackets were examined to demonstrate the results produced
by the OTS and to show how brackets of different design can be compared using this device. The
measured offsets of the brackets from the load cell are summarized in Table 5.
Table 5: Measured bracket offset from load cell
Bracket Δx (mm) Δy (mm) Δz (mm) θ (degrees)
Damon -0.6203 0.7399 17.69 3
Speed -0.4189 0.798 17.65 2
Fig 15: Comparison of Damon Q (a) and Speed (b) self- ligating orthodontic brackets
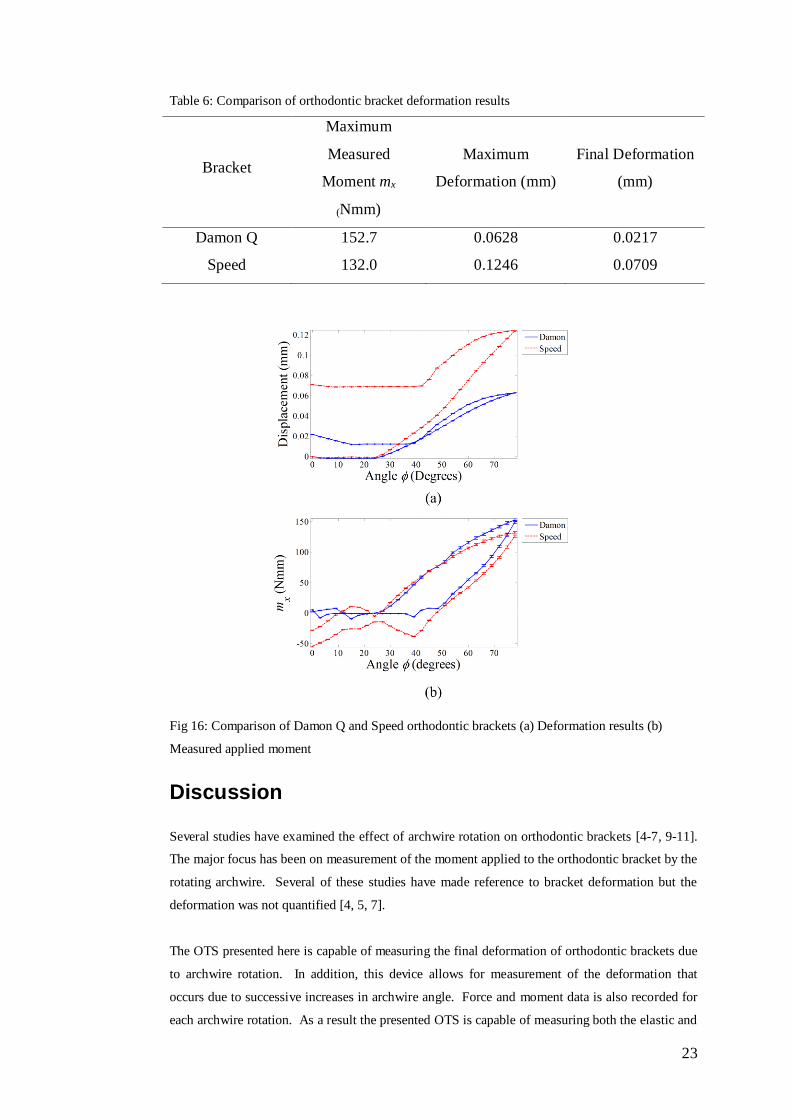
The results from the OTS to compare the Damon Q (Ormco Corporation, Glendora, California,
USA) and Speed (Strite Industries, Cambridge, Ontario, Canada) brackets are shown in Fig 16 for
two individual brackets of this type. Fig 16(a) compares the deformation of the bracket tie wings 1
and 3 of the two brackets while Fig 16(b) shows the measured moment, mxbracket applied to the
brackets. From this figure it can be seen that a similar applied moment results in different
deformation for the two brackets. Both brackets begin to displace and transmit load at a similar
archwire angular position of ~ 25. Torque loading and relative tie wing displacement are non-
linear up to maximum archwire rotation. The relative tie wing displacement of the Speed bracket
is approximately double that of the Damon Q but transmits ~10% less torque at maximum
archwire rotation. Hysteresis is present for both relative tie wing displacement and transmitted
torque for both brackets. Summarized in Table 6 is the maximum measured moment for the two
brackets as well as the maximum and final bracket deformation. The final position of the tie wings
of the two brackets also shows that the Speed bracket exhibited greater plastic deformation than
the Damon Q bracket. Fig 16 and Table 6 demonstrate that the maximum deformation of the
Damon Q bracket is 3.2 times less than the Speed bracket. Additionally, the error bars associated
with the optical measurement and error from the load cell transformation are shown with the
results in Fig 16. These two figures show that the measurement uncertainty from the OTS is small
compared to the difference seen in the deformation and measured moment of the two brackets.
23
Table 6: Comparison of orthodontic bracket deformation results
Bracket
Maximum
Measured
Moment mx
(Nmm)
Maximum
Deformation (mm)
Final Deformation
(mm)
Damon Q 152.7 0.0628 0.0217
Speed 132.0 0.1246 0.0709
Fig 16: Comparison of Damon Q and Speed orthodontic brackets (a) Deformation results (b)
Measured applied moment
Discussion
Several studies have examined the effect of archwire rotation on orthodontic brackets [4-7, 9-11].
The major focus has been on measurement of the moment applied to the orthodontic bracket by the
rotating archwire. Several of these studies have made reference to bracket deformation but the
deformation was not quantified [4, 5, 7].
The OTS presented here is capable of measuring the final deformation of orthodontic brackets due
to archwire rotation. In addition, this device allows for measurement of the deformation that
occurs due to successive increases in archwire angle. Force and moment data is also recorded for
each archwire rotation. As a result the presented OTS is capable of measuring both the elastic and

24
plastic bracket deformation. Both the elastic and plastic deformation of the orthodontic brackets
should be understood since both deformations result in energy lost to the deformation of the
orthodontic bracket rather than causing tooth movement. Additionally, the OTS is capable of
measuring the forces and moments applied to the orthodontic bracket using a 6-axis load cell.
Since load cell measurement and images of the bracket are taken simultaneously The OTS data can
be used to match these two measurements.
Two orthodontic brackets were compared to demonstrate how results from the OTS can be used to
compare brackets of varying make and geometry. This comparison shows that the maximum and
final deformation of the Damon Q brackets is less than the Speed bracket for the same amount of
archwire rotation. As well, 30 brackets of the design Damon Q were analyzed to show that the
variability in the orthodontic brackets is much greater than the measurement uncertainty of this
device.
Conclusions
It was demonstrated that the OTS was been designed to measure the forces and moments applied
to orthodontic brackets. The maximum bracket force and moment measurement uncertainty are
significantly less than both the range of movement and torques expected and the observed
variability within the bracket design. This device is also capable of measuring the displacement of
the orthodontic bracket tie-wings due to archwire rotation within 0.09% error. Two sample
orthodontic brackets were compared to demonstrate how this device can be used to compare
brackets of varying geometry. From this comparison presented it was found that maximum
deformation of the Damon Q bracket is 3.2 times less than the Speed bracket for similar
magnitudes of applied moment. An understanding of the elastic and plastic deformation that
occurs to brackets is critical to clinicians since brackets are selected for treatment based on the
advertised prescription the particular bracket provides to apply torques to tooth crown. Bracket
deformations can alter the geometry of the bracket slot which can affect the efficiency of the
treatment. Knowledge of bracket deformation will allow clinicians to select brackets based on the
expected deformation that will occur or to adjust the treatment regime to compensate for bracket
deformation.
References
[1] W. R. Proffit, H. W. Fields and D. M. Sarver, Contemporary Orthodontics. St.
Louis, Mo.: Mosby Elsevier, 2007.
[2] F. R. Beckwith, R. J. Ackerman Jr., C. M. Cobb and D. E. Tira, "An
evaluation of factors affecting duration of orthodontic treatment." Am. J. Orthod.
Dentofacial Orthop., vol. 115, pp. 439-447, 1999.
25
[3] R. Nanda and A. Kuhlberg, "Principles of biomechanics," in Biomechanics in
Clinical Orthodontics, R. Nanda, Ed. Philadelphia, PA: Saunders, 1997, pp. 1-20.
[4] H. Gmyrek, C. Bourauel, G. Richter and W. Harzer, "Torque capacity of metal
and plastic brackets with reference to materials, application, technology and
biomechanics," Journal of Orofacial Orthopedics, vol. 63, pp. 113-128, 2002.
[5] R. Sadat-Khonsari, A. Moshtaghy, V. Schlegel, B. Kahl-Nieke, M. Möller and
O. Bauss, "Torque deformation characteristics of plastic brackets: A comparative
study," Journal of Orofacial Orthopedics, vol. 65, pp. 26-33, 2004.
[6] R. Kapur, P. K. Sinha and R. S. Nanda, "Comparison of load transmission and
bracket deformation between titanium and stainless steel brackets." Am. J. Orthod.
Dentofacial Orthop., vol. 116, pp. 275-278, 1999.
[7] D. A. Flores, L. K. Choi, J. M. Caruso, J. L. Tomlinson, G. E. Scott and M. T.
Jeiroudi, "Deformation of metal brackets: a comparative study." Angle Orthod.,
vol. 64, pp. 283-290, 1994.
[8] J. C. Feldner, N. K. Sarkar, J. J. Sheridan and D. M. Lancaster, "In vitro
torque-deformation characteristics of orthodontic polycarbonate brackets,"
American Journal of Orthodontics and Dentofacial Orthopedics, vol. 106, pp.
265-272, 9, 1994.
[9] H. M. Badawi, R. W. Toogood, J. P. R. Carey, G. Heo and P. W. Major,
"Torque expression of self-ligating brackets," American Journal of Orthodontics
and Dentofacial Orthopedics, vol. 133, pp. 721-728, 2008.
[10] T. R. Meling, J. Odegaard and E. O. Meling, "On mechanical properties of
square and rectangular stainless steel wires tested in torsion." Am. J. Orthod.
Dentofacial Orthop., vol. 111, pp. 310-320, 1997.
[11] J. Odegaard, T. Meling and E. Meling, "An evaluation of the torsional
moments developed in orthodontic applications. An in vitro study." Am. J.
Orthod. Dentofacial Orthop., vol. 105, pp. 392-400, 1994.
[12] R. Lacoursiere, D. Nobes, D. Homeniuk, J. P. Carey, H. Badawi and P. W.
Major. Measurement of orthodontic bracket tie wing elastic and plastic
deformation by arch wire torque expression utilizing an optical image correlation
technique. Journal of Dental Biomechanics vol. 2010(Article ID 397037), 2010.
[13] T. W. Major, J. P. Carey, D. S. Nobes, G. Heo, G. W. Melenka and P. W.
Major, "An investigation into the mechanical characteristics of select self-ligated
brackets at a series of clinically relevant maximum torquing angles: loading and
unloading curves and bracket deformation," Eur. J. Orthod., Jul 12, 2011.
[14] G. W. Melenka, R. A. Lacoursiere, J. P. Carey, D. S. Nobes, G. Heo and P.
W. Major, "Comparison of deformation and torque expression of the orthos and
orthos Ti bracket systems," Eur. J. Orthod., Oct 19, 2011.
[15] W. A. Brantley and T. Eliades, "Orthodontic brackets," in Orthodontic
Materials: Scientific and Clinical Aspects, W. A. Brantley and T. Eliades, Eds.
New York: Thieme, 2001, pp. 144-147,165.

26
[16] V. Jayade, S. Annigeri, C. Jayade and P. Thawani, "Biomechanics of torque
from twisted rectangular archwires," Angle Orthod., vol. 77, pp. 214-220, 2007.
[17] R. P. Paul, Robot Manipulators: Mathematics, Programming, and Control:
The Computer Control of Robot Manipulators. Cambridge, Mass: MIT Press,
1981.
[18] T. W. Major, J. P. Carey, D. S. Nobes and P. W. Major, "Orthodontic Bracket
Manufacturing Tolerances and Dimensional Differences between Select Self-
Ligating Brackets," J. Dent. Biomech., vol. 2010, pp. 781321, Jun 27, 2010.
[19] R. S. Figliola, "Uncertainty analysis," in Theory and Design for Mechanical
Measurements, 5th ed.Anonymous Hoboken, NJ: John Wiley & Sons, 2011, pp.
161.
[20] J. A. Wagner and R. J. Nikolai, "Stiffness of incisor segments of edgewise
arches in torsion and bending." Angle Orthod., vol. 55, pp. 37-50, 1985.
[21] M. A. Sutton, J. J. Orteu and H. W. Schreier, Image Correlation for Shape,
Motion and Deformation Measurements : Basic Concepts, Theory and
Applications. New York, N.Y: Springer, 2009.
[22] B. Pan, K. Qian, H. Xie and A. Asundi, "Two-dimensional digital image
correlation for in-plane displacement and strain measurement: A review," Meas
Sci Technol, vol. 20, 2009.
[23] M. Raffel, C. Willert, S. Wereley and J. Kompenhans, "Mathematical
background of statistical
PIV evaluation," in Particle Image Velocimetry : A Practical Guide, 2nd
ed.Anonymous New York: Springer, 2007, pp. 79.
[24] H. Haddadi and S. Belhabib, "Use of rigid-body motion for the investigation
and estimation of the measurement errors related to digital image correlation
technique," Optics and Lasers in Engineering, vol. 46, pp. 185-196, 2008.
[25] T. C. Chu, W. F. Ranson and M. A. Sutton, "Applications of digital-image-
correlation techniques to experimental mechanics," Exp. Mech., vol. 25, pp. 232-
244, 1985.
[26] F. Hild and S. Roux, "Digital image correlation: From displacement
measurement to identification of elastic properties - A review," Strain, vol. 42, pp.
69-80, 2006.
[27] LaVision GmbH, "Product-Manual for DaVis 7.2 StrainMaster 2D Item-
Number(s): 1105021," .
[28] D. A. Crump, J. M. Dulieu-Barton and J. Savage, "Design and commission of
an experimental test rig to apply a full-scale pressure load on composite sandwich
panels representative of an aircraft secondary structure," Measurement Science
and Technology, vol. 21, 2010.