design of a localization-based collision avoidance system
TRANSCRIPT

Chalmers University of Technology
University of Gothenburg
Department of Computer Science and Engineering
Göteborg, Sweden, April 2013
Design of A Localization-Based Collision Avoidance
System For Wireless Car
Master of Science Thesis
ALIREZA DAVOUDAIN

ii
The Author grants to Chalmers University of Technology and University of Gothenburg the
non-exclusive right to publish the Work electronically and in a non-commercial purpose
make it accessible on the Internet.
The Author warrants that he/she is the author to the Work, and warrants that the Work does
not contain text, pictures or other material that violates copyright law.
The Author shall, when transferring the rights of the Work to a third party (for example a
publisher or a company), acknowledge the third party about this agreement. If the Author has
signed a copyright agreement with a third party regarding the Work, the Author warrants
hereby that he/she has obtained any necessary permission from this third party to let
Chalmers University of Technology and University of Gothenburg store the Work
electronically and make it accessible on the Internet.
Design of A Localization-Based Collision Avoidance System For Wireless Car
ALIREZA DAVOUDIAN
© ALIREZA DAVOUDIAN, April 2013.
Examiner: PHILIPPAS TSIGAS
Chalmers University of Technology
University of Gothenburg
Department of Computer Science and Engineering
SE-412 96 Göteborg
Sweden
Telephone + 46 (0)31-772 1000
Department of Computer Science and Engineering
Göteborg, Sweden April 2013

iii
Abstract
In this project, a reliable and inexpensive collision avoidance system was designed for vehicles
traversing roads in high speeds. Miniature wireless cars in an indoor traffic model are used to
simulate real vehicles movements. Several experiments were done to make the car movement reliable.
The selected localization system keeps track of each car’s movement. Each car’s speed and steer is
adjusted by the collision avoidance system, and it is done through sending control commands with
regards to the cars location information obtained from the localization system.

iv
Acknowledgment
I would like to thank my supervisor Elad Michael Schiller whose advice has greatly influenced this
thesis. Without him this would not have been possible. I would also like to thank Mitra Pahlavan,
Kouros Moabber and Amir Tohidi for their valuable feedback, support and discussions as well as my
other friends and classmates who have helped me during my project.

v
Contents
Contents v
Table of Figures vii
1 Introduction 1
Background .............................................................................................................. 1
Purpose ..................................................................................................................... 1
Objectives ................................................................................................................ 1
Outline of the thesis ................................................................................................. 2
2 Model Preparation 3
Vaillante Wi-Fi ........................................................................................................ 3
Experiments ............................................................................................................. 4
First Experiment....................................................................................................... 4
Second experiment ................................................................................................... 7
3 Design of Localization System 8
Introduction .............................................................................................................. 8
TinyOS ..................................................................................................................... 8
MoteTrack ................................................................................................................ 8
Plan ........................................................................................................................ 11
Results .................................................................................................................... 12
4 Car Controller 15
Introduction ............................................................................................................ 15
Plan ........................................................................................................................ 15
Algorithms ............................................................................................................. 17
Design .................................................................................................................... 18
Implementation and results .................................................................................... 20
5 Summary 21
Achievements ......................................................................................................... 21
Limitations ............................................................................................................. 21
Future Work ........................................................................................................... 21
References 22
Appendix A 24

vi
Appendix B 25
Appendix C 26
Appendix D 27

vii
Table of Figures
Fig. 1: Controller application used in smart phones ................................................................. 3
Fig. 2: A snapshot from the packet sniffing process in Wireshark .......................................... 3
Fig. 3: Simple car controller application .................................................................................. 4
Fig. 4: Car experiments room ................................................................................................... 4
Fig. 5: Average angle graph for all cars ................................................................................... 5
Fig. 6: Average distance graph for all cars ............................................................................... 5
Fig. 7: Average H-distance graph for all cars ........................................................................... 6
Fig. 8: Vaillante car movement model ..................................................................................... 6
Fig. 9: Difference between estimation equations and real implementation ............................. 7
Fig. 10: Result of experiment in movement in average graph ................................................. 7
Fig. 11: MicaZ motes ............................................................................................................... 9
Fig. 12: MoteTrack system implementation design ................................................................. 9
Fig. 13: Collected referenced signature database in a file generated after an experiment ..... 10
Fig. 14: Measured area and the placement of MicaZ motes on cardboards ........................... 11
Fig. 15: A scene from bulk loading of reference signatures in the motion hall ..................... 12
Fig. 16: Map of the localization accuracy in different locations. ........................................... 13
Fig. 17: Connections among different parts of controller system in online mode. ................ 16
Fig. 18: Java Program flow .................................................................................................... 19

1
Chapter 1
Introduction
This Chapter first provides some backgrounds behind the topic. After that, purpose and the
objectives of this thesis work is mentioned. This Chapter finishes with the outline of this
thesis.
Background
Providing safety is a challenge that has been an important issue in transportation system
for many decades. Providing some passive safety systems like seatbelts and airbags help to
reduce the effects of the accidents. On the other hand, active safety systems have been
developed so much in recent years. They refer to safety systems that help avoid accidents,
such as good steering and brakes. Some examples for these systems are, Anti-lock braking
system (ABS)[1], Intelligent system adoption[2], Autonomous cruise control system[3] and
collision avoidance that is widely used by automotive car manufacturers like Volvo[4],
Toyota[5], Volkswagen[6] and Ford[7].
Collision avoidance systems in automotive industry usually use radar(or laser)[8] and
camera sensors to implement the designed algorithms. The system can notify the driver,
increase the breaking pressure, or tension the seatbelt to minimize collision impact.
In some projects the localization system provides avoidance of the collisions in the
highways and urban transportation. [9]
Purpose
The purpose of this thesis work is to design a reliable and cost effective collision
avoidance system for vehicles in highways. In such roads, the speed is so high (about 120
km/h) and the decision needs to be taken so quick and the control system should be fast
enough to reduce the risk of collisions.
In this master’s thesis, the designed system must be cost effective and with the minimum
use of peripheral devices. Although, it is supposed that it can be useful for real vehicles in
real transportation environment.
Objectives
The following research questions are formulated based on the purpose of this thesis.
1. How does the indoor wireless system model is designed for this project?

2
2. What localization system should be used that provides cost effectiveness and
accuracy?
3. What safety algorithms are suitable and should be considered for this system?
Outline of the thesis
The next Chapters of this project are designed as follows. Chapter 2 describes the
preparation steps of the wireless miniature car that is used as a model for the project. In
Chapter 3 design of the localization system for this project has been discussed, and in Chapter
4 the safety algorithms and implementation of the controller application to be used for the
designed system is discussed. Finally, the achievements, limitations and future works are
mentioned in Chapter 5.

3
Fig. 1: Controller application used in smart phones
Chapter 2
Model Preparation
In this Chapter, there is an overview on Vaillante Wi-Fi, which is selected for the car
model, and some test experiments over it are discussed.
Vaillante Wi-Fi
To make the designed control system in this project available to be implemented on real
vehicles, it should be tested in a test environment to debug the code and minimize the
potential harms. Since vehicles moving fast in highways, the car model should be able to
simulate moving in highways very well.
For this purpose, Vaillante Wi-Fi produced by Controlbytel[10] was used. The followings
are the specifications of Vaillante:
Length: 258 mm
Width: 177 mm
Weight: 633 g
Power supply: battery Nimh 1200
Speed(max): 30 km/h
Wireless connection: Wi-Fi
Vaillante is designed to work with iPhone and
iPad, and a GUI which can be downloaded from
Apple store, is used to adjust the speed and steer of the car. Since controlling the car using
Smartphone is so hard and not useful for many test cases, the application needs to be
customized to make
The car is like a black box for us
and the network operations and the
commands that are sent between
the server (Vaillante) and the client
(Smartphone) were unknown.
The only known parameter is the
client IP address (i.e. 192.168.3.3).
So another client to the network
was added to monitor packets
which are traversing in the system.
The packet sniffing process was Fig. 2: A snapshot from the packet sniffing process in Wireshark

4
done using Wireshark in a laptop. Using sniffed packets, the commands related to different
speed and steer values were detected. The following attributes were found as well:
Server’s IP (Car): 192.168.3.1 (unchangeable)
Port: 15200 (default)
Transport protocol: UDP
Experiments
Based on the captured data from the network, a
simple application was made to send different
movement commands to the car. In this project
three Vaillante cars were used to assess the car’s
behavior in different speeds and steers.
Steer values are integers ranged from -50 (most
left) to 50 (most right) and speeds are between -50
(most speed for moving back) and 50 (most speed
for moving forward).
First Experiment
In the first experiment, 11 steer values in a constant minimum speed value, which was 7, 8
and 9 for each of cars, were examined.
Experiments were done in a wooden table at the same room using the measurements tools
like ruler and bevel.
Fig. 4: Car experiments room
Fig. 3: Simple car controller application

5
The following graphs achieved from the experiments, and based on the calculations the
angle can be modeled as a linear function, while graphs for distances in different angles are
slightly different from quadratic equations graphs.
Fig. 5: Average angle graph for all cars
Fig. 6: Average distance graph for all cars
y = -3E-05x5 + 0,000x4 + 0,003x3 - 0,053x2 + 4,956x - 12,99
y = -0,000x5 + 0,002x4 + 0,014x3 - 0,272x2 + 4,003x - 13,86
y = -2E-05x6 + 0,000x5 + 0,003x4 - 0,019x3 - 0,188x2 + 4,851x -19,15
-80
-60
-40
-20
0
20
40
60
-15 -10 -5 0 5 10 15
Average angle
Car3
Car2
Car1
Steer val.
y = -0,000x5 + 0,002x4 + 0,055x3 - 0,855x2 + 1,803x + 205,3
y = -0,230x2 + 2,122x + 220,6
y = -0,486x2 + 3,883x + 207,3
0
50
100
150
200
250
-15 -10 -5 0 5 10 15
Average distance
Car3
Car2
Car1

6
Fig. 7: Average H-distance graph for all cars
Distance and H-distance are measured with regard to the calculations shown in Figure 8.
y = 0,018x3 - 0,130x2 - 13,61x + 36,19
y = 0,010x3 + 0,023x2 - 11,53x + 49,87
y = 0,014x3 - 0,308x2 - 12,69x + 58,35-150
-100
-50
0
50
100
150
200
-15 -10 -5 0 5 10 15
Average H-distance
Car3
Car2
Car1
Fig. 8: Vaillante car movement model; the car can be deviated from the reference in each direction. The absolute distance the car traverses shows by y, and the horizontal distance represents by x.

7
Second experiment
The aim of this experiment is to simulate a circle shaped movement in speed value of 8
and steer value of -21,
which is the ultimate
angle, in Car ID=3.
Experiment was done in
five rounds and the result
is shown in Figure 9.
As can be seen, it took
four steps to complete a
rounded movement. The
diameter of the shape is
about two meters. It can be
seen that the diversion
from the start point is 50 cm which is relatively high in this scale and such a movement
should be promoted.
Finally, a nice shaped circle was achieved by taking different steers and speeds in different
steps. Now, by having the knowledge of cars’ behavior in different speeds and different
battery consumption level, the final plan can be released expecting the most accurate results.
It should also be noted that some other minor experiments were done to get the ultimate
angles.
Fig. 10: Difference between estimation equations and real implementation
Fig. 9: Result of experiment in movement in average graph

8
Chapter 3
Design of Localization System
In this Chapter, the localization system(MoteTrack) used for this project is discussed. Plan
and implementation of localization scenario are mentioned as well.
Introduction
One of the parameters that are needed for the car controller is the position coordinates of
the car in different times. For this, a localization algorithm needs to be utilized. As the cars
are controlled remotely, a radio frequency-based location tracking system should be used [11-
18]. To obtain such parameters, MoteTrack system [19] that does not require any additional
hardware to be installed over sensors was selected as location tracking system. MoteTrack
designed to work in TinyOS [20] which is an operating system and Application targeting
wireless sensor networks.
TinyOS
TinyOS is a BSD-licensed operating system designed for low-power wireless devices,
such as those used in sensor networks. Many parts of this project, including localization, are
implemented with the help of writing codes in TinyOS. In the application that has been
developed in sensors, the codes are written in nesC. NesC is the language with a syntax like
C primarily intended to use in embedded systems such as sensor networks. [21] [22]
MoteTrack
MoteTrack uses RADAR [23] for its localization system. It is based on small wireless
sensors, and each mobile nodes’ location is calculated using a signature including the strength
of received signal is received from multiple beacon nodes.

9
Fig. 11: MoteTrack system implementation design: red line curves determine signal coverage area for each beacon.
MoteTrack works perfectly with Berkeley Mica2, MicaZ, and TelosSky sensor
“motes”[24], and MicaZ motes were used in this deployment. These motes are inexpensive,
small and programmable.
Fig. 12: MicaZ motes

10
The following is the format of messages that are periodically transmitted by beacons.
(sourceID, frequencyChannel, powerLevel)
sourceID is the unique identifier of the beacon node, frequencyChannel is the frequency
channel over which the beacon was transmitted, and powerLevel is the transmission power
level used to broadcast the message. In the system, each mobile node finds the location of
itself using these beacon messages. After that, the reference signature is created, that is a
combined with coordination in three dimensional (x, y, z). Since in thisdeployment all the
reference location signatures are captured from the floor, z value is always equals to zero and
it is omitted in the sniffed files.
The location estimation scenario is included two phases: an offline collection of reference
signatures, and online location estimation. As in other signature-based systems, the reference
signature database is achieved manually by a user with a laptop and a radio receiver, i.e. base
station. Each reference signature, shown as dark dots in Figure 11, consists of a set of
signature data in the following format;
(SID, FC, PWL, meanRSSI, meanLQI)
SID (sourceID) is the beacon node ID, FC (frequencyChannel) is the frequency channel
over which the beacon was transmitted, PWL (powerLevel) is the transmit power level of the
beacon message, and meanRSSI and meanLQI are the mean received signal strength
Fig. 13: Collected referenced signature database in a text file generated after an experiment

11
8 m2
14 m2
indication (RSSI) and mean link quality indication (LQI) of a set of beacon messages
received over some time interval. Each signature is mapped to a known location by the user
acquiring the signature database.
In this deployment of MoteTrack, 10 beacon motes were used, that are distributed on the
perimeter of the measuring surface, as beacon nodes. Beacons broadcast beacon messages at
a range of frequency channels and the same transmission power level. Using multiple
frequency channels will cause a signal to propagate at various levels in its medium and
therefore exhibit different characteristics at the receiver. Varying frequency channels (four
different channels in this project) delivers the set of measurements obtained by receiving
nodes and in fact increases the accuracy of tracking by several meters in the experiments.
Plan
Firstly, the reference signatures collected
in the area of 14x8 m2
where the Vaillante
cars suppose to move in. The surface is a
quite big area and based on the decided plan
936 reference signatures are needed to be
distributed in the area and each one is about
20 cm far from each other. In original
MoteTrack implementation, mobile motes
that transmit reference signatures for each
location connect directly to the laptop using a
USB cable to do the transmission process.
Collecting each reference signature takes
about 10 seconds. It is supposed that takes 30
seconds to prepare each new location for data
collecting process. As a result, using ordinary
reference signature collection, i.e. measuring
reference signatures one by one, estimated to
take at least 80 hours to be finished! Due to
this, bulk loading method was used to collect
multiple reference signatures simultaneously.
Obviously, a client-server system using a
MicaZ mote as a “Base station” connected to
the laptop and 24 MicaZ motes transmitting
reference locations to the base station was
used. Base station mote is a normal mobile mote that plays the interface role between mobile
motes transmitting reference locations and the packet listener program which collects
transmitted information.
Fig. 14: Measured area and the placement of MicaZ motes on cardboards

12
For making the reference signatures places as accurate as possible, transmitters are placed
on four thin cardboards (2 mm of thickness) which are connected together and make a
206*146 cm2
surface. By using such plan for collecting reference signatures, 39 movements
in the field for cardboard set is needed (6*6+3=39).
Results
After doing the bulk loading experiment, the reference signature database for whole
surface is made. By doing some training experiments the following graph was achieved in
Curve Fitting toolbox in Matlab showing the accuracy of different locations in the field.
Fig. 15: A scene from bulk loading of reference signatures in the motion hall

13
Fig. 16: Map of the localization accuracy in different locations. Diversion rates were calculated in meters for each zone and the blue dots represent locations were the reference signatures collected.
14
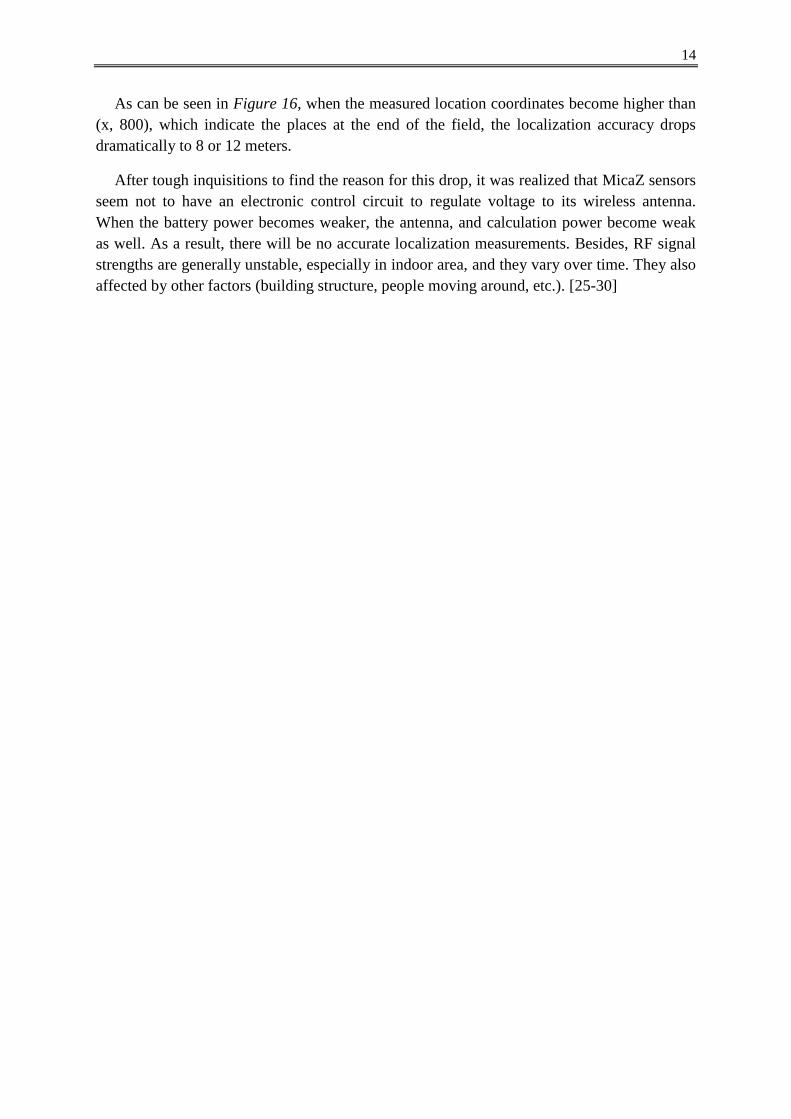
As can be seen in Figure 16, when the measured location coordinates become higher than
(x, 800), which indicate the places at the end of the field, the localization accuracy drops
dramatically to 8 or 12 meters.
After tough inquisitions to find the reason for this drop, it was realized that MicaZ sensors
seem not to have an electronic control circuit to regulate voltage to its wireless antenna.
When the battery power becomes weaker, the antenna, and calculation power become weak
as well. As a result, there will be no accurate localization measurements. Besides, RF signal
strengths are generally unstable, especially in indoor area, and they vary over time. They also
affected by other factors (building structure, people moving around, etc.). [25-30]

15
Chapter 4
Car Controller
Introduction
As stated in Chapter 2, one of the most important parameters that should be considered in
the system is safety concepts. Since it’s very dangerous and costly to implement the safety
plans for highway traffic on real vehicles with real time assumptions, the application
described in this thesis can be a reliable alternative for implementing safety algorithms in
vehicular traffic system.
After doing experiments on car properties, i.e. speed and steer, and localization
information, it’s time to get the test cars ready to move in a sample field. For this, an
application was written to send control commands regarding to vehicle’s position and
movements. The application was written in Java and can be invoked from Linux terminal or
Windows command prompt.
Plan
Like an ordinary traffic plan, some safety conditions have been considered in the system.
These conditions can ensure a crash free and safe traffic in vehicles transportation. In this
system, a base station carefully monitors each car’s movement and they are as follows:
1. Minimum distance: Euclidian distance between two cars in each step is calculated
based on their current location
2. Preconditions checks: checking whether the location is stable or not. Is the
communication between car and controller trustable? Is the car moving?
3. Post conditions check: is the position of the car after movement is the same as was
expected before movement?
The communication among all parts of the system is also illustrated in Figure 17.

16
Each car has a unique UDP port and a same IP address with regard to the other cars. So,
connecting to cars and making the network is done by establishing a UDP port and opening
sockets in base station.
Cars start to move in a same speed and steer when they triggered by base station. As the
maximum stable steps examined in experiments is 4, the system works for 4 rounds and after
that automatically stops.
Fig. 17: Connections among different parts of controller system in online mode.

17
Algorithms
As stated in Chapter 2, each car transmits its location continuously to the base station. The
first parameter which is checked in the system is distance passed in each step. The minimum
distance between two cars is defined as SafeDistance which is 100 cm by default.
The location parameters for each car in different times are measured continuously by base
station. Each car is identified by an ID which is transmitted on each packet data. As can be

18
seen in Alg. 1, PC calculates the Euclidean distance between two cars and takes a proper
action.
Car location stability is the other parameter that takes in account. It assumes that
transmitted data is just valid in a time called “ValidLocationPeriod”. If this time passes and
no new data receives from car, it is probable that connection between base station and car
turned off and it needs to be reconnected. In this situation, the system tests the connection for
three consecutive times and if still no new data received by the base station, it will stop.
Along with stability on cars side, it is also checked weather PC and base station transmit
data correctly and continuously. It is done by monitoring packet transmission (sniffing) on
the system. This action is defined as ExperimenterControl() in Alg. 2. If there is a problem in
USB data transmission between base station and PC, or between PC and Vaillante’s micro;
the system stops. All the wireless communications and movement functions, including speed
and steer adjustments, in Vaillante controlled by a micro controller in the car’s main circuit.
Alg. 3 is one of the last checks that are performed in the system. As the name states, this
check is done after each car movement (i.e. step). All the vehicle records on movements in
the system within 4 steps were sniffed and car controller application loads that information
upon running the system. Here, each car’s location in each step is privies and compares with
the experiment result. If the difference between these two values is negligible, the system
continues its operation, otherwise the system stops.
Design
All the localization information that was captured in the test experiments is loaded on a
Micaz mobile mote that will be placed on the car during the experiment. After planning the
system and defining algorithms it is time to implement the system in Java. The code was built
and run in JRE 1.4 on a Linux system. The program flow showed on Figure 18.
After primary checks which are basic checks like turning each cars power on and ensure
that cars and motes batteries are fully charged, SimLoc text file which contains localization
information and was captured in the test experiments loaded and classified by Java
StringTokenizer. So strings which are delaminated by Tab are saved in different object
arrays.
The first step in the experiment is to make the connection between cars and application.
Vaillante system just works in one to one client-server model. So, only one car can be
connected to the system at a time and algorithms will be checked round by round for each
car. Network socket for car is written in java application similar to the one in Appx. B. The
same socket is defined and opened on Java application. Obviously the internet address and
UDP port for each connection are the same in both sides.
After ensuring the car is connected to the network, a block is written to start the
experiment. A “For” loop is written to control flow of the program. As the system guaranteed

19
to work on four rounds, the loop prevents the system to run above this number. This code
includes parts for sending command packets to the car. Each packet includes socket
information, steer and speed values. It should also noted that SniffLoc text file is loaded and
classified by StringTokenizer in this period which is consist of latest localization information
sent by car in each step. As mentioned before,
Now, it is the time to implement and reference the loop to three safety algorithms. The
algorithms are implemented in functions that return a Boolean value. If the car provides a
violation in each algorithm the experiment ends.
The experiment finishes after the execution of the loop. Network sockets close and no
other command will be sent to the system.
Fig. 18: Java Program flow
20
Implementation and results
As the accuracy of the measured area for localization in coordinates higher than (x, 800)
were so weak, the implementation of the car controller system designed to be performed on
lower coordination area. The localization information copied to each car to implement the
MoteTrack system in normal mode. As stated earlier, mobile motes are attached to laptop
trough USB for tracking location in original MoteTrack system. While in this project another
mote, i.e. base station, which plays the interface role do it using Wi-Fi connection. Further,
the most reliable experiments achieved in the maps where the cars are placed in a circle road.
The radius of circle is 3.5m and cars were spread with equal distance on the perimeter. For
this implementation two cars were used.
Although the algorithms and the system were designed very carefully, the controller
application didn’t work successfully. The reasons for this case can be as follows:
1. Congestion in the network and mobile mote data process due to lots of operations and
packets traversing in the network: It should be noted that as normal operation in
MoteTrack localization system was used in this step, each mobile mote should compare its
reference signature database with the reference signatures received from the beacons in
each location. This may affect the quality of mobile mote processes.
2. Latency due to changing networks each time the new car wants to connect to the system
lowers the localization accuracy dramatically.
3. Car’s mechanical parts seems to be depreciated and the estimated distance and angles for
each step which were achieved from experiments in Chapter 2, are not useful.

21
Chapter 4
Summary
Achievements
In this thesis project, we could design and implement an application for controlling
miniature cars, i.e. Vaillante Wi-Fi, by sending control commands to adjust their speed and
distance with regard to the other cars. The safety algorithms seem to be trustable. We could
prove the feasibility of the project by correcting and promoting results achieved in Chapter 4.
Limitations
Since Vaillante cars seem not to be so precise regarding to steer and engine regulations,
the results achieved in experiments and tests are not so stable and as a result not all the
experiment results are trustable.
On the other hand, transmitting localization information over ZigBee networks may not be
a good solution for this project. Wi-Fi and ZigBee signal strengths are generally unstable and
they vary over time. They also affected by other factors like obstacles. [11]
Limited memory capacity of MicaZ sensors [31] is another problem which limits the
number of reference signatures can be taken in localization process. Obviously, the less
captured reference signatures lead to less accuracy for localization process.
Future Work
The work can be developed by using a more advanced car model which probably has more
abilities in controlling steer and speed of the car. It can also have some peripheral devices
like cameras and the information the camera provides can be helpful for the future scenarios.
Regarding the improvement of tracking system, a more trustable system can be used. This
system can deliver a more accurate location coordinates. Although ZigBee devices are very
good choice for sensor networks because of the low power they consume, applying proper
communication filters like Bayesian filter can be an alternative to enhance the localization
results. Some of these solutions can be found at [32-33]

22
References
1. David Burton, A.D., Stuart Newstead, David Logan, Brian Fildes, Effectiveness of ABS and Vehicle Stability Control Systems. 2004.
2. Vlassenroot, S., et al., Driving with intelligent speed adaptation: Final results of the Belgian ISA-trial. Transportation Research Part A: Policy and Practice, 2007. 41(3): p. 267-279.
3. Moon, S. and K. Yi, Human driving data-based design of a vehicle adaptive cruise control algorithm. Vehicle System Dynamics, 2008. 46(8): p. 661-690.
4. The all-new Volvo V40 - Safety & Support: The most IntelliSafe Volvo model ever. 2012; Available from: https://www.media.volvocars.com/global/enhanced/en-gb/media/preview.aspx?mediaid=42212.
5. Korzeniewski, J. Toyota introduces Night View on Japanese Crown Hybrid. 2008; Available from: http://green.autoblog.com/2008/05/31/toyota-introduces-night-view-on-japanese-crown-hybrid/.
6. To the Point: The New Touareg Volkswagen SUV is one of the safest automobiles of all times. 2012; Available from: https://www.volkswagen-media-services.com/medias_publish/ms/content/en/pressemitteilungen/2010/03/04/to_the_point__the.standard.gid-oeffentlichkeit.html.
7. FORD’S LATEST SAFETY BRAKETHROUGH – COLLISION WARNING WITH BRAKE SUPPORT. 2009; Available from: http://media.ford.com/article_display.cfm?article_id=29188.
8. Kelly, A., et al., Toward reliable off road autonomous vehicles operating in challenging environments. International Journal of Robotics Research, 2006. 25(5-6): p. 449-483.
9. Brian Bradford, H.V., Bryce McAllister, Seth Thorup, GPS Controlled RC Car With Collision Avoidance, in Computer Engineering. 2004, University of Utah.
10. ControlByTel. Available from: http://www.controlbytel.com/. 11. Ahn, H.S. and W. Yu. Reference tag-based indoor localization techniques. 2008. 12. Wattenhofer, R., Algorithms for ad hoc and sensor networks. Computer Communications,
2005. 28(13 SPEC. ISS.): p. 1498-1504. 13. Chen, C., Design of a child localization system on RFID and wireless sensor networks. Journal
of Sensors, 2010. 2010. 14. Terwilliger, M., et al. Localization using evolution strategies in sensornets. 2005. 15. Born, A. and F. Niemeyer. A new localization and accuracy analyzer for wireless sensor
networks using defective observations. 2009. 16. Whitehouse, K. and D. Culler. A robustness analysis of multi-hop ranging-based localization
approximations. 2006. 17. Whitehouse, K., et al. The Effects of ranging noise on multihop localization: An empirical
study. 2005. 18. Patwari, N., et al., Locating the nodes: Cooperative localization in wireless sensor networks.
IEEE Signal Processing Magazine, 2005. 22(4): p. 54-69. 19. Lorincz, K. and M. Welsh. MoteTrack: A robust, decentralized approach to RF-based location
tracking. 2005. 20. Levis, P., et al. TOSSIM: Accurate and scalable simulation of entire TinyOS applications. 2003. 21. Klues, K. Hands-On TinyOS: An Introduction to TinyOS Programming. 2009 [cited 2011
13/12/2011]; Available from: http://ds.informatik.rwth-aachen.de/teaching/ws0809/tinyos/tinyos_directions-aachen.pdf.
22. Levis, P., TinyOS Programming. 2006. 23. Bahl, P. and V.N. Padmanabhan. RADAR: An in-building RF-based user location and tracking
system. 2000. 24. Crossbow Technology, I. Crossbow Technology Releases Industry’s First End-to-End, Low-
Power, WirelessSensor Network Solution for Security, Monitoring, and Tracking Applications. 2005; Available from: http://www.xbow.com/pdf/XMesh_MOTEVIEW_PR.pdf.

23
25. Herman, T. 2004. p. 205-214. 26. Hightower, J. and G. Borriello, Location systems for ubiquitous computing. Computer, 2001.
34(8): p. 57-66. 27. Ray, S., et al., Robust location detection with sensor networks. IEEE Journal on Selected Areas
in Communications, 2004. 22(6): p. 1016-1025. 28. Youssef, M.A., A. Agrawala, and A.U. Shankar. WLAN location determination via clustering
and probability distributions. 2003. 29. Somov, A., V. Sachidananda, and R. Passerone. 2008. p. 182-193. 30. Lee, K.H. and S.H. Cho. CSS based localization system using Kalman Filter for Multi-Cell
Environment. 2008. 31. C r o s s b o w T e c h n o l o g y , I.n.c.; Available from:
http://www.openautomation.net/uploadsproductos/micaz_datasheet.pdf. 32. Vorst, P. and A. Zell. 2008. p. 273-282. 33. Fink, A. and H. Beikirch. Hybrid indoor tracking with Bayesian sensor fusion of RF localization
and inertial navigation. 2011.

24
Appendix A
Sniffed packets and iPhone application values mapping
Command Steer(radix 10) Speed(radix 10) Status/Movement
55:96:00:c8:00:a2 -50 0 Most Left/No Speed
55:96:00:98:00:d2 -2 0
55:96:00:97:00:d3 -1 0
55:96:00:96:00:d4 0 0 Straight/No movement
55:96:00:95:00:d5 1 0
55:96:00:94:00:d6 2 0
55:96:00:93:00:d7 3 0
55:96:00:92:00:d8 4 0
55:96:00:91:00:d9 5 0
55:96:00:8c:00:de 10 0
55:96:00:64:00:06 50 0 Most Right/No Speed
55:64:00:96:00:06 0 -50 Straight/Fast Backward
55:94:00:96:00:d6 0 -2
55:95:00:96:00:d5 0 -1
55:96:00:96:00:d4 0 0 Straight/No movement
55:97:00:96:00:d3 0 1
55:98:00:96:00:d2 0 2
55:c8:00:96:00:a2 0 50 Straight/Fast Forward

25
Appendix B
Here is a command based simple car controller code in Java. The code was written to move
Car3 in a circle.
/////////////////////////////////////////////////////////////////////////////
import java.io.*;
import java.util.*;
import java.net.* ;
public class PacketSendingtoCar3
{ private final static int PACKETSIZE = 100 ;
private static int speed, steer;
public static void wait (int n){
long t0,t1;
System.out.println( "Wait!" ) ;
t0=System.currentTimeMillis();
do{ t1=System.currentTimeMillis();
} while (t1-t0<n);
}
public static void main( String args[] )
{ // Check the arguments
if( args.length < 1 )
{ System.out.println( "usage: java DatagramClient Command" ) ;
return;
}
DatagramSocket socket = null;
try
{ InetAddress host = InetAddress.getByName( "192.168.3.1" ) ;
int port = Integer.parseInt( "15221" ) ;
socket = new DatagramSocket() ;
// retrive steer and speed values from arg[1] and arg[2]
speed = (byte)Integer.parseInt(args[0]);
steer = (byte)Integer.parseInt(args[1]);
Sy
byte[] data = new byte[6];
data[0] = (byte)0x55; //constant
data[2] = (byte)0x00; //constant
data[4] = (byte)0x00; //constant
26
data[1] = (byte)(0x96 + speed );
data[3] = (byte)(0x96 - steer );
data[5] = (byte)(0xd4 - speed + steer);
System.out.println( "data[5]:"+ data[3] ) ;
DatagramPacket packet = new DatagramPacket(data, data.length, host, port);
// DatagramPacket packet = new DatagramPacket(data, data.length, remAddr);
for(int i=0 ; i < 4 ; i++)
{ socket.send(packet);
wait(5000);
System.out.println( "i = "+i ) ;
}
} catch( Exception e )
{ System.out.println( e ) ;
}
finally
{ if( socket != null )
socket.close() ;
}
}
} stem.out.println( "steer: "+args[0] ) ;
/////////////////////////////////////////////////////////////////////////////
Appendix C

27
The following figure shows MoteTrack accuracy in this deployment.
Appendix D

28
Car experiments documentations for different Vaillante cars are in the following pages.
Date: 3/14/2011
Start time: 5:20 PM
End time: 9:28 PM
Car id: 1
Place: EDIT-6213
0,00
50,00
100,00
150,00
200,00
250,00
-15 -10 -5 0 5 10 15
avgDist+dev
avgDist
Deviation Values
Steer Value Angle Distance(cm) Horizontal
Distance(cm)
-11 2.52 16.77 16.37
-8 6.08 6.51 15.14
-5 3.61 6.11 4.04
-3 0.58 4.51 2.08
-1 5.51 4.36 8.54
0 2.08 9.07 3.61
1 2.31 1.73 3.00
3 3.00 7.51 6.08
5 1.73 2.08 5.86
8 1.53 8.54 4.00
11 2.89 7.94 10.50

29
-80,00
-60,00
-40,00
-20,00
0,00
20,00
40,00
-15 -10 -5 0 5 10 15avgAngle+dev
Average angle
-150,00
-100,00
-50,00
0,00
50,00
100,00
150,00
200,00
-15 -10 -5 0 5 10 15
avgHdist+dev
avgHdist

30
Date: 3/16/2011
Start time: 5:20 PM
End time: 9:28 PM
Car id: 2
Place: EDIT-6213
Deviation Values
Steer Value Angle Distance(cm) Horizontal Distance(cm)
-11 1.00 15.37 40.53
-8 12.50 13.32 29.57
-5 3.06 2.65 10.54
-3 3.61 2.65 4.93
-1 10.82 2.00 18.36
0 8.02 5.03 21.50
1 6.81 4.04 25.11
3 1.00 2.65 9.07
5 4.58 2.08 13.58
8 5.57 3.51 11.36
11 11.15 1.53 33.87
-80,00
-60,00
-40,00
-20,00
0,00
20,00
40,00
-15 -10 -5 0 5 10 15avgAngle+dev
Average angle

31
0,00
50,00
100,00
150,00
200,00
250,00
-15 -10 -5 0 5 10 15
avgDist+dev
avgDist
-100,00
-50,00
0,00
50,00
100,00
150,00
200,00
250,00
-15 -10 -5 0 5 10 15
avgHdist+dev
avgHdist

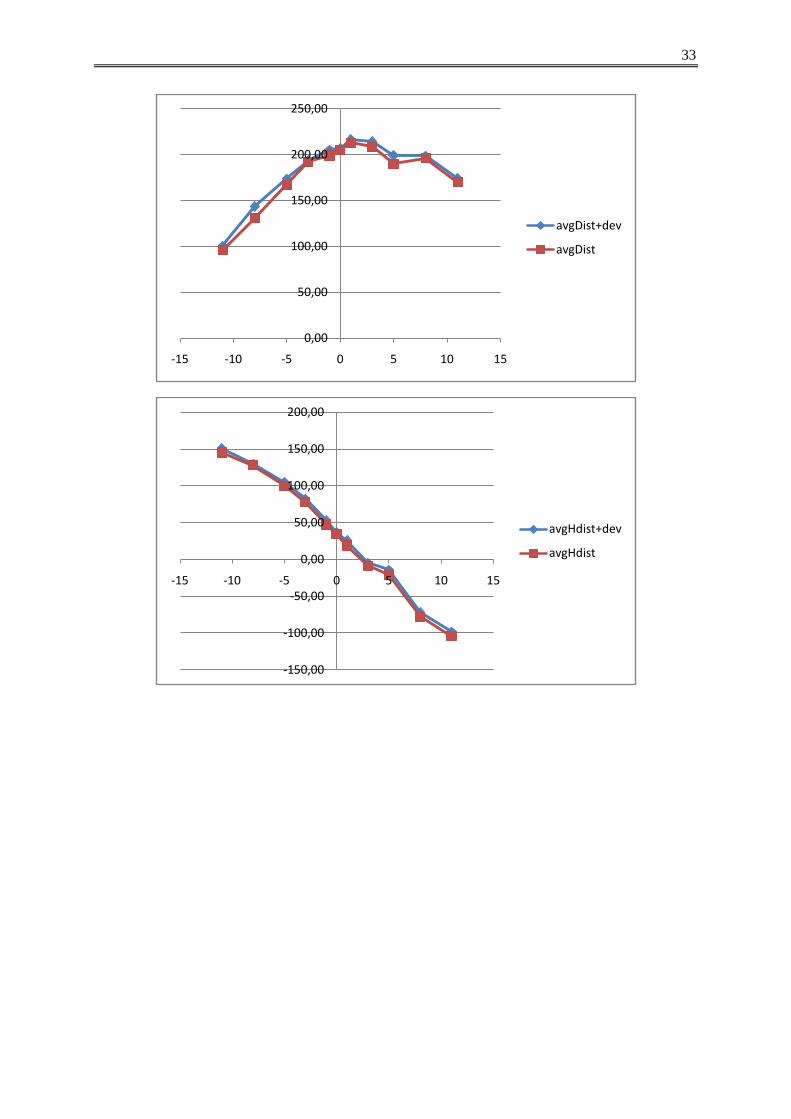
32
Deviation Values
Steer Value Angle Distance(cm) Horizontal
Distance(cm)
-11 0.58 4.58 5.51
-8 2.89 12.66 1.73
-5 3.06 6.56 4.58
-3 1.53 2.00 4.36
-1 2.08 6.08 5.03
0 1.15 1.53 2.08
1 2.31 3.61 6.93
3 2.08 5.77 4.16
5 0.58 9.17 7.00
8 2.00 2.65 5.77
11 3.79 4.36 6.11
-80,00
-60,00
-40,00
-20,00
0,00
20,00
40,00
60,00
-15 -10 -5 0 5 10 15avgAngle+dev
Average angle
33
0,00
50,00
100,00
150,00
200,00
250,00
-15 -10 -5 0 5 10 15
avgDist+dev
avgDist
-150,00
-100,00
-50,00
0,00
50,00
100,00
150,00
200,00
-15 -10 -5 0 5 10 15
avgHdist+dev
avgHdist