design, modelling and optimisation of an interlocking
TRANSCRIPT

DESIGN, MODELLING AND OPTIMISATION OF AN
INTERLOCKING STABILISED SOIL BLOCK (ISSB)
MAKING MACHINE FOR IMPROVED PERFORMANCE
By
Oliver Samungole (BEng)
Computer No. 2015130815
A Dissertation Submitted to the University of Zambia in Partial
Fulfillment of the requirements of a Master’s Degree in Production
Engineering and Management
THE UNIVERSITY OF ZAMBIA
LUSAKA
2020

i
Copyright © 2020 Oliver Samungole
All rights reserved. No part of this dissertation may be reproduced, distributed, or transmitted in
any form or by any means including photocopying, recording or other electronic or mechanical
methods without the prior permission of the author except in the case of brief quotations embodied
in critical reviews and certain other non-commercial uses permitted by copyright law.

ii
DECLARATION
I, Oliver Samungole, do declare that this work is my own and that the work of other
persons utilised in this dissertation has been duly acknowledged. This work presented here
has not been previously presented at this or any other University for similar purposes.
Signature……………………………….……Date………………………………………

iii
APPROVAL
This dissertation by Oliver Samungole is approved as fulfilling the requirements for the
award of the Master of Engineering in Production Engineering and Management by the
University of Zambia.
Examiner 1: ………………….....Signature....….…………….Date…………….……..
Examiner 2: ………………….....Signature....….…………….Date…………….……..
Examiner 3: ………………….....Signature....….…………….Date…………….……..
Chairperson, Board of Examiners
Name…………………..…………Signature...........................…….Date………………
Supervisor: …………………........Signature....….……..…….Date……..……….……..

iv
ABSTRACT
In Zambia it is estimated that the existing housing stock stands at 2.5 million units catering
for about 16 million people. The national housing deficit stands at more than 2 million
houses and is compounded by urbanisation. Efforts have so far been made to use
alternative building technology called Interlocking Stabilised Soil Block (ISSB)
technology.
Currently, two manually operated compressing machines IBM-M1 and IBM-M2 have
been developed by Technology Development and Advisory Unit (TDAU) of the
University of Zambia (UNZA). However, the machines have challenges of low
productivity and compressive strength which does not conform to the standards governing
the performance of interlocking soil blocks. According to tests the two machines IBM-
M1 and IBM-M2 machines have production rates of 232 and 283 blocks per eight-hour
shift respectively which are by far lower than the 2200 blocks as produced by motorised
machines. Compressive strength test was performed and the resultant mean failure loads
for both machines were 3.9 MPa and 2.9 MPa respectively which is below the
international standards of 6 to 7 MPa for compressed stabilised soil blocks.
In view of this shortfall a hydraulically operated ISSB machine (IBM-H1) was designed
and fabricated and the machine production capacity improved by 239.22%. The mean
block strength also improved significantly to 7 MPa and 6 MPa from 3.9 MPa and 2.9
MPa using 25% and 12% respectively of Portland cement content.
This study has drawn the conclusion that ISSB making machine production rate is affected
by the mould loading rate, soil compression and block ejection time. Furthermore, the
strength of ISSB blocks increases linearly as the block bulk density and the stabiliser
quantity increases.
Key words: Interlocking Stabilised Soil Block (ISSB), Technology Development and
Advisory Unit (TDAU), Interlocking Block Maker-Manual 1 (IBM-M1), Interlocking
Block Maker-Manual 2 (IBM-M2), Compressive strength.

v
DEDICATION
This work is dedicated to my family, Stella my wife, Emmanuel, Favour and Stella (Jr),
you have been a source of inspiration in all my studies. To my mother and late father this
is for you too, I owe you a lot for your support and relentless encouragement to pursue
higher education.

vi
ACKNOWLEDGEMENT
I would like to sincerely thank my supervisors, Dr C.G.Chizyuka and Dr J.M.Chileshe for
all their research support throughout the course of this study. I acknowledge and thank Mr
Leonard Simukoko, Manager-TDAU for facilitating the use of workshop equipment.
Furthermore, am indebted to all the lecturers in the School of Engineering who contributed
immensely to this work up to this level. It will be folly indeed not mention and thank
technicians whom I worked with so closely in all practical works of the project.

vii
TABLE OF CONTENTS
CERTIFICATE OF APPROVAL ................................................................................... i
DECLARATION .............................................................................................................. ii
APPROVAL .................................................................................................................... iii
ABSTRACT ..................................................................................................................... iv
DEDICATION .................................................................................................................. v
ACKNOWLEDGEMENT .............................................................................................. vi
LIST OF TABLES .......................................................................................................... xi
LIST OF APPENDICES .............................................................................................. xiv
LIST OF SYMBOLS ..................................................................................................... xv
ACRONYMS AND ABREVIATIONS ........................................................................ xvi
CHAPTER 1 INTRODUCTION ................................................................................ 1
1.1 Background ............................................................................................................ 1
1.2 Statement of the Problem ....................................................................................... 2
1.3 Research Objectives ............................................................................................... 3
1.3.1 General Objective......................................................................................... 3
1.3.2 Specific Objectives....................................................................................... 3
1.4 Study Rationale ...................................................................................................... 3
1.6 Scope of the Study .................................................................................................. 4
1.7 Layout of the Dissertation ...................................................................................... 4

viii
CHAPTER 2 LITERATURE REVIEW ..................................................................... 5
2.1 Introduction ............................................................................................................ 5
2.2 Interlocking Stabilised Soil Blocks ........................................................................ 5
2.3 Benefits of Interlocking Stabilised Soil Blocks ..................................................... 8
2.4 ISSB Compressing Machines ................................................................................. 8
2.5 Block Pressing Direction and Dimensional Error ................................................ 10
2.5.1 Perpendicular Compaction Force ............................................................... 11
2.5.2 Forces Applied Perpendicular to the Block’s Top/Bottom Faces .............. 11
2.6 ISSB Making Machine Link Mechanism ............................................................. 12
2.7 ISSB Machine Force – Stroke Length Relationship ............................................ 14
2.8 Machine Efficiency .............................................................................................. 15
2.9 Link Joint Mechanical Advantage ........................................................................ 15
2.9.1 Forward Toggle Mechanical Advantage .................................................... 17
2.9.2 Reverse Toggle Mechanical Advantage..................................................... 19
2.10 Displacement Expression of the Crank – Slider Mechanism ............................... 19
2.11 Determination of Forces Acting in Mechanisms .................................................. 21
2.12 Physical Product Modelling and Simulation ........................................................ 23
CHAPTER 3 METHODS AND MATERIALS ........................................................ 26
3.1 Introduction .......................................................................................................... 26
3.2 Research Design ................................................................................................... 26
3.2.1 General Method .......................................................................................... 26
3.2.2 Specific Procedures. ................................................................................... 27
3.2.3 Research Site .............................................................................................. 29
3.3 Simulation of HISSB Model Parts ....................................................................... 29
3.4 Experiments and Tests ......................................................................................... 30
3.4.1 ISSB Block Making Process ...................................................................... 30
3.4.2 ISSB Making Machine Production Cycle Time ........................................ 31
ix
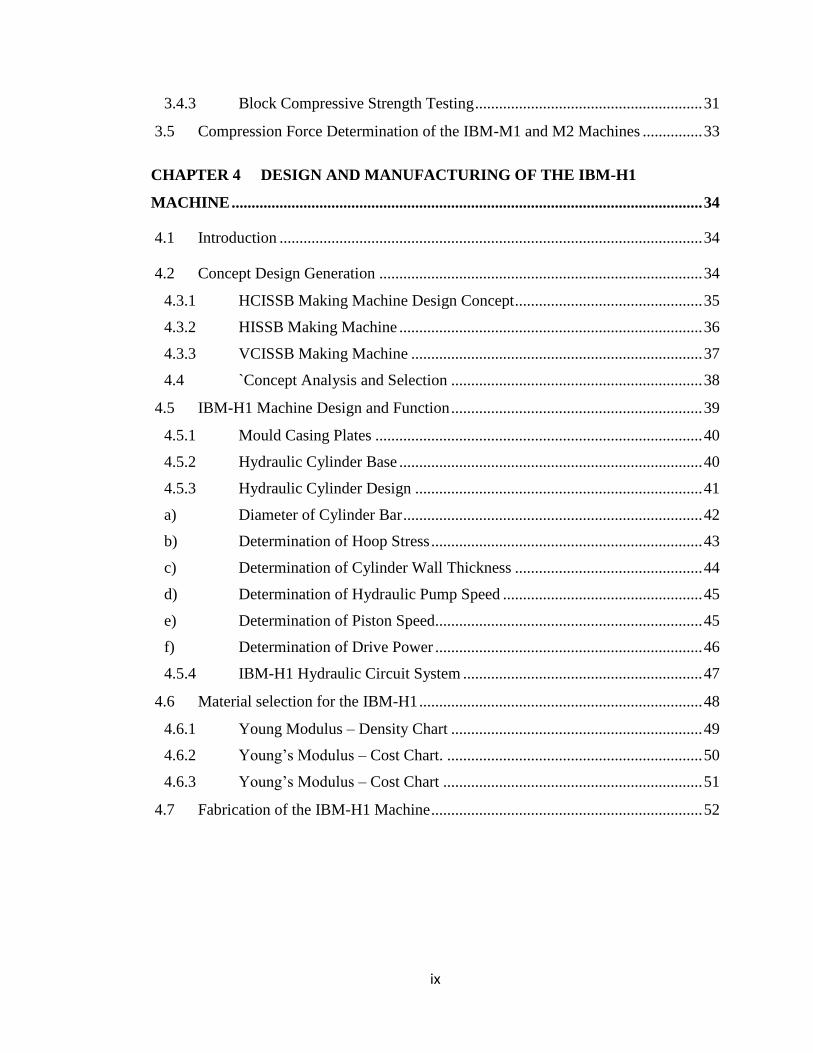
3.4.3 Block Compressive Strength Testing ......................................................... 31
3.5 Compression Force Determination of the IBM-M1 and M2 Machines ............... 33
CHAPTER 4 DESIGN AND MANUFACTURING OF THE IBM-H1
MACHINE ...................................................................................................................... 34
4.1 Introduction .......................................................................................................... 34
4.2 Concept Design Generation ................................................................................. 34
4.3.1 HCISSB Making Machine Design Concept ............................................... 35
4.3.2 HISSB Making Machine ............................................................................ 36
4.3.3 VCISSB Making Machine ......................................................................... 37
4.4 `Concept Analysis and Selection ............................................................... 38
4.5 IBM-H1 Machine Design and Function ............................................................... 39
4.5.1 Mould Casing Plates .................................................................................. 40
4.5.2 Hydraulic Cylinder Base ............................................................................ 40
4.5.3 Hydraulic Cylinder Design ........................................................................ 41
a) Diameter of Cylinder Bar ........................................................................... 42
b) Determination of Hoop Stress .................................................................... 43
c) Determination of Cylinder Wall Thickness ............................................... 44
d) Determination of Hydraulic Pump Speed .................................................. 45
e) Determination of Piston Speed................................................................... 45
f) Determination of Drive Power ................................................................... 46
4.5.4 IBM-H1 Hydraulic Circuit System ............................................................ 47
4.6 Material selection for the IBM-H1 ....................................................................... 48
4.6.1 Young Modulus – Density Chart ............................................................... 49
4.6.2 Young’s Modulus – Cost Chart. ................................................................ 50
4.6.3 Young’s Modulus – Cost Chart ................................................................. 51
4.7 Fabrication of the IBM-H1 Machine .................................................................... 52

x
CHAPTER 5 RESULTS AND DISCUSSION .......................................................... 54
5.1 Introduction .......................................................................................................... 54
5.2 Simulation and Optimisation of ISSB Making Machine Parts ............................ 54
5.3 ISSB Making Machine Block Production Cycle Time ........................................ 58
5.4 ISSB Strength Test Results .................................................................................. 60
CHAPTER 6 CONCLUSION AND RECOMMENDATIONS.............................. 64
6.1 Introduction .......................................................................................................... 64
6.2 Conclusion ............................................................................................................ 64
6.3 Recommendations ................................................................................................ 65
xi
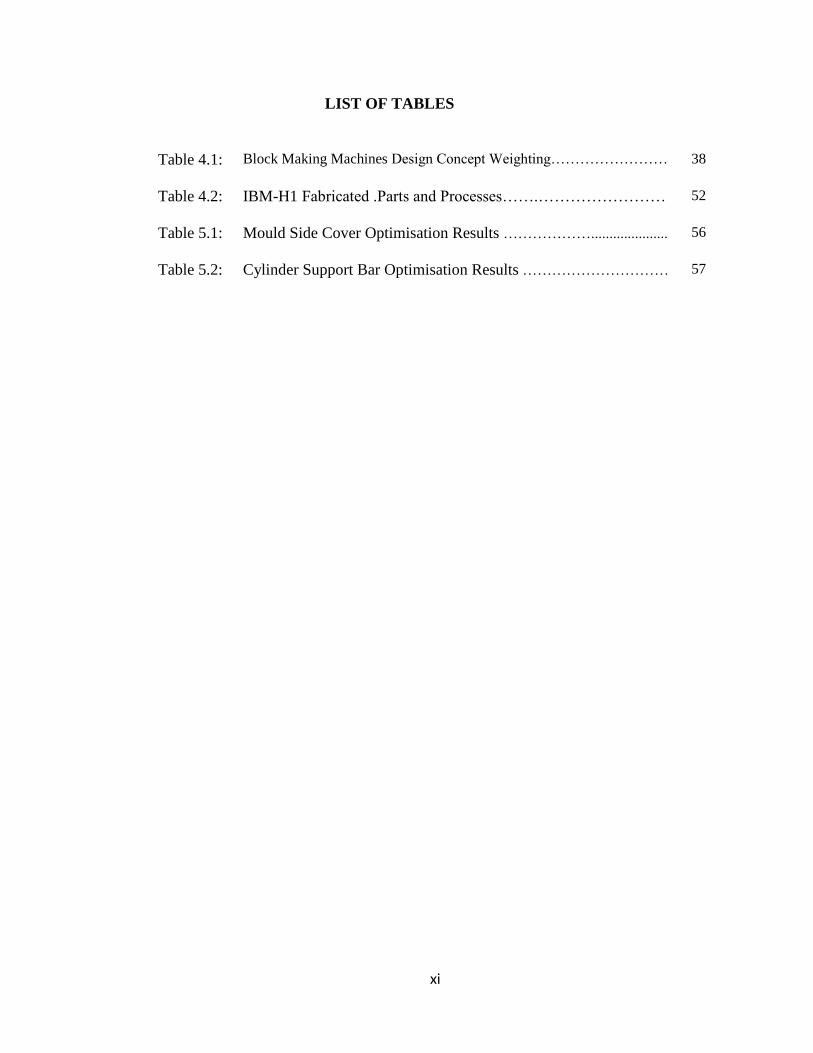
LIST OF TABLES
Table 4.1: Block Making Machines Design Concept Weighting…………………… 38
Table 4.2: IBM-H1 Fabricated .Parts and Processes…….…………………… 52
Table 5.1: Mould Side Cover Optimisation Results ………………..................... 56
Table 5.2: Cylinder Support Bar Optimisation Results ………………………… 57

xii
LIST OF FIGURES
Figure 2.1: Hydraform Blocks………………………………………………………... 6
Figure 2.2: Cement content vs Compaction pressure………………………………… 7
Figure 2.3: (a) Motorised Machine (b) Manual ISSB Machine………....………..… 9
Figure 2.4: Schematic Diagram of an SSB Compressing Machine….………………. 10
Figure 2.5: SSB Compaction to Top/Bottom Faces. Source…………….…………… 11
Figure 2.6 Slider Crank Mechanism Model with a Loaded Moment……………….. 13
Figure 2.7 Joint Reaction Forces……………………………………………………. 13
Figure 2.8 Force-Stroke Relationship……………………………………………….. 14
Figure 2.9: IBM-M1 Machine……..…………………….…………………………… 15
Figure 2.10: Four-Bar Linkage Mechanism …..………………………………………. 16
Figure 2.11: Schematic Drawing of NISSB Making Machine………………………… 17
Figure 2.12 ISSB Linkage Mechanism System………………………………………. 18
Figure 2.13: Crank – Slider Mechanism………………………………………………. 20
Figure 2.14: Force Determination in the Slider Crank Mechanism…………………… 22
Figure 2.15: Modelled Linkage using CAD Software………………………………… 24
Figure 2.16: Flow of the CAD-Based Mechanism Optimisation……………………… 25
Figure 3.1: IBM-H1 Making Machine……………………………………………….. 27
Figure 3.2: Typical Systematic Design and Production Flowchart...…………….….. 28
Figure 3.3: Manual Block Making Sequence of Activities ………………...….……. 30
Figure 3.4: Penetration Resistance vs Elapsed Time………………………………… 31

xiii
Figure 3.5: Curing of Interlocking Blocks…………………………………………… 31
Figure 3.6: ISSB Compressive strength testing……………………………………… 32
Figure 3.7: Modified Rig using a Manually Operated Hydraulic Press……………… 33
Figure 4.1: HCISSB Making Machine ………………………………………………. 35
Figure 4.2: IBM-H1 Machine Concept......................................................................... 36
Figure 4.3: VCISSB Making Machine ………………………………………………. 37
Figure 4.4: Hydraulic Cylinder Base General Assembly…………………………….. 42
Figure 4.5: Double Acting Hydraulic Cylinder………………………………………. 43
Figure 4.6: IBM-3H Machine Hydraulic Circuit……..………………………………. 47
Figure 4.7: Young’s Modulus vs Density Chart……………………………………… 49
Figure 4.8: Young’s Modulus vs Strength Chart…………………………………….. 50
Figure 4.9: Young’s Modulus vs Cost Chart…………………………………………. 51
Figure 4.10: Fabrication of the IBM-H1 Stand and Casing…………….……………... 53
Figure 4.11: Final Assembled IBM-H1 Machine……………………………………... 53
Figure 5.1: Deformation of IBM-M1 Side Cover Plate...………….………………... 51
Figure 5.2: Stress Analysis of IBM-M1 Side Cover Plate …………………….……. 51
Figure 5.3: IBM-H1 Cylinder Base Simulation Stress Analysis ……….…………… 57
Figure 5.4: IBM-H1 Cylinder Base Simulation Deformation Analysis ….….……… 58
Figure 5.5: IBM-M1, IBM=M2 and IBM-H1 Production Cycles ……………..……. 59
Figure 5.6: Strength changes with variable cement for manual ISSB Machine. 60
Figure 5.7: Compressive strength changes with variable cement contents at
different compressive pressure for IBM-H1 making machine …..……...
61
Figure 5.8: IBM-H1 Machine Distribution and Variability Block Strength………… 62
Figure 5.9: Manual ISSB Machine Distribution and Variability of Strength……….. 63

xiv
LIST OF APPENDICES
Appendix A: ISSB Time Study Observation Sheet…………………………. 71
Appendix B: Compressive strength of Manual TDAU ISSBs……………… 72
Appendix C: Compressive Strength Test Results of IBM-H1………………. 74
Appendix D: IBM-H1 Making Machine Design Drawings and Models……. 79
Appendix E: Buckling Chart of Cylinder Rods...……………………..…….. 83
Appendix F: ISSB Making Machine Production Rates…………………….. 84
Appendix G: Descriptive Statistics…………………………………………. 85

xv
LIST OF SYMBOLS
𝑆 Standard Deviation Standard Deviation
�̅� Mean Value Mean Value
𝛼 Alpha Alpha
𝛾 Gamma Gamma
𝛽 Beta Beta
∅0 Initial Transmission Angle
𝜃0 Initial Crank Angle Initial Crank Angle
V Velocity Velocity
t Thickness Thickness
P Pressure Pressure
r Radius Radius
l Connecting Rod Length
Qh Hoop Stress Hoop Stress
n Rotation Speed Rotation Speed
𝑋𝑚 Maximum Stroke Length
𝐴𝑅𝑇 Mechanical Advantage
I Moment of Inertia Moment of Inertia
E Young’s Modulus Young’s Modulus
η𝑉𝑜𝑙 Volumetric Efficiency
VP Pump Displacement Pump Displacement
np Pump Shaft Speed Pump Shaft Speed
𝜂𝑡.𝑝 Pump Efficiency
Pump Efficiency
xvi
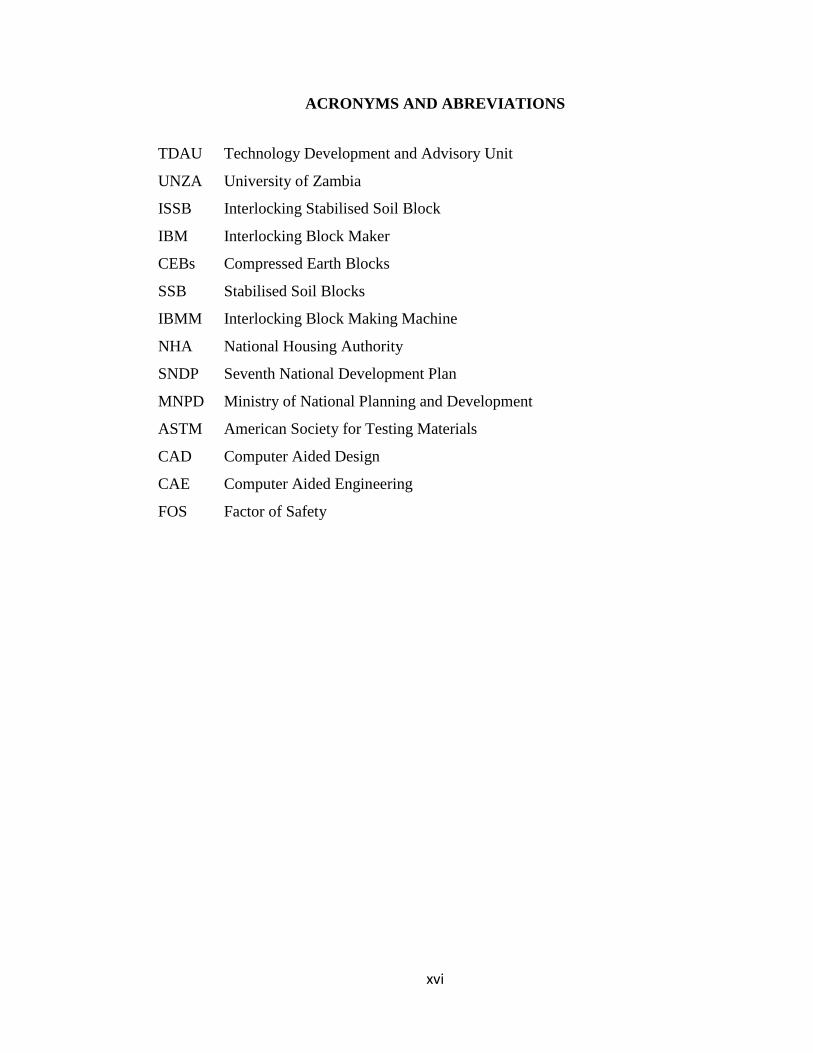
ACRONYMS AND ABREVIATIONS
TDAU Technology Development and Advisory Unit
UNZA University of Zambia
ISSB Interlocking Stabilised Soil Block
IBM Interlocking Block Maker
CEBs Compressed Earth Blocks
SSB Stabilised Soil Blocks
IBMM Interlocking Block Making Machine
NHA National Housing Authority
SNDP Seventh National Development Plan
MNPD Ministry of National Planning and Development
ASTM American Society for Testing Materials
CAD Computer Aided Design
CAE Computer Aided Engineering
FOS Factor of Safety

1
CHAPTER 1 INTRODUCTION
1.1 Background
Housing is one of the basic human needs and is ranked third after food and clothing
(CAHF, 2016). In most developing countries housing is inadequate and the housing
backlog has been increasing rapidly. One key reason for housing inadequacy is the
increase in population (Racodi, 1997). Therefore, the investigation of alternative materials
for the construction of low-cost housing has been the focus of many studies in many
developing countries (Waziri et al, 2013).
Despite having one of the most progressive policies through the National Housing
Authority (NHA) Act, the Housing Act, and the 1996 Housing Policy, Zambia has not
achieved its objectives of producing sufficient affordable housing. This is reflected in the
huge housing deficit of two million units (CAHF, 2016).
However, researchers worldwide have made significant efforts to find sustainable and
affordable technologies to arrest the situation. The best approach so far is the development
of technologies to increase the utilization of locally available building materials.
In Zambia, Technology Development and Advisory Unit (TDAU) of the University of
Zambia developed a prototype Interlocking Stabilised Soil Block (ISSB) making machine
for vertically oriented brick ejection. However, the main challenge with the design
includes the low production rate and low resultant soil compaction strength. Further,
TDAU has in the recent past produced another machine with a change in the brick
orientation, ejection, and link mechanism but performance has remained as low as 280
bricks per 8-hour production shift.
Also, other researchers indicate that direct use of earth for ISSBs without modification for
any form has a disadvantage of low performance. The shortcomings principally are low
mechanical characteristics, unsatisfactory resistance to weathering and liability to volume
change especially in the case of clay. These disadvantages can be improved to make the
material compatible with the desired application in construction by combined chemical
and mechanical action technically known as stabilisation (Waziri et al, 2013).

2
Generally, meeting the need for adequate housing for the population requires sustained
investment and continued innovation, particularly in the appropriate technologies that
lower the cost of construction and the cost to the environment. ISSB technology is one
such technology which is also gaining recognition in developing countries (Adupa, 2009)
and according to the Seventh National Development Plan (SNDP), the government of the
Republic of Zambia stands ready to promote the development of quality, adequate and
affordable housing units for all income groups in the country (MNPD, 2017).
The development of appropriate technologies for the production of low-cost building
materials of good quality will speed up the provision of affordable urban housing in
developing countries. One such technology is the use of stabilised-soil bricks. These have
been in use in developing (African) countries for many years and have passed various
stages of improvement in the production processes and quality (Kintingu, 2009).
Therefore, one of the expected key outputs of this research is a high performance manually
operated ISSB making machine which will be achieved through the redesigning of an
existing prototype ISSB machine.
1.2 Statement of the Problem
In Zambia, ISSB making machines are manufactured by TDAU. They are manually
operated and currently have a production capacity of 280 blocks per day with a mean
strength of compressive strength 3.5 MPa. The expected minimum strength for all load
bearing blocks is 6 MPa.
Currently, work to develop the ISSB making machine has been going on by TDAU. Two
prototypes have so far been developed IBM-M1 and IBM-M2 machines. The challenges
of low productivity and soil compaction have not been fully addressed. Consequently, this
has resulted in uncompetitive product demand and negatively affected housing and
infrastructure development efforts.
It is for this reason that this research is being performed to improve the current TDAU
ISSB making machine model for improved machine production capacity and compressive
strength of the blocks.

3
1.3 Research Objectives
1.3.1 General Objective
The general objective of the study was to develop an ISSB making machine with improved
performance characteristics.
1.3.2 Specific Objectives
The following were the specific objectives:
a) To study the existing prototype TDAU ISSB making machines.
b) To redesign an improved ISSB making machine.
c) To manufacture an improved ISSB making machine and carry out a performance test.
1.4 Study Rationale
The justification of this research can be drawn from the fact that it complements previous
efforts by TDAU. Designing the improved ISSB making machine (IBM-H1) with
regulated and increased compression pressure for stabilised soil compaction has improved
the strength of the blocks.
Consequently, this study has helped improve the approach to continuous product
development of the TDAU ISSB machine and act as a basis for the source of information
required for design and development.
Furthermore, this research output is of greatly benefit to society in the area of alternative
building materials. This is because the production rate and ISSB compressive strength has
improved significantly.
Therefore, the expected key output is a high performance ISSB making machine which
was achieved through redesigning of two existing TDAU ISSB prototype machines,
IBM-M1 and IBM-M2.
4
1.5 Scope of the Study
The work was carried out in the Department of Mechanical Engineering, the University
of Zambia using Solidworks CAD software and conventional machine tools in the
workshop. The research did not include the development of ISSB machine optimisation
algorithms but focused on increasing machine production capacity and compression
pressure for improved ISSB strength.
1.6 Layout of the Dissertation
The main focus of this research was to design and manufacture an ISSB making machine
for improved performance.
Chapter One explains the Interlocking block making machine, benefits of SSB block
technology and an overview of existing ISSB machine designs technologies. Justification
for this study to design and manufacture an ISSB making machine has been covered in
this Chapter. The remainder of the dissertation has been arranged as follows:
Chapter Two covers the relevant literature about ISSB making machine designs. The main
area of discussion in this chapter is the design of soil compressing mechanisms and how
it affects the final product. The chapter also includes literature on CAD/CAE technology
concerning machine design. Chapter Three focuses on the materials and methods used as
well as the procedures employed in the production of the improved ISSB making machine.
Chapter Four explains processes used to design and manufacture the improved ISSB
making machine. Chapter five contains results and discussion while the conclusions and
recommendations are in Chapter six.

5
CHAPTER 2 LITERATURE REVIEW
2.1 Introduction
This chapter gives the background of Stabilised Soil Block (SSB) technology and a
general overview of ISSB design areas such as mechanical advantage, physical model
simulation, and optimisation. Existing SSB compressing machine products have also been
presented. It should be noted that the application of CAD in design and manufacturing is
one of the major factors that have contributed immensely to the modern economic and
competitive manufacturing and subsequently efficient and high product quality.
2.2 Interlocking Stabilised Soil Blocks
Stabilised soil blocks are compressed soil building blocks made from stabilised soil
mixture using pressing machines. SSBs are potential alternative building materials whose
production machines require continuous research and development. The production
process involves compressing of soil mixed with the stabilisers such as cement, lime, and
tarmac by using manually operated or motorised pressing machines. ISSBs are a further
development of compressed earth bricks with both horizontal and vertical in and out-of-
plane groves (Nambatya, 2015). The soil used is taken from one meter below the top soil,
with any organic material and particles larger than 5 to 6 mm removed. Geometrically, as
presented in Figure 2.1(a), they are defined as (220 to 230 mm) wide, (230 to 240 mm)
long and (115 to 120mm) high while strength and density vary according to the
compression and soil mixing ratios employed. ISSBs have a tongue and groove for locking
purpose and Figure 2.1(b) shows the wall horizontal clearance created between tongue
and grooves of the blocks which are also essentially provided for thermal control between
the inside and external environment.

6
Figure 2.1: Hydraform Blocks. (Kintingu, 2009).
Motorised or manually operated pressing machines are used to achieve the required high
compaction strength and density. The compressed soil is mixed with a stabiliser either
lime or Portland cement and a considerable amount of water. The blocks are then allowed
to cure for at least 14 days before they are used. Moreover, the compression must be
sufficient to allow a fresh block to withstand the squeezing forces occurring when it is
manually moved from machine to the curing area. The compressive strength largely
depends on the soil composition, density, and percentage of stabiliser. Literature also
shows soil mixture with 8% cement can yield blocks having a compressive strength of 4
to 5 MPa while for 10% cement the block strength is between 7 and 8 MPa
(www.hydrafoamasia.com). A motorised machine (moulding pressure 4MPa to 10MPa)
(Hydrafoam, 2004) is required to compact such block strength. According to the ASTM
C 73-39, 3.5MPa is the minimum recommended compressive strength for compressed
blocks.

7
Research has shown that improved levels of compaction have a significant effect on the
compressive strength of the sample and the effectiveness of the cement as stabiliser added.
The graph in Figure 2.2 presents data collected by Abas to indicate the relationships
between cement content, compaction energy (defined in MPa pressure) and the resulting
bulk density and subsequent 7-day wet compressive strength (cube). This is for laterite
soil mixed with 25% sand (Abas, 2008).
Figure 2.2: Cement Content Vs Compaction Pressure. (Abas, 2008).
Therefore, the compressive strength of SSB largely depends on the soil type, the form of
stabiliser and the compaction pressure used to form the blocks. Further, the maximum
compressive strengths of SSBs are obtained by proper mixing of suitable materials,
compressing and curing. Thorough mixing is essential in the production of uniform and
high-quality blocks. Equipment and methods adopted should, therefore, be capable of
effective compaction (Onyeakpta and Onundi, 2014).

8
2.3 Benefits of Interlocking Stabilised Soil Blocks
As alternative building materials ISSBs have several advantages including the following:
i. Construction with interlocking block saves time and ample amount of mortar
concrete compared to conventional masonry block laid with mortar.
ii. Areas prone to earthquake use the hollow Interlocking blocks with the strength
improved with grout and reinforcement throughout the height of the wall to resist
the effect of the earthquake, thus, providing adequate structural stability.
iii. Having formed the base course, other courses can be assembled by unskilled
labour.
iv. Dismantling of the blocks in case of temporary structure does not cause damages
v. The cost of construction is relatively low.
Some of the disadvantages of Interlocking blocks are:
i. Standard skilled masonry labour is required to ensure proper horizontal and
vertical alignment of the blocks, and that the corner and junction (T-joints) are
right-angled, especially at the base course.
ii. Due to wind and rain seepage effect, the block wall need to be plastered.
iii. The mould, palettes groove edge may affect the block dimension, consequently
hamper the alignment and stability of the wall if not adequately observed
iv. It is difficult to maintain the required tight tolerances for accurate construction of
large walls through the moulding and cutting steps (UN-Habitat, 2015).
2.4 ISSB Compressing Machines
The idea of making blocks by compacting earth or mixing it with stabilising supplement
is an old concept dating back thousands of years (Adupa, 2009). Previously and still
customary in certain parts of the world, wooden moulds are used for making sun-dried or
burned earth blocks. The turning point in the use of presses and in the way in which
compressed earth blocks were used for building and architectural purposes came only into
effect from 1952, following the invention of the famous little CINVA-RAM press,
designed by engineer Raul Ramirez at the ClNVA centre in Bogota, Columbia
(Guillaud, 1995)

9
Since then, the methods of producing earth block have progressed resulting in diverse
motor-driven and manual presses which are either mobile or industrial-scale production
units
ISSB making machines have been used in Zambia for a long time to produce ISSBs as
alternative building materials. ISSB technology has proved to be an excellent substitute
for concrete blocks but the full potential is yet to be realised because most of the
commercially available machines are very expensive (Yakubu and Umar, 2015).
Originally, the simplest way to produce stabilised soil blocks involved tamping the
processed soil in a mould with the help of a tamping rod. However, the degree of
compaction could not easily be controlled.
Mechanised methods have been developed and the ISSB making machines can be broadly
categorised as motorised and manual machines. The motorised machines are ideally suited
for a mass production system, whereas the manual pressing machines are generally for
decentralised production. The motorised ISSB making machine Figure 2.3 (a), generally
use a hydraulic power pack to generate a large amount of compaction force with high
production output. The manual machine Figure 2.3 (b), creates an adequate compaction
force using animate energy. The soil mixture is first processed then compacted employing
the static compaction process (Reddy, 2015).
(a) (b)
Figure 2.3: (a) Motorised ISSB making machine. (Leiyue Machinery, 2017)
(b) Manual ISSB Making Machine. (Kafum, 2018).
10
In 2015 Yakubu and Umar (2015) designed and constructed a multipurpose block making
machine for the production of high quality and low cost stabilised compressed blocks. The
motorised compressing machine was capable of producing 2215 plain bricks and 950
blocks per day. However, the machine had no provision for the production of ISSBs.
This research explored the improvement of the TDAU ISSB making machine to enhance
its performance whose production output is between 250 and 300 blocks per day.
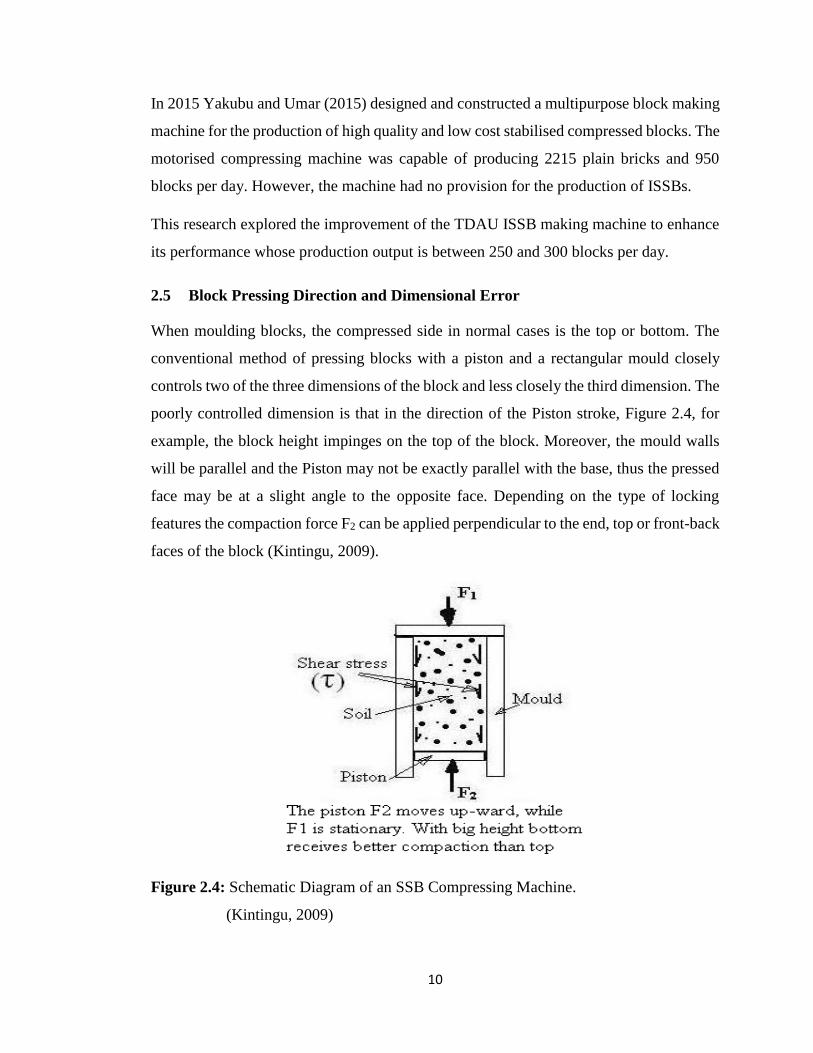
2.5 Block Pressing Direction and Dimensional Error
When moulding blocks, the compressed side in normal cases is the top or bottom. The
conventional method of pressing blocks with a piston and a rectangular mould closely
controls two of the three dimensions of the block and less closely the third dimension. The
poorly controlled dimension is that in the direction of the Piston stroke, Figure 2.4, for
example, the block height impinges on the top of the block. Moreover, the mould walls
will be parallel and the Piston may not be exactly parallel with the base, thus the pressed
face may be at a slight angle to the opposite face. Depending on the type of locking
features the compaction force F2 can be applied perpendicular to the end, top or front-back
faces of the block (Kintingu, 2009).
Figure 2.4: Schematic Diagram of an SSB Compressing Machine.
(Kintingu, 2009)
11
2.5.1 Perpendicular Compaction Force
For any given compaction pressure this minimises the force that has to be applied since
the area of the block end is small. Therefore, minimising force allows the press linkages
to be made less strong. As shown in Figure 2.4, the pressure inside the brick during
moulding is likely to be more variable, as the piston-end (𝐹2) of the brick experiences full
pressure (P) (Kintingu, 2009).
𝑃𝑃𝑖𝑠𝑡𝑜𝑛 =𝐹2
𝐴 𝑒𝑛𝑑𝑓𝑎𝑐𝑒 (2.1)
Where:
P = Resultant pressure
F2 = Applied piston force and
A = Surface area perpendicular to the applied force
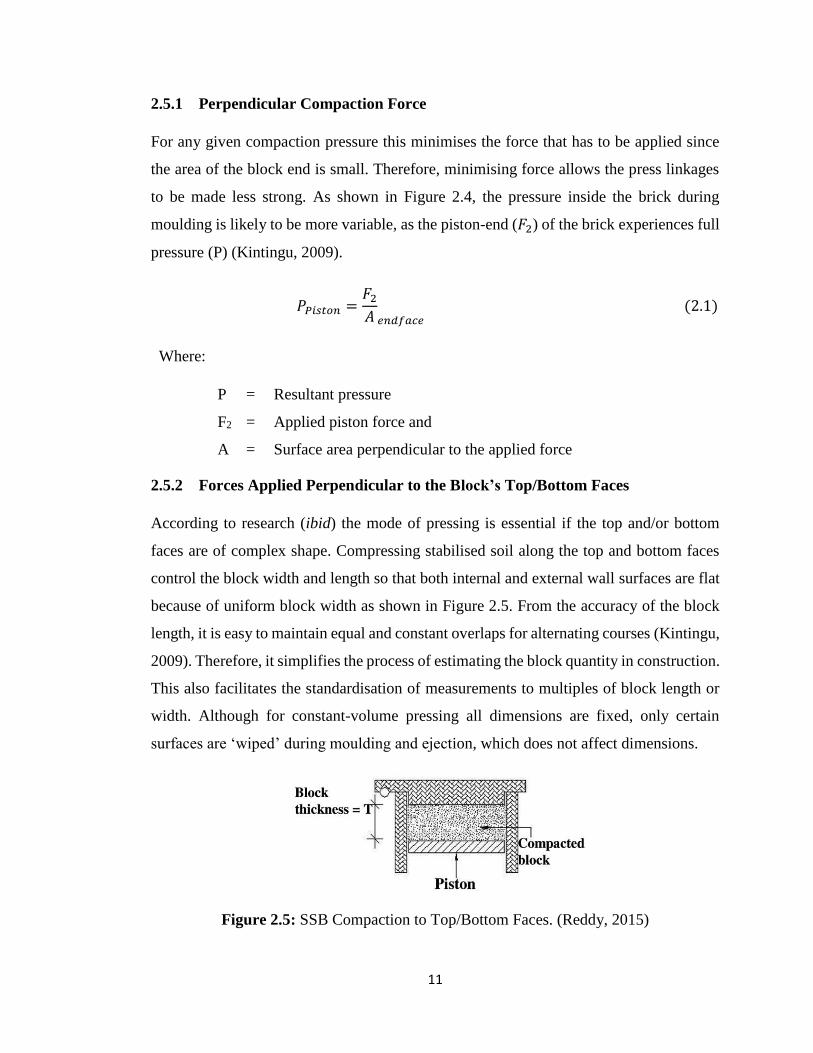
2.5.2 Forces Applied Perpendicular to the Block’s Top/Bottom Faces
According to research (ibid) the mode of pressing is essential if the top and/or bottom
faces are of complex shape. Compressing stabilised soil along the top and bottom faces
control the block width and length so that both internal and external wall surfaces are flat
because of uniform block width as shown in Figure 2.5. From the accuracy of the block
length, it is easy to maintain equal and constant overlaps for alternating courses (Kintingu,
2009). Therefore, it simplifies the process of estimating the block quantity in construction.
This also facilitates the standardisation of measurements to multiples of block length or
width. Although for constant-volume pressing all dimensions are fixed, only certain
surfaces are ‘wiped’ during moulding and ejection, which does not affect dimensions.
Figure 2.5: SSB Compaction to Top/Bottom Faces. (Reddy, 2015)

12
However, other variations in block dimensions made in a fixed-volume press might be
caused by the following:
Air trapped at piston or mould-end
Expansion on the release of pressure (in the direction of the retreating piston)
Distortion during de-moulding
Rocking of the piston, so the pressed face is not perpendicular to other faces
2.6 ISSB Making Machine Link Mechanism
Generally, ISSB making machines have a casing to take up the soil mixture for the
required block profile or shape. The casing thickness is carefully selected to stand the high
compression load exerted during the compression process. For manually operated
machines the compression is achieved by manual pressing based on the link bar
mechanism employed. Usually, a crank-slider or crank-rocker mechanism is applied to
translate rotary motion into a linear system for link bar transmission of compaction force.
The slider-crank mechanism is considered as one of the most used systems in the field of
engineering. It is applied in pumps, compressors, steam engines, feeders, crushers,
punches and pressing machines (Anis, 2012).
Furthermore, the slider-crank mechanism is central to diesel and gasoline internal
combustion engines, which play an indispensable role in modern living. Mainly, the
slider-crank mechanism consists of a crank, slider block, and connecting rod. This system
works on the principle of converting the rotational motion of crank to the translational
motion of the slider block. Therefore, linkage design involves determining dimensions of
constituent links so that the linkage mechanism moves in a manner necessary to carry out
the required task (Sandor and Erdman, 1988).
Consequently, Dicker (2013) concluded that the theory of machines and mechanisms is
an important applied science that is used to understand the relationships between geometry
and motions of machine parts. CAD/CAE Softwares are now used to predict the outcome
of forces that produce motions.

13
In 2012, Anis used MSC Adams software to observe the response of the slider block and
reaction forces between the crank and connecting rod as seen in Figures 2.6 and 2.7
respectively. The loaded slider-crank model generated different reaction force profiles
under forces x, y and z. Therefore, the predicted reaction force after 1.5 minutes was
137.5N exerted by force y, Figure 2.7.
Figure 2.6: Slider Crank Mechanism Model with a Loaded Moment. (Anis, 2012).
Figure 2.7: Joint Reaction Forces. (Anis, 2012).
For IBM-M1 and IBM-M2 machines, linkage mechanisms are greatly used to transmit
compressional loads to achieve maximum compaction. This involves the application of
minimal effort input for an amplified compressing force output.

14
2.7 ISSB Machine Force – Stroke Length Relationship
According to research, the manually operated ISSB making machine force–stroke
relationship for different soils require large force towards the end of the compaction stroke
Figure 2.8. This means that the mechanism of an ISSB making machine should be capable
of providing gradually increasing force amplification as compaction proceeds,
(Reddy, 2015). The toggle mechanism is ideally suited for this purpose, as it has a large
mechanical advantage that produces a large output force at the end of the stroke. This
force increases and approaches infinity as the angle between the links reduces. Therefore,
Toggle mechanisms are used extensively for manually operated tools and clamps where a
large force is required.
Figure 2.8: Force-Stroke Relationship. (Reddy, 2015).
TDAU has therefore designed two ISSB making machines as prototype machines using
the principle of crank and slider (toggle) mechanism. The two machines IBM-M1 and
IBM-M2 making machines compress the block horizontally and vertically respectively.
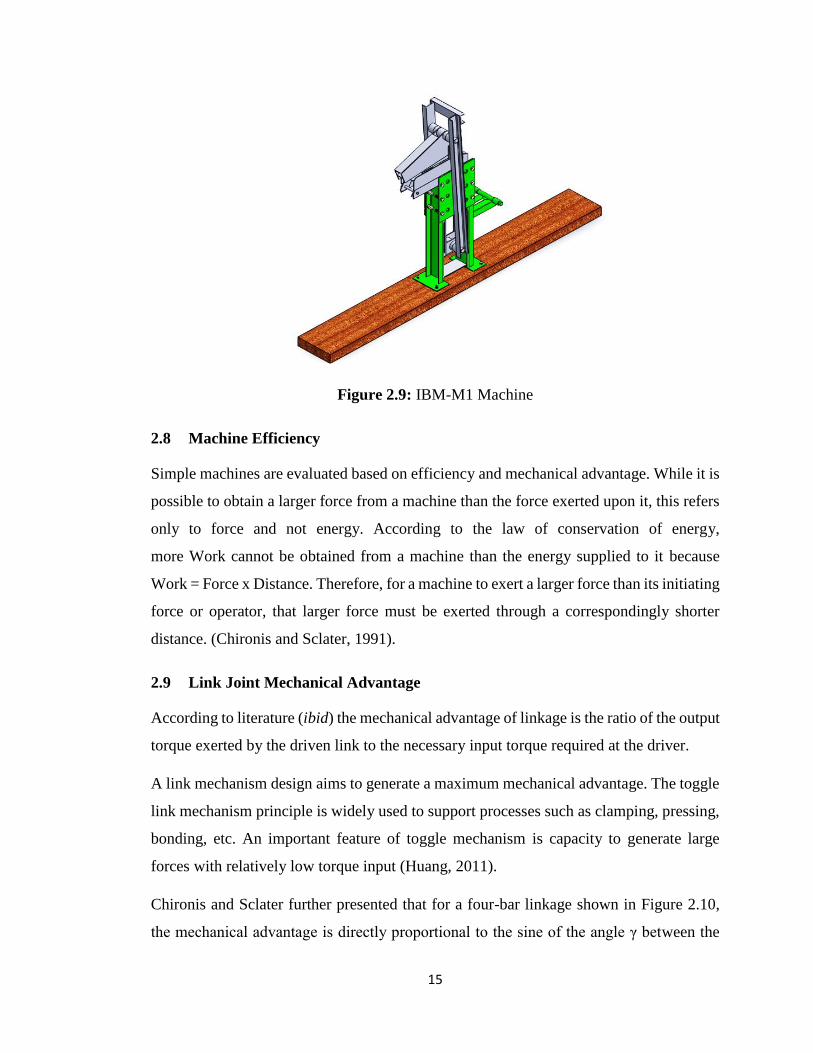
In this case, the horizontal compressing machine, Figure 2.9, has fixed block height and
width while the length is controlled along the stroke direction and achieved at maximum
compressive loading. In 2009, Kintingu explored the design of ISSBs for enhanced wall
construction in which he presented the advantage of fixed block length that it results in
the maintenance of equal and constant overlaps for alternating courses (Kintingu, 2009).
Therefore, this simplifies the process of estimating the number of blocks required in
construction. However, due to factors such as machine wear, manufacturing error, the top
and bottom plate covers of the block length tend to have marginal variances.
15
Figure 2.9: IBM-M1 Machine
2.8 Machine Efficiency
Simple machines are evaluated based on efficiency and mechanical advantage. While it is
possible to obtain a larger force from a machine than the force exerted upon it, this refers
only to force and not energy. According to the law of conservation of energy,
more Work cannot be obtained from a machine than the energy supplied to it because
Work = Force x Distance. Therefore, for a machine to exert a larger force than its initiating
force or operator, that larger force must be exerted through a correspondingly shorter
distance. (Chironis and Sclater, 1991).
2.9 Link Joint Mechanical Advantage
According to literature (ibid) the mechanical advantage of linkage is the ratio of the output
torque exerted by the driven link to the necessary input torque required at the driver.
A link mechanism design aims to generate a maximum mechanical advantage. The toggle
link mechanism principle is widely used to support processes such as clamping, pressing,
bonding, etc. An important feature of toggle mechanism is capacity to generate large
forces with relatively low torque input (Huang, 2011).
Chironis and Sclater further presented that for a four-bar linkage shown in Figure 2.10,
the mechanical advantage is directly proportional to the sine of the angle γ between the

16
coupler and the follower and inversely proportional to the sine of the angle β between the
coupler and the driver. Hence, both these angles and the mechanical advantage, change
continuously as the linkage moves.
Figure 2.10: Four-Bar Linkage Mechanism. (Dicker, 2003).
When the sine of the angle β becomes zero, the mechanical advantage becomes infinite,
thus, at such a position, only a small input torque is necessary to overcome a large output
torque load. This is the case when the driver AB of Figure 2.10 is directly in line with the
coupler BC, it occurs when the crank is in position ABl and again when the crank is in
position AB4. It should be noted that these also define the extreme positions of travel of
the rocker DC, and DC4. When the four-bar linkage is in either of these positions, the
mechanical advantage is infinite and the linkage is said to be in a toggle position (the angle
β between the crank and the coupler equals 1800). In position AB4 the angle is 00 and in
position AB1, the angle is 1800
In the case of the IBM-M2 machine shown in Figure 2.11, the machine uses the crank and
slider (toggle) mechanism for the transformation of force required to compress soil
mixture. Therefore, it is important in this study to understand the force transmission
characteristics of the ISSB machine mechanism.

17
Figure 2.11: Schematic Drawing of IBM-M2 Machine
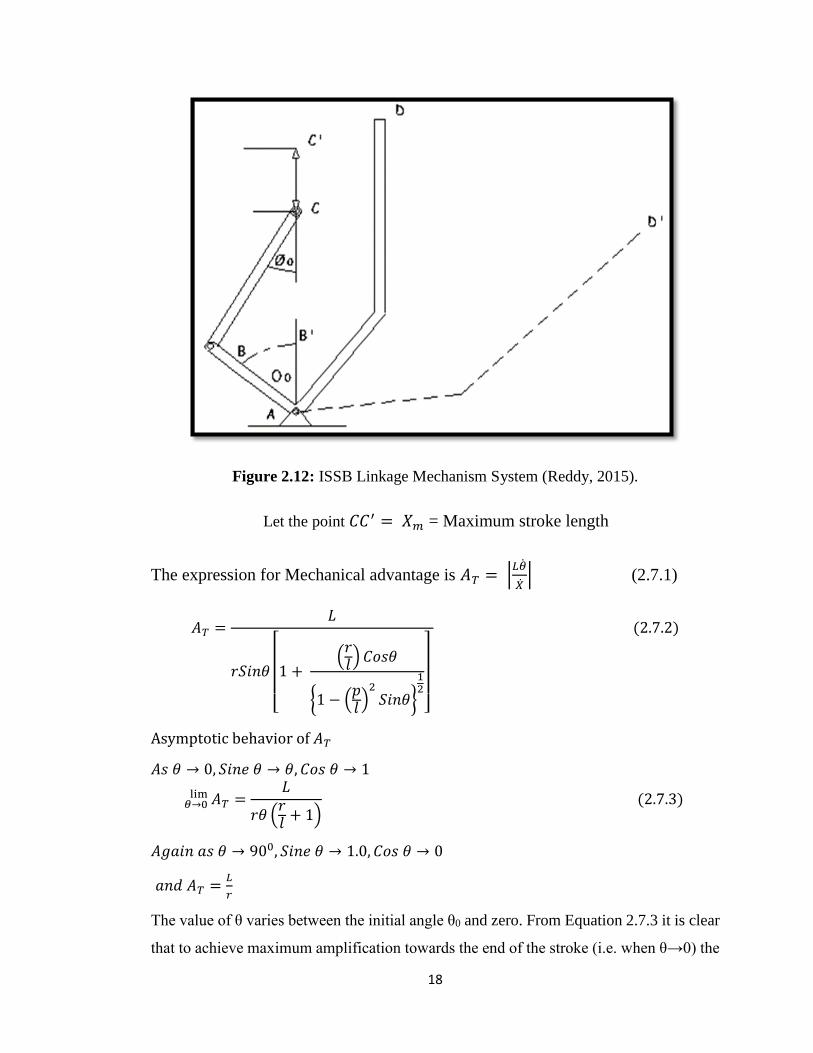
2.9.1 Forward Toggle Mechanical Advantage
In 2015, Reddy (2015) showed the determination of the mechanical advantage of a slider-
crank bar mechanism. This was achieved by considering a typical free body diagram of a
ram press, presented in Figure 2.12, in which angles ∅0and 𝜃0 were taken as initial
transmission and crank angles respectively of the toggle link mechanism for a manually
operated ISSB making machine. For a crank-slider mechanism the maximum value of the
stroke length 𝐶𝐶′ depends on the initial angle θ. As angle θ approaches zero the point C
moves to 𝐶′
18
Figure 2.12: ISSB Linkage Mechanism System (Reddy, 2015).
Let the point 𝐶𝐶′ = 𝑋𝑚 = Maximum stroke length
The expression for Mechanical advantage is 𝐴𝑇 = |𝐿�̇�
�̇�| (2.7.1)
𝐴𝑇 =𝐿
𝑟𝑆𝑖𝑛𝜃
[
1 + (𝑟𝑙) 𝐶𝑜𝑠𝜃
{1 − (𝑝𝑙)2
𝑆𝑖𝑛𝜃}
12
]
(2.7.2)
Asymptotic behavior of 𝐴𝑇
𝐴𝑠 𝜃 → 0, 𝑆𝑖𝑛𝑒 𝜃 → 𝜃, 𝐶𝑜𝑠 𝜃 → 1
𝐴𝑇𝜃→0lim =
𝐿
𝑟𝜃 (𝑟𝑙+ 1)
(2.7.3)
𝐴𝑔𝑎𝑖𝑛 𝑎𝑠 𝜃 → 900, 𝑆𝑖𝑛𝑒 𝜃 → 1.0, 𝐶𝑜𝑠 𝜃 → 0
𝑎𝑛𝑑 𝐴𝑇 =𝐿
𝑟
The value of θ varies between the initial angle θ0 and zero. From Equation 2.7.3 it is clear
that to achieve maximum amplification towards the end of the stroke (i.e. when θ→0) the

19
r/l ratio should be close to zero. Hence, to keep ‘AT’ large for a given value of θ, L/r
should be large and r/l should be close to zero. In practice, it is difficult to have
exceedingly small r/l ratios (ibid).
2.9.2 Reverse Toggle Mechanical Advantage
Reddy (2015) also indicated that for the reverse toggle system the value of θ varies
between the initial angle θ0 and 0. Equation 2.7.6 describes the behaviour of ART as θ
tends to zero. For a particular value of θ, ‘ART’ will be large if L/r is large and if r/l is
close to 1.0. Equations 2.7.3 and 2.7.6 indicate that, for particular values of θ, L and (r)/l,
the reversed toggle will always have a better amplification than the toggle mechanism.
The expression for mechanical advantage is 𝐴𝑅𝑇 = |𝐿�̇�
�̇�| (2.7.4)
𝐴𝑅𝑇 =𝐿
𝑟𝑆𝑖𝑛𝜃
[
(𝑟𝑙) 𝐶𝑜𝑠𝜃
{1 − (𝑝𝑙)2
𝑆𝑖𝑛𝜃}
12
− 1
] (2.7.5)
Asymptotic behavior of 𝐴𝑇
𝐴𝑠 𝜃 → 0, 𝑆𝑖𝑛𝑒 𝜃 → 𝜃, 𝐶𝑜𝑠 𝜃 → 1, 𝑆𝑖𝑛2𝜃 → 0
𝐴𝑅𝑇 𝜃→0lim =
𝐿
𝑟𝜃 (𝑟𝑙− 1)
(2.7.6)
𝐴𝑔𝑎𝑖𝑛 𝑎𝑠 𝜃 → 900, 𝑆𝑖𝑛𝑒 𝜃 → 1.0, 𝐶𝑜𝑠 𝜃 → 0
𝑎𝑛𝑑 𝐴𝑅𝑇 =𝐿
𝑟
2.10 Displacement Expression of the Crank – Slider Mechanism
The travel or displacement of the Crank – slider system forms an important effect on the
compression ratio during force transmission of a pressing machine. In the case of an ISSB
compressing machine and according to literature (Ambekar, 2007) the displacement of an
inline crank and slider can be determined.

20
Consider Figure 2.13 showing crank OC of a slider-crank mechanism in a position making
angle θ with the inner dead position OC1. Let the crank and connecting rod lengths be r
and l respectively.
Figure 2.13: Crank – Slider Mechanism. (Ambekar, 2007).
When the crank is at inner dead centre position OC1, the connecting rod CP lies along the
line of stroke and for this position
𝑂𝑃1 = (𝑙 + 𝑟)
When the crank rotate through 𝜃 in clockwise direction the distance of piston from crank
shaft centre is given by
𝑂𝑃2 = (𝑙𝑐𝑜𝑠∅ + 𝑟𝑐𝑜𝑠𝜃)
Thus displacement 𝑥 of the piston 𝑃 from the dead centre inner position is given by
𝑥𝑝 = (𝑂𝑃1 − 𝑂𝑃2)
= 𝑟(1 − 𝑐𝑜𝑠𝜃) + 𝑙(1 − 𝑐𝑜𝑠∅)
= 𝑟[(1 − 𝑐𝑜𝑠𝜃) + 𝑙/𝑟(1 − 𝑐𝑜𝑠∅)] (2.8.1)
Again from right angled triangles 𝐶𝑀𝑂 and 𝐶𝑀𝑃2,
𝐶𝑀 = 𝑙𝑠𝑖𝑛∅ = 𝑟𝑠𝑖𝑛𝜃
𝑠𝑖𝑛∅ = (𝑟
𝑙) 𝑠𝑖𝑛𝜃
𝑐𝑜𝑠∅ = √1 − 𝑠𝑖𝑛2∅ =𝑟
𝑙√(𝑙/𝑟)2 − 𝑠𝑖𝑛𝜃
𝑐𝑜𝑠∅ =1
𝑛√𝑛2 − 𝑠𝑖𝑛2𝜃 = √1 − (
𝑠𝑖𝑛𝜃
𝑛)
2
(2.8.2)
Now invoking the binomial expansion
(1 − 𝑥)𝑛 = 1 − 𝑛𝑥 +𝑛(𝑛 − 1)
2!𝑥2 +
𝑛(𝑛 − 1)(𝑛 − 2)
3!𝑥3 + ⋯

21
We have the R.H.S of the equation (2.8.2) as
(1 −1
𝑛2𝑠𝑖𝑛2𝜃)
1/2
= 1 −1
𝑛2𝑠𝑖𝑛2𝜃 −
1
8𝑛4 − 𝑠𝑖𝑛4𝜃 −
1
16𝑛6 − 𝑠𝑖𝑛6𝜃 …
𝐴𝑙𝑠𝑜 (1 − 𝑐𝑜𝑠∅) =1
𝑛2𝑠𝑖𝑛2𝜃 +
1
8𝑛4+ 𝑠𝑖𝑛4𝜃 +
1
16𝑛6 + 𝑠𝑖𝑛6𝜃 … (2.8.3)
Again substituting for 𝑐𝑜𝑠∅ from (2.8.2) in (2.8.1),
𝑥𝑝 = 𝑟(1 − 𝑐𝑜𝑠𝜃) + 𝑛 [1 −1
𝑛√𝑛2 − 𝑠𝑖𝑛2𝜃] 𝑟
= 𝑟(1 − 𝑐𝑜𝑠𝜃) + [𝑛 − √𝑛2 − 𝑠𝑖𝑛2𝜃] 𝑟 (2.8.4)
2.11 Determination of Forces Acting in Mechanisms
Mechanisms are used not only for producing program motions but also for transmitting
forces necessary both for performing working processes and overcoming the inertia of
moving links. For this reason, the geometric investigation must be completed by the
analysis of forces in the process of mechanism design.
The investigation of geometric conditions for the transmission of forces is conducted
through a mechanism based on a simplified physical model, which may be called a static
model. With the help of static model equilibrium, conditions of a mechanism in different
positions are essentially investigated. Moreover, it is assumed that in every position
investigated only forces caused by workloads are taken into consideration whereas friction
forces are neglected (Kolovsky, 2000).
Generally, the critical factor concerning force analysis of a static model is to determined
generalised forces to be applied to the input links of a mechanism. In this case, Kozlovsky
considered a crank slider mechanism Figure 2.14, for force determination in link
mechanism.

22
Figure 2.14: Force Determination in the Slider-Crank Mechanism (Kolovsky, 2000).
Firstly, the moment equations are considered for all external forces (i.e. for forces 𝑁𝐵,
𝑃 and moment 𝑀𝐵𝑅) with respect points B, A and O. Taking into account that joints A and
B are “passive,” i.e. that at these joints no balancing forces are applied and that at joint O
a force moment Q is applied and the following is obtained:
∑𝑀𝐵 = 𝑀𝐵𝑅 = 0, ∑𝑀𝐴 = 𝑁𝐵(𝑥𝐵 − 𝑥𝐴) + 𝑃𝑦𝐴 + 𝑀𝐵
𝑅
∑𝑀𝑂 =𝑁𝐵𝑥𝐵 + 𝑀𝐵𝑅 + 𝑃𝑦𝑂 + 𝑄 = 0 (2.9.1)
Solving these equations for unknown reactions 𝑁𝐵, 𝑀𝐵𝑅 and the moment 𝑄 are
calculated.
Since 𝑟𝑐𝑜𝑠𝑞 + √𝑙2 − 𝑟2 𝑠𝑖𝑛2𝑞, 𝑥𝐴 = 𝑟𝑠𝑖𝑛𝑞, 𝑦𝑂 = 0
From equation (2.9.1)
𝑀𝐵𝑅 = 0,𝑁𝐵 = −𝑃
𝑦𝐴
𝑥𝐵 − 𝑥𝐴= −𝑃
𝑟𝑠𝑖𝑛𝑞
√𝑙2 − 𝑟2 𝑠𝑖𝑛2𝑞
𝑄 = −𝑁𝐵𝑥𝐵 = 𝑃𝑟𝑠𝑖𝑛𝑞
√𝑙2 − 𝑟2 𝑠𝑖𝑛2𝑞 (𝑟𝑐𝑜𝑠𝑞 + √𝑙2 − 𝑟2 𝑠𝑖𝑛2𝑞)
= 𝑃 (𝑟𝑠𝑖𝑛𝑞 +𝑟2 𝑠𝑖𝑛𝑞. 𝑐𝑜𝑠𝑞
√𝑙2 − 𝑟2 𝑠𝑖𝑛2𝑞) (2.9.2)

23
2.12 Physical Product Modelling and Simulation
Modelling and simulation involve the use of physical and logical representation of a given
system to generate and help determine decisions and make a prediction about the system.
This approach is widely used in various areas such as part design, manufacturing, and
product development (Hughes, 2012).
It’s a process that includes model creation as a representation of the construction and
working of some system of interest. The main goal of a model is to enable prediction of
the effect of the changes to the system of a close representation of the real system and
incorporate most of its salient features. This should not be so complex and impossible to
understand and experiment with it. An important issue in modelling is model validity.
Model validation techniques include simulating the model under known input conditions
and comparing model output with system output (ibid).
Recent approach to design and manufacturing involves the application of modelling and
simulation software. Hughes (2012) analysed a toggle mechanism by modelling and
simulation, Figure 2.15, to investigate sensitivity to link sizes and compliance materials
Hughes analysed a toggle mechanism to investigate and evaluate the impact that a change
in length of links or change in the choice of material for the compliant element within the
linkage has on the stress within the linkage. Therefore, Figure 2.15 is an illustration of a
CAD modelled toggle mechanism showing the mesh for stress analysis in Finite Element
Analysis (FEA).

24
Figure 2.15: Modelled Linkage using CAD Software. (Hughes, 2012)
Further, modelling and simulation may be carried out systematically according to the flow
as presented in Figure 2.16 by Kuang-HuaChang (2006). In this case, the analysis
procedure starts by building a CAD model based on the concept of design using CAD
software. Then the model can either be imported to a mechanism package in case of
limitations. This may be preceded by definition of Joints, Constraints and input forces
which are known critical input values required for analysis. For force balance definition,
this is an inverse static analysis in which a resulting reaction force is derived from a
specific static configuration.

25
Figure 2.16: Flow of the CAD-Based Mechanism Optimization.
(Kuang-HuaChang, 2006).

26
CHAPTER 3 METHODS AND MATERIALS
3.1 Introduction
It is important to note that effective manufacturing of complete machines, mechanisms
and any other engineering components can now be effectively and economically achieved
by the application of CAD/CAE software. The purpose of this research was to improve
the ISSB machine design for enhanced performance by using CAD/CAE software. This
was achieved by studying the existing machines (IBM-M1 and IBM-M2) operating
principle. In this chapter, the research objectives, methodology design used, experiments
and tests performed are elaborated.
3.2 Research Design
3.2.1 General Method
In this study, the general method involved the study of IBM-M1 and IBM-M2 machines.
Experiments were done to assess their performance in terms of resultant block strength,
production rate and machine production capacity. Based on the results, design concepts
of the IBM-H1 machines were generated. To determine the optimal material thickness and
strength required to withstand compression forces, deformation and stress simulation on
the concept design machine parts was done using Solidworks 2017, CAD software. The
optimum values were subsequently used to design the IBM-H1. Furthermore, the designed
IBM-H1 machine as shown in Figure 3.1 was manufactured and tested.

27
Figure 3.1: IBM-H1 Machine
3.2.2 Specific Procedures.
The following is the procedure that was followed:
Study the functional system of the ISSB machine.
Creating a 3D Model and simulation for the existing machine using CAD
software.
Concept redesign modelling.
Stress simulation and material optimisation.
Construction of the IBM-H1 machine
Performance testing
Figure 3.2 shows a typical systematic design and production flowchart which was
adopted in the design and manufacture of the IBM-H1 in this study.
28
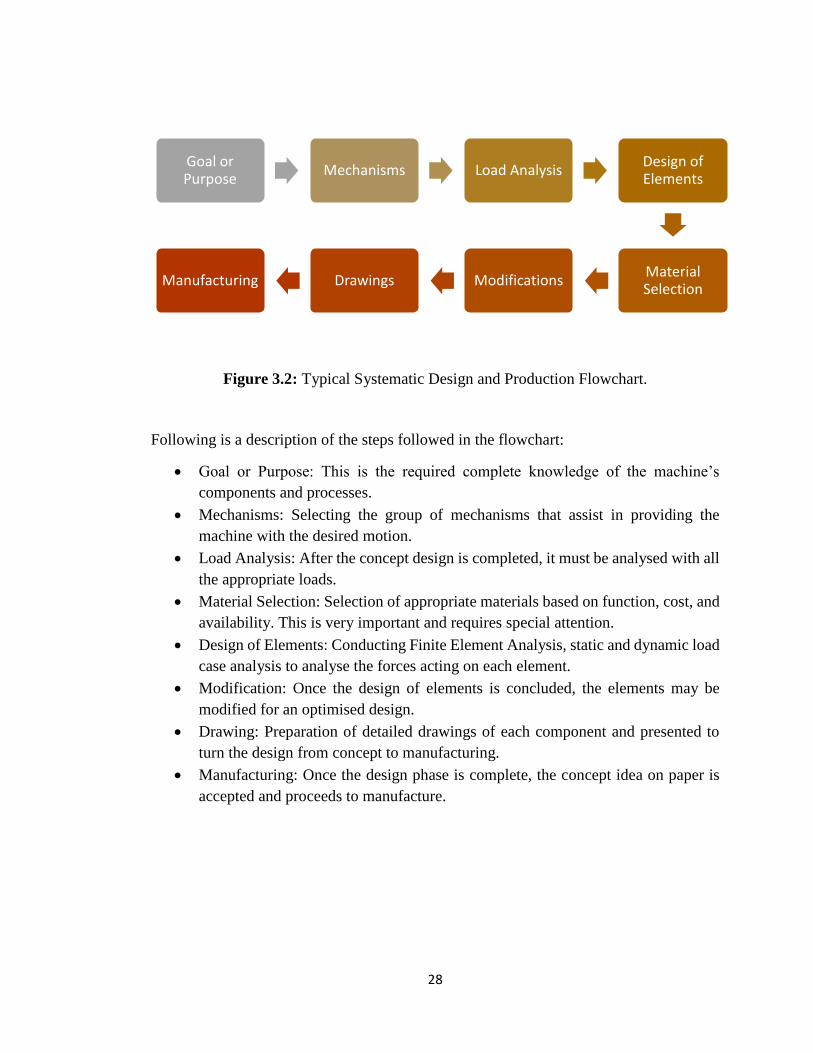
Figure 3.2: Typical Systematic Design and Production Flowchart.
Following is a description of the steps followed in the flowchart:
Goal or Purpose: This is the required complete knowledge of the machine’s
components and processes.
Mechanisms: Selecting the group of mechanisms that assist in providing the
machine with the desired motion.
Load Analysis: After the concept design is completed, it must be analysed with all
the appropriate loads.
Material Selection: Selection of appropriate materials based on function, cost, and
availability. This is very important and requires special attention.
Design of Elements: Conducting Finite Element Analysis, static and dynamic load
case analysis to analyse the forces acting on each element.
Modification: Once the design of elements is concluded, the elements may be
modified for an optimised design.
Drawing: Preparation of detailed drawings of each component and presented to
turn the design from concept to manufacturing.
Manufacturing: Once the design phase is complete, the concept idea on paper is
accepted and proceeds to manufacture.
Goal or Purpose
Mechanisms Load AnalysisDesign of Elements
Material Selection
ModificationsDrawingsManufacturing

29
3.2.3 Research Site
It is important to note that laboratory experiments, fabrication, machining and
performance tests were conducted from the Department of Mechanical Engineering in the
School of Engineering at the University of Zambia.
3.3 Simulation of HISSB Model Parts
Solidworks simulation employs a generative method for the support of design
optimisation. Design variables vary between their respective lower and upper bounds.
These design variables are combined to create individual design scenarios. Finite element
analyses are carried out for all scenarios generated. Among the scenarios evaluated,
feasible designs are collected and within the feasible designs, the best design that yields
the lowest value in the objective function is identified as the solution to the design problem
(Kuang-Hua Chang, 2006).
In this research simulation and optimisation of materials for analysis of stress and
deformation was done. Production of compressed earth blocks involves the application of
high compressive force to achieve acceptable block strength according to the stabiliser
composition. Therefore, the determination of material stresses and deformation using
modern CAD software, Solidworks 2017, was carried out on a highly stressed IBM-H1
machine design model. To have optimal material weight of available compression forces
material optimisation was done on machine frame and side cover plate.
30
3.4 Experiments and Tests
3.4.1 ISSB Block Making Process
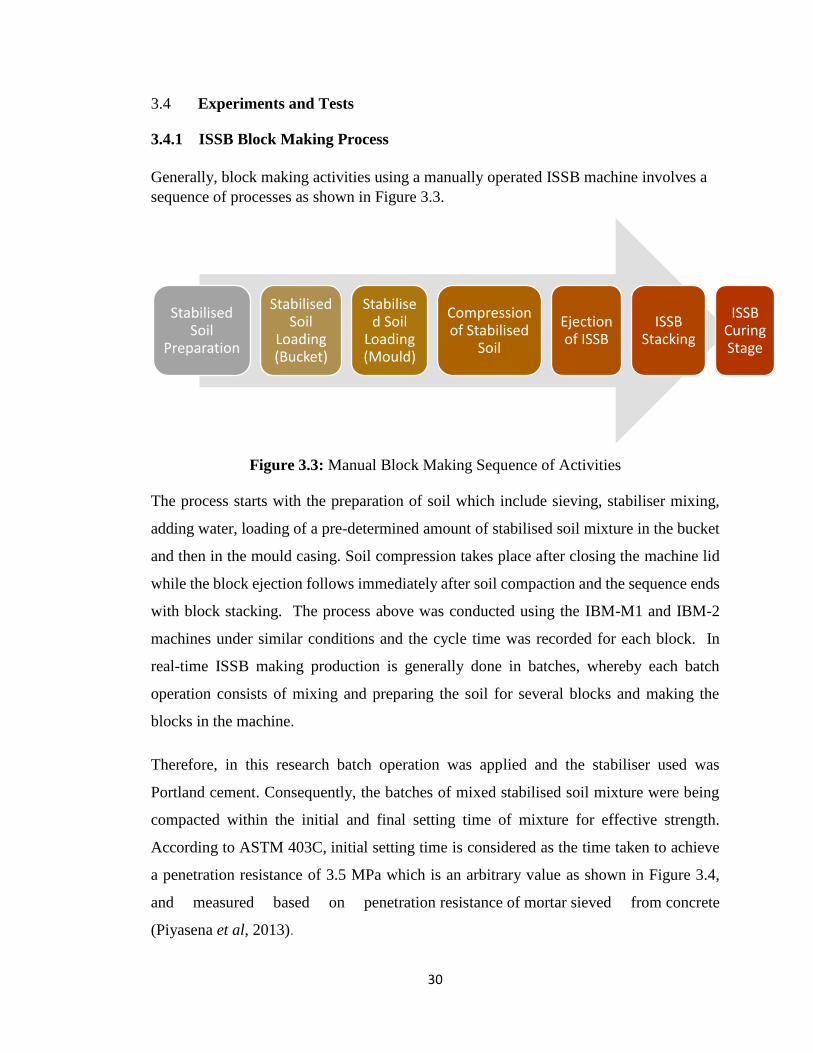
Generally, block making activities using a manually operated ISSB machine involves a
sequence of processes as shown in Figure 3.3.
Figure 3.3: Manual Block Making Sequence of Activities
The process starts with the preparation of soil which include sieving, stabiliser mixing,
adding water, loading of a pre-determined amount of stabilised soil mixture in the bucket
and then in the mould casing. Soil compression takes place after closing the machine lid
while the block ejection follows immediately after soil compaction and the sequence ends
with block stacking. The process above was conducted using the IBM-M1 and IBM-2
machines under similar conditions and the cycle time was recorded for each block. In
real-time ISSB making production is generally done in batches, whereby each batch
operation consists of mixing and preparing the soil for several blocks and making the
blocks in the machine.
Therefore, in this research batch operation was applied and the stabiliser used was
Portland cement. Consequently, the batches of mixed stabilised soil mixture were being
compacted within the initial and final setting time of mixture for effective strength.
According to ASTM 403C, initial setting time is considered as the time taken to achieve
a penetration resistance of 3.5 MPa which is an arbitrary value as shown in Figure 3.4,
and measured based on penetration resistance of mortar sieved from concrete
(Piyasena et al, 2013).
Stabilised Soil
Preparation
Stabilised Soil
Loading (Bucket)
Stabilised Soil
Loading (Mould)
Compression of Stabilised
Soil
Ejection of ISSB
ISSB Stacking
ISSB Curing Stage

31
Figure 3.4: Penetration Resistance vs Elapsed Time. (Payasena et al, 2013)
3.4.2 ISSB Making Machine Production Cycle Time
Cycle time is the time the machine needs to produce one product. Therefore, it is an
important factor in any production arrangement. The faster a machine can produce parts,
the more products can be produced within a specific time and the higher the returns.
Therefore, the production cycle time for manual TDAU ISSB was studied.
To determine ISSB production time, a time study method approach was employed and
observation sheets were constructed Appendix A. A stopwatch was used to time individual
cycle duration processes of stabilised soil block production. Process times were recorded
and averaged after a fifteen sample blocks were made. Standard deviations were computed
to give measures of variances in the performance times. The mean duration for each
process was added yielding the cycle time for a unit block.
3.4.3 Block Compressive Strength Testing
The measurement of compressive strength is an important factor in any analysis of
masonry units. To determine the compressive strength of the IBM-M1 and IBM-2
machines, specimens were made and tested according to ASTM C67-07. In this
experiment the variable factor was the stabiliser (Portland cement) composition. Fifteen
32
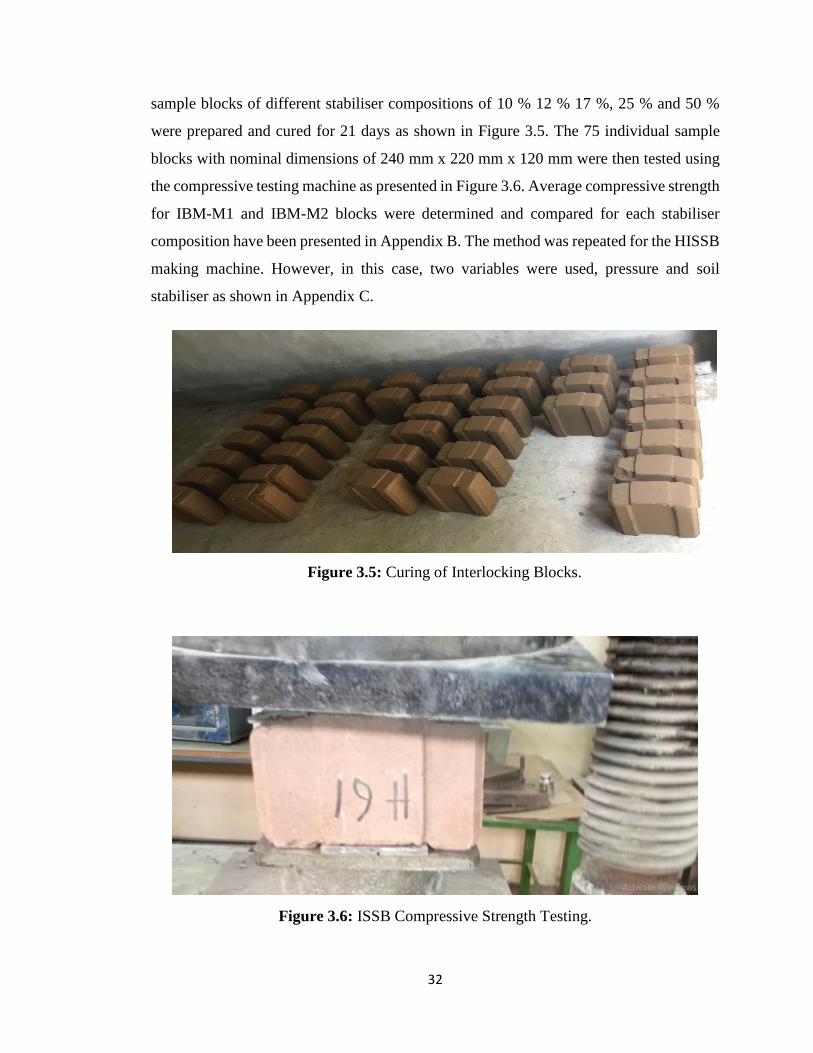
sample blocks of different stabiliser compositions of 10 % 12 % 17 %, 25 % and 50 %
were prepared and cured for 21 days as shown in Figure 3.5. The 75 individual sample
blocks with nominal dimensions of 240 mm x 220 mm x 120 mm were then tested using
the compressive testing machine as presented in Figure 3.6. Average compressive strength
for IBM-M1 and IBM-M2 blocks were determined and compared for each stabiliser
composition have been presented in Appendix B. The method was repeated for the HISSB
making machine. However, in this case, two variables were used, pressure and soil
stabiliser as shown in Appendix C.
Figure 3.5: Curing of Interlocking Blocks.
Figure 3.6: ISSB Compressive Strength Testing.
33
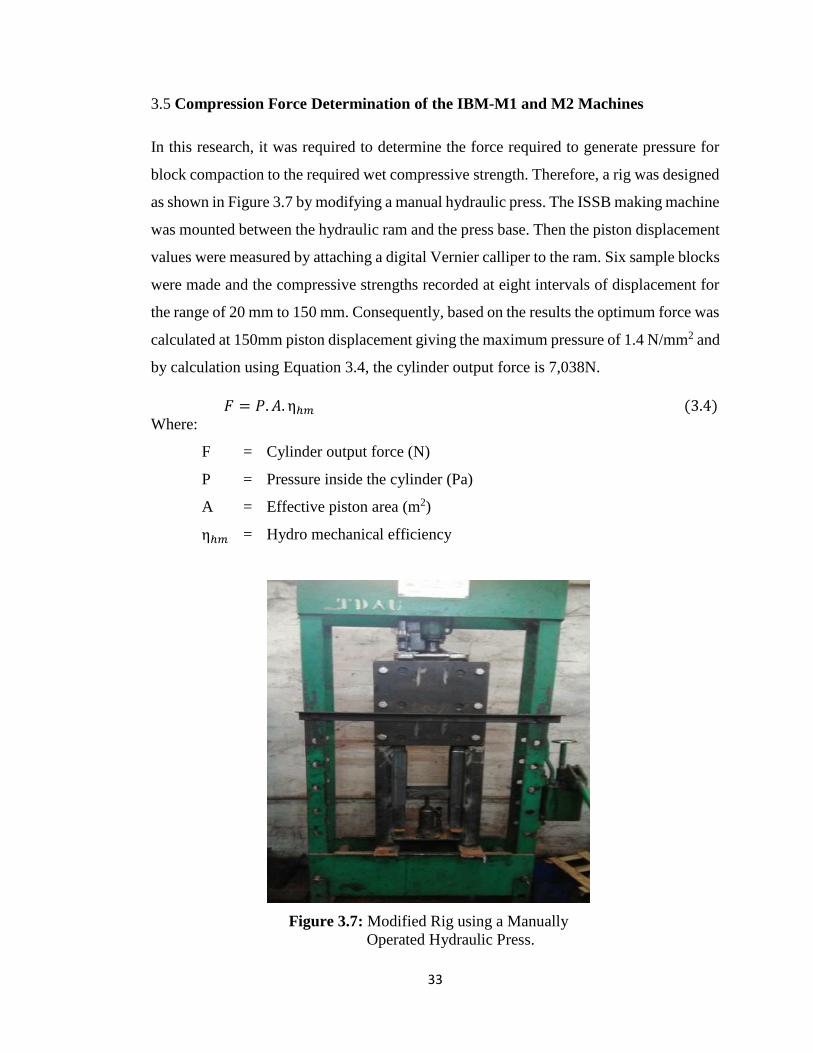
3.5 Compression Force Determination of the IBM-M1 and M2 Machines
In this research, it was required to determine the force required to generate pressure for
block compaction to the required wet compressive strength. Therefore, a rig was designed
as shown in Figure 3.7 by modifying a manual hydraulic press. The ISSB making machine
was mounted between the hydraulic ram and the press base. Then the piston displacement
values were measured by attaching a digital Vernier calliper to the ram. Six sample blocks
were made and the compressive strengths recorded at eight intervals of displacement for
the range of 20 mm to 150 mm. Consequently, based on the results the optimum force was
calculated at 150mm piston displacement giving the maximum pressure of 1.4 N/mm2 and
by calculation using Equation 3.4, the cylinder output force is 7,038N.
𝐹 = 𝑃. 𝐴. ηℎ𝑚 (3.4)
Where:
F = Cylinder output force (N)
P = Pressure inside the cylinder (Pa)
A = Effective piston area (m2)
ηℎ𝑚 = Hydro mechanical efficiency
Figure 3.7: Modified Rig using a Manually
Operated Hydraulic Press.
34
CHAPTER 4 DESIGN AND MANUFACTURING OF THE IBM-H1 MACHINE
4.1 Introduction
This chapter outlines the design of the IBM-H1 machine concept, operating principle and
machine parts. The chapter also presents a detailed IBM-H1 CAD/CAE design model
and the manufacturing process. It should be noted that the design process was carried out
using Solidworks 2017, CAD software.
4.2 Concept Design Generation
A product concept is an approximate description of the technology, working principle and
form of the product. It is a concise description of how the product will satisfy the user. A
concept is usually expressed as a sketch or as a rough three-dimensional model and is
often accompanied by a brief textual description. The degree to which a product satisfies
the users and can be successfully commercialised depends to a large measure on the
quality of the underlying concept. A good concept is sometimes poorly implemented in
subsequent development phases, but a poor concept can rarely be manipulated to achieve
commercial success (Ulrich and Eppinger, 2003).
In this study three concepts were generated, manually operated Horizontal Compressing
ISSB (HCISSB) making machine, Vertically Compacting ISSB (VCISSB) making
machine and hydraulically operated ISSB (IBM-H1) machine.

35
4.3.1 HCISSB Making Machine Design Concept
The concept of design and development is a process of developing ideas to solve specified
design problems. In this research, three concepts were created. The first one being a
manual HCISSB making machine, Figure 4.1. The design characteristics include manual
and horizontal block compaction using the principle of the toggle link mechanism. The
machine is fitted with a hopper for holding enough soil mixture at once while the mould
casing has a quick return lid opening.
Figure 4.1: HCISSB Making Machine.
36
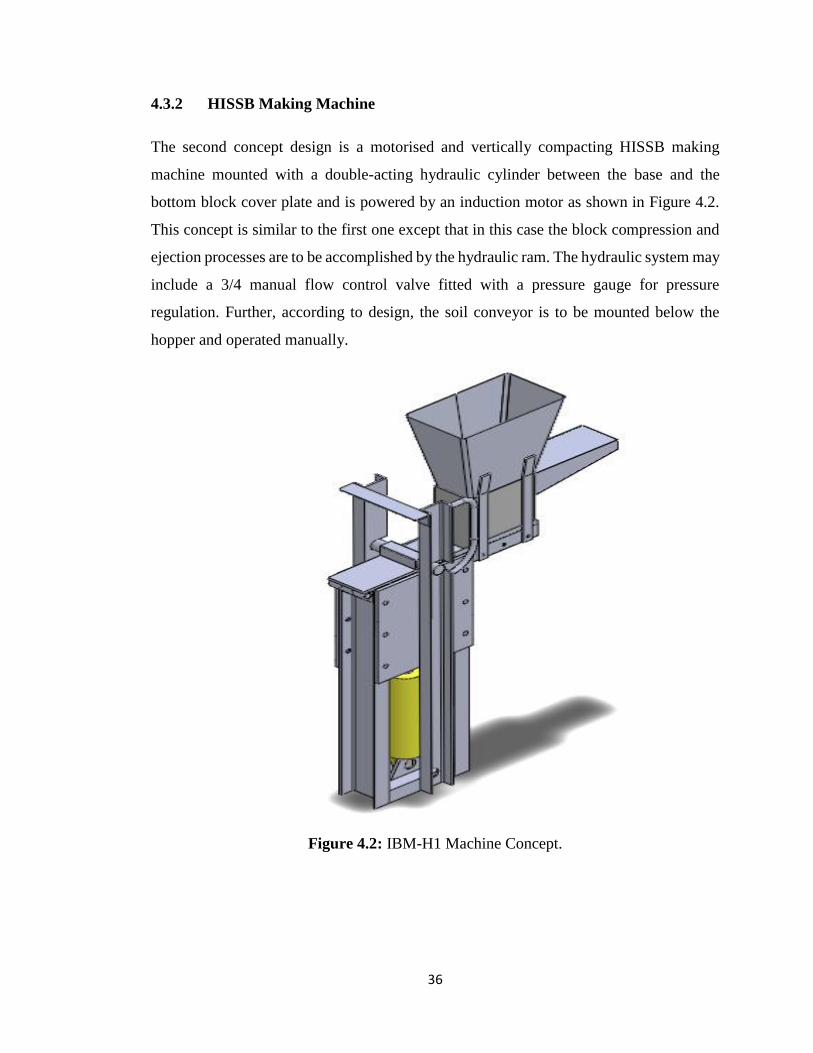
4.3.2 HISSB Making Machine
The second concept design is a motorised and vertically compacting HISSB making
machine mounted with a double-acting hydraulic cylinder between the base and the
bottom block cover plate and is powered by an induction motor as shown in Figure 4.2.
This concept is similar to the first one except that in this case the block compression and
ejection processes are to be accomplished by the hydraulic ram. The hydraulic system may
include a 3/4 manual flow control valve fitted with a pressure gauge for pressure
regulation. Further, according to design, the soil conveyor is to be mounted below the
hopper and operated manually.
Figure 4.2: IBM-H1 Machine Concept.

37
4.3.3 VCISSB Making Machine
This concept is based on Toggle-link mechanisms which are widely used in product
manufacturing such as pressing machines, lifting equipment, motion transmission, etc.
Based on their singular characteristics, the mechanisms can be used to generate a large
output force from a small input force. Hence, the mechanism is particularly used for tasks
that demand large forces. Therefore, horizontally compacting ISSB making machine
design, Figure 4.3, incorporates the toggle link mechanism using human effort to generate
high compressive force output. The lid opens at a predetermined bottom plate upward
linear displacement after which the block ejection begins. This concept is based on the
TDAU interlocking block making machine called IBM-M2
Figure 4.3: VCISSB Making Machine

38
4.4 `Concept Analysis and Selection
Concept selection is often performed in two stages as a way of managing the complexity
of evaluating dozens of product concepts. The first stage is called concept screening while
the second one is referred to as concept scoring. Each is supported by a decision matrix
which is used for rating. It is based on a method developed by Stuart Pugh in the 1980s
and is often called Pugh concept selection (Ulrich and Eppinger, 2003). The purpose of
this stage is to narrow down and improve the number of concepts.
Concept scoring is used when the increased resolution will better differentiate among
competing concepts. In this stage relative importance of selecting criteria is weighed and
focuses on more refined comparisons concerning each criterion. The concept scores are
determined by the weighted sum of the ratings (ibid). Therefore, Table 4.1 illustrates the
scoring matrix used in this research.
Table 4.1: Block Making Machines Design Concept Weighting.
Figure 4.2, IBM-H1 machine was considered as the best option for the design and
manufacture of an improved TDAU ISSB making machine for high productivity.
Generally, hydraulic compressing equipment operate efficiently and perform with higher
precision for large loads (Matti, 2002).
DESIGN CONCEPTS
ROW CRITERIA WEIGHTS (%) HCISSB IBM-H1 VCISSB
1 Easy to open Lid 80.0 100.0 100.0 80.0
2 Easy to close Lid 80.0 100.0 100.0 70.0
3 Simplicity to eject block 80.0 50.0 100.0 100.0
4 Mould soil filling 70.0 40.0 90.0 40.0
5 Portability 70.0 100.0 40.0 100.0
6 Weight of machine 50.0 80.0 50.0 60.0
7 Operating pressure 90.0 40.0 100.0 50.0
8 Production capacity 90.0 40.0 90.0 60.0
9 Easy to pick block 60.0 80.0 80.0 70.0
10 Rate of production 80.0 40.0 100.0 50.0
Weighted Average 1.89 2.13 1.91
39
Other advantages are as follows;
Good power to weight ratio of hydraulic systems small components
Easy and flexible transfer of energy with hydraulic hoses and piping
Possibility to remove the actuation from hydraulic power generation due to easy
transfer of hydraulic energy
Hydraulic systems are self-lubricating
The possibility to control hydraulic systems manually or with modern electronics
However, some disadvantages of a hydraulic system are that it can cause accidents arising
from hose rapture and it is expensive since it needs several additional hydraulic system
accessories to operate.
4.5 IBM-H1 Machine Design and Function
The process design includes all activities involved from the original concept to the
finished product. This can be creation of a new product or development of an existing one.
For many years designers sought ways to describe and analyse three-dimensional designs
without building physical models (Shih, 2014). With the advancement of computer
technology, the creation of three-dimensional models on a computer offers a wide range
of benefits. Computer models are easily interpreted and easily altered. Simulation of real-
life load can be applied to computer models and the results graphically displayed.
Solidworks is a suite of programmes, including the Finite Element Analysis (FEA) module
(Solidworks Simulation), which is used to facilitate a concurrent engineering approach to
design, analyse and manufacture engineering products (ibid).
Therefore, during the design of the IBM-H1 machine, parts were designed and modelled
using this CAD software. Dynamic factors were essential during the design of the
IBM-H1 machine parts to achieve compression and block ejection. Consequently,
consideration was made to determine power drive, piston speed and pump speed.
40
4.5.1 Mould Casing Plates
Mould casing plates are the side covers of the ISSB making machine mould. They are
subjected to direct forces during the compression process. An experiment was carried out
to determine the resultant force. A manually operated hydraulic press was modified as
shown in Figure 3.7 of Chapter three, by mounting a displacement and a load measuring
instruments, a digital Vernier calliper and the hydraulic pressure gauge. Ten samples of
the same soil mass, weighing 10.1kg were compressed gradually at different
displacements.
By conversion, the optimal compression load of 1,432.92 N was achieved for the
IBM-M1 and M2 machines. Furthermore, using Equation 4.1, the pressure exerted on each
cover plate was determined as 0.1357 MPa.
𝑃 = 0.5 (𝐹
𝐴) (4.1)
Where:
P = Pressure exerted of plates
F = Resultant force
A = Area of plates
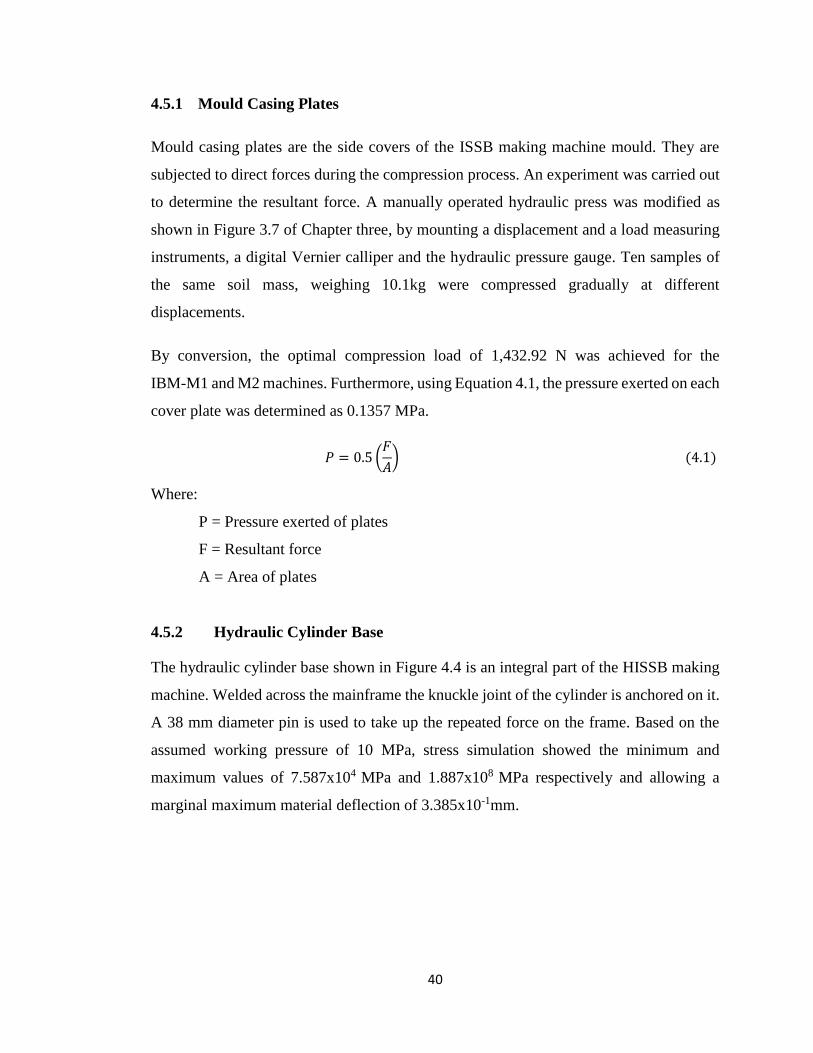
4.5.2 Hydraulic Cylinder Base
The hydraulic cylinder base shown in Figure 4.4 is an integral part of the HISSB making
machine. Welded across the mainframe the knuckle joint of the cylinder is anchored on it.
A 38 mm diameter pin is used to take up the repeated force on the frame. Based on the
assumed working pressure of 10 MPa, stress simulation showed the minimum and
maximum values of 7.587x10⁴ MPa and 1.887x10⁸ MPa respectively and allowing a
marginal maximum material deflection of 3.385x10⁻¹mm.

41
Figure 4.4: Hydraulic Cylinder Base General Assembly
4.5.3 Hydraulic Cylinder Design
Hydraulic cylinders convert hydraulic power into linear mechanical force. Depending on
the cylinder construction, movement can be hydraulically powered in one direction and
the return movement done with a spring or by the load. In this case, the cylinder is called
single-acting cylinder. If the cylinder is hydraulically powered in both directions, it is then
referred to as a double-acting cylinder (Mikkola, 2014).
Double-acting cylinders are designed such that pressure can be applied in the inlet port,
providing linear power in two directions. This system is not in any sense different in
principle of operation from every normal hydraulic cylinder. It produces fluid flow and
pressure in two directions, and only one end of the piston is connected to the point of
application where work is done as shown in Figure 4.5.
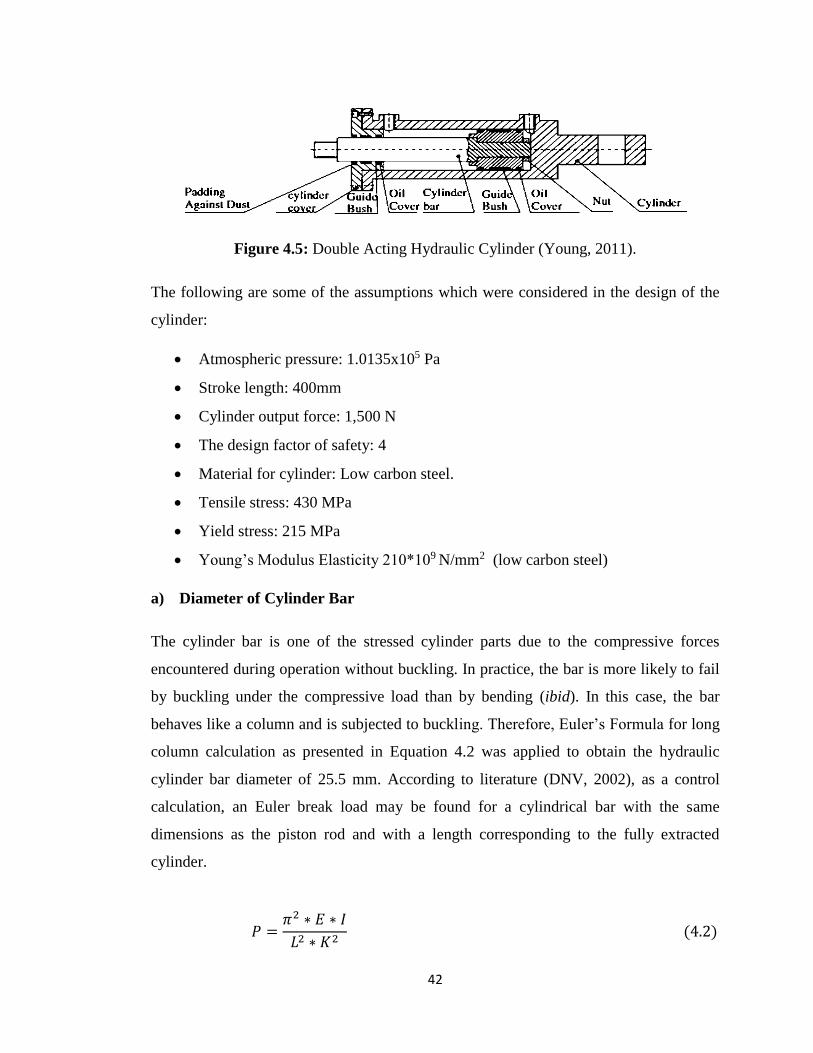
Therefore, in this research, a double-acting hydraulic cylinder similar to the one
in Figure 4.6 was used to provide the force required for the compression and ejection of
stabilised soil blocks.
42
Figure 4.5: Double Acting Hydraulic Cylinder (Young, 2011).
The following are some of the assumptions which were considered in the design of the
cylinder:
Atmospheric pressure: 1.0135x10⁵ Pa
Stroke length: 400mm
Cylinder output force: 1,500 N
The design factor of safety: 4
Material for cylinder: Low carbon steel.
Tensile stress: 430 MPa
Yield stress: 215 MPa
Young’s Modulus Elasticity 210*109 N/mm2 (low carbon steel)
a) Diameter of Cylinder Bar
The cylinder bar is one of the stressed cylinder parts due to the compressive forces
encountered during operation without buckling. In practice, the bar is more likely to fail
by buckling under the compressive load than by bending (ibid). In this case, the bar
behaves like a column and is subjected to buckling. Therefore, Euler’s Formula for long
column calculation as presented in Equation 4.2 was applied to obtain the hydraulic
cylinder bar diameter of 25.5 mm. According to literature (DNV, 2002), as a control
calculation, an Euler break load may be found for a cylindrical bar with the same
dimensions as the piston rod and with a length corresponding to the fully extracted
cylinder.
𝑃 =𝜋2 ∗ 𝐸 ∗ 𝐼
𝐿2 ∗ 𝐾2 (4.2)

43
Where:
P = Buckling Load (N)
L = Length between mountings in fully extracted position (m)
I = Moment of inertia (m4 )
E = Young’s Modulus (Carbon steel)
K = End fixing factor
Applying Equation 4.2 for buckling load determination the cylinder bar diameter was
calculated using Equation 4.3 (Emagbetere et al, 2017). However, according to the
buckling chart of cylinder bars (rods) shown in Appendix E, the closest bar diameter is 40
mm for the cylinder output load of 1500 N (152.91 Kg).
55200 =𝜋2 ∗ (210 ∗ 109) ∗ 𝐼
(0.42 ∗ 0.72)
𝐼 = 2.08 ∗ 10−8 𝑚4
𝐼 =𝜋𝑑4
64 (4.3)
2.08 ∗ 10−8 =𝜋𝑑4
64
𝑑 = 25.5 𝑚𝑚
b) Determination of Hoop Stress
In the design of hydraulic cylinders, the outer cylinder diameter and its wall thickness are
calculated largely depending on the capacity of the cylinder and its working pressure
(Khan, 2009). Therefore, Lame’s formula, (Equation 4.4), was used to determine the hoop
stress 𝑄ℎ for the cylinder. 𝑄ℎ varies across the cylinder wall from a maximum value on
the inner surface to a minimum value on the outer surface of the cylinder, as expressed in
Equation 4.4, (Yong and Qiang, 2010). 𝑄ℎ is a mechanical stress defined for cylindrical
objects such as pipes and tubing.
44
(4.4)
Where:
𝜎ℎ = Lame hoop stress (MPa)
𝑟 = Radius at which hoop stress is calculated (mm)
𝑟𝑜 = External pipe radius (mm)
𝑟𝑖 = Internal cylinder radius (mm)
𝑝𝑜 = External pressure of cylinder (MPa)
𝑝𝑖 = Internal pressure of cylinder (MPa)
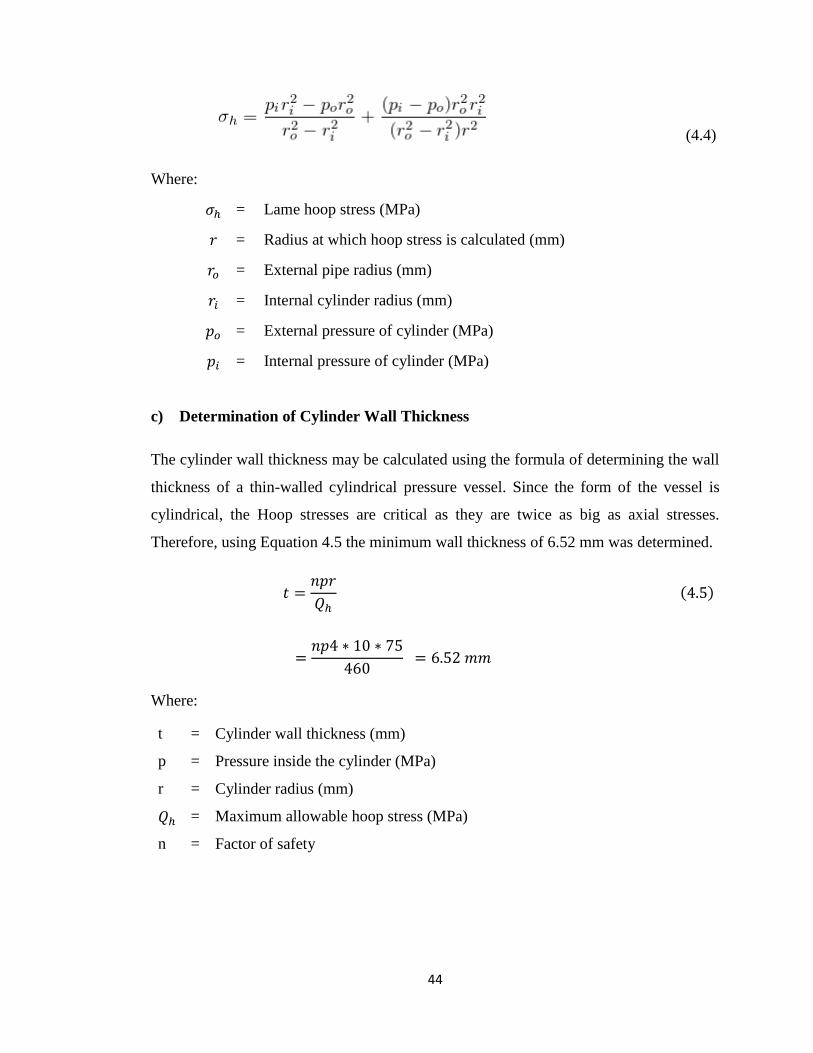
c) Determination of Cylinder Wall Thickness
The cylinder wall thickness may be calculated using the formula of determining the wall
thickness of a thin-walled cylindrical pressure vessel. Since the form of the vessel is
cylindrical, the Hoop stresses are critical as they are twice as big as axial stresses.
Therefore, using Equation 4.5 the minimum wall thickness of 6.52 mm was determined.
𝑡 =𝑛𝑝𝑟
𝑄ℎ (4.5)
=𝑛𝑝4 ∗ 10 ∗ 75
460 = 6.52 𝑚𝑚
Where:
t = Cylinder wall thickness (mm)
p = Pressure inside the cylinder (MPa)
r = Cylinder radius (mm)
𝑄ℎ = Maximum allowable hoop stress (MPa)
n = Factor of safety

45
d) Determination of Hydraulic Pump Speed
When choosing a pump, the pump volumetric flow rate and pressure are required based
on which the rotation speed and drive power required from the prime mover can be
calculated. The volumetric flow rate produced by the pump depends on the rotation speed,
a displacement and volumetric efficiency which were assumed to be 1400 rev/min, 0.032
m3/rev and 1 respectively. The volumetric efficiency of the cylinder can lower the
movement speed but in general the leaks are so small that calculations are done with
ηvol = 1 (Mikkola, 2014). The rotation speed was based on the available prime mover’s
manufacturer specification.
𝑄 = 𝜂𝑣𝑜𝑙. 𝑛. 𝑉𝑘 (4.6)
Where:
Q = Volumetric flow rate (m3/s)
Vk = Displacement per revolution (m3/rev)
𝜂𝑣𝑜𝑙 = volumetric efficiency
N = Rotation speed (rev/s)
Therefore, according to the equation 4.6, the calculated volumetric flow was 0.8 m3/s
e) Determination of Piston Speed
The movement speed of the cylinder piston depends on the volumetric flow rate and the
effective piston area. The volumetric efficiency of the cylinder can lower the movement
speed. However, the leaks are so small that calculations are done with the volumetric
efficiency of 1 (Khan, 2009). Therefore, using 0.032 m3/s as volumetric flow and invoking
Equation 4.7, (Mikkola, 2014) the theoretical piston speed was determined as 0.43m/s.
𝑉 =𝑄. η𝑉𝑜𝑙
𝐴 (4.7)
Where:
V = Movement speed (m/s)
η𝑉𝑜𝑙 = Volumetric efficiency
Q
= Volumetric flow rate (m3/s)
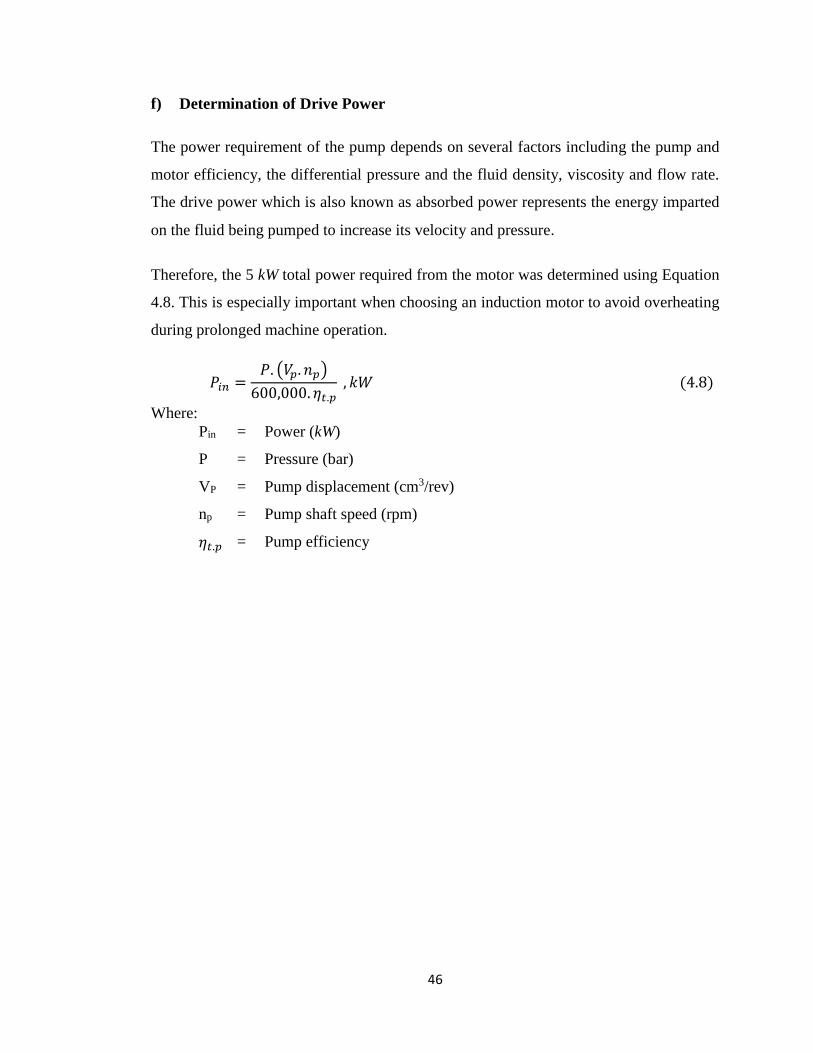
46
f) Determination of Drive Power
The power requirement of the pump depends on several factors including the pump and
motor efficiency, the differential pressure and the fluid density, viscosity and flow rate.
The drive power which is also known as absorbed power represents the energy imparted
on the fluid being pumped to increase its velocity and pressure.
Therefore, the 5 kW total power required from the motor was determined using Equation
4.8. This is especially important when choosing an induction motor to avoid overheating
during prolonged machine operation.
𝑃𝑖𝑛 =𝑃. (𝑉𝑝. 𝑛𝑝)
600,000. 𝜂𝑡.𝑝 , 𝑘𝑊 (4.8)
Where:
Pin = Power (kW)
P = Pressure (bar)
VP = Pump displacement (cm3/rev)
np = Pump shaft speed (rpm)
𝜂𝑡.𝑝 = Pump efficiency

47
4.5.4 IBM-H1 Hydraulic Circuit System
The circuit system for the IBM-1H making machine was designed to control a 4/3 double-
acting cylinder as shown in Figure 4.6.
Figure 4.6: IBM-H1 Machine Hydraulic Circuit.

48
The control system was designed to operate as follows:
(i) When the 4/3 valve is in its neutral position, the cylinder is hydraulically locked
and the pump unloads back to the tank.
(ii) When the 4/3 valve is actuated into the flow path, hydraulic fluid flows through
port P to A into the hydraulic cylinder which, as a result, extends to the right. Oil
in the rod end of the cylinder is free to flow back to the tank through the valve at
port B through port T.
(iii) When the 4/3 valve is actuated into the right-envelope configuration, the cylinder
retracts as oil flows from port P through port B. Oil in the blank end is returned to
the tank via the flow path from port A to port T.
At the end of each stroke, there is no system demand for oil. Thus, the pump flow goes
through the pressure relief valve at its set pressure level. The same occurs when the valve
is deactivated back into its neutral position.
4.6 Material selection for the IBM-H1
In engineering design processes each of the stages requires decisions about the materials
of which the product is to be made and the process for making it. The choice of material
is dictated by the design (Ashby, 2002). The materials property charts are designed for
use in the selection of materials. Property limits and material indices are plotted onto them,
isolating the subset of materials which are the best choice for the design. Since any
material has attributes such as density, strength, cost and resistance to corrosion, design
demands a certain profile of these: a low density, high strength, a modest cost and
resistance to water (ibid).
Material property chart or Ashby’s chart is one of the quantitative methods for initial
screening of materials. Initial screening is important in order to narrow down the choices
to a manageable number for subsequent detailed evaluation. There is an immensely wide
variety of material to choose from, hence screening out materials that cannot meet the
requirements or fail within the constraint given.

49
Furthermore, narrowing of material list is done by the ranking which is basically the
ability to maximise the performance of the material.
In this research, material selection to resist failure was based on the attributes such as
mechanical properties, physical properties and shape.
The Ashby’s charts which were used to minimise the weight and save the cost of product
manufacturing include Young’s Modulus – Density chart, Young’s Modulus – strength
chart and Young’s Modulus – Cost Chart.
4.6.1 Young Modulus – Density Chart
Many applications require stiff materials, these materials lie on the top right of the chart
and for applications that require low density, materials lie to the left of the chart as shown
in Figure 4.8. The IBM-H1 machine design required materials with high stiffness because
of the high force resulting from hydraulic pressure system. Therefore, from Figure 4.7,
selection of materials with high modulus was done, in this case steels.
Figure 4.7: Young’s Modulus vs Density. (Ashby, 2005)

50
4.6.2 Young’s Modulus – Cost Chart.
Materials with high strength and low modulus lie towards the bottom right. Such materials
tend to buckle before they yield when loaded as panels or columns. Those near the top left
have high modulus and low strength, they end to yield before buckling (Ashby, 2005).
The chart shown in Figure 4.8 has numerous applications, among them: the selection of
materials for springs, elastic hinges, pivots and elastic bearings, and for yield-before-
buckling design. In this research it was used as a guide for yield-before-buckling and the
possible materials were Beryllium, Cast Iron, Mg alloys, Steels and Ceramics under
engineering alloys. Because of its availability, machinability and weldability low alloy
steel under steels family was suitable.
Figure 4.8: Young’s Modulus vs Strength. (Ashby, 2005)
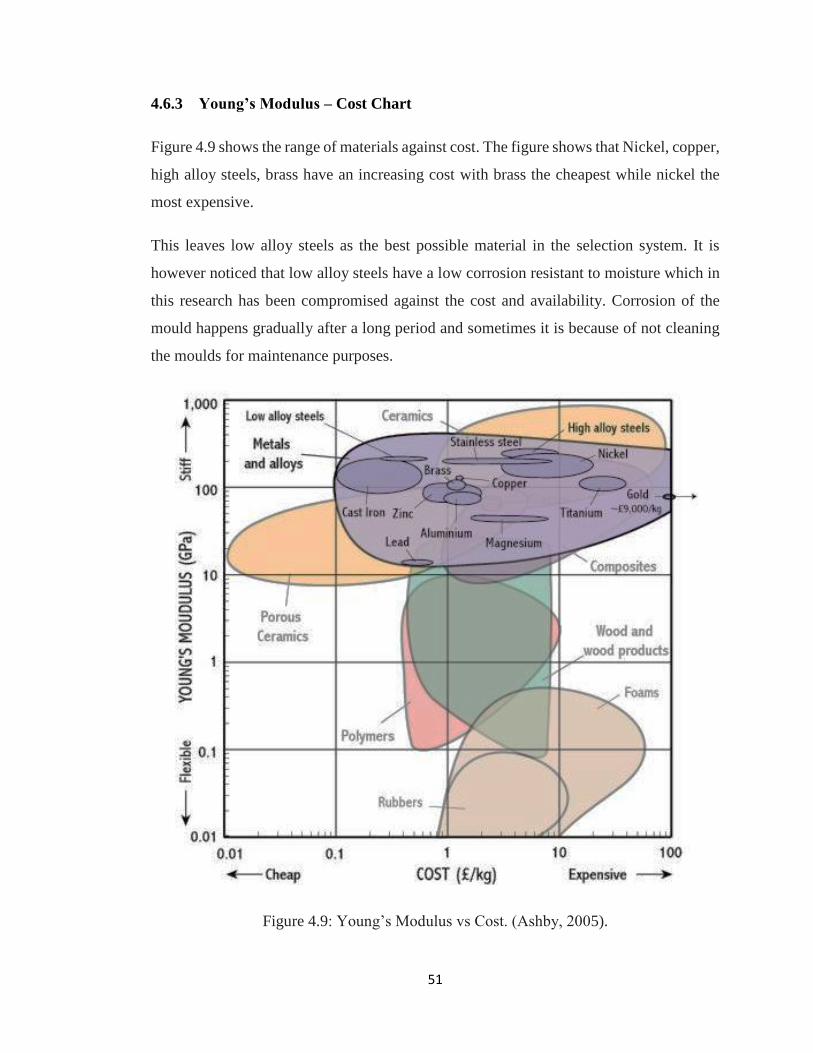
51
4.6.3 Young’s Modulus – Cost Chart
Figure 4.9 shows the range of materials against cost. The figure shows that Nickel, copper,
high alloy steels, brass have an increasing cost with brass the cheapest while nickel the
most expensive.
This leaves low alloy steels as the best possible material in the selection system. It is
however noticed that low alloy steels have a low corrosion resistant to moisture which in
this research has been compromised against the cost and availability. Corrosion of the
mould happens gradually after a long period and sometimes it is because of not cleaning
the moulds for maintenance purposes.
Figure 4.9: Young’s Modulus vs Cost. (Ashby, 2005).
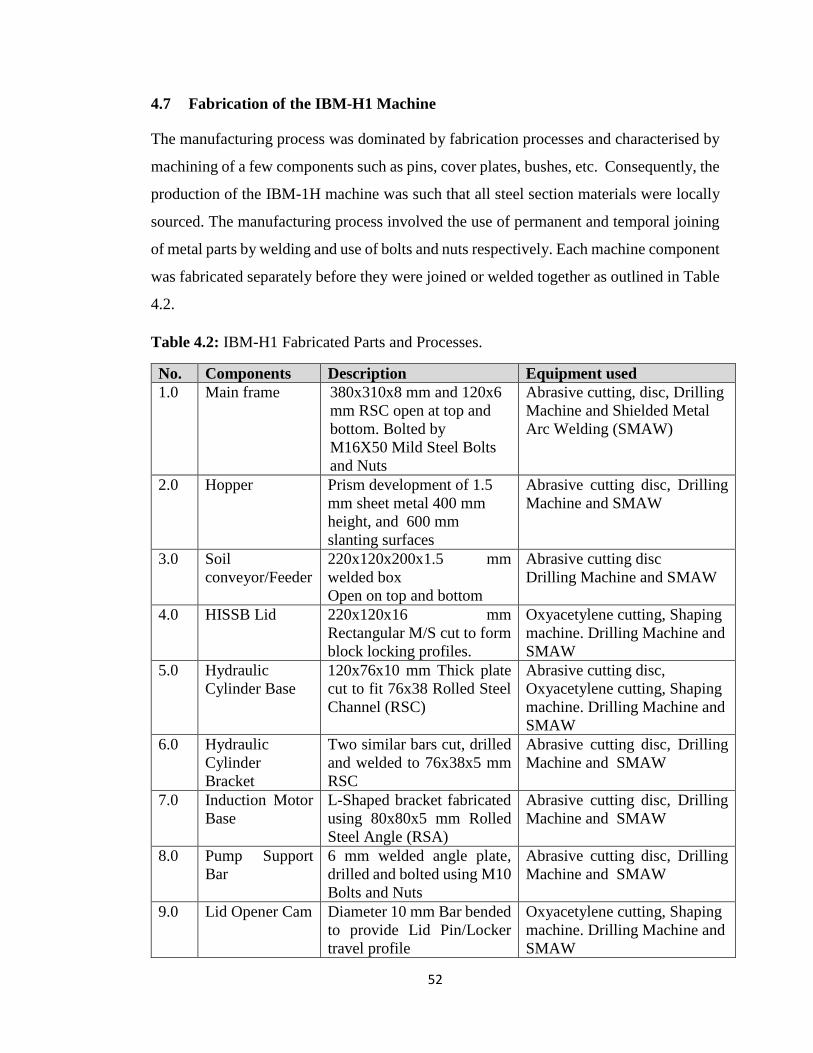
52
4.7 Fabrication of the IBM-H1 Machine
The manufacturing process was dominated by fabrication processes and characterised by
machining of a few components such as pins, cover plates, bushes, etc. Consequently, the
production of the IBM-1H machine was such that all steel section materials were locally
sourced. The manufacturing process involved the use of permanent and temporal joining
of metal parts by welding and use of bolts and nuts respectively. Each machine component
was fabricated separately before they were joined or welded together as outlined in Table
4.2.
Table 4.2: IBM-H1 Fabricated Parts and Processes.
No. Components Description Equipment used
1.0 Main frame 380x310x8 mm and 120x6
mm RSC open at top and
bottom. Bolted by
M16X50 Mild Steel Bolts
and Nuts
Abrasive cutting, disc, Drilling
Machine and Shielded Metal
Arc Welding (SMAW)
2.0 Hopper Prism development of 1.5
mm sheet metal 400 mm
height, and 600 mm
slanting surfaces
Abrasive cutting disc, Drilling
Machine and SMAW
3.0 Soil
conveyor/Feeder
220x120x200x1.5 mm
welded box
Open on top and bottom
Abrasive cutting disc
Drilling Machine and SMAW
4.0 HISSB Lid 220x120x16 mm
Rectangular M/S cut to form
block locking profiles.
Oxyacetylene cutting, Shaping
machine. Drilling Machine and
SMAW 5.0 Hydraulic
Cylinder Base
120x76x10 mm Thick plate
cut to fit 76x38 Rolled Steel
Channel (RSC)
Abrasive cutting disc,
Oxyacetylene cutting, Shaping
machine. Drilling Machine and
SMAW
6.0 Hydraulic
Cylinder
Bracket
Two similar bars cut, drilled
and welded to 76x38x5 mm
RSC
Abrasive cutting disc, Drilling
Machine and SMAW
7.0 Induction Motor
Base
L-Shaped bracket fabricated
using 80x80x5 mm Rolled
Steel Angle (RSA)
Abrasive cutting disc, Drilling
Machine and SMAW
8.0 Pump Support
Bar
6 mm welded angle plate,
drilled and bolted using M10
Bolts and Nuts
Abrasive cutting disc, Drilling
Machine and SMAW
9.0 Lid Opener Cam Diameter 10 mm Bar bended
to provide Lid Pin/Locker
travel profile
Oxyacetylene cutting, Shaping
machine. Drilling Machine and
SMAW

53
Figure 4.10 shows the fabrication of a mould casing subassembly for the IBM-H1 machine
while the final assembled IBM-H1 machine is as presented in Figure 4.11.
Figure 4.10: Fabrication of the IBM-H1 Mould Stand and Casing.
Figure 4.11: Final Assembled IBM-H1 Machine.

54
CHAPTER 5 RESULTS AND DISCUSSION
5.1 Introduction
This chapter presents the analysis of results obtained in this study and the discussion based
on the research findings. These include machine performance assessment, the compressive
strength of the blocks with variable stabiliser soil mixture ratios and the manufacture of
the IBM-H1 machine.
5.2 Simulation and Optimisation of ISSB Making Machine Parts
Figures 5.1 shows results of the deformation simulation of a 380x400x10 mm cold rolled
mild steel plate for IBM=H1 machine side cover plate. The two same plates are bolted on
each side of the 120x50x8 mm cold rolled steel channel to form the mould casing
Appendix D3. Therefore, both plates are subjected to stress and deformation due to the
resultant pressure generated during stabilised soil compression. Therefore, under
maximum operating cylinder pressure of 10 MPa, the maximum deformation was
1.016x100 mm which was is negligible for any effect to geometric features of the IBM-1H
machine and the blocks According to literature Compressed Earth Blocks Standards
(CDI - CRATerre-EAG, 1998) the most commonly employed full compressed earth
blocks have the following theoretical moulding dimensions and nominal dimensions:
Length: 295 mm
Width : 140 mm
Height: 90 mm to 95 mm.
These blocks are used as a reference here for the terms of the specifications which follow.
For CEBs of different dimensions, tolerances should be adjusted using a linear
mathematical relationship. The measurements given are the net block dimensions, not
counting any hollows or indentations. Special blocks can be developed using other main
formats. Dimensional tolerances are as follows:
Length: + 1 to - 3 mm
Width : + 1 to - 2 mm
Height: + 2 to - 2 mm

55
In addition, the difference between the corresponding dimensions of two CEBs of any
kind from the same supply must not exceed 3 mm for the length, 2 mm for the width and
3 mm for the height.
An optimal thickness of the cover plate shown in Figure 5.1 was determined using a CAD
software, Solidworks 2017 version. Based on the optimisation results shown in Table 5.1,
the achieved thickness of 8 mm from the initial 10 mm was optimal for the operating
compression pressure of 10 MPa.
Furthermore, stress simulation to determine maximum normal stress of the cover plate
was done as shown in Figure 5.2. Therefore, at the pressure of 10 MPa, the minimum and
maximum normal stress values were 4.216x100 and 9.282x10³ MPa respectively.
Consequently, the yield strength for the plate was 6.204x10² MPa which is far below the
maximum normal stress value.
Figure 5.1: Deformation of IBM=M1 Side Cover Plate

56
Figure 5.2: Stress Analysis of IBM-M1 Side Cover Plate
Table 5.1: Mould Side Cover Optimisation Results.
Figure 5.3 shows the Rolled Steel Channel (RSC) IBM-H1 cylinder base bar stress
simulation results. The selected material yield stress is 4.700 x 10² N/m2 and by the
maximum operating pressure of 10 MPa, the 76x40x5 mm optimised bar attained
minimum and maximum stresses of 3.303 x 10⁻⁴ N/m2 and 7.286 x 10⁻¹ N/m2 respectively.
Therefore, by using 4 as the FOS and since the maximum stress is less than that of the
yield stress, no failure is expected at maximum operating pressure. Optimisation results
are shown in Table 5.2.
Component
name Units Current Initial Optimal Scenario1 Scenario2
Thickness mm 9.86422 9.86422 8 8 12
Stress1 N/mm2
(MPa) 1.0064 1.0064 1.4573 1.4573 0.71101
Mass1 g 1208.88 1208.88 980.42 980.42 1470.63
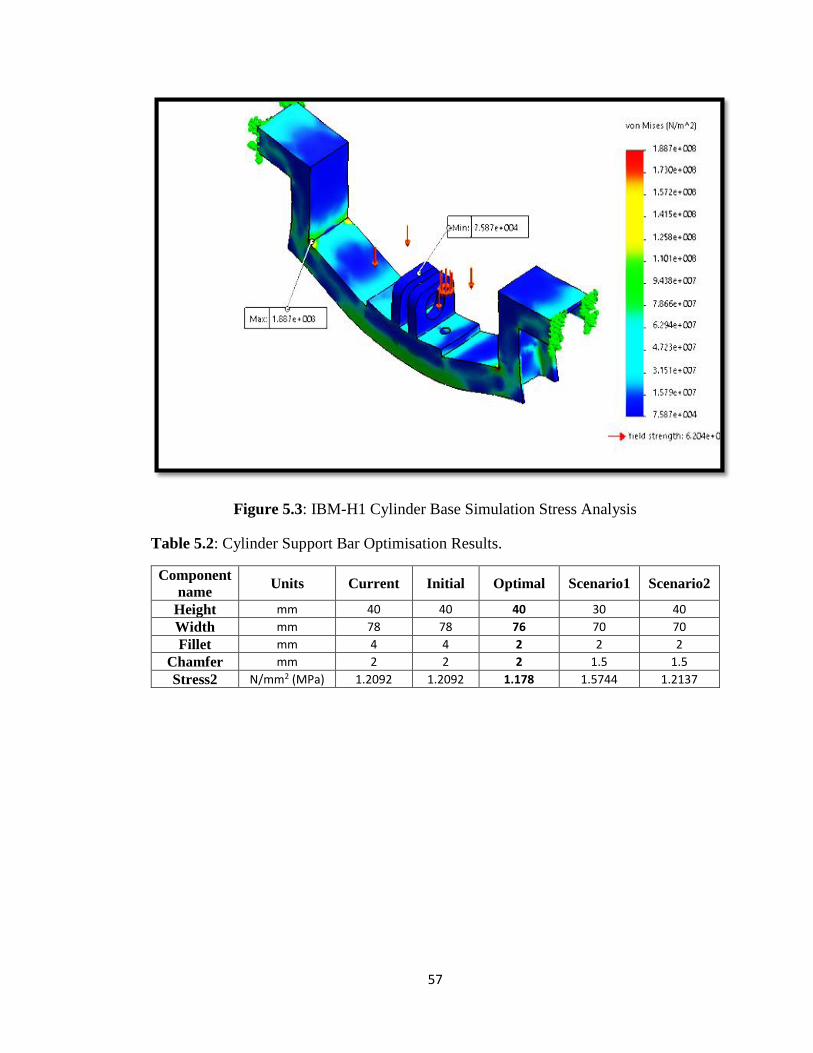
57
Figure 5.3: IBM-H1 Cylinder Base Simulation Stress Analysis
Table 5.2: Cylinder Support Bar Optimisation Results.
Component
name Units Current Initial Optimal Scenario1 Scenario2
Height mm 40 40 40 30 40
Width mm 78 78 76 70 70
Fillet mm 4 4 2 2 2
Chamfer mm 2 2 2 1.5 1.5
Stress2 N/mm2 (MPa) 1.2092 1.2092 1.178 1.5744 1.2137

58
Furthermore, Figure 5.4 shows the deformation simulation for the same cylinder base bar
of the IBM-H1 machine. It can be seen that the maximum deformation was 3.385x10⁻¹
mm at maximum operating cylinder pressure, which does not affect compression results
Figure 5.4: IBM-H1 Cylinder Base Simulation Deformation Analysis
5.3 ISSB Making Machine Block Production Cycle Time
Different machine process times per block as produced using the three ISSB making
machines IBM-M1, IBM-M2 and IBM-H1 are shown in Figure 5.5. Tests were done using
the same stabilised soil and maintained other conditions. Results indicate that loading,
compression and ejection have a significant effect on the rate of ISSB production with
loading taking the longest time. Tests carried out have shown significant improvement in
terms of machine capacity and production rate. The mean cycle time per block was 121
and 140 seconds for the IBM-M1 and IBM-M2 machines as shown in Appendix G1 and
G2. The IBM-H1 machine showed the shortest mean cycle time of 31 seconds per block.
Therefore, using the IBM-H1 machine and based on the IBM-M1 and IBM-M2 machines,
the performance improvement in production cycle time was 78.6. Furthermore, it should
be noted that the higher standard deviation values for stabilised soil loading, lid opening
and compression time for IBM-M1 and IBM-M2 machines were because of
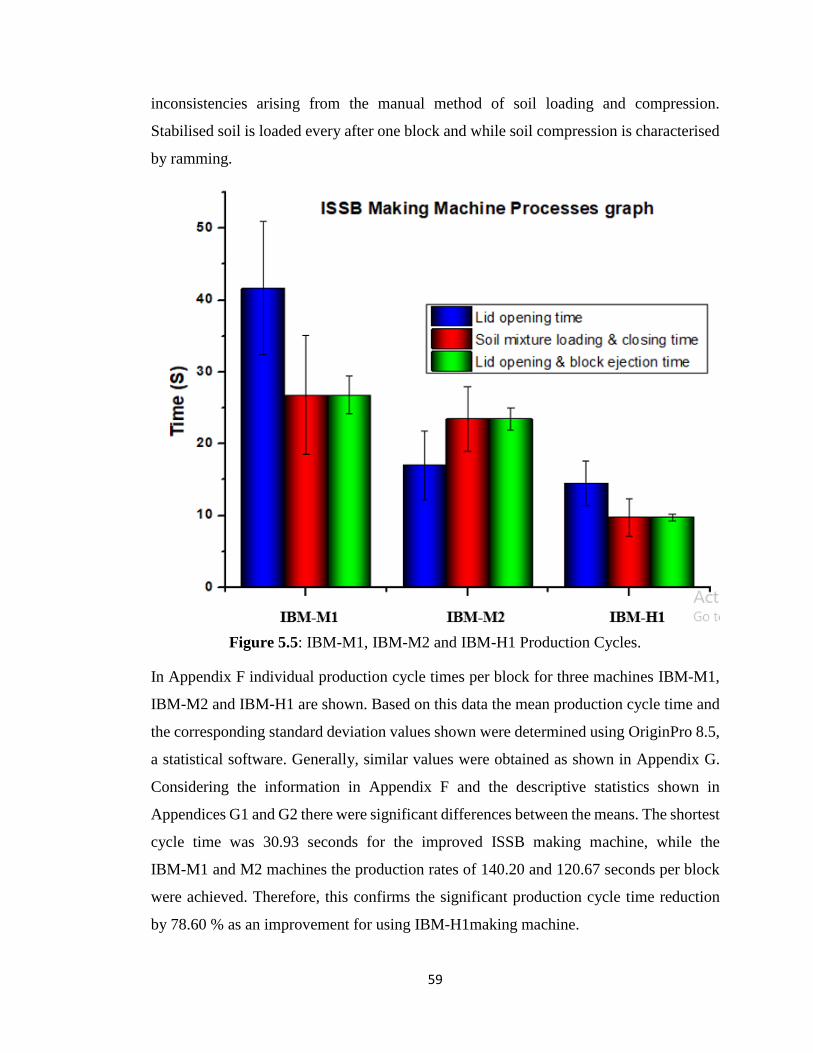
59
inconsistencies arising from the manual method of soil loading and compression.
Stabilised soil is loaded every after one block and while soil compression is characterised
by ramming.
Figure 5.5: IBM-M1, IBM-M2 and IBM-H1 Production Cycles.
In Appendix F individual production cycle times per block for three machines IBM-M1,
IBM-M2 and IBM-H1 are shown. Based on this data the mean production cycle time and
the corresponding standard deviation values shown were determined using OriginPro 8.5,
a statistical software. Generally, similar values were obtained as shown in Appendix G.
Considering the information in Appendix F and the descriptive statistics shown in
Appendices G1 and G2 there were significant differences between the means. The shortest
cycle time was 30.93 seconds for the improved ISSB making machine, while the
IBM-M1 and M2 machines the production rates of 140.20 and 120.67 seconds per block
were achieved. Therefore, this confirms the significant production cycle time reduction
by 78.60 % as an improvement for using IBM-H1making machine.

60
5.4 ISSB Strength Test Results
Figure 5.6 shows the compression strength plotted against different cement contents for
manually compressed ISSBs. The low compression pressure of 1.4 MPa of the
IBM-1 and M2 machines resulted in lower compressive strength than the minimum
required strength of 6 MPa for the load bearing compressed blocks. The high standard
deviation recorded for blocks with 50% cement content can be attributed to inconsistency
resulting from irregular manual compression of the stabilised soil mixture.
Figure 5.6: Strength changes with variable cement contents
for IBM-M1 machine.

61
Figure 5.7 shows the plot of IBM-H1 compressive strength against the compression
pressure at different cement contents. The highest block strength achieved was for the
50% soil sample. Stabilised soil compressed to the pressure of 8 MPa yielded blocks with
the compressive strength above 6 MPa, which is the minimum required strength for all
load bearing compressed stabilised soil blocks. The results in Figure 5.7 also shows
minimal standard deviations for the four curves 10%, 12%, 17% and 25% because of
controlled soil compression apart from the soil with 50 % cement content. This is because
of limited space for the movement of soil particles resulting from high stabiliser content.
Therefore, the strength of blocks remained irregular.
Figure 5.7: Compressive strength changes with variable cement contents at
different compressive pressure for IBM-H1 machine.
The highest block strength recorded was 13.8 MPa for 50% cement content blocks
compressed at 8 MPa. Economically the ideal compression pressure should be above
6 MPa for soil with 12 and 17 % cement content.

62
Furthermore, Figure 5.8(a) and 5.8 (b) plots demonstrates the distribution and variability
of the strength of the IBM-M1 blocks using cement content of 12% and 17% respectively.
Applying pressure of 8 MPa the strength distribution was uneven in both cases.
(a)
(b)
Figure 5.8 (a) (b): Distribution and Variability of Block Strength for IBM-H1 Machine by
Varying Pressure (a) 12% Cement Composition (b) 17% Cement
Composition

63
Figure 5.9, shows the distribution and variability of block strength for manual ISSB
machine by varying cement composition. Strength range was evenly distributed for all
cement composition apart from the 50% composition. It should be noted that the TDAU
manual ISSB making machine compression mechanism has no compression force
regulator. Therefore, the compression displacement is fixed and the maximum
compression is manual. Consequently, the uneven distribution and variability of block
strength with 50% cement composition has limited space for soil particle movement due
to high stabiliser content. The resulting plot of Figure 5.9 also shows that the compressive
strength of the blocks is affected by the amount of stabiliser content.
Figure 5.9: Distribution and variability of block strength for manual ISSB machine by
varying cement composition
64
CHAPTER 6 CONCLUSION AND RECOMMENDATIONS
6.1 Introduction
This final chapter presents the conclusions and recommendations based on the results and
discussions presented in chapter five.
6.2 Conclusion
The ISSB making machine was successfully redesigned, manufactured and tested with
improved performance. It is seen that CAD/CAE is generally important to use in product
design and manufacturing. Additional systems and mechanisms were designed and
incorporated in the ISSB making machine general arrangement resulting in improved
production rate.
Due to the enhanced compression system, the compressive strengths of the blocks made
using the new designed machine were much higher than those from the manually operated
ISSB making machines. The reduced block production cycle time for the TD IBM-H1
block making machine also resulted in an increased machine production capacity of 960
blocks per day.
In this study, the approach of comparing TD IBM-M1 and TD IBM-M2 machine designs
shows that there is a significant distinction between the two machines. This includes the
effect of compression on the strength of ISSBs. Therefore, increased piston displacement
for the TD IBM-H1 machine resulted in improved soil compaction for the block.
Consequently, based on the results of this study, it is clear that an improved machine
performance and block strength meeting international standards were achieved.
The designed and manufactured IBM-H1 had distinct features and functions such as
compression, block ejection and soil mixture loading. Hydraulic system was incorporated
for enhanced soil compaction and increased ejection time and based on performance test
results there was significant improvement on block strength and machine capacity.
The limitations of this research were lack of laboratory equipment to determine wet
compressive pressure. However, this was achieved by using modified hydraulic.
Furthermore, lack of some hydraulic components on local market was also a challenge.
65
6.3 Recommendations
A follow-up study concerning the design and manufacture of ISSB making machines must
be undertaken to consider automating the block making processes which should include
soil preparatory, conveyance and block picking stage, etc. This will further enhance
machine capacity and reduce the cost of production while maintaining the quality of
blocks.
The results in chapter five show that motorised ISSB making machines yield blocks with
high density and compressive strength due to enhanced compression force generated by
the hydraulic system. Therefore, it would be worthwhile to design and manufacture a
multiple mould ISSB making machine for increased production rate.
Furthermore, extended future studies should also consider the following thematic areas:
i. To investigate ISSBs aging period of different soil types.
ii. Compressed stabilised soil block strength prediction for various soil types.
iii. Design of an ISSB making with movable top and bottom compressing plates.

66
REFERENCES
Abas, M. A., (2008). Compression Strength of Soil Cement Cube. International Journal
of Civil Engineering and Geo-Environment. pp. 1-9
Adupa, R., Perez, P., and Mauricio, A., (2009). Interlocking Stabilised Soil Blocks:
Appropriate Earth Technology in Uganda. UN-HABTAT, Nairobi.
Ambekar, A.G., (2007). Mechanism and Machine Theory. 1st Edition. New Delhi-
110001: Printice Hall of India.
Anis, A., (2012). Simulation of Slider Crank Mechanism Using MSC Adams Software.
International Journal of Engineering & Technology IJET, Vol:12 (No:04), pp. 108-112.
Ashby, M. F., (2005). Materials Selection in Mechanical Design. 3rd ed. Pergamon Press,
United States of America
Bhojne, S. A., Keste, A. A., and Gawande, S. H., (2008). Investigation on the effect
Design Parameters of Toggle Clamping Mechanism on Output Force. International
Engineering Research Journal, pp. 50 7-513.
Bodner, A., and Mcginnis, L. F., (2002). A Structured Approach to Simulation Modeling
of manufacturing systems, Atlanta, Georgia 30332-0205, U.S.A.
Boubekeur, S., and Houben, H., (1998) Compressed Earth Block Standards. CDI -
CRATerre EAG 144p
CAHF,. (2016). Challenges of Affordable Housing Delivery in Zambia, Lusaka: Center
for Affordable Housing Finance Africa.
Chironis,N., and Sclater, N. P., (1991). Mechanisms and Mechanical Devices Source
Book. Fourth Edition. New York: McGraw-Hill.
Dicker, J. J., Shigley, J. E., and Pennock, G. R., (2013) Theory of Machines and
Mechanism Third Edition, pp. 308 New York. Oxford University Press.
Edward, G., (2008). Concrete construction engineering Handbook. Second Edition, pp 21-
24, New Jersey CRC Press.

67
Guillaud, H., Joffroy, T., and Odul, P., (1995). Compressed Earth blocks: Manual of
design and construction. CRATerre-EAG, Ausder Arbeit von GATE. Germany:
Braunschweig Vieweg.
Huang, M., Lin, T., and Fung, R., (2011). Key Design Parameters and Optimal Design of
a Five Point Double - Toggle Clamping Mechanism. Elservier, Vol. 35, pp. 4304 - 4320
Hughes, J. P., (2012). Analysis of a Toggle Mechanism: Sensitivity to Link Sizes,
Connecticut: Thesis report, Rensselaet Polytechnic Institute Hartford.
Hydrafoam., (2004). Hydrafoam Training Manual. Johannesburg 220 Rondebult road:
Libradene boksburt, Sunward park 1470.
Kafum, E., (2018). Construction Machinery Catelogue.
Kccpr., (2012). Hydraulic Cylinder Catalogue. www.kccpr.com
Khan. Q. S., (2009). Design and Manufacturing of Hydraulic Cylinder. Mumbai, India:
TANVEER Publications.
Khandani, S., (2005). Engineering Design Process, Califonia: Initiatives for Science and
Math Education (IISME).
Kintingu, S. H., (2009). Design of Interlocking bricks for Inhanced wall construction,
flexibility alignment, accuracy and load bearing: Thesis, The University of Warwick,
London.
Kolovsky, M. Z., Evgrafov, A. N., Semenov, Y. A., and Slousch, A. V., 2000. Advanced
Theory of Mechanisms and Machines. 1st Edition. New York: Springer.
Kuang-HuaChang, K. H., (2006). Design Parameterization and Tool Integration for
CAD-based Mechanism Optimization. Elsevier , 37(12), pp. 779-796.
Leiyue Machinery., (2017). Catalogue of Leiyue Heavy Machinery Industry, Co., ltd-
www.hljcoal.com.
Matti, V., Heikki, K., and Jyrki, V., (2002). Hydraulitekniikan perusteet. Vantaa: WSOY.

68
Mikkola, T., (2014). Design of Hydrailic Cylinder for Hand held Tool: Mechanical and
Production Technology, Thesis: Oulu University of Applied Sciences.
MNPD., (2017). Seventh National Development Plan, Lusaka: Ministry of National
Planning Development.
Multiquip, M. Q., (2011). Compaction Handbook. Carson
Nambatya, M. M., (2015). Investigating the Rationale for Material Selection in Tropical
Housing Projects in Uganda - A case for Interlocking Stabilised Soil Block Technology:
Thesis, ST.EDMUND'S COLLEGE
Ondruska, J., and Biath, P., (2012). Idealized Compression Ratio for a Screw Briquetting
Press. Acta Polytechnica, 52(2), pp. 13-16.
Onyeakpta, O., and Onundi, L., (2014). Improvement on the Design and Construction of
Interlocking Blocks and its Moulding Machin. IOSR Journal of Mechanical and Civil
Engineering (IOSR-JMCE) ,olume 11, Issue 2, pp.49-66 .
Piyasena, R. R. C., Premerathne, P. A. T. S., Perera, B. T. D., and Nanayakkara S M A,.
(2013). Evaluation of Initial Setting Time of Fresh Concrete, pp 47-52
Racodi, C., (1997). The Urban Challenge in Africa – Growth and management, of its
life. UNUP-952.
Rahman, A.H.M.M., Ferooz, M.G., and Talukder, M.D.H., (2011). Assessment of Soil
Compaction–A Project Study. www.banglajol.info/index.php/MIST
Reddy, V., (2015). Design of a Manual Press for the Production of a Manual Press for
Production of Compacted Stabilised Soil Blocks. CURRENT SCIENCE, Volume 109,
NO. 9, pp. 1651-1659.
Sandor, E.K., and Erdman, G.E., (1988). Advanced Mechanism Design: Analysis and
Synthesis. Vol 2. Prentice-Hall.
Shih, R.H., (2014). Introduction to Finite Element Analysis Using SolidWorks Simulation.
Oregon: www.SDCpublications.com.
69
Swampnil, H.P., (2016). Research on Interlocking Stabilised Soil Bricks (ISSB)-A
Literature Survey. International Journal of Research in Engineering and Technology,
Volume 05 pp. 2321-7308.
Uicker, J. J., Pennock, G.R., and Shigley, J. E., (2003). Theory of Machines and
Mechanisms. Third Edition. New York: Oxford University Press.
Ulrich, K.T., and Eppinger, S.D., (2003). Product Design and Development. New Delhi:
Tata McGraw-Hill Publishing Company Limited .
UN-HABITAT., (2009). Appropriate Earth Technology in Uganda: ISBN: 1184/09E, pp
50.
Waziri, B.S., Lawan, Z.A., and Mala, M., (2013). Properties of Compressed Stabilized
Earth Blocks (CSEB) For Low Cost Housing Construction: A Preliminary Investigation.
International Journal of Sustainable Construction Engineering & Technology, Vol 4, No
2,(ISSN: 2180-3242), pp. 39-46.
Yakubu, S.O., and Umar, M.B., (2015). Design, Construction and Testing Of a
Multipurpose Brick/Block Moulding Machine. American Journal of Engineering
Research (AJER), 04(2320-0936), pp. 33-43.

70
APPENDICES

71
APPENDIX A: ISSB TIME STUDY OBSERVATION SHEET
Time study observation sheet
Identification of operation: Date:
Start time :9:06
End time :10:48
Operator: Mr .Tembo Approval : Observer: O.Samungole
Element description and
breakpoint
Cycles Summary
No. 1 2 3 4 5 6 7 8 9 10 11 12 13 14 15 TSUM TAV PR NT
1. Soil preparation 9.8 - - - - - - - - - - - - - -
2. Filling machine
mould
T 30.8 30.8 23.3 20.9 21.6 22.3 24.6 19.9 31.7 16.0 16.2 20.7 14.9 17.2 27.7 338.6 22.6 0.9 27.12
3. Lid closing and
compaction
T 29.8 24.9 24.2 40.8 13.4 23.6 19.5 20.4 22.9 23.1 24.2 15.8 20.6 18.6 26.2 348.0 23.2 0.9 27.84
4. Lid opening and
ejection
T 10.9 10.6 10.5 10.2 6.4 8.8 9.4 8.8 14.8 7.5 10.3 6.3 9.4 8.3 15.0 147.2 9.8 0.9 11.84
5. Stacking the
block
T 24.8 21.2 19.3 13.9 8.8 16.7 10.0 9.4 15.4 12.8 30.3 14.1 15.3 21.0 11.7 244.7 16.3 0.9 19.56

72
APPENDIX B: COMPRESSIVE STRENGTH OF MANUAL TDAU ISSBs
B1: 50% Cement Composition
B2: 25% Cement Composition
B3: 17% Cement Composition

73
B4: 12% Cement Composition
B5: 10% Cement Composition

74
APPENDIX C: COMPRESSIVE STRENGTH TEST RESULTS OF HISSBs
C1: 50% Cement Composition.
ID No. Lentgth(mm)Height(mm) Width(mm) Weight(kg)
1 248.00 120 220 10.30 54,560.00 32,200.00 5.79 1,573.19
2 247.00 120 220 10.20 54,340.00 33,000.00 5.96 1,564.23
3 257.00 120 220 10.70 56,540.00 33,200.00 5.76 1,577.05
4 257.00 120 220 10.70 56,540.00 34,800.00 6.04 1,577.05
5 250.00 120 220 10.50 55,000.00 35,000.00 6.24 1,590.91
6 246.00 120 220 10.20 54,120.00 34,000.00 6.16 1,570.58
MEAN 250.83 120 220 10.43 55,183.33 33,700.00 5.99 1,575.50
SD 4.96 0.00 0.00 0.23 1,090.42 1,093.62 0.19 8.93
1 232.00 120 220 10.50 51,040.00 55,400.00 10.65 1,714.34
2 234.00 120 220 10.50 51,480.00 57,200.00 10.90 1,699.69
3 233.00 120 220 10.50 51,260.00 53,400.00 10.22 1,706.98
4 234.00 120 220 10.50 51,480.00 44,000.00 8.38 1,699.69
5 237.00 120 220 10.50 52,140.00 56,200.00 10.57 1,678.17
6 234.00 120 220 10.50 51,480.00 54,000.00 10.29 1,699.69
MEAN 234.00 120 220 10.50 51,480.00 53,366.67 10.17 1,699.76
SD 1.67 0.00 0.00 0.00 368.13 4,795.69 0.91 12.09
1 225.00 120 220 10.30 49,500.00 55,000.00 10.90 1,734.01
2 224.00 120 220 10.50 49,280.00 61,600.00 12.26 1,775.57
3 225.00 120 220 10.40 49,500.00 65,600.00 13.00 1,750.84
4 225.00 120 220 10.40 49,500.00 59,600.00 11.81 1,750.84
5 224.00 120 220 10.20 49,280.00 58,800.00 11.71 1,724.84
6 230.00 120 220 10.20 50,600.00 61,000.00 11.83 1,679.84
MEAN 225.50 120 220 10.33 49,610.00 60,266.67 11.92 1,735.76
SD 2.26 0.00 0.00 0.12 496.83 3,495.52 0.69 32.52
1 220.00 120 220 10.30 48,400.00 66,200.00 13.42 1,773.42
2 223.00 120 220 10.50 49,060.00 67,000.00 13.40 1,783.53
3 223.00 120 220 10.50 49,060.00 65,400.00 13.08 1,783.53
4 220.00 120 220 10.40 48,400.00 62,600.00 12.69 1,790.63
5 224.00 120 220 10.50 49,280.00 64,000.00 12.74 1,775.57
6 230.00 120 220 10.70 50,600.00 67,800.00 13.14 1,762.19
MEAN 223.33 120 220 10.48 49,133.33 65,500.00 13.08 1,778.14
SD 3.67 0 0 0.13 807.33 1,933.91 0.31 9.98
RATIO 1:2/PREASSURE 2MPa
RATIO 1:2/PREASSURE 4MPa
RATIO 1:2/PREASSURE 6MPa
RATIO 1:2/PREASSURE 8MPa
Bulk Density(Kg/m3)
Block Measurements
Area (mm2) Max Load (kgf) Strength (N/mm2)

75
C2: 25% Cement Composition.
ID No. Lentgth(mm)Height(mm) Width(mm) Weight(kg)
1 265.00 120 220 10.10 58,300.00 16,600.00 2.79 1,443.68
2 265.00 120 220 10.20 58,300.00 20,000.00 3.37 1,457.98
3 255.00 120 220 10.30 56,100.00 21,000.00 3.67 1,530.01
4 260.00 120 220 10.30 57,200.00 22,400.00 3.84 1,500.58
5 257.00 120 220 10.30 56,540.00 21,200.00 3.68 1,518.10
6 260.00 120 220 10.30 57,200.00 19,000.00 3.26 1,500.58
MEAN 260.33 120 220 10.25 57,273.33 20,033.33 3.43 1,491.82
SD 4.08 0.00 0.00 0.08 898.15 2,037.32 0.38 33.96
1 235.00 120 220 10.20 51,700.00 28,800.00 5.46 1,644.10
2 235.00 120 220 10.20 51,700.00 33,800.00 6.41 1,644.10
3 230.00 120 220 10.00 50,600.00 32,800.00 6.36 1,646.90
4 235.00 120 220 10.30 51,700.00 31,400.00 5.96 1,660.22
5 235.00 120 220 10.30 51,700.00 35,000.00 6.64 1,660.22
6 238.00 120 220 10.20 52,360.00 34,000.00 6.37 1,623.38
MEAN 234.67 120 220 10.20 51,626.67 32,633.33 6.20 1,646.49
SD 2.58 0.00 0.00 0.11 568.04 2,239.35 0.42 13.59
1 225.00 120 220 10.20 49,500.00 41,400.00 8.20 1,717.17
2 235.00 120 220 10.10 51,700.00 36,800.00 6.98 1,627.98
3 230.00 120 220 10.30 50,600.00 36,400.00 7.06 1,696.31
4 225.00 120 220 10.20 49,500.00 35,600.00 7.06 1,717.17
5 235.00 120 220 10.00 51,700.00 26,800.00 5.09 1,611.86
6 225.00 120 220 10.20 49,500.00 35,000.00 6.94 1,717.17
MEAN 229.17 120 220 10.17 50,416.67 35,333.33 6.89 1,681.28
SD 4.92 0.00 0.00 0.10 1,081.51 4,755.91 1.01 48.48
1 225.00 120 220 10.40 49,500.00 29,200.00 5.79 1,750.84
2 230.00 120 220 10.50 50,600.00 37,800.00 7.33 1,729.25
3 225.00 120 220 10.30 49,500.00 37,400.00 7.41 1,734.01
4 225.00 120 220 10.40 49,500.00 40,600.00 8.05 1,750.84
5 228.00 120 220 10.10 50,160.00 38,800.00 7.59 1,677.96
6 225.00 120 220 10.30 49,500.00 37,000.00 7.33 1,734.01
MEAN 226.33 120 220 10.33 49,793.33 36,800.00 7.25 1,729.48
SD 2.16 0.00 0.00 0.14 475.25 3,939.54 0.77 26.86
RATIO 1:4/PREASSURE 8MPa
Bulk Density (Kg/m3)
RATIO 1:4/PREASSURE 2MPa
RATIO 1:4/PREASSURE 4MPa
RATIO 1:4/PREASSURE 6MPa
Block Measurements
Area (mm2) Max Load (kgf)Strength (N/mm2)
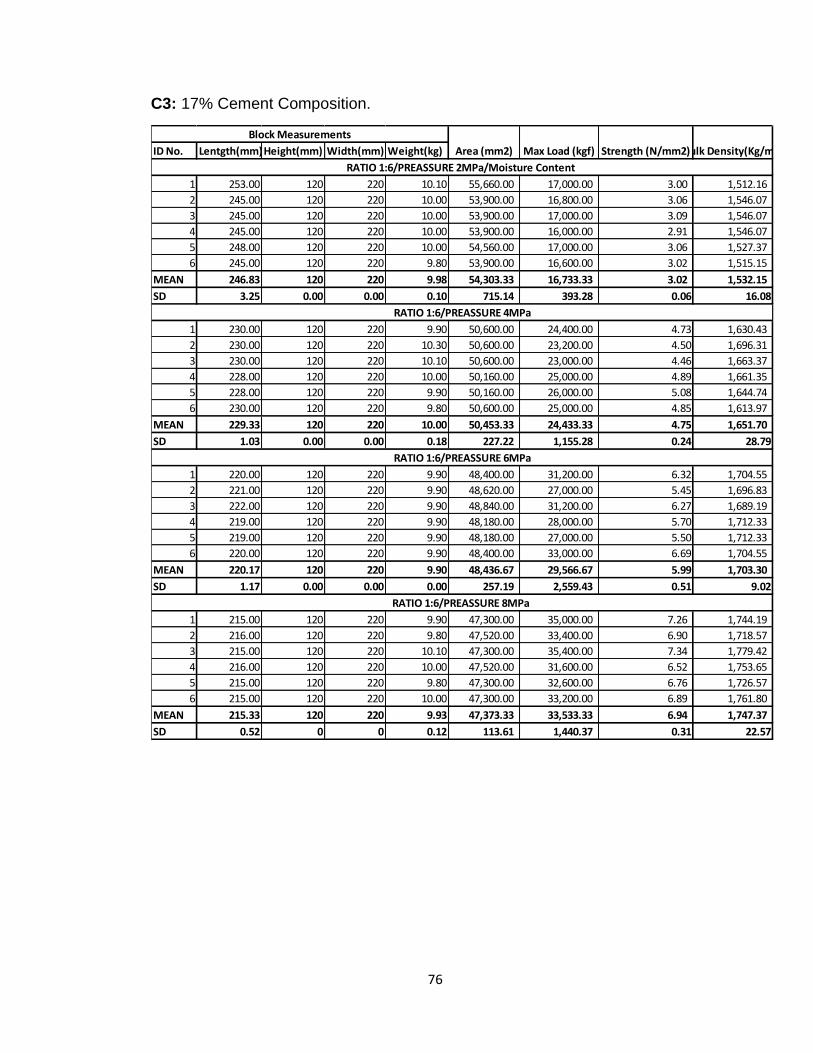
76
C3: 17% Cement Composition.
ID No. Lentgth(mm)Height(mm) Width(mm) Weight(kg)
1 253.00 120 220 10.10 55,660.00 17,000.00 3.00 1,512.16
2 245.00 120 220 10.00 53,900.00 16,800.00 3.06 1,546.07
3 245.00 120 220 10.00 53,900.00 17,000.00 3.09 1,546.07
4 245.00 120 220 10.00 53,900.00 16,000.00 2.91 1,546.07
5 248.00 120 220 10.00 54,560.00 17,000.00 3.06 1,527.37
6 245.00 120 220 9.80 53,900.00 16,600.00 3.02 1,515.15
MEAN 246.83 120 220 9.98 54,303.33 16,733.33 3.02 1,532.15
SD 3.25 0.00 0.00 0.10 715.14 393.28 0.06 16.08
1 230.00 120 220 9.90 50,600.00 24,400.00 4.73 1,630.43
2 230.00 120 220 10.30 50,600.00 23,200.00 4.50 1,696.31
3 230.00 120 220 10.10 50,600.00 23,000.00 4.46 1,663.37
4 228.00 120 220 10.00 50,160.00 25,000.00 4.89 1,661.35
5 228.00 120 220 9.90 50,160.00 26,000.00 5.08 1,644.74
6 230.00 120 220 9.80 50,600.00 25,000.00 4.85 1,613.97
MEAN 229.33 120 220 10.00 50,453.33 24,433.33 4.75 1,651.70
SD 1.03 0.00 0.00 0.18 227.22 1,155.28 0.24 28.79
1 220.00 120 220 9.90 48,400.00 31,200.00 6.32 1,704.55
2 221.00 120 220 9.90 48,620.00 27,000.00 5.45 1,696.83
3 222.00 120 220 9.90 48,840.00 31,200.00 6.27 1,689.19
4 219.00 120 220 9.90 48,180.00 28,000.00 5.70 1,712.33
5 219.00 120 220 9.90 48,180.00 27,000.00 5.50 1,712.33
6 220.00 120 220 9.90 48,400.00 33,000.00 6.69 1,704.55
MEAN 220.17 120 220 9.90 48,436.67 29,566.67 5.99 1,703.30
SD 1.17 0.00 0.00 0.00 257.19 2,559.43 0.51 9.02
1 215.00 120 220 9.90 47,300.00 35,000.00 7.26 1,744.19
2 216.00 120 220 9.80 47,520.00 33,400.00 6.90 1,718.57
3 215.00 120 220 10.10 47,300.00 35,400.00 7.34 1,779.42
4 216.00 120 220 10.00 47,520.00 31,600.00 6.52 1,753.65
5 215.00 120 220 9.80 47,300.00 32,600.00 6.76 1,726.57
6 215.00 120 220 10.00 47,300.00 33,200.00 6.89 1,761.80
MEAN 215.33 120 220 9.93 47,373.33 33,533.33 6.94 1,747.37
SD 0.52 0 0 0.12 113.61 1,440.37 0.31 22.57
Bulk Density(Kg/m3)
RATIO 1:6/PREASSURE 2MPa/Moisture Content
RATIO 1:6/PREASSURE 4MPa
RATIO 1:6/PREASSURE 6MPa
RATIO 1:6/PREASSURE 8MPa
Block Measurements
Area (mm2) Max Load (kgf) Strength (N/mm2)

77
C4: 12% Cement Composition.
ID No. Lentgth(mm)Height(mm) Width(mm) Weight(kg)
1 249.00 120 220 9.90 54,780.00 13,900.00 2.49 1,506.02
2 247.00 120 220 9.60 54,340.00 14,000.00 2.53 1,472.21
3 252.00 120 220 10.00 55,440.00 13,200.00 2.34 1,503.13
4 254.00 120 220 10.00 55,880.00 14,400.00 2.53 1,491.29
5 252.00 120 220 9.90 55,440.00 14,100.00 2.49 1,488.10
6 251.00 120 220 9.80 55,220.00 14,200.00 2.52 1,478.93
MEAN 250.83 120 220 9.87 55,183.33 13,966.67 2.48 1,489.95
SD 2.48 0.00 0.00 0.15 546.32 413.12 0.07 13.22
1 232.00 120 220 10.00 51,040.00 22,500.00 4.32 1,632.71
2 236.00 120 220 10.20 51,920.00 23,000.00 4.35 1,637.13
3 230.00 120 220 9.40 50,600.00 23,200.00 4.50 1,548.09
4 229.00 120 220 9.80 50,380.00 22,800.00 4.44 1,621.01
5 229.00 120 220 9.80 50,380.00 24,200.00 4.71 1,621.01
6 230.00 120 220 9.80 50,600.00 23,000.00 4.46 1,613.97
MEAN 231.00 120 220 9.83 50,820.00 23,116.67 4.46 1,612.32
SD 2.68 0.00 0.00 0.27 590.32 581.09 0.14 32.59
1 222.00 120 220 9.80 48,840.00 26,600.00 5.34 1,672.13
2 227.00 120 220 10.10 49,940.00 25,400.00 4.99 1,685.36
3 227.00 120 220 10.10 49,940.00 25,400.00 4.99 1,685.36
4 230.00 120 220 10.30 50,600.00 26,000.00 5.04 1,696.31
5 230.00 120 220 9.80 50,600.00 27,000.00 5.23 1,613.97
6 230.00 120 220 10.00 50,600.00 25,000.00 4.85 1,646.90
MEAN 227.67 120 220 10.02 50,086.67 25,900.00 5.07 1,666.67
SD 3.14 0.00 0.00 0.19 691.05 777.17 0.18 30.90
1 219.00 120 220 9.80 48,180.00 36,000.00 7.33 1,695.03
2 219.00 120 220 9.80 48,180.00 34,200.00 6.96 1,695.03
3 220.00 120 220 10.00 48,400.00 33,600.00 6.81 1,721.76
4 218.00 120 220 10.00 47,960.00 29,400.00 6.01 1,737.56
5 215.00 120 220 9.90 47,300.00 28,400.00 5.89 1,744.19
6 215.00 120 220 9.80 47,300.00 29,800.00 6.18 1,726.57
MEAN 217.67 120 220 9.88 47,886.67 31,900.00 6.53 1,720.02
SD 2.16 0 0 0.10 475.25 3,095.16 0.58 20.91
RATIO 1:8/PREASSURE 2MPa
RATIO 1:8/PREASSURE 4MPa
RATIO 1:8/PREASSURE 6MPa
RATIO 1:8/PREASSURE 8MPa
Strength (N/mm2)Bulk Density(Kg/m3)
Block Measurements
Area (mm2) Max Load (kgf)

78
C5: 10% Cement Composition.
ID No. Lentgth(mm)Height(mm) Width(mm) Weight(kg)
1 265.00 120 220 10.20 58,300.00 11,000.00 1.85 1,457.98
2 265.00 120 220 10.20 58,300.00 11,800.00 1.99 1,457.98
3 270.00 120 220 10.20 59,400.00 10,000.00 1.65 1,430.98
4 265.00 120 220 10.40 58,300.00 10,400.00 1.75 1,486.56
5 270.00 120 220 10.50 59,400.00 10,000.00 1.65 1,473.06
6 268.00 120 220 10.50 58,960.00 10,400.00 1.73 1,484.06
MEAN 267.17 120 220 10.33 58,776.67 10,600.00 1.77 1,465.10
SD 2.48 0.00 0.00 0.15 546.32 692.82 0.13 20.73
1 237.00 120 220 10.10 52,140.00 24,800.00 4.67 1,614.24
2 240.00 120 220 10.00 52,800.00 21,000.00 3.90 1,578.28
3 245.00 120 220 10.20 53,900.00 19,600.00 3.57 1,576.99
4 240.00 120 220 10.10 52,800.00 20,000.00 3.72 1,594.07
5 240.00 120 220 10.20 52,800.00 19,800.00 3.68 1,609.85
6 240.00 120 220 10.10 52,800.00 19,800.00 3.68 1,594.07
MEAN 240.33 120 220 10.12 52,873.33 20,833.33 3.87 1,594.58
SD 2.58 0.00 0.00 0.08 568.04 2,005.66 0.41 15.46
1 235.00 120 220 10.20 51,700.00 23,400.00 4.44 1,644.10
2 230.00 120 220 10.10 50,600.00 21,000.00 4.07 1,663.37
3 235.00 120 220 10.30 51,700.00 26,000.00 4.93 1,660.22
4 235.00 120 220 10.20 51,700.00 22,600.00 4.29 1,644.10
5 235.00 120 220 10.30 51,700.00 22,400.00 4.25 1,660.22
6 235.00 120 220 10.20 51,700.00 23,000.00 4.36 1,644.10
MEAN 234.17 120 220 10.22 51,516.67 23,066.67 4.39 1,652.69
SD 2.04 0.00 0.00 0.08 449.07 1,652.47 0.29 9.47
1 225.00 120 220 10.40 49,500.00 22,400.00 4.44 1,750.84
2 230.00 120 220 10.50 50,600.00 28,000.00 5.43 1,729.25
3 225.00 120 220 10.30 49,500.00 25,200.00 4.99 1,734.01
4 225.00 120 220 10.40 49,500.00 27,200.00 5.39 1,750.84
5 228.00 120 220 10.10 50,160.00 22,600.00 4.42 1,677.96
6 225.00 120 220 10.30 49,500.00 26,900.00 5.33 1,734.01
MEAN 226.33 120 220 10.33 49,793.33 25,383.33 5.00 1,729.48
SD 2.16 0 0 0.14 475.25 2,413.64 0.47 26.86
RATIO 1:10/PREASSURE 8MPa
RATIO 1:10/PREASSURE 6MPa
Bulk Density(Kg/m3)
RATIO 1:10/PREASSURE 4MPa
RATIO 1:10/PREASSURE 2MPa
Strength (N/mm2)
Block Measurements
Area (mm2) Max Load (kgf)

79
APPENDIX D: HISSB MAKING MACHINE DESIGN DRAWINGS AND MODELS
D1: HISSB Making Machine General Arrangement

80
D2: HOPPER AND SOIL CONVEYOR ASSEMBLY
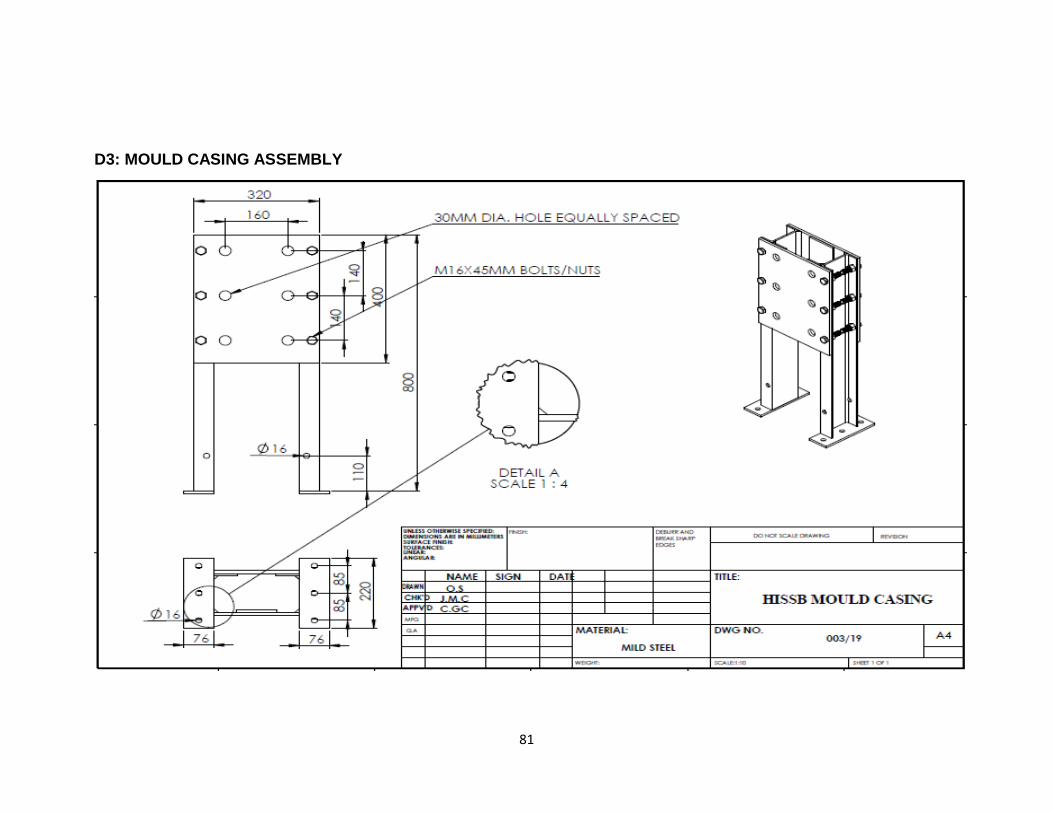
81
D3: MOULD CASING ASSEMBLY
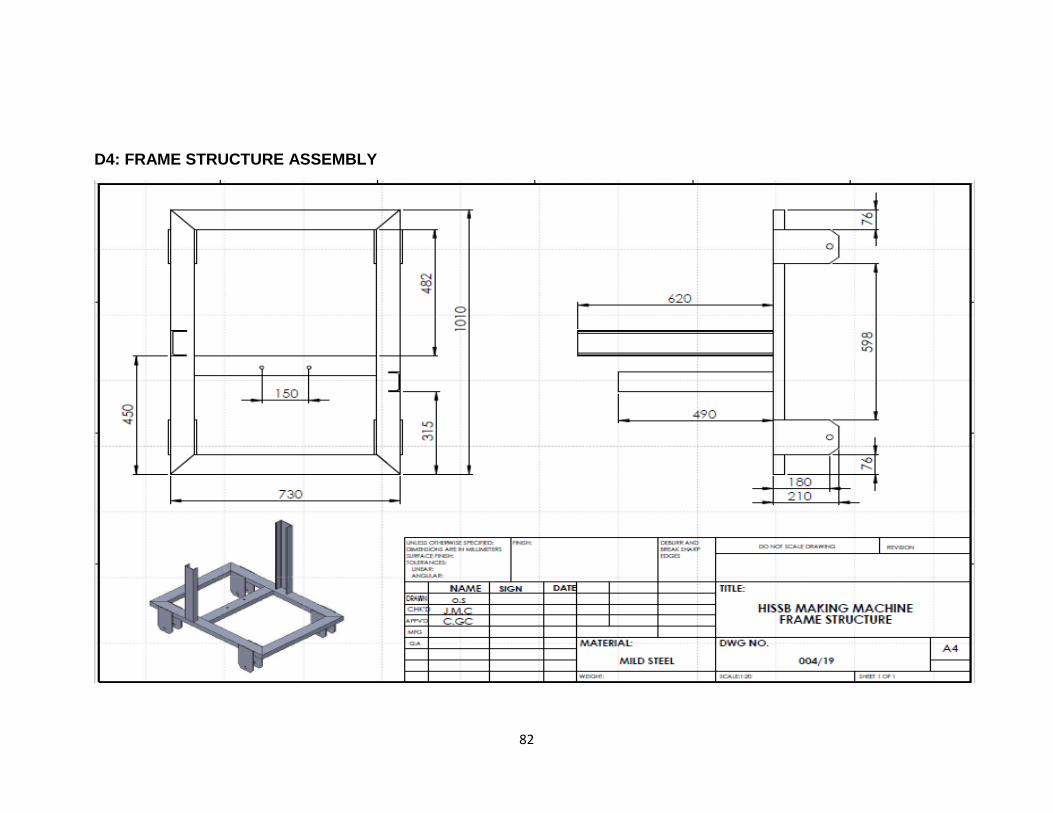
82
D4: FRAME STRUCTURE ASSEMBLY
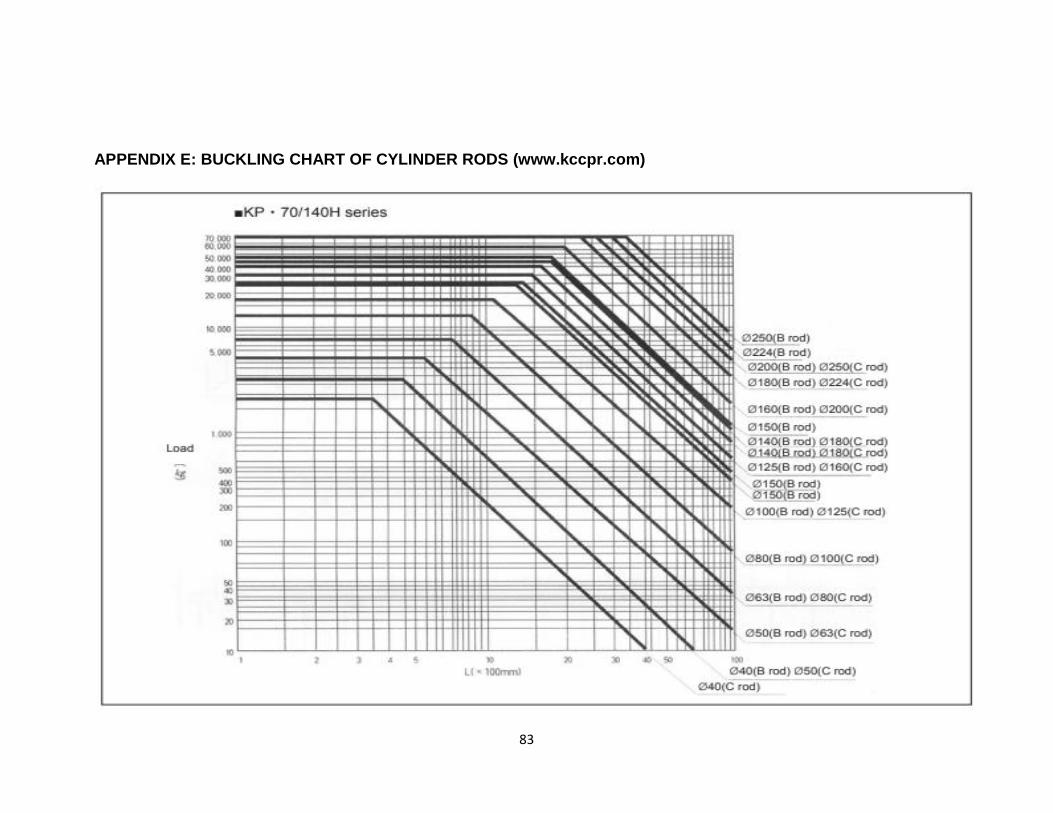
83
APPENDIX E: BUCKLING CHART OF CYLINDER RODS (www.kccpr.com)
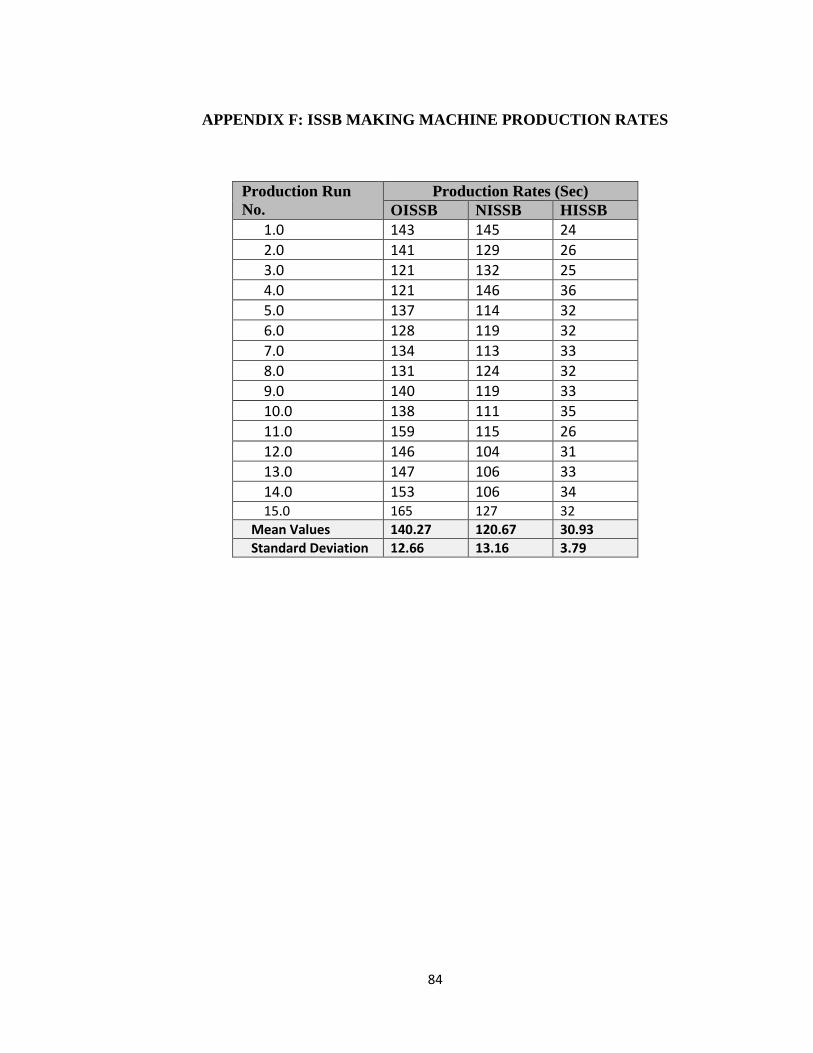
84
APPENDIX F: ISSB MAKING MACHINE PRODUCTION RATES
Production Run
No.
Production Rates (Sec)
OISSB NISSB HISSB
1.0 143 145 24
2.0 141 129 26
3.0 121 132 25
4.0 121 146 36
5.0 137 114 32
6.0 128 119 32
7.0 134 113 33
8.0 131 124 32
9.0 140 119 33
10.0 138 111 35
11.0 159 115 26
12.0 146 104 31
13.0 147 106 33
14.0 153 106 34 15.0 165 127 32
Mean Values 140.27 120.67 30.93
Standard Deviation 12.66 13.16 3.79

85
APPENDIX G: DESCRIPTIVE STATISTICS
G1: NISSB and HISSB Making machines
MACHINE N Mean SD SEM
NISSB 15 120.666 13.16 3.3984
HISSB 15 30.9333 3.79 0.9782
Difference 89.7333
G2: OISSB and HISSB Making machines
MACHINE N Mean SD SEM
OISSB 15 140.2000 12.5254 3.2341
HISSB 15 30.9333 3.79 0.9782
Difference 89.7333