digital.lib.lehigh.edudigital.lib.lehigh.edu/fritz/pdf/297_9.pdf · plastic design in high strength...
TRANSCRIPT

f
by
Maxwell sLayTheodore V. alanlbos
Plastic . esign in High Strength Steel
l
Fri~'z Engineering Laboratory Report 29789

Plastic Design in High strength Steel
THE INELASTIC BEHAVIOR OF CLOSELY-BRACEDSTEEL BEAMS UNDER UNIFORM MOMENT
by
M. G. LayT. V. Galambos
This work has been carried out as part of an investigationsponsored jointly by the" Welding Research Council and theDepartment of the Navy ,with funds .furnished by the following:
American Institute of Steel ConstructionAmerican Iron and Steel InstituteInstitute 'of Research, Lehigh UniversityColumn Research Council (Advisory)Office of Naval Research (Contract No. 610'~03) )·Bureau of ShipsBureau of Yards and Docks
Reproduction of this'report in whole or in part is permittedfor ~ p~rpose, of the United States Government.
July 1964
Fritz Engineering LaboratoryDepartment of Civil Engineering
Lehigh UniversityBethlehem, Pennsylvania
Fritz Engineering Laboratory Report No. 29709

TABLE OF CONTENTS
Page
1. INTRODUCTION 1
20 THE DISCONTINUOUS STRESS-STRAIN LAWS 3
2.1 INTRODUCTION 3
2~2 BASIC STEEL BEHAVIOR 3
2.3 THE IDEALIZED STRESS-STltAIN DIAGRAM 6
2.4 THE REAL STRESS-STRAIN DIAGRAM 7
2.5 BI:b1JRCATION BEHAVIOR IN TIELDED MEMBERS 10
2.6 FLEXURAL STIFFNESS OF AXIALLY YIELDED ~IEMBERS 12
2.7 THE FORMATION OF FLEXURAL YIELD PLANES 152.8 THE FLEXURAL' STIFFNESS OF A FLEXURAL YIELD PLANE 18
2,9 OVERALL FLEXURAL STIFFNESS 19
3. BEAMS SI~fPLY SUPPORTED AND UNDER UNIFORM MOIVlENT 21
301 INTRODUCTION 21
3.2 REVIEW OF PREVIOUS STU1)II~S 21
·3.3 PREVIOUS ELASTO-PLASTIC STUDIES 253.4 A IDDEL FOR THE SUB-OPTlMU11 BEAM PROBLEM 26
3.5 APPLICATION OF THE MODEL TO BUCKLING BEHAVIOR 30
3.6 AP})LICATION OF, THE MODEL TO NON-BUCKLING BEHAVIOR 32
3.7 TORSIONAT.J BtJCKI,I}TG 37
3.8 VERY SlIOR.'r BEfu~'IS 38
309 lATERAL DEFJ~CTIONS 40

297.9
Page
3.10 SmvIMARY 4I
4. EmOTIVE LENGTHS h'3
4.1 INTRODUCTION 43
402 REVIEvl OF PREVIOUS STUDIES: 43
4.3 THE EFFECTIVE LENGTH OF CRITICAL SPANS 444.i~ BEAM TEST RESULTS 48
4.5 DISCUSSION OF TEST RESULTS 49
4.6 EFFECTIVE LENGTH FACTORS 51
5. CONCLUSIONS 54
6. ACKNOWLEDGEMENTS 56
7. NOMENCLATURE 57
8. FIGURES 61
9. REFERENCES 93
...' ....
~: ~ .. " .~ ~: t ..
..
297.9
1. INTRODUCTION
This report will be confined to a study of beams under uniform
moment. In many cases this represents the most critical loading possible
for ',a beam bent about its strong axis. It will be assumed that, for an
efficient design, it will be necessa~ that the beam be able to attain
its maximum moment of MP (the plastic moment)~ This requirement will plaoe
a restriction on the unbraced length of t~e beam. Beams braced in such
a manner that they can attain ~ will be termed rr alos.ely braced".
In many instances i·t is not only necessary for a beam to attain
Mp, but it must· also maintain this moment through a range of deformation.
This situation arises when a redistribution of moments m~st.occur·to
allow a collapse mechanism to form or when the collapse me~hanism~itBelf
must d.eform to" absorb energy, as in the case 'of earthquake design.
It is the purpose of; .. this report to discuss beams which are
braced sufficiently close~ to allow attainment of Mp, and to give analy
tica~ expressions for the range ot deformation through which MP can be
~ maintained. This range is commonly defined Qy the 'rotation capacity of the
Previous studies of the above, and. related subjects, have not"-
been completely successful. The apparent reaspn for ,this lies in the
continuous stress-strain diagram which ,is commonly used to represent the

297.9 -2-
behavior of structural steel. To overcome this difficulty the following
section will derive stress-strain relationships based on the actual dis
continuous yielding process which occurs in steel. Later sections will
apply these relationships to the prediction oi~ ~l:,h0 rotation capacity of
steel beams under uniform moment.j

297.9 -3-
2 • TIlE DISCON'rlNUOUS STRESS-STRAIN LAvJS
'llhe folJ_owing studies will be restricted to those nletals which
yield in a similar metallurgical manner to low-alloy, low-carbon steels.
Structural steels included in this category are those covered by the
follol~ing As'rM Specifications1 : ASTM A7, A373, A242, ALthO, and A4J.il, and
permi.tted for steel construction by the current AISC Specifications2• Such
steels are frequently described by their stress-strain diagram, which is
shown in id~alized forn in Fig. 1.
This continuous relationship between stress and strain is
suitable for many structural applications. It will become apparent, how-
ever, that the problems to be solved in this investigation will require
the use of a more realistic, discontinuous stress-strain law. There have
been relatively few attemrts to apply such relationships to structural
problems. ~Vhite3, Haaijer4, and ThHrlimann5 have assumed that a yielded
member is composed of two different materials, thus giving a disconti.nuous
member 0 In the study to be presented the member will be continuous, but
a discontinuous stress-strain relationship will be adopted.
2.2 BASIC STEEL BEHAVIOR
rrhe structural stel.:;ls "',eing discllssed behave in a manner wh:tch.
is son16what unique anJong rnetals. If a polycrystalline element of the
steel is loaded , its crystalline strllc"C1.lre wi.11. in:ttiall.y deforrn elastJical1y

29'7.9 -4-
(Fig. 2a). When the shear stresses in the element reach a critical value,
slip planes will form in the direction of the critical shear stress (Fig.
2b)o The initiating point for the slip plane will depend on the presence
of various weaknesses and dislocations in the crystalline structllre6•
Generally the direct:.Lon of the slip plane will coincide with a maximum
shear stress directiono
The slip plane is initially in neutral equilibrium, and slipping
continues ,until resistance develops in the interface between the slipping
surfaces. The observed effect is a finite jump in strain from the yield
(or slip) strain to the strain-hardening (or resistance) strain. In a
region of constant, or near constant, stress a slip plane is in an unstable
condition? and will progress until it either leaves the critical stress
region or meets a surface.
The planes on which metal slips on a microscopic scale have been
metallurgically observed to be composed of many individual slip planesS,9.
Such a composite plane is called a yield plane, and its traces on the sur
face of the body are called yield lines (yield lines have also been called
glide lines and LHder linesS). The yield planes are actually thin bands or
plates (lamella) and, similarly, the yield lines are observed to be thin
bandSt
As a result of the shearing behavior of the lamella yield planes,
and the material movement which occurs in themS, th~ surface of a body in
the region of a yield line becomes irregular 0 This will cause any brittle

297.9 -5-
--;"If;. ,.
coating, such as mill scale, to flake off and thus provide an indication
of the presence of yield lines, In laboratory tests the yield lines are
made more obvious by coating the mill scale with whitewash.
Yield lines can be seen in the photographs* in ~g. 3. Compressive
yield lines are shown in Fig. 3a rurlnj.l'lg 110rmal to the beam axis. Tensile
yield lines are shown in Fig. 3b, and they criss-cross the beam at 45 degrees
to the beam axis. Figure 1.t. illustrates how both these patterns represent
composite slipping along maximum shear stress planeso It is a frequent
experimental observation that compressive yield lines tend to ..:form. on the
45-degree plane across the shorter dimension of a plate element (Fig. 3a),
whereas tensile yield lines tend to choose the 4~-degree' plane across the
larger dimension of the element.
If the problem is treated as one of plane stress" rather than
plane strain, it can be shown that the yield planes will form at 55 degrees
to the normal stress direction10,11. The mathematical proof requires a
semi-infinite platell , and in the practical case Nadai suggestslO that... I"
the 55-degree lines will only form when the ra"tio of plate width to thick-
ness exceeds about 'seveno Nadai also notes that the 45-degree lines are
,I actually closer to 47 degrees in tension and 43 degree, in compression
(When measured from the normal stress direction).
No attempt is made here to _give a metallurgical explanation of
the yielding process. This is available elsewhere90 The aim has been to
~~ A full description of these tests will be found in Fritz EngineeringLaboratory Report 297.8, Reference 21~ All tests taken from 297.8 aredescribed by an HT number.

297.9 -6-
present a correct phenomenological basis from which a suitable structural
model can be postulated.
2.3 THE IDEALIZED STRESS-STRAIN DIAGRAM
If the stress vs. overall strain on the poly-crystalline element
in Fig. 2b were recorded, the (idealized) stress-strain diagram in Fig. 1
would be obtained. Note that the strain at strain-hardening is denoted
by S Gy and the strain-hardening modulus by E/h. When the element is in
the condition shown in Figo 2b, the overall strain would be between f y and
s eye
Consider the equilibrium of the element in Fig. 2b or 4a. The
free body and strain diagram are shown in Fig~ 5. The strain in the yield
plane cannot rise above the strain-hardening strain, s6y ' as this would
require an increase in stress, C) , which would first create new yieldy .
planes. ~ence the entire element must be yielded before strain-hardening
stresses OCCllr. Let the initial length of a test piece, similar to the
, element in Fig. 2, bt; :L, and let the total yielded length be ~L. Then the
length at this stage of yielding is
L - 6L III L - (1 - ¢)L~y - ¢LSGy
al1d the overaD. strain or gage length strain is defined as [, where
and
( 2.1)
(2.2)

297.9
,.;<A.'
-7-
It is emphasized that, whereas ~here are overall strains, ~ ,
between cy and s ey
, there are no actual strains between these limits
(Fig. 5). The overall strains,a.re average values resulting from Eq,. 2,
which is itself a result of the, discontinuous process of slip plane
formation.
If the load on the specimen is decreased, the initial unloading
will be elastic and will result from the crystalline structure reoovering
i.ts original shape (Fig. 2a). However, the slip planes are completely
irreversible, and their behavior is analogous to the classical friction
problem.
If the load is increased above ~ the de£ormations will be
related to the stress increase by the stratn-hardening modulus, B/h. In
a stress-strain diagram derived directly from a tension test~J' h is only
a constant for an initial range of strain-hardening strains. However much
of the variation of h can be removed by cons~dering the (trtruen) stress-
strain .diagram based on the actual specimen· dimensions. The variation in
specimen dimensions during the tension test· exaggerates the variation in h.
H01JeVer the reverse is true of compression behavior and so it may be
assumed thatJfor compressive strains of the range ( O~3s6 ) consideredy
in this report, E/h can be taken as a·constant.
'I:
2.4 THE REAL STRESS-STRAIN DIAGRAM
The real overall stress-stra~n diagram differs from the idealized
curve (Fig. 1) 'in a number of* l'~ay'S3, Frorn tlle point of view of this
.." .

297.9.'t"
-8-
stud~, ~he most interesting differences are the presence of an upner yield
point and the existence of static and dynamic yield stresses. These two
features are illustrated in Fig. 6, which shows a portion of a reaJ.. stress
strain diagramo
The upper ~rield point arises from the fact that it takes more
stress to initiate a slip plane than it does to maintain one, once it has
been initiated9. There is, in effect, an initial resistance in the dis
locations which form the slip plane, and this resistance disappears once
slipping occurso
There are a number of reasons~why an upper yield point may not
be observed 0 If the specimen is not very uniform, then the upper yield
point at some locations may be lower than the lower yield point elsewhere.
As a consequence, slip planes will first form at the weaker sections at
low stresses, and the stress-strain curve will exhibit a knee rather than
a peako A second reason arises from the load-deformation characteristic of
the load system12 and the speed of testing. It can be seen from Reference
12 and Fig 0 6 that the upTJer yield p,oint will normally represent an un
stable equilibritun positiono The entire system will then follow the load
characteristic (LLI in Figo 6) until it intersects the stress-strain
curve at L' 0 L f will be the first stable point after the upper yield
point 0 If the testing machine is soft (that is, 11' has a small gradient),
or if the dynamic effects are significant, the strain at L' can be much
greater than the yield strain, and thus mask the effect of an upper yield
point 0 This effect has been disqussed by Siebel13~

297.9 -9-
If the straining is completely stopped after the yield strain
has been passed, the stress drops to the statio yield stress level shown
in Fig. 6. On reloading, the stress rises to the dynamic yield stress
level and straining then continues at a constant rate. The difference
between the static and dynamic yield stresses is composed of a stress
required ~o initiate further slip p~anes and a dynamic stress. The
dynamic stress is a result of the ~time dependence of the slip plane forma-
. 14t~on prooess • These form relatively slowly and do not normally have a
chance to keep pace with the applied strain rate, hence a fictitious
elastic behavior is observed.
The above explanation is not completely valid, as it would
predict that the upper yield point and the dynamic yield stress should
be equal, if the strain rate is kept oonstant. Actually, the dynamic
yield stress is lower than the upper yield stress. This is because the
elast~c specimen has either relatively few dislocations, or only latent9
dislocations, with which to initiate and maintain slip planes. However,
once yielding has been started, many· dislocation sources are formed and
further yielding is, figuratively, able to occur in a much more lubricated
condition0
In the preceding paragraphs eluphasis has been placed on the
fact that the stress to form a slip plane is larger than the stress to
maintain it. This factor is important in later developments, and the
initiating stress wi~l be termed iO""'y ( rry is the maintenance or static
yield stress). The major requirement of these later developments is that

297.9 -lCJ-
i / 1. A lower bound estimate of i can be obtained by considering the
ratio of dynamic to static yield stresses as the strain rate approaches
zero. From the earlier discussion it is obvious that at zero strain rate
this ratio will represent io; for a yielded specimen.
Beedle and Tall15 have studied the strain rate effect, and Fig.
7 reproduces Fig. 13 of their study. The low strain rate tests in this
plot came from an investigation by Gozum and HUber16 . They found that
at an almost zero strain rate (1.0 micro sec. -1) the ratio of "dynamic ll
to static yield stresses was close to 1.05. For the purpose of this
dissertation it will therefore be assumed that
i = 1.05 (2.4)
with the reservation that this is a lower bound if dynamic effects exist
or if the yield lines being studied are the first to form in the specimen.
The results of Gozum and Huber16
were obtained from tension tests.
However, the type of test is irrelevant in a study such as this, as the
slip planes form at critical shear stress values. The direction of the
applied stresses onlY alters the relative directions in which the slip
planes move.
2. 5 BIFURCATION BEHAVIOR IN YIELDED ME:MBERS
The discontinuous behavior of yielded members under pure bending
has been studied from a phenomenological aspect by a number of authors17,18.
This section will provide a quantitative basis for the beh.aviol\ which will
allow the concepts of discontinuous yielding to be applied to structural

engineering situations. As the problem of bifurcation19
(or buckling) is
relevant to the later stages of this investigation, the following equations
will be derived for the cases of bending after and during axial deformation.
The behavior under pure bending can be obtained as a limiting case.
If a straight member subjected- to axial loading is given a
virtual lateral disturbance it will either return towards, or depart further
from, its original straight configuration. Under a static compres~ive load,
Which increases mpDotonioally from zero, the first of the above situations
will apply for ~~ initial range of loads. The first load at which the
member retains a deformed con£igura'~ion, after a lateral distu~bance ~as
been applied, is termed the bifurcation load. As the properties of the
yielded material are histo~ dependent, the value of the bifurcation load
will depend on the manner in which the disturbance is applied20•
When the disturbanoe is applied during an axial deformation in
crement, and is sufficiently small with respect to the increment to pre
vent any ~oading across the section, then the bifurcation load is called
the tangent modulus loado It is the lowest bound of the bifurcation load.
The highest. bound will occur when there is no increase in axial deformation
during the disturbance. The correspanding',load is called the reduced
modulus loadp Intermediate between these bounds are a continuous series
of bifurcation loads which are dependent on the relative properties of
axial and lateral strains20 •
Disturbances during the loading process are inevitable, and the
structure will naturally adopt the tangent modulus (lowest bound) load as

297.9
its bifurcation load.
-12-
On a first appra~sal it might appear that once a yield plane
had formed and its strain has increased to strain hardening (s ey ), there
would be no further axial strains in this plane until the entire region
under the yield stress has also reached the strain-hardening strain. How
ever, it will be recalled from the preceding section, that the reqttired
stresses to cause a new slip plane to ,form are i oy or more • Consequently,
there will be continual momentary in9~~ases of stress from oy. to i~.
From the free body diagram (Fig. 5) and ..~h~ stress-strain law (Fig. 1) it
is seen that these will cause strain': increases in previously formed yield
planes~· h(i:-~)~:;Ih(i.-~)4,it it 'is the first such event, or (i-~y if the
yield plane has been subjected to prior axial deformationso Thus the
earlier discussion of bifUrcation phenomena is valid for 8' member containing
yield planes, as increases in axial strain will continually be occurring in
all yield planes.
··206 THE FLEXURAL STIF)DSS OF AXIALLY ·YIELDED MEMBERS
The term MeI!lber will be used here to describe a plate element
or strip subjected to an axial stress which is uniform along its longest
dimension. The elements shown in Figs. 2,.' 4, aDd .s would thu~ meet this
restricted definition of a membero The term overall strain will be used
to denote the strain measured between the ends of the membero
When the overall axial strain E is between c= and s € , the pro-Y y
portion of the member which is Yielded is given by Eq 0 2. 3 as ¢. 1nitially,
297.9 -13-
bending in the (1 ~ ¢) elastic portions will follow the linear law
iJ= -"f'y
where M is the external moment and y the curvature. ~~ and 1yare
yield values and are defined by
M = 2(EI) 6Y b Y
rJ/ =3.&I y b Y
where (EI) is the elastic flexural stiffness of· the member and b is its
depth in the bending plane. Equation 2.5 will hold, provided that
M .-M < (1 ~ 1)
Y(2.8)
Such a restriction, however, is inconsequential to a bifurcation analysis.•
The behavior in the yielded portions, ¢, will depend on the
ratio, a, between the increment in bending strain and the increment in
axial strain (Fig. 8a). The axial strain increment is ~ax' and the total
change in bending strain across the section is 2a E 0 The neutral axisax
with respect to the initial strain. of s 6 y is located a distance f b from
the tensile edge (Fig. 8a). The value of ~ is given by
(], =! (1 - ~ )(- 2 a
It is apparent from Fig. 8a that the tangent modulus case will occur if
a <1, as ~here will then be no unloading of the section.

297.9 -14-
\'Jhen a ~ 1, the stress situation is given by Fig. 8b. This
representation is simplified to the extent that it assumed that no previous
unloading has occurred in the yield plane. The assumption ensures that a
true highest bound is obtained. It is seen that the increase in axial
stress, b() , is given by
~ - 0-. ~, [,1(\ + ~ y-_LI- ;j1-J(Jj-4 6j h
The reduced modulus condition (upper bound) occurs when ~o- = 0, as a
reduction in applied stress is not permitted, and from Eq. 2.10 this occurs
at
Jh + 1a :1....0.---_-
r Jh - 1
where the subscript, r, will refer to reduced modulus conditions (and, t,
to tangent modulus conditions ) • From Eq. 2. 9 the value of R- is
l (2.12)
The flexural stiffness in the yield plane will be denoted by
c(EI) where (EI) is its elastic value. By oalculating the ratio of the
internal moment to the curvature in Fig. 8b, the stiffness is found to be
Placing a =1 gives the tangent modulus stiffness, Ct' as
1ct = -h
and the value· of a from Eq. 2.11 gives or asr
(2.13)
(2.14)

297.9 -15-
(2.15)
(2.16)
Therefore the flexural stiffness of an axial yield plane will be bounded
by the following limits
ct ~ c <cr
~ 'c ~~J24 .
The value of h for ASTM A36 steel may be taken as h ~ 33, and so in
numerical form the limits are
1 2.9033' c ~33
2. 7 THE FORNATION OF FLEXURAL YIELD PLANES
If the bend'ing moments in the elastic regions (1 - ¢) exceed.~ +
the limits of Eq. 2.8, then bending yield planes will form. from ,the com-
pressive edge. Once the plane is formed, it will ~e in an unstable state,
as it will require a stress of ~ to exist but will be in a region where
the stresses are i~. The yield plane therefore progresses dynamically
out of the region wh~re the~ .stresses· are above the yield value. This
unstable, dynamic behavior has been observed and reported by a number of
writers7,17,18. The flexural yield .planes have a characteristic V~shape
and have been referred to as "yield wedges tf in the above references. Figure;,
9 is a copy of Fig. 14 ir. Miklowitz 's study.l7. Notice the wedge-shaped
yield' planes he recorded in the eccentric tension test.- To avoid a prolifer-
ation of terms, the name yield plane will be retained in this disserta-
tion when the wedge-shaped regions are being discussedo

297.9 -16-
The strains in the elastic (1 - ~) regions surrounding the yield
planes will continue to be distributed according to the law of plane sec-
tions. It will be assumed that the discontinuity caused by the formation
of a yield plane will occur independently of any plane sections behavior.
That is, the yield plane, when it initially forms, will be treated as an
introduced discontinuity. However, it will be assumed that any flexural
deformations which are then applied to the. already formed yield plane will
follow the plane sections law. This is reasonable as the elastic regions
surrounding each yield plane will tend to force this behavior to occur.
Clark, et aIlS have noted that strain measurements indicated this to be so,
once the amount of yielding ¢ was sufficient to ensure a random distribution
of slip planes within the strain gage length. A similar conclusion was
reached in tests conducted by the authors2~ Fig. 10 shows the strains re-
corded across the compression flange of steel beams subjected t? in-plane
and lateral bending. It is seen that the· strain distribu~ion in the~
yielded flanges become more closely linear as the strains inc7ease. (The
numbers against the strain distributions are identifying load numbers)o
The strain distributions at low loads appear to be composed or two straight
lines. This effect will be explained in the following paragraphs.
The requirement that plane sections remain pl~ne and the observed
wedge shape of the yield plane are relatedo Figure lla shows a section of
a member paltially traversed by a flexural yield plane. Dynamic effects
during the formation of the yield plane are neglected, and so it is aseumed
that the strain at the tip of the wedge is the yield strain, t-y. The

297.9 -17-
strain everywhere in the yield plane is at strain-hardening, s 6y • If the
wedge is assumed to be straight-sided, it is seen that the average strain
over the strip ABOD, whose base AD is the base of the wedge (Fig. 11a),
corresponds to the linear strain distribution shown in Fig. lIb. There-
fore, a straight sided wedge provides a linear strain distribution over a
length equal to the base of the wedge. The remainder of the member is
assumed to be unaffected by this introduced discontinuity9
It is observed17,18 that as bending progresses the wedges widen.
This also fits the plane sections hypothesis, for if the outer fiber (AD
in fig. lla) strain increases to (s + ~ s ) e-y it can be shown that the
wedge shape required to maintain a linear strain distribution is given by
v = x 0s + ~s - 1s+x<5s-1
where x and v are defined in Fig. 120 This figure also shows the form of
Eq. 2019 for fa of the same order as s. It is interesting to note that,
when a crack forms in an elastic body under uniform stress22, its shape can
be shown to be similar to that given in Figo 12 for the yield plane under
a predominantly uniform stress condition.
The strain distribution in Fig. 12 .resembles the experimental
ones in Fig. 11.. As the curvature becomes larger the effect < of the" change
in slope of the strain di.stribution, at the tin of the wedge, become~ less',.
obviousp At large strains the entire distribution may be closely assumed
to be linear.

297.9
20 8 THE FLEXURAL STIFFNESS OF A FLEXURAL YIELD PLANE
-18-
The stress distribution corresponding to the strains in Fig. 12
is shown in Figo 13. This, stress distribution is identical in form to
that obtained for axial yield planes (Fig. 8b) and therefore the analyses
of Section 2.6 will remain valid. During a bending process the axial
force may be assumed to renlain constant; consequently the reduced modulus
caJ.culations will apply 0 The flexural stiffness will be given by Cr(EI)
where or is defined by Eq. 2.15.
Check of the above arguments can be obtained from the predicted
location of the neutral axis as given by frb in Eq. 2.12. The predicted
location of the neutral axis (With respect to the compressive yield strain
level) is shown by an arrow in Fig. 10. There is seen to be close agree-
ment between theory and test in each ~ase. The only discrepancy arises
from the intersection points of the strain distributions occurring at a
strain higher than the compressive yield strain level. This is due to the
fact that some axial yield planes had formed before the flexural yield
planes a Thus the bending took place when 'the overall axial strains were
slightly greater than the yield value. The phenomenon shown in Figo ]_0
has been previously recorded and qualitatively discussed by Prasad and2l+
Galambos •
It is interesting to observe from li'ig. 13 that the distance f r b
also corresponds to the distance or the wedge tip from the tensile face, Be.
A,photograph of the yield lines at load number 13 in test HT-36 (see the
297.9 -19-
corresponding strain distribution which is plotted in Fig. 10) is shown
in Fig. 14. There it is possible to see the small number of axial yield
lines, which proceed all the way across the beam flange. The large
majority of the yield lines stop before reaching the far side of the
flange, Measurenlents show that the point at which these yield lines stop
is close to the prediction of Eqo 2 0 12.
A final point is that the penetration of the yield plane, as
measured by {2rb, is independent of the amount of bending that has occurred.
The yield planes· achieve their maximum penetration immediately after they
fornl. For the remainder of the deformation they widen and become more
frequent, but do not penetrate any further. This is confirmed by the
test results presented (Fig. 10 and 14) and also by visual observations
during testing 0
2Q9 OVEHALL FLEXURAL STIFFNESS
If the member is under uniform·axial load, an expression may be
developed for the average stiffness of a length containing yielded por
tions ¢. The yield plane sources can be assumed to be randomly distributed
and the most probable distribution is obtained from the condition of uni-
form isotropy, that is, the yield planes are uniformly distributed. Under
a uniform incremental moment, £1'/1, the most probable flexural stiffness,
Cp(EI), is given by
~M ~1'1 [¢ ]~..,=--+1-¢c"""EI) EI cp
(2.20)

297.9
or
-20-
(2. 21)
where c(EI) is the stiffness of the yiGJ~de<1 regions, ¢.
297.9 -21-
3. BEN/IS SII'JjpLY SlJPPORTED A}JD UNDER UNI}URJv! J·~011E~1T.,. ; .
301 IJ~'ll>?Ol)UG'l'IO}\J
In the absence of local and lateral-torsional buckling, the in-
plan~ deformation behavior of a beam can be predicted. Use is made of
known moment-curvature relations25 which provide a curvature distribution
that can be integrated to give the required deformation values26
. This
section will discuss the influence of local and lateral-torsional buckling
on such relationships. The following section will discuss the influence
of adjacent spans on the behavior of the uniform moment span.
3. 2 REV~"T OF PREVIOUS STUDIES
DiSC\lSsion in this chapter will be Ij~mited to the case shown
in Fig. 15. The beam is under a uniform moment Mwhich is apnlied in the
beam's rnajor principal plane. The end restraints- are such that their onJ.y
effect is to prevent a~ lateral deflections from occurring at either end
of the lYJember 0 Such an end restraint wi11. be termed a sinlple end restraint.
The elastic solution for the lateral buckling of such a beam is given by27
(3.1)
where (Elyy) is the flexural stiffness about the minor principal axis,
IY; (GKT
) is the St. Venant torsional stiffness, and Land d are the length
and depth of the member, respectively. FUkumoto28 has shown that an
additional term should be added to Eq. 3.1 if residual strains are present.

(3.6)
-22-
The equation is based on equilibrium requirements and can there-
fore be applied to yielded members, if the values of (Elyy) and (GKT) are
known. For an efficient design it should be required that
1·1 = IV~ = Zrrywhere p~ is the plastic moment, and Z is the plastic modulus. If Eq. 3.2
is substituted into Eq. 3.1, Kusuda et ~129 have shown that the contribution11' 2 GKTof the term (-r) ---- is negligibleo The buckling solution then reduces to
-I EIyy
!: • L .J E' •JA(d-j} 0.3)r y R:y E 2Z
where (E'lyy) is the effective lateral stiffness, and ry is the radius of
gyration about XY, and t the flange thickness.
Following the symbolism of Section 2.6
and introducing the slenderness factor term, A, where
). ~ 4 J6yr y 1r
the buckJ.ing solution beconles
A = ~ •JA{d-t)122
~llidte3 considered the tangent modulus lateral-torsional buckling
of a fully strain-hardened beam. In this case the value of C = Ct is found
from Eq. 2.14, and the buckling equation becomes

297.9
It was further assumed that A(d-t) = 2Z, and thus
-23-
) = ~ 0.8)
For AST1-i A36 steel with h = 33, and t:. y ::; o;./E = O.00122,the critical
unbraced length proposed by wbite is
~ = 15. 7, Y/ crit
A later apnlication29 of White's work used
J..!~2,.:c~~" := IB
'ry crit
to compensate for the neglect of the term A(d-t)/2Z.
(3.10)
2The studies in this paper are confined to compact sections
which will not local buckle until fully yielded30 • Therefore, Wl1ite's
solution (Eq. 308) gives the maximtun support spacing possible if a beam,
under uniform moment with simple end restraints, is required not to buckle
laterally until local buckling is also imminent. Thus the support spacing
given by Eq. 3.8 will allow an optimum arnourlt of deforrnation (deflection,
rotation) to be delivered by the beam before some form of buckling occurs.
Any closer spacing would not provide greater pre-buckl~ng deformations due
to the effect of local bucklingo Any wider spacing would result in earlier
lateral bucl{ling. Consequently braci.ng according to Eq. 3.8 will be con-
sidered optimum bracingo
3~~te's solution has sometimes been considered unduly conservative~
Hrn,.cver, this has arisen from the application of the results to conditions

297.9 -24-
where the end restraints were other than the simple restraints shown in
A major difficulty with the preceding solutions is that they
give no information on the problem of sub-optimum bracing. The extent
of this difficulty can be seen by considering that the elastic solution of
Eq. 3.6 gives L/ry = 1001(- to be the maximum support spacing which will
ensure that }~ will be obtained. h~ite's solution gives L/ry = 16 as
the maximum spacing to ensure that the point of local buckling is reached.
Consequently, there is no information available on the large and im-
portant range of L/ry between 16 and 100.
wbite's problem has also been studied by Lee32 , who found the
reduced modulus solution (Section 2.5), although the tangent modulus value
might be considered to be more realistic. Lee found that the maximum~.
osupport spacing was L/ry = 38; however, his solution is in error in the
calculation of the lateral bending stiffness. The correct reduced modulus
value can be obtained from Eq. 303, using C =or from Eqo 2018. This gives
L/ry = 15.6 x mo = 26. 7 (3.11)
............. _ r."~ _ .....__ ......... ...... .- .-r ...;.~ _.- ............. ~ .... _ -. -...t-.-. ....~ -.-._ .................. _ ......... _ ..... _ ....... ,... ... ..._-. ...~_ ....~ -.:- - .......... _ .... ~-..-. __ .....
* This solution neglects premature yielding and the recommended designvalues2,31 are less than thiso
o Equation 2.10 in Ref o 32 was calculated from Fig. 2011 in the samesource. The effective value of (Elyy) was obtained by a second momentof area method using I yy =Jx2dA, where xis measured from the YY axis.However, the use of jx2dA is only valid if x is measured from the pointof unloading (see Figo 8b in Chapter 2)0

297.9 -25-
Lee applies the results of his analysis directly to beam tests
in which the span under uniform moment was restrained by partially yielded
side spanso It will be seen in Section L~·that such a direct comparison
is not valid and can result in large differences,
3.3 PHEVIOUS ELASTO-PLASTIC STUDIES
The lateral-torsional buckling problem can also be approached
by considering a continuous stress-strain relationship (Fig, 1). In this
method the stress distribution corresponding to a given moment can be
calculated. This distribution is then used to evaluate the various sec~
33tion stiffness properties. Galambos assumed that the yielded portions
provided no stiffness contribution and thus obtained a tangent modulus
t · H 3h th t t ·solu 1ono orne assumed a he y1elded portions could unload
elastically; his solution is thus a reduced modulus (up~er bound) solution.
The respective stiffness values are substituted into Eq. 3.1. The member
is stable if the resulting critical moment is greater than the moment
Qhosen for the evaluation of the stiffness properties 0
Such an ap9roach is an excellent one for beam-columns and
slender beamso For these members the load-deformation ,characteristic will
be of the form shown in Fig~ 16a, and will allow well-conditioned solutions.
However, the characteristic for closely braced beanls will be represented
by Fig. l6b and in such a case any buckling condition near I~) will lead to
ill-conditioned solutions~

297.9 -26- '.
32ThE:) above tangent moc1l11.us approach l1as been ext'8nded bJr Lee
to t11e post-buclcling behavior of beams Cl It is reJevant to this naner to
note that the post-bucl<ling load-deforn~ation cur,Tes obtained show little
reduction in load ca'pacity. Thj4S behavior is to be expected for eJ_astic
bea.:ns J b:' ':. Lee's solution provides the first analytical evidence of its
occurrence in yielded beamso
The problem now to be solved is that of the sub-optimum per-
formance of a ~& steel beanl. It is assumed that the support spacing is
sufficiently close to at least ensure that the plastic moment, M , is. P
sensibly attained 9 The specif'ic problem is to deterrnine the deformation
at lihich a beam will bucl\:le laterally under a rtlornent JjIp.
It is custo~lary, in studying beam behavior, to consider the
beam rotation as the deformation parameter (Fig. 17). The rotations are
expressed in terms of the rotation capacity, R, where R is defined as
R =~ - 1 (3.12)Qp
where Q is the rotation and Qp is the rotation at ~~ if the beam behaved
elastically. Provided the moment is uniform, the rotations, curvatures,
and flange strains are related by
y ---r-rp~ av6- y
(3.13)
where the strains are measured at the lower flange face and hence con-
servatively estimate the condition over the entire flange. This
-27-
definition also iTflplies that }~ is attained once the 1'langes are fully
yielded. This will be very closely the case for wide flange sectionso
The vall1e of rotation capacity at optimum bracing is found by
putting ~ = s e to give the local buckling condition30 and then sub-a'1 y
stituting Eq. 3.13 into Eq. 3.12 to obtain
R t = S - 1op,I ',1-.
'l'he value of L/ry needed to ensure o';~iLlrm't;lX'()ta'l~:L(m(capacityis given by
~'tnite's solution (Eq. 3.8), and ttle s1.fb-.o}-'rt,i~i11J)Yl problem then reduces,
symbolicaJ..ly, to a determination of tlle relationship between H. and 1\
(or L/ry ) for 0 <R<Rapt. In these cases Gav is given by Eq. 2.2, and
Eq. 3.12 and 13 may be used to relate the rotation capacity to the pro
portion yielded, ¢, by
R = (s-l)~ (3.,15 )
It is noted that the sraall variation of ¢ (or cE- ) across the flangeav
thickness is neglected.
With the aid of computers, it is conceivable that a solution
could be obtained by numerically solving the three simultaneous differential
"equations of equilibrium~\. Such an approach is inefficient in this case,
as many of the effects involved have little influence on the final result.
Consequently, the model shown in Figo 18 will be used to represent the
out-or-plane behavior of a beam under in-plane moments.
Longitudinal pins are assumed at the center of the web and at
the junction between the web and tension flange. The deformed shape of~~~~~~~~~~~~~~-~~~-~~~~~~-~~--~~~~~~~~---~--~~~~--~~~~-~~~~~~-~-~~~~~-~~~~
~~ See i'or instance, Eq. 6.4, 5, and 6 in Ref. 27.

297.9 -28-
the beam will then be as shown by the dashed lines in F'ig. 18 . The ten-
sion flange will move very little laterally due to its much greater stiff-
ness relative to the cOlnpression flange.
Thl1S the beam is a lateral mechanism and vIill only remain in
its or~ginal position through the stiffness of the components of the
mechanism. Buckling will occur when the T-shaped compression element
CJllclcles lateral'ly or torsionally. It"or torsional l1uckling it would be
more cOYlservative to have a pin at the web-compression flange junction.
This was, in fact, the model used in the earlier local buckling studies4•
However, it is cor'servative for lateral buckling to include as much of
the web as 'Dossible, as the web contributes to the loaded area withou.t
adding significantly to the lateral flexural stiffness. The web stiffness
will be neglected in following analyses.
Lateral buckling of the compression T will be studied here.
Under simple end conditions (Fig'. 15) the buckling length is given by the
Euler equation
with Pec = Acry/2Using Eq. 3.5, this reduces to
(3.18)
where the value of r y contained in A is ry for the entire section. .
If Eq. 3.17 for the model is compared with Eq. 3.6 derived by
~fuite for the real section, it is seen that the only difference is that

297.9
the factor D is put equal to unity, where
n2 =~(d~tL22
-29-
(3.19)
tl10 flnnge area and A the web area, wherew
A2i~ = 2bt
A = (d-2t)ww
(3.20)
(3.21)
it can be shown that Aw\ + A2.+
n2 = I J o.~'l..t Aw+-i tl-I= · A~1
Hence, Eq. 3.17 will be correct for a section with zero web area. For
most real beams the value of D will vary between 1.08 and 1.17, and will
be conservatively taken as unity in the following derivations.
v~ite's solution disregarded the contribution of St. Venant's
torsion. This was similarly ignored in the model by specifying a condition
of pure lateral buckling.
Residual strains have also been neglected.
· d h" 1 t .. i d 19exceed one~th1r of t e Y2e d s ra1n 1n magn tu e •
Normally these do not
Their effect can
therefore be omitted, once the average strains are significantly greater
than the yield strain. In this respect, the problem is different from
most column buckling problems in which overall strains greater than the
yield strain do not occuro
Experimental justification of the effectiveness of the model can
be obtained from its final predictions and from its behavior at intermediate
stages. As an example of the latter, the deformed shape of the model can

297.9 -30-
be shown to be close to the deforrned shane measured in tests. Figure 19
shows the lateral deflections at midspan of a beam under uniform moment.
The tests are described further in Reference 21. It is seen from Fig. 19
that the tension flange remains alnlost stationary. This is expected, as
its stiffness is increased by the tensile axial stresses, whereas the
stiffness of the compression flange is reduced 6 The web deformations
follow the pattern predicted by the model, with the center of the web
showing a distinct outward bow. This effect can be seen in the dashed
lines in Fig. 18. It is also explained in Fig. 20, which represents a
typical observed deformed shape in the tests plotted in Fig. 19. Note
that the tension flange tends to twist rather than allow a hinge to form
at its junction with the web.
3£"-Winter ~ has used a similar model in which the flange was con-
sidered as an isolated column. His prima~ purpose was to determine the36
effective length of such beams (Section 4). Basler has also-used the
model for predicting the lateral buckling of plate girders.
3.5 APPLICATION OF THE ~DDEL TO BUCKLING BE~VIOR
The buclcling solution for the model is given by Eq. 30 17• The
problem is to deterlnine the value of the flexural stii'frless constant, c.
It was shown in Section 2.9 that the most probable value of c for a
partially yielded member can be obtained from Eq. 2.21. Therefore the
buckling equation becomes

297~9
Finally, the relation between ~ and R is obtained by using Eq. 3.15
I
-31-
(3.25)
The tangent and reduced modulus values of c (Eq. 2.14 and 15) will pro-
vide upner and lower bounds to this equation. In the ~angent modulus case,
the equation becomes
A - -.--.--_/--j i + yZ :r:>-I
.5- ,
Equation 3025 and the reduced modulus solution are plotted in Fig. 21
for a steel such as A36 with h = 33.
Equation 3.25 is for the most probable distribution of yield
planes. In a discussion of column behavior, Thlirlimann5 nointed out that
bounds can be placed on the distribution of yield planeso A lower bound
is obtained if all the yield planes are at the center of the column (Fig.
22a) and an upper bound if they are all at the ends (Fig. 22b). The
solution37 to these two cases is given in Fig. 23, where the tangent modulus
stiffness has been used. As would be expected, the difference between the
two bounds is greatest for low values of R, when there are relatively few .
yield planes. It is noted that the most probable distribution is closer to
the lower than the upper bound solution~
The most probable solutions will be used in the remainder of
the paper 0 Apart from the obvious logical reasons, their use is also
justified by visual observations of the uniforul distribution of yield lines
(see r~g. 3 and J.J" for insta.nce), and by the closeness between their

297.9
predictions and test results.
3.6 APl)LICATION OF THE l"fODEL TO NON-BUCI\LING BEHAVIOR________ Sf •
-32-
It is of considerable interest to study the actual, as o?posed
to the buckling, behavior of the beam. The actual behavior will result
from the presence of initial structural imperfections in the flange, and
these may be represented by assuming that the flange has an initially
deformed shape. Southwell has shown27 that the deformed shape of such a
member under axial load can be presented by
u =m P
1 - -pec
(3.26)
Here urn is the-mid-span deflection, Uo can be taken as the initial de-..'(.
flection at mid-span", P is the axial load, and Pee is the Euler buckling
load given by Eq. 3016 and therefore
ACJY.--2Pec c
Consider a flange fftee" which has been loaded to its maximum
load, A~/2. From Eq. 3.26 and .27, the midspan deflection is now given by
uou = ----m 1 - If /e
~~ Actually, Uo is the coefficient of the first term in the Fourier seriesrepresenting the initial d,eforrned t:1h,ayH) t The derivation of Eq 0 3. 26assumed that u is the dominant coof.f~1_ctC:1l1t in the series 0o . ,

297.9 -33-
Using a tangent modulus solution, c may be eliminated by Eq. 2.14, 2.23,
and 3.15, to give
u =m
1 - ').2 [ h-lJ(\ 1 + R-8-1
For illustrative purposes, the following typical values will be assumed:
Uo = 0 01", ;1 = 0 0 3, h :: 33, s = 110-50 Eq. 30 29 then becomes
u = .._ ...m 0.91
n.}" --.~) ,-, r74-'-)- \ • c.. f .i..l,o
(3.30)
\then Mp has just been reached (R=O), the value of u will be
061/0091" • Ooll". This change would be barely perceptible with the tran
sits (~O.Olf1) previously used to record lateral deflections in beam
tests24,38,39. However, once yielding has begun, the value of c in Eq.
3.26 will drop rapidly, and the rate of change of ~ will show a corre•.
~dingincreaseo This marked change in response can be seen in Fig. 24
where Eq. 3030 is plotted.
The figure ilJ..ustrates the reason for the frequently recorded
experimental observation24,38,39, that lateral buckling occurs in a beam
very soon after the plastic moment is reached 0 It is seen that what has
actually been recorded is the effect of a rapid decrease in flange stiff-
ness. This has caused the deflections due to structural imperfections to
be magnified to a measurable degreeo However, it must be emphasized that
there is no buckling involved, and even if the member were free of imper-
fections there would be no buckling condition corresponding to this

297.9 -34-
loading stage. A plastic hinge is not a post-buckling pllenomenon.
A second important point that follows from Fig. 24 is that
deflections of significant size can be expected in the post-elastic range
of a beam's behavior. It will be recalled from Section 2 that, in these
cirCtrnlstances, the majority of the yield planes which form will be bending
rather than axial yield planeso This can be seen in the photographs of
Figs. 3 and 140 An important difference in the two yield plane types is
the curvature jump (Section 2.8) that occurs with a bending yield line.
Hence, although the actual stiffness of a bending yield plane is c~(EI),
its effective stiffness will be lowered by the curvature jump effect.
The buckling solution in the previous section apnlies to axial
yield planes, and therefore represents an unrealistic cas~. In order to
retain the many advantages of a buckling solution while obtaining a realistic
solution, the previous model will be altered ~Y assuming that the yield
planes which form during axial defornmtion wil]~ l)OSnos~J the properties of
bending yield planes~
The effective stiffness of these lines depends on the amount of
curvature that occurs 0 This will be limite.d by the local buckling criterion
developed in Reference 30 0 The curvature jump and the J_oci11 buckling.'
eriterion are shown in Ii'ig. 250 The change in curvatu.re ',1tr~, nX1 ( F~J) j_s seen
to be (s-l) Cy!b(l- f)(1-2 (6)' and using Eq. 2.12, this is reduced to
(S-1)(J"h+l)2,\1J2J"hejh·-l) Ty (3031)

297.9 -35-
and using the reduced modulus stiffness (Eq. 2.15) the corresponding moment
is
~_s-_l__) _
Jh ( iFi - 1)(EI) t y
The use of cr(EI) assumes that' the stresses and strains remain
linearly related throughout the bending deformation of the yield plane.
It was sho·~;~n in Secti.on 2 0 3 tha t h may be assumed to be oonstant for11
strains less than 3'?;,r (:\')'0,' a consideration of the true rather than ten-
sile stress-strain diagranl). However tension yielding may occur on the
tensile face of the flange, and has been observed in tests (Fig. 2.10).
This effect becomes critical as h decreases, however calculations show
that for A36 and A441 beams the variations in both cr andfr due to ten
sile yielding are insignificant (less than 1%). The tendency is to reduce
both cr and ~r.
The effective stiffness, cb(EI), found by dividing the moment in
Eqo 3032 ~ the total curvature:
c - 2b - hi (Jh + 1)
A necessa~ requirement is that
or
and it can be seen that the inequality holds if h >1.

297.9 -36-
~
The stiffness cb{EI), is the value for a compact section2,~O.~
Modified values of cb can be calculated in an identical manner for sec
tions with greater local buckling resistance. The value of cb will approach
or as the local buckling strength increases.
It can be seen from Fig. 25 that the yield plane axial strain in
the }JJ..ane of the l-leb will be s ,e.y for only the mid-span reg~on. At the
end restraints where there is no moment, the strain in the plane of the web
wiJ.l not be more than the curvature junl~ value, that is
1 1-2r 1 1- s€- .. = - (1 - -)s62 y 1- 2 fh Y
(3.36 )
where Eq. 2.12 has been used to evaluate f. For a constant cb the de
flection of the member would be sinusoidal. The average axial strain in
a yield plane (when the local buckling criterion is reached) will be
! (1 - ! )se + ~ r1 -! (1 - ! ~ s 6-2· . Jh Y II l 2, Jh ~ y
l2 1 2· 1J~ -+ -(1- -)(1--) s6If 2 1\ J1i Y
Consequently, Eq. 3.15 must be amended to give
R =r~ + ! (1 - ,g) (1 - 1 )] (s -1 )¢Lir 2 . If vnand the buckling equation (Eq. 3.23) becomes
=

297.9
This may be written as
'>.;: 1
F h.R5-1
where F is found from Eq. 3.33 and 3.39 to be
[1 1 1) /~ 1 2 1 QF = - + - - - + -(1 - -) (1 - ~--)2 2IT h 1\' 2 1f vh
,r
-37-
(3.40)
The relation~hip between F and h is plot~ed, 'i?Fig~ 26. It is
seen that F is almost a constant for the p~actical r~nges of h (10 to 100).
Therefore an average value of 0.7 will be taken for F; Eq. 3.40 then becomes
The relationship between .1\ and hR/< 8-1) is plotted in Fig. 27. Note ttiat
this equati-on will not -be valid if ¢ >1, or from Eq. 3.38, if
R > 0.8 (s-l)r"
The experimental verification of Eq. 3.42 must be delayed until
certain addit~onal aspects of the problem are discussed in the following
section.
3.7 TORSIONAL BUCKLING
So far only lateral buckling o~ the T of the beam model has been
considered 0 The problem of torsional buckling has been investigated else~

29709 -38-
where30, where it has been shown that the torsional buckling solution is
equivalent to the flange local buckling solution for the section.
Reference 30 also postulates a regional criterion for flange
local buckling. The criterion can be broken down into a transverse criterion,
which has already been used in constructing Fig. 25, and a longitudinal
criterion. It has been shown elsewhere40 that the longitudinal criterion
is automatically satisfied in the cases under discussion. Plots of strain
distribution along the beams discussed earlier (Ref. 21) are shown in
Fig. 28. It ~s seen that the strains (which are for the load at which local
buckling occurred) substantiate the assumption that the longitudinal
criterion is automatically fulfilled.
308 VERY SHORT BEAMS
The optimum support spacing length for a compact section is ob-
tained from Eqs. 3.42 and 3.43 and is g~ven by
~ opt ~ 1 (3.44)J 1 + o.56h
and is equivalent to a rotation capacity of 0.8(s-1). However, it is of
some interest to consider the behavior of beams with support spacing
closer than /I opt.
For Aonly slightly less than 1\ t' the equilibrium requireop
ment between adjacent yield planes will force a more uniform distribution
of the strain in the plane of the web. Thus the correction factor intro-
duced in Eq. 3.37 will become unity. The buckling oondition will not al~er,

297.9 -39-
as the derivation of the buckling equation (Eq. 4.40) assumed that the
distribution of strains was uniform along the beam. Consequently, it may
be expected that a" relati'!lely lninor decrease in 1\ below It t will causeop
the rotation capacity to increase from 008(s-1) to (s-l).
Once the member is in the fully yielded condition any changes in
axial strain will not cause any further changes in material properties, as
new slip planes will not be created. Instability will now be the result
of the applied stresses increasing due to strain hardening. For R ) (s-l)
the stresses are given by
0- R - (s~l)- -I +uy h
The basic buckling equation (Eq. 3018) now becomes
(3.46)
The full relation between ~ and n/(s-I) for a steel with h • 33 (A36)
is shown in Fig. 29.
It is seen that rotation capacity inoreases sharply as ~ drops
below fl opt ' It must be emphasized, however, that such behavior is dependent
on the section having a local buckling strength greater than that required
for a compact section2,30. For instance, to obtain a rotation capacity of
2(s-1) would require a section that coald withstand strains of the order
of 2se without local bucklinge> FUrthermore, as the span becomes shortery
there will be a stronger tendency for yield planes to form as axial,
rather than bending, yield planes. In this case, bucl<:ling will occur under
the tangent modulus stiffness, ct (shown as a dashed line in Fig. 29).

297.9 -40-
For both the above reasons, the following discussion will be
limited to rotation capacities less than (5-1).
3.9 LATERAL DEFLECTIONS
In order to justi~ the earlier assumptions of a uniform dis-
tribution of bending yield planes along a member, it is necessa~ to show
that the lateral deflection required to ,form a bending yield plane is
small relative to the deflections present. The moment to cause a bending
yield plane is given by Eq. 2.4 and 2.8. The axial force present is
~A~, and therefore the necessary deflection, ui' is
(i-l)MY b bu. = ~ =(i-I) - = ---~ 1aA cry 6 . 120
Eccentricities of this order can be expected in a~ commercial section.
The deflections at local' buckling may similarly be estimated.
The relevant moment has already been calculated as Eq. 3.32. Hence the
deflection, ue' is
U = 2(8-1)e h ( h-l)
U = 2(s-1)e fh (Jh-l)
and for'A36 steel
(EI) ."t y
b6
10-
1aAoy
(3.48)
U = 2 x 10. S x E. = 0.129be 5.74 x 4074 6
From Eq~ 3.47, the ratio ue/ui is 15.4, which confirms the assumption that

297.9
bending yield lines will form along the entire membero
-41-
It is interesting to note that Eq. 3.48 predicts that the
lateral deflection at unloading is independent of the length of the mem
ber. General experimental verification of Eq. 3.48 must wait until the
subject of end restraints, other than the simple conditions of Figo 15,24
has been discussed. However, Prasad and Galambos have reported tests
in which the end restraints approached the assumed simple end restraints.
Each of the three tests in which local buckling occurred had different span
lengths and will thus provide a good check on the accuracy of Eq. 4.53.
The results are presented ~ the following Table.
Test L/r'y u/b at u/b from ErrorLocal Buckling Eq. 4.53
G12 30 0.12.5 0.129 + 3.2%
GIO 35 0112 .129 +1500%
G9 !~o .137 .129 - 5.8%--
There is seen to be good agreement between test and theory, and the
errors do not appear to be related to the span lengths.
An expression has been developed which related the rotation capacity,
R, of a beam to its unsupported length L. The end restraints are assumed
to be such that their only effect is to prevent lateral deflections. The
expression is

297.9
Lry
.J£;r.~=_ 1
tr J1 + 0.7 ~l
-b2-
where <;y' h, and s are previously defined material constants and ry is the
weak axis radius of gyration of the section. The above equation allows the
detennination of the maximum support spacing which will ensure that a
required .otation capacity is availableo The section is assumed to meet
the requirements for a compact section.
The concept of an opttmum support spacing has been advanced.
For most sections, local buckling will precipitate unloading if the
support spacing is less than the optimum value, and therefore no additional
rotation capacity above the optimum value will~be obtained.
The analytical model, from which Eq. 3.50 was derived, has been
shown to prOVide excellent agreement with experimental measurements. Tor-
sional buckling of the model has been shown to correspond to the local
buckling reqUirements derived by Haaijer4•
The following section will discuss the extension of the model
to cases where practical end restraints are presento

297.9 -43-
4. EFJ?ECTIVE LE~lGTHS
4.1 INTRODUCTION
In the preceding section the case of a beam with simple end
restraints subjected to a uniform moment was analyzed. A more realistic
situation occurs when the span under uniform moment is restrained by
adjacent spans which are only partially yielded. As the model used in
the preceding section behaves as a column, it is possible to apply the
effective length concept to the situation.
4.2 REVlm~ OF PREVIOU~ STtrnIES
The restraint provided by adjacent spans has previously led
to some difficulties in comparing test results and theory. In their
ap~lication of White's work3, Kusuda et a129 chose an effective factor
of k =0.80. The derivation of this value assumed that the adjacent
spans are loaded in the same manner as the critical span and are sub-
jected to the same amount of yielding. These are both very severe
assumptions and lead to an extremely conservative effective length estimate.
~~en the value of k = 0.8 is applied to-White 1s buckling length solu-
tion (Eq. 3.10), the estimate obtained for the optimum support spacing38
of a beam with side span restraint is 18/0.8ry =22.Sry • Test results
indicate that the actual value for A36 steel is between 35ry and 40ry.-~~~~------~-~~~-~-~~~~~-~-~--~~-~---~--~~~~~-~---~~-----~~--~--~-~-~----
* That is, the buckling length is 0.8 times the span length. The valueof k for Section 4 was, therefore, k =1.

297.9 -44-
In recognition of this fact, the result calculated by Kusuda et a129 was
increased by 56 per cent from 22.5ry to 35ry.
Some of the 56 per cent discrepancy is due to White's use of a
tangent modulus solution based on axial Yield planes, but by far the
largest part is due to the choice of the value for k. Lee, in a later32
work , even more conservatively assumed that the effective length factor
was unity.
38In a discussion of beam test results published by Lee and Galambos,
41Johnston suggested that the presented results indicated an effective
length factor of 0056. These same results were further examined by Prasad24
and Galambos , who found that k = 0.60 would better represent the behavior
or the test beams.
1~~3 THE EFFECTIVE LENGTH OF CRITICAL SPANS
This section will present an analytical derivation of the effective
length factor for a span under uniform moment and restrained by side-spans
under moment gradiento The beam model used in Section 3 will be retained.
As the final result will be a ratio of the properties of two spans, there
may be some favorable cancelling out of assumptions,
A somewhat similar approach has been used by Winter35 for deter-
mining the effective lengths of elastic beams.
The problem to be solved is shown in Fig. 3D. Each of the four
supports is a simple support (see definition in Section 302)0 No restraint

297.9 -45-
is assumed at the far ends of the adjacent spans, however there is no
difficulty in including such restraints in the following analysis.
The first problem is to determine the stiffness of the adjacent
spans. The axial stress in the flange-column will be taken as ¥), .~o;.. For
the ordinates shown in Figo 31, the axial force is therefore
(j = 1 - (1 ... f) xL 'cr: ' ' . ay
where fis the ratio of end moments.
(4.1)
(4.2)
The lateral flexural stiffness of the beam will be (EI ) foryy
M<r~, and it wiJ~ be Cb(EIyy) at Mp• It wiLl be assumed that the stiff-
ness, c(EI), between My and Mn varies sinusoidally in the manner shown in
Fig. 3Ib. Symbolically, this is represented by
l+Cb l-cb \\xc == • cos ---........
2 2 rr IJa
where t'La is the length of member between My and Mp, and is given by
t:= 1 - l/~I-f
where f is the shape factor, :f =Mp/l1y.
It will be assumed that the moment at the far end, (Mp, remains
elastic, therefore
(4.4)
or from Eq. 4.41 ). r; > f-l:
, £+1

297.9
The required stiffness can be defined as S~ where
-46-
s' = Laa -EI
(4.6)
and 6M and £Q are defined in Fig. 31c....;;;" t
A closed solution for Sa cannot
be obtained, and the lack of orthogonality makes other solutions involved.42
The Rayleigh-Ritz method will be used here, and the mechanics of the
solution are given in Reference 37. The final solution is given in Fig.
32, where S~ is shown as a function of the ratio of end moments, f, (or
the proportion, ~, of the length with M >M ) and the slenderness factory
A a of the adjacent span.
Fig. 32 allows the stiffness of an adjacent span to be deter-
mined if its length and bending moment diagram are known. Hence the beam
model for the span under uniform moment can be represented as a column
restrained at its ends by rotational springs (Fig. 33). The stiffness,
c(EI), of this column will depend on the rotation capacity whioh the span
is required to deliver, and is given by Eq. 2.23, 3015, and 3.38, as
(4.7)
The buckling solution for a column with rotational end restraints42
has been presented by Hoff • Figures 34a and b reproduce Hoff's graphical
results with a slight notational change. The effective length factor is k,
as previously defined. 'llhe factor J2 is defined as

29709 -47-
All the quantities in Eqo 408 are known, and hence Sl may be evaluatedo
The effective length factor, It, is then found from Fig. 340 Now, for the
design to be satisfactory, the value of k must be less than the value of
1\ 1 obtained by substituting the rotation capacity required into Eq. 3.42.
The design process is therefore iterative to the extent that it is necessary
to choose a support spacing and then check its adequacy 0
The above discussion applied to a particular but common case.
The procedure for other cases follows the same principles. If the adja-
cent spans are under uniform moment, their stiffness S may be found froma
the expression
( /fit a)2S =------a lr~a1----
tan1\~ a
., S = 3 at 'Ii",,- = 0a ...
, 27 4 4or from standard tabulations 0 Equation 09 and Fig 0 32 and 3 provide
all the information necessaryo
The following list summarized the design process:
lq Determine the required rotation capacity, R, from a
structural analysis
2. Determine the buckling slenderness factor, ~ l' from Eq.
3042, corresponding to the value of R from step NOt 1.
30 Determine the stiffness, 0, of the uniform moment span at
the required rotation capacity, R, using Eq. 407.
40 Determine the adjacent span stiffness, s~, from either
Figo 32 or Eqo 4090

- +.• - +
~ • ,.... ." ~ t
297.9 -48-
5- Determine JL for each adjacent span from the values of Sa
and c (Eq• 40 8) 0
6. Determine the effective length factor, k, using Fig. 34 and
the calcuJ~atedJL values.
7- Support spacing is adequate if k AZ A1 where /'I is the
slenderness factor between supportso
The above steps represent a design process. In analysis, it
would be necessary to find the value of R which gives k::1 =/J 1-
Sufficient information is now available to analyze the behavior
of a given beam o Thus the preceding theories can be checked by comparing
the predicted behavior of a beam with its test behavior 0 Three series38
of relevant experiments have been conducted; by Lee and Galambos , Prasad
24 21and Galambos , and by the authorso The last series of results have
been used in previous chapters to confirm the behavior of the beam model
at intermediate stageso It will be recalled that the agreement obtained
was satisfacto~~
However, tl18 mo<ieJ~ 1vas proposed basically to predict a rotation
capacity versus support spacing relationship and its behavior in this
report will now be examined. The loading arrangement used in the three
test series mentioned above, is shown in Fig~ 35. The rotation capacity
is measured to the point at which the load capacity has drop~ed to 95 per43
cent ,of its maximmn value (nominally 95 per cent of l~) ~ This definition

297.9 -49-
(4.10)
removes any subjective interpretations from the test results, and usually
corresponds to the region in which notj~ceable unloading has first occurred.
The values of the effective length factor are given in Table I
and were calculated for the loading in Fig. 35a, using the method described
in the preceding sub-section. For the case in Fig. 35b the calculations
were modified to account for the restraint of the outernlost spans, rather
than conservatively assuming that they had no effect. The value ofJl in
this case may be -shown to be
-i:L = 1- fl -S[2.c ]S L\ t
S1AO -eSwhere Sand C are the standard slope deflection coefficients which equal
It and 0.5, respectively, for zero axial load, and are defined by
- (EI) a - - (tl) nNA =S L L7.Ao + SC L (7f5Ae A8 b ftB '(4. ]..1)
and modified for an axial load of ACC/2. These coefficients are tabulated
in various references27
• Again, C(E~) is the stiffness of the fully
yielded spans, and Sao is the stiffness of the outermost span.
The results of the fourteen tests are given in Table 1 and are
also plotted in Fig. 36, together with the theoretioal prediction of Eq. 3.42.
405 DISCUSSION OF TEST HESULTS
The agreement between test results and theory shown in Fig. 36
is excellent 0 It should be noted that these results represent three

29709 -50-
different test series, two different testing arrangements, and two different
types of steel. It may be concluded that the results justify the use or the
beam model and of Eq. 3042 to predict the relation between support spacing
and rotation capacity.
Some interesting points can be obtained from the extreme tests.
Tests LB 15 and 11 (Figo 36a) were at and below the optimum bracing length,
and performed in the manner predicted for ve~ short beams with good local
buckling resistance (bit =1304 o.f o 17)0 However, test HT41 was also at
a support spacing less than optimum, but only delivered a rotation capacity
of ten per cent' more than optimum. -This test was for A441 steel and, from
Reference 30, the critical bit for this steel is 140 There is clearly
little reserve of local buckling strength, and the section now barely
passes the definition of a compact section. Hence it cannot be expected
to deliver much additional rotation capacity beyond the optimum valueo
At the other extreme are the two tests, HT36 and GIl, in which
each had a rotation capacity of 1.50 Both plotted much closer to the
tangent modulus prediction than Eq. 3.42. An additional fact is that no
local buckling was observed in test GIl. These results indicate that for
beams with rotation capacities below 002(s-1) the yielded proportion is so
small that lateral buckling causes u~loading without local buckling being
present. No adjustment will be proposed for this r~nge, as the absolute
difference between the predictions of Eqt 3025 and 3 0 L./.2 is small.

297.9
4.6 E~'ECTlVE LENGTH FACTORS
-51-
It can be seen from Table I that the effective length factors are
relatively insensitive to changes in span conditions. Therefore the pro-
cedure outlined in sub-section 4.4 becomes unnecessary once a representative
value of k is known for the particular loading case. For instance, k =0.54 applies to most cases represented by Figo 35a, and k =0.80 to the
case in ~JLg. 35b. Once k is known, the rotation capacity of a given span
can be calculated ~rectly from Eq. 3.42. It can also be observed that
the partially yielded spans are much stiffer than the fully yielded spans,
and therefore exert a controlling influence on the effective length values.
The presence of the effective lengt~phenomenon can also be30
shown experimentally. In the HT series beam tests , strain gages were
places at various locations on the compression flange under uniform moment.
These were located in such a manner that they could record the lateral
bending strains along the compression flangeo These lateral bending strains
are shown in Fig. 37.
There is seen to be a definite change in the sign of the bending
strains at points close to the inflection points predicted by the effective
length concepto Unfortunately, the strain gages were not spaced closely
enough to allow quantitative effective length measurements; however, the
values of k obtained from Fig. 37 do lie'between O~5 and Ot6.
41Now, it was mentioned in Section 5.2 that Johnston , and
24Galambos and Prasad observed k for the LB tests to be 0056 and 0 0 60,

w. ~ ~ 4.· ..
..
297.9 -52-
respectively. The latter workers also assumed a value of k = 1 for the G
tests (Table 1)0 These values are based on visual criteria and are there-
fore approximate. However, there is a definite tendency for the observed
values of k to be greater than the calculated values.
The cause of this tendency lies in the support movement which
occurred during $.11 tests. This movement will obviously relax the beam
restraints and therefore increase the effective length factors. The
lateral bracing system used in all the Table I tests is shown in ~~go
38. The support movement occurs as a result of elastic deformation of
the brace, slip'9age of the brace, and initial spaces between brace and
beam. The measured lateral deflections30 during test HT29 are shown in
}t~g. 39. It is seen that the support movement at unloading was of the
order of 0.10 inch.
It is also of interest to note from Fig. 39 that the total
lateral deflection at unloading is excellently predicted by modifying
the prediction of Eqo 3.49 (simple end restraint) by dividing by the
effective length factoro The figure also shows the much greater stiff-
ness of the partially yielded side spans o It can be seen that they act
as almost fixed ends with respect to the fully yielded center span. Again,
quantitative effective length measurements are difficQlt to obtain, but
the qualitative effect is apparent in the plotted deflectionso
If the value of k = 0 0 54 is used, the optimum bracing length,
for an A36 steel beam with partially elastic side spans, may be calculated

297.9
from Eq. 3. L~Lt as
L_ 1 {( ._1_= ...\ -{1-:1B:5 · J 0
000122 o. '54 37•
6
-53-
The current AISO specifications2 recormne~d a value of L/ry = 3'5, and Lee38 .
and Galambos indicated that L/ry = 40 best fitted their test results.
The presented theory thus confirms the --earlier empirical or experimental
estimates of the optimum support lengthso
However, it must be noted that the value given by Eq. 4.12 only
applies to those cases where the effective length factor of k ~ 0.54 is
applicable. The value of k = 0.50 is the most favorable value that can occur.
297.9 -54-
5. CONCLUSIONS
The in-plane behavior of beams and beam-columns is well known,
and requires no further discussion. The crucial question is the termina-
tion of in-plane behavior due to the effects of local and lateral deformations.
vfuereas these may not in themselves be catastrophic, the prediction of
the subsequent behavior of the member requires a consideration of their
effects.
An evaluation of the existing data on the effect of lateral and
local deflections leads to the conclusion that the problem cannot be
handled by using the simple stress-strain diagram previously found accept
able. Therefore a theo~ of discontinuous stress-straining is developed
and plaoed in a form which can be readily utilized. This new approach is
based on a recognition of the metallurgical processes that occur during
yielding or a metal.
Beams under uniform moment and with simple end-restraints are
studied. It is found that the post-elastic behavior o£ the beam can be
represented by a simple analyt,ical model. The support spacing required
is shown to be a function of the amount of rotation that the hinge is
required to deliver and an exPression is developed for this relationship.
The effect of va,rious real end conditiona on this relationship
is investigated 0 It is shown that the condition of the adjacent spans
has a marked effect on the behavior of the beam, A method for accounting
for this effect is presented o

297.9 -55-
The analyses given allow the beam braces to be positioned in
order to ensure that a given inelastic rotation can occur without a de--
crease in load capacity. The c~ncept of optimmn bracing design is intro-
duced. Bracing closer than optimum is not efficient, as local buckling
will prevent any additional rotation capacity being made available. The
present AISC Specification rule is close to the optimum spacing. Bracing
less than optimum will depend on the amount of deformation that the beam
is required to deliver.

297.9 -56-
6• ACKNO\'VTLEOOEMENTS
This study is part of a general investigation np]~astic
Design in High Strength Steel" currently being oarried out a Fritz
Engineering Laborato~, Department of Civil Engineering. Professor
W. J. Eney is Head of the Laborato~o The investigation is sponsored
jointly Qy the Welding Research Council, and the Department of the
Navy, with funds furnished by the American Institute of Steel
Construction, the American Iron and Steel Institute, Lehigh University
Institute of Research, the Bureau of Ships and the Bureau of Yards
and Docks. The Column Research Council acts in an adviso~ capaci~y.
}1iss Barbara \rJil1iams carefully typed the report and Mr. H.
Izquierdo and R. Weiss did the drawings.
} I

.297.9 -57-
7• NOI\'lENCLATURE
a ratio between increments in bending and axiaJ. strain
" ttat a corresponding to tangent modulus ·conditions ' ,
a nail corresponding to reduced modulus conditionsr
b breadth of an element
c ratio of yielded flexural stiffness to elastic flexural
stiffness
Cb
cp
ct
cr
'- d_..
f'
h
i
k
ry
s
si{...
~ s
t
u
u·l.
ue
"e" corresponding to bending conditions
most probable Irelt
ItCU corresponding to tangent modulus conditions
"e" corresponding to reduced modulus conditions
depth of member
shape factor
E/(strain-hardening modulus)
ratio of stress to form a slip plane to~
effective length factor
weak axis radius of gyration
str~in-hardening strain/~y
flexural strain~hardening parameter (Eq. 2.21)
change in s
flange thickness
lateral deflection
deflection to cause a bending y:Leld ~p1(rn:':7}
deflection at local buckling

297.9
E'IYI
~'
G
p
midspan deflection
initial deflection
area of cross-section
web area ( (d-2t)w)
total flange area (2bt)
slope deflection coefficient (Eq. 4.11)
section property (Eq. 3.19)
Young's modulus
effective lateral stiffness
constant (Eq. 3.41)
shear modulus
moment of inertia
weak axis moment of inertia
St. Venant torsion coefficient
specimen length
change in L
adjacent span length
moment
change :i.n M
moment at l~ fOl~' a tnem,ber AB
plastic nloment
yield moment
axial load
Euler buckling length with stiffness c(EI)
-58-

297.9
R
Ropt
S'a
Sao
s
rotation capacity
optimum rotation capacity (Eq. 3.14)
adjacent span stiffness
outer~pan stiffness
slope deflection coefficient (Eq~ 4.11)
-59-
xxyy
major principal axis
minor principal axis of beam
-I'\ .
ZZ longitudinal axis
Z plastic modulus
(:S ratio of distance of neutral axis of specimen from tensile
face to width of specimen
(3re. ax
ey
f av
8
8p
8AB
1\
1\1~a
fcr;:Ja-
corresponding to reduced modulus conditions
axial strain increment
yield strain <OY/E)
average flange strain
beanl rotation
elastic beam rotation at a moment of I~
moment at A for a member AB
slenderneas factor (Eq. 3.5)
buckling value
~ for an adjaoent span
moment ~atio
static yield stress
increase in ~

297.9 -60-
ratio of yielded to total length of a member under moment
gradient
proportion of an element that is yielded
curvature
yield curvature (Eq. 2.7)
elastic beam curvature at a m~ment of M. ~ p
stiffness ratio (Eq. 4.8)

297.9
8. FIGURES
...61-

297.9
cry I--_-----.....-.---,. --.--=::::;;;;;;;.._---~-
STRESS
STRAIN
Fig. 1 Idealized stress-strain d1agr~
-62-
(0)
(b)
Fig. 2 Element under stress

297.9-6.3-
Fig. 3a Compressive yield lines on abeam nange (lower ~lane:e)
Fig. 3b Tensile tield lines on a beam flange (upper flange)

297.9 -64-
Fig,._ 4a Compressive yield plane Fig. 4b Tensile Yield plane
STRAI N DIAGRAM
Ey
lLJZ....Jo..J
FREE BODY ~
~~ ~~~~---~~~
t SEy
STRAIN
Fig. 5 Free body and strain diagram for a yielded element

297.9 -65-
-- -.---LSTATIC YIELD
STRESS,oy
STRAIN
UPPER YIELDPOINT DYNAMIC YIELD
~-----"-------------II---- STRESS
Idealized curve shown dashed
STRESS
Fi~. 6 Portion of a real stress-strain diagram
[From Beedle and Tall]
1.20
200 400 6CX) 800 1000
STRAIN RATE (fLsec-l )
DYNAMICYIELD STRESS~TATI() 1.10YIELD SfRESS 1.05
I.OO"'---A.--'---L.-...-------Io
Fig. 7 Relation between dynamio and staticyield stresses and strain rate

297.9 -66-
~MEMBER
ct~~~
(0)
0;--
Deformationat E
o
I
<t~__~=--~4---__-L/3b10
t-CfoySTRESS
(b)
Fig. 8 strain and stress distribution inan axial yield plane
297.9
Initially zero}stress on this
face
[From Miklowitz]
Yield wedgesshown shaded
Fig. 9 Yield wedges in an ecoentric tension test

291.9i io Ey
I0.010
I0.020
I0.030
I0.040
-68-
( HT-29 )
:/1:12 #16
HT-31 )
#18
#9 :/I: 12
#10 #12
#14 #15
( HT-36 )
#13 #14 #15
( HT-37 )
#17 #22? ~y 0e20 °P40
LONGITUDINAL STRAIN IN COMPRESSION FLANGE AT
MIDSPAN
Fig. 10 Strain distribution in aseverely yielded member

297.9 -69-
s
yield plane
-101-I-.------.....---,.
M I
-ti---'---I-
8 C -101
t--EiEySTRAIN .OVERLENGTH AD or Be
(0) (b)
Fig. 11 Initial shape and strains in aflexural yield 'plane
x S+85s
s
t---E/Ey
STRAIN OVERLENGTH AD
-101I
Wedgeboundary
Initial wedgeboundary
Fig. 12 Yield 'plane shape and strain distributionafter bending
.297.9 -70-
0
M ME~( -) h
--L
---r hEB C
f3r bGi<hy
STRESS
Fig. 13 stress distribution in a flexuralyield plane
Fig. 14 Photograph of flexural yield lines

297.9 -71~
!. L1 'I
d M )M M
Y
,Fig. 15 statement of problem
LOAD(0)
DEFORMATION
LOADtI? (b)
DEFORMATIONFig. 16 Types of solution

297.9 -72-
MOMENTMp Mp
)
ROTATION8
Fig. 17 Definition of symbols
---"~~~~""'7L2'21 .L.-__--L- I---------~--
Shape
Fig. 18 Beam model

297.9
,o
,0.5
I1.0
I1.5
( HT-31 )
-73-
I2.0
Mp
#11 #13 #16 #18 #20
( HT-29 )
#21
#10 #12 #14 #16
( HT-36 )
( HT-37 )
#8 #15 #17 #19 #21 #30 #31
oI , I
O.E> 1.0 I.~
LATERAL DEFLECTION (in)
Fig. 19 Lateral defleotions of deformed beams
'.-2.0

Plastic hinge in web
Fig. 20 Observed deformed shapes
-74-

~=0.174, 0.296
297.9
.JLS-I
1.0
0.8
0.6
0.4
0.2
o
TangentModulus
Solution
0.2
h=33
ReducedModulusSolution
0.4 0.6 0.8\ _J:...:JEY1\- r: 1Ty
SLENDERNESS FACTOR
-75-
1.0
Fig. 21 Cpmparison of tangent and reducedmodulus solutions
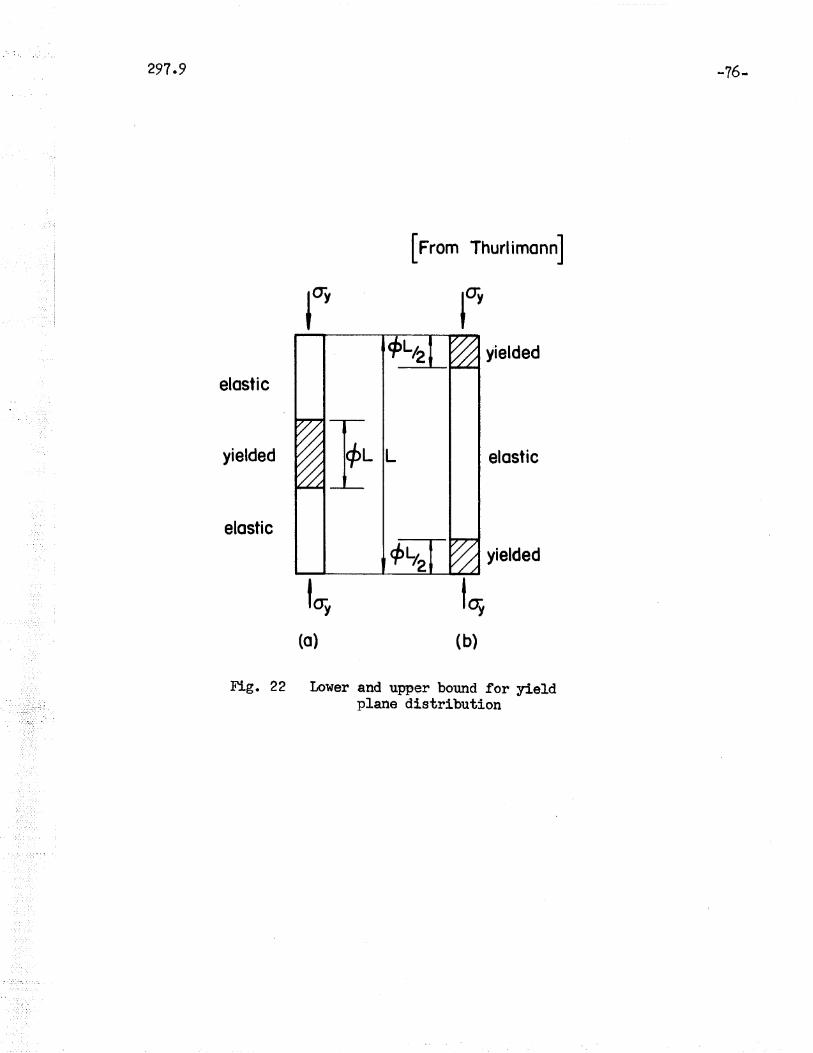
[From Thurlimann]
Fig. 22 Lower and upper bound for yieldplane distribution
elastic
yielded
elastic
toy(0)
toy(b)
yielded
elastic
yielded
-76-

297.9
1•.0 0.174
-77-
.1LS-I
0.8
0.6
0.4
0.2
o
LowerBoundDistribution(Ag. 22 b)
0.2
Tangent Modulush=33
Upper Bound Distribution(Fig.22 a)
0.4 0.6
'A=..b...JEYry .".
0.8 1.0
Fig. 23 Solution for three distributions ofyield lines

297.9 -78-
3
Initial Deflection
0.2 0.3 0.4 0.5um(in~
MIDSPAN DEFLECTION (LATERAL)
Fig. 24 Relation between in-plane rotation andlateral deflection
2
Yielded
1.0 0I
MI
05 : ElasticMp
I
o 0 0.1
ROTATIONCAPACITY
II I01 25
-101I I I
TENSION ~€kySTRAIN
Plane of----W-e-b-<t
2sI
COMPRESSION
Fig. 25 Effective stiffness in a bending yield line

297.9
F
1.0
0.8
04
0.2
-79-
Limit at h=(X)= 2-::.".=0.611
£ Assumed Value (0.7).--......~ .... -- -------
Eq.3.41
0 20 40 60 80 100
h= EI.ESH
Fig. 26 Rel~tion between 'F and h

0.2
297.9
60
50
40
..hB... 305-1
10
o 0.4 0.6
A=...b..·~Eyiry Tr
Fig. 27 Relation between ?t and hR/(S-l)
0.8
-80-
I~O

297.9
<tII
I~ -----r-=-
b=5.76"t
o
HT-29Load #15
HT-31Load #19
HT-36Load #15
HT-37
Load #22
-81-
Fig. 28 Strain distributions in criticalregions of compression flanges

297.9 -82-
1.2
0.4
2.0
h=33s= II. 5
~36)
~-Eq.3.42
Eq.3.46(subjected to
locQI bucklinglimitations)
,,,,,1.6 ,
Tangent ~Modulus,Buckling--\,
\\,\,,
ROTATIONCAPACITY
R5-1
0.8
o 0.2 0.4 0.6
A=..l.:.) Ey I
ry 7T
SUPPORT SPACING
0.8 1.0
Fig. 29 ~elation between rotation capacity andsupport spacing

297.9
L
-83-
(a)
BENDING MOMENTDIAGRAM
(b)
BEAM ELEVATION
~-----~------~------@... ... ... .-'- .. '- ...0 0 0 0C- o. a. c.C- o. Q. 0-J :::I J J
(/) en en tJ)
Q) Q) Q) Q)
0. Q. Q. c..E E E Een <is <is en
Fig. 30 Statement of ·problem
(c)BEAM PLAN
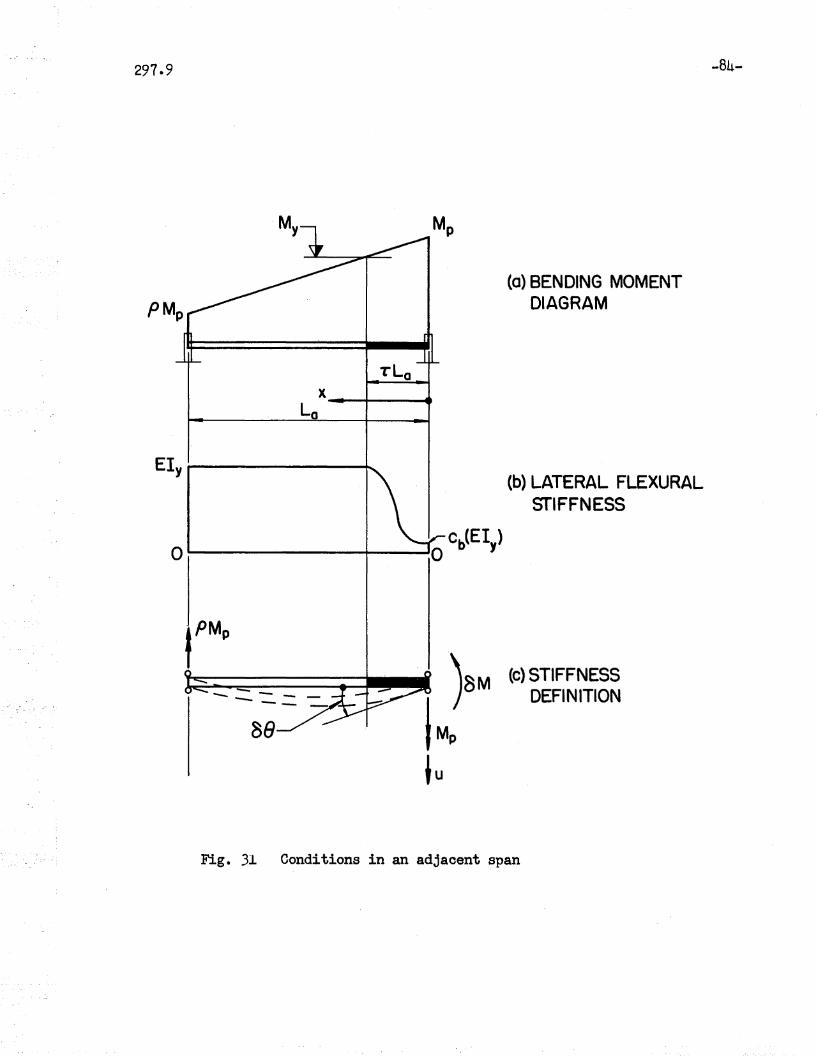
297.9 -84-
88
o""--------+---......
tPMp
1::::=:=======;:::i__. )8M
lMp
~u
(a) BENDING MOMENTDIAGRAM
(b) LATERAL FLEXURALSTIFFNESS
(c) STIFFNESSDEFINITION
Fig. 31 Conditions in an adjacent span

297.9 -85-
-0.5
1.0
1.00.600.40
.0.300.5
0.20
-1.0 0.06
RATIO OF PROPORTION OF. END 0~~~~~~~~~~~0.12 FLANGELEN~H
MOMENTS WITH M>My
P 0.\0 (f= ~4)
Fig. 32 Lateral stiffness 0.1' adjacent spans
Fig•.33 Representation of critical span

297.9
1.0
0.9
0.8
O. Ik=.550
o(0)
[from HOff]
-86-
COLUMN ST.I FFNESS/SUPPORT STI FFNESS
0.86....--..------------
0.82
0.78
0.74
EFFECTIVE 0.70LENGTH
RATIO 0.66
k 0.62
0.58
0.54
0.50 0.1 0.2 0.3 0.4 0.5 0.6 0.7 0.8 0.9 1.0
(b) nCOLUMN STIFFNESS/SUPPORT STIFFNESS
(Equal End Conditions)
Fig. 34 End restraint
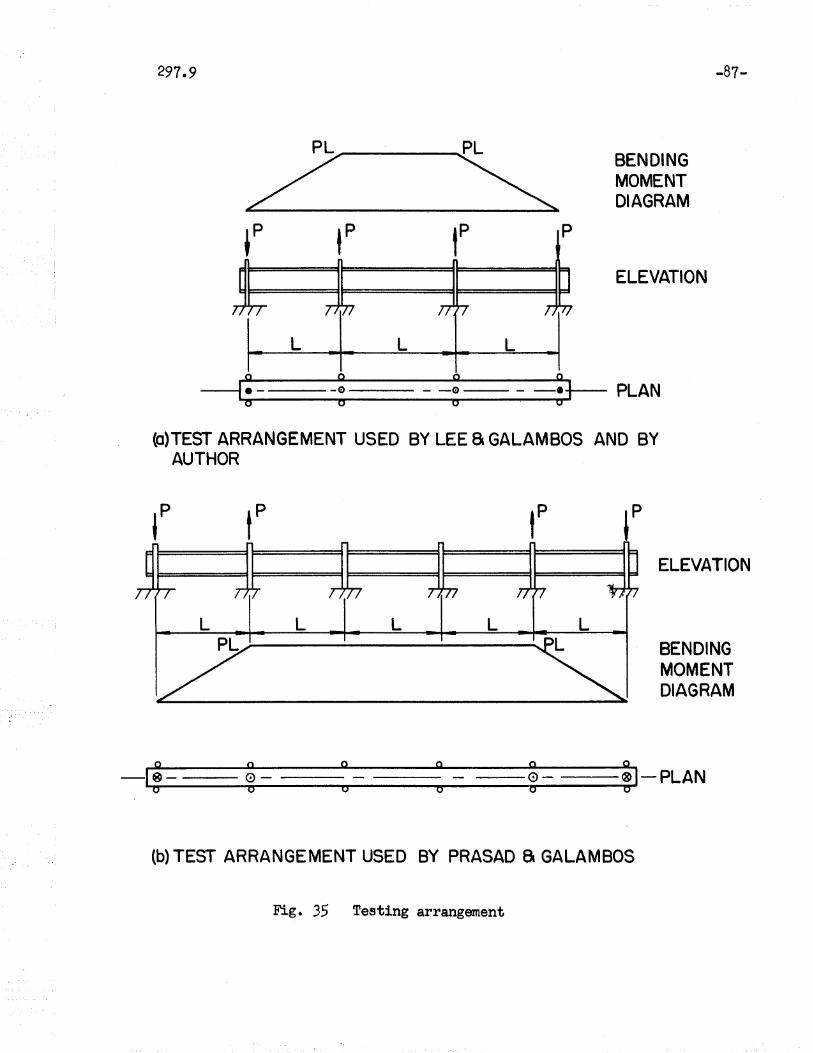
297.9
BENDINGMOMENTDIAGRAM
lP tP
tP p
ELEVATION
-81-
L L L
~:_- i- -;- ~ -v PLAN
(a)TEST ARRANGEMENT USED BY LEE a GALAMBOS AND BYAUTHOR
L L L
ELEVATION
BENDINGMOMENTDIAGRAM
-I~--~--:--:- -~--il-PLAN
(b) TEST ARRANGEMENT USED BY PRASAD a GALAMBOS
Fig. 35 Testing arrangement

297.9
1.2
'-'--Eq. 3.46
LBI5
-88-
RS-I
1.0
0.8 -
0.6
0.4
0.2
TangentModulus--......Eq.3.25
h=33
~-Predicted RelationshipEq.3.42
0 0.1' 0.2 0.3 0.4 0.5
A= kL.~~Y'ry -n-
Fig. 36a Results of LB & G Tests

291.9 -89-
Predicted Relationshi,pEq.3.42
j-Eq.3.46
eHT-41
0.50.4
h=45
0.2 0.3
A=..IsJ:.. ~ Ey'ry .".
0.1
TangentModulus--~
Eq.3.25
04
o
0.8
0.6
0.2
1.2
1.0
R5-1
Fig. 36b Results of HT Tests

297.9 -90-
HT-31Load# 18
HT-41Load# 12
-.010
E 0 1=-===;tI--.....-----.........--t:=+.010
-.010
+.020
+.010
E 0 1===.....--.....-------_....----==
-.020
+.020
oStrain Across Compression
Flange
-.010
+.010
E 0 I=.::====------....--------.......---e==
-.020
+.020
Fig. 37 Lateral bending strains across beamcompression flanges
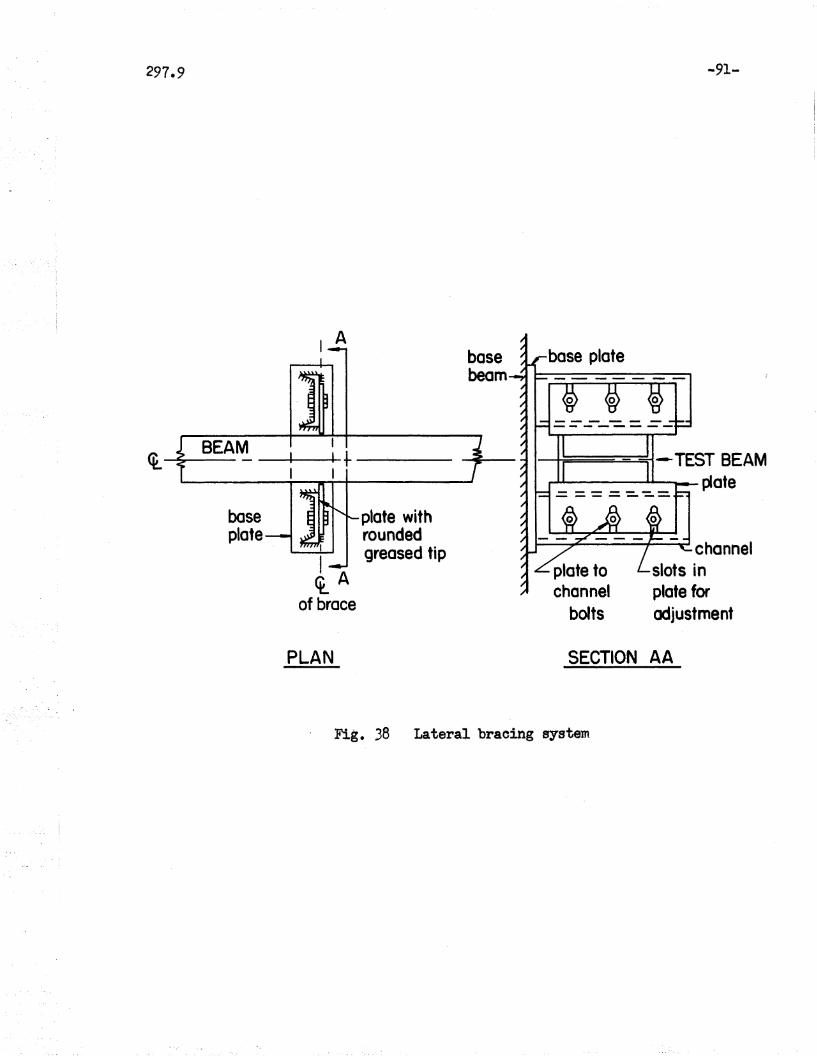
297.9 -91-
channelslots inplate foradjustment
I---+-========~~-- TEST BEAM&-'-6------1-.....-'"'--- plate
plate withrounded
_I- greased tipI A<t
of brace
I A
baseplate
BEAM--+--0+-
PLAN SECTION AA
Fig. 36 Lateral braoing system

297.9
1.2
LATERALDEFLECTIONI .0
ININCHES
LEGEND
LOAD # 8 : Mp just reachedLOAD # II :Middle of PlateauLOAD:#: 14: Unloading occurs
-92-
0.8
0.6
0.4
0.2
0.4
451~'
Support movementJL
PLAN.. LENGTH OF BEAM -
'Fig. 39 Lateral deflections during Test HT-29

297.9
9• REFERENCES
-93-
1. American Society for Testing MaterialsASTJYl ,STANDARDS, Part I, FERROUS METALS SPECIFICATIONS, ASTM,Philadelphia J (1964).
2. American Institute of Steel ConstructionSPECIFICATIONS FOR THE DESIGN, FABRICATION, A~ID ERECTION 0]'STRUCTURAL STEEL FOR BUILDINGS, AlSe, New York, (1963).
3. \fuite, MQ \rJ'oTHE LATERAL TORSIONAL BUCKLING OF YIELDED STRUCTURAL MEMBERS,Fritz Engo Lab. Report 20,5Eo8, Lehigh University, (1956)(Also Ph. Do Dissertation, University Microfilms, Ann Arbor,Michigan) 0
4. Haa1jer, GoPLATE BUCKLI~JG IN THE STRAIN-HARDENING RANGE, Proe., ASCE,83(EM 2), 1J. 212, (April 1957) 0 . .",
5. Thlirlimann, B.NE\'J ASPECTS CONCEllliING THE INELASTIC INSTABILITY OF STEELSTRUCTURES, Proco, ASCE, 86(ST 1), p. 99, (Janua~ 1960).
6. Chajes, At>, Britvec, So Jo, Winter, Go.EFFECTS OF COLD STRAINING ON STRUCTURAL STEEL PLATES, Proe.,ASeE, 89(ST ·2).9 p. 1, (April 1963) 0
7~ Donnell, Lo HoPLASTIC FLOW AS AN UNSTABLE PROCESS, J 0 Applo .. Mech., 9, p. A90,(June 1942) 0
80 Freudenthal, AoTHE INELASTIC BEHAVIOR OF ENGINEEHING IvfATERIALS AND STRUCTURES,JOM ·Wiley &·,·Sons, New York (19.50).
9~ Cohen, Mo (Edo)DISLOCATIONS IN ~1ETALS, Amo Insto Min~ & :f\ieto Engr., New York(195L~) 0
100 Nadai, AoTlIEORY OF FLO\v AND FRACTURE IN SOLIDS, Vol. 1, McGraw-Hill, NewYork (1961) 0
110 Thomas, To YoPLASTIC FLOW AND FRACTURE IN SOLIDS, Academic Press, New York(1961) 0
297.9 -94-
120 Lay, rJ1 0 GoTIlE STAtfIC LOAD-DEFD}1IvIATION BEHAVIOR OF PLANAli. STEEL STRUCTffi1ES,Chapter 1, Pho Do Dissertation, Lehigh University (1964), (Univ.1~1icrofilrns, Ann Arbor, Michigan) 0
13. Siebel, Eo, Schl-Jaigerer, So H
". DIE STHECllEl~ZE BEIlvI ZUGVERSUCH Ut~TER BESOI{DEHER BERUCKSICHTIGUlJGDES EINFLUSSES DER BEIJASTUNGSvJEISE UND DER IvlASCHINENFEDERUNG,Archivo r«r das Eisenhllttenwesen, 11, po 319.
14. Forscher, FoA THEORY Oli' TIlE YIELD POINT AND TRANSITION TEMPERATUHE OF MILDSTEEL, Jo Applo MechG' 23(2), p~ 219 (June 1956)0
15. Beedle, Lo So, & Tall, LoBASIC COLUMN STRENGTH, Proco J ASCE, 86(ST 7), p. 139 (July 1960).
16. Gozum, Ao To & Huber, A. WoI'·1ATERIAL PROPE11TIES, RESIDUAI.I STRESSES, AND COLIDYlN S'ffiENGTH,Fritz Engo Labo Report 220Ao33, Lehigh University (November 1958).
17. Miklowitz, JoTHE INITIATION AND PROPAGATION OF THE PLASTIC ZONE IN A TENSIONBAR OF 11ILD STEEL UNDER ECCENTRIC LOADING, J. Applo l-fech., 14,po A21 (March 1947)0
180 Clark, Mo Eo, Corteen, Ho To & Sidebottom, 00 MoINELASTIC BEHAVIOR OF DUCTILE l'1El1BERS mIDER DEAD LOADING, Univ 0
Ill. Btllletin, 426, University of Illinois (1954).
190 Tall, Lo, EdD-in-ChiefSTRUCTURAL STEEL DESIGN, Cho 9, Ronald Press, New York (1964).
20. Johnston, BoBUCKLING BEHAVIOR ABOVE THE TANGENT MODULUS LOAD, Proc., ASCE,87(E}1 6), p. 79 (December 196].) 0
210 Adams, Po ~'o, Lay, Mo Go and Galambos, To VoEXPERIl\1ENTS ON HIGH STRENGTH STEEL lvlEMBERS, Fritz Engrg. LabReport 27808 (In preparation) 0
22. Westergaard, H4 MoBEARING PRESSURE AND CRACKS, Trans., AS}\1E, 61, po A49 (1939) 0
g~, q TIJ:1aBad, J 0 8.r.. Galambos, T l) V0
TI-IE INl~{Jt:tJC}~ OJ? ADJACENT SPANS ON THE 110TATION CAPACITY OFBT!~A,J-iS.9 Fritz '~!>ngln.e~~l':Lng Lab Renort 205Ho12, I.lehigh University(<<-Tune 19()':') 0

29709
25. Lay, Mo Go and Gimsing, NoFURTHER gTUDI:b~S OF TIIE MOliJENT-THRUST-CURVATUHE RELATIONSHIP,Fritz Engrgo Lab Report 297.4, Lehigh University (January 1964).
Beedle, L. SoPLASTIC DESIGN OF STEEL FRAMES, Jolm \\liley Sf.. Sons, New York(1958) 0
, 270 Timoshenko, So &Gere j JoTHEORY OF ELASTIC STABILITY, McGraw-Hill, New York (1961).
FWGWnoto, Yo & Galambos, To VoINELASTIC LATERAL TORSIONAL BUCKLING oIi' BEAl'-l-COLUlvlNS, FritzEngo Lab Report 205Ao24, Lehigh University (1963) (Also Ph. D•
. Dissertation, University Microfilms, Ann Arbor, Michigan).
"Kusuda, To, Sarubbi, R~ &Thurlimann, BoTHE SPACING OF LATEHAL BRACING IN PLASTIC DESIGN, Fritz Eng.Lab Report 205Eoll, Lehigh University (1960).
30. J.Joy, I'~Io GI)
SOJYIE STID)IES OF FLANGE LOCATJ BUCKLING IN hlIDE FLANGE SECTIONS,Fritz Engrgo Lab Report 2970100
3!. Ileference 19, Chapter 7.
32. Lee, Go C~
INELASTIC LATERAL INSTABILITY OF BEAT.lIS AND THEIR BRACINGREQUIREMENTS, Pho D9 Dissertation, IJeh.:tg'h 'Univorsity (1960)University Microfilms, Ann Arbor, 1\'fichJgu,;1~
Galambos, Tl) VoINELASTIC LATEltAL BUCKLING OF BEAMS, pJ:loc 0' ASCE, 89( ST 5),p~ 217 (October 1963)0
340 Horne, Mo RoCRITICAL LOADING CONDITIONS IN ENGINEERING STRUCTURES, Ph. DoDissertation, Cambridge University, Cambridge (1950)0
350 lrl~nter, GoSTRENGTH OF SLENDER BEAMS, Transo J ASCE, 109, p~ 1321 (1944).
~o Basler, KoSTRENGTH OF PLATE GIRDERS IN BENDING, Proco, ASCE, 87(ST 7)(October 1961)0
3~o Reference 12, Appendices~

297.9 -96-
3$. Lee, Go C., &Galambos, To VoPOST-BUCKLING STflENGTfI OF w1:DE-FLANGE BEAl\1S, Proe., ASCE, 88 (EMl) ,p. 59 (February 1962)~
39. Lee, Go C., Ferrara, Ao Te &Galambos, T. VaEXPERIlvlENTS ON BRACED lrJIDE-FLANGE BEA.M:S, Fritz Eng. Lab Report205Ho6, Lehigh University (March,1963).
40. Reference 12, Chapter 40
4~o Johnston, Eo GoDISCUSSION OF RE~~HENCE 38, Proe., ASCE, 88(EM 4), p. 137(August 1.962) 0
41. Hoff, N. JoTHE ANALYSIS OF STRUCTURES, John ~\ril~y, New York (1956).
430 Galambos, To Vo & Lay, M. GoEND-MOFffiNT END-ROTATION CHARACTERISTICS FOR BEM1-COLm~S, FritzEng. Lab Report 205Ao35 (June 1962)0
4U. Livesly, R. & Chandler, D"STABILITY FUNCTIONS FOR STRUCTURAL FRAMEWORKS, ManchesterUniversity Press (19,6)9
4S~ Column Research CouncilGUmE TO DESIGN CRITERIA FOR IvLETAL COMPRESSION ~,1Er,j1BEr{S, CRe,Ann Arbor, Michigan (1960)0
46. Lee, Go Co, Ferrara, A. To & Galambos, T. V.EXPERII1ENTS ON BHACED vITDE-FLANGE BEAMS, Fritz Eng. Lab Report205H.6, Leatgh University (March 1963).