design guide image reduc>on of galaxies for spirits
TRANSCRIPT
RESEARCH POSTER PRESENTATION DESIGN © 2015
www.PosterPresentations.com
(—THIS SIDEBAR DOES NOT PRINT—) DES I G N G U I DE
This PowerPoint 2007 template produces a 36”x48” presentation poster. You can use it to create your research poster and save valuable time placing titles, subtitles, text, and graphics. We provide a series of online tutorials that will guide you through the poster design process and answer your poster production questions. To view our template tutorials, go online to PosterPresentations.com and click on HELP DESK. When you are ready to print your poster, go online to PosterPresentations.com Need assistance? Call us at 1.510.649.3001
QU ICK START
Zoom in and out As you work on your poster zoom in and out to the level that is more comfortable to you.
Go to VIEW > ZOOM.
Title, Authors, and Affiliations Start designing your poster by adding the title, the names of the authors, and the affiliated institutions. You can type or paste text into the provided boxes. The template will automatically adjust the size of your text to fit the title box. You can manually override this feature and change the size of your text. TIP: The font size of your title should be bigger than your name(s) and institution name(s).
Adding Logos / Seals Most often, logos are added on each side of the title. You can insert a logo by dragging and dropping it from your desktop, copy and paste or by going to INSERT > PICTURES. Logos taken from web sites are likely to be low quality when printed. Zoom it at 100% to see what the logo will look like on the final poster and make any necessary adjustments. TIP: See if your school’s logo is available on our free poster templates page.
Photographs / Graphics You can add images by dragging and dropping from your desktop, copy and paste, or by going to INSERT > PICTURES. Resize images proportionally by holding down the SHIFT key and dragging one of the corner handles. For a professional-looking poster, do not distort your images by enlarging them disproportionally.
Image Quality Check Zoom in and look at your images at 100% magnification. If they look good they will print well.
ORIGINAL DISTORTED
Cornerhandles
Good
prin
/ngqu
ality
Badprin/n
gqu
ality
QU ICK START ( con t . )
How to change the template color theme You can easily change the color theme of your poster by going to the DESIGN menu, click on COLORS, and choose the color theme of your choice. You can also create your own color theme. You can also manually change the color of your background by going to VIEW > SLIDE MASTER. After you finish working on the master be sure to go to VIEW > NORMAL to continue working on your poster.
How to add Text The template comes with a number of pre-formatted placeholders for headers and text blocks. You can add more blocks by copying and pasting the existing ones or by adding a text box from the HOME menu.
Text size
Adjust the size of your text based on how much content you have to present. The default template text offers a good starting point. Follow the conference requirements.
How to add Tables To add a table from scratch go to the INSERT menu and click on TABLE. A drop-down box will help you select rows and columns.
You can also copy and a paste a table from Word or another PowerPoint document. A pasted table may need to be re-formatted by RIGHT-CLICK > FORMAT SHAPE, TEXT BOX, Margins.
Graphs / Charts You can simply copy and paste charts and graphs from Excel or Word. Some reformatting may be required depending on how the original document has been created.
How to change the column configuration RIGHT-CLICK on the poster background and select LAYOUT to see the column options available for this template. The poster columns can also be customized on the Master. VIEW > MASTER.
How to remove the info bars
If you are working in PowerPoint for Windows and have finished your poster, save as PDF and the bars will not be included. You can also delete them by going to VIEW > MASTER. On the Mac adjust the Page-Setup to match the Page-Setup in PowerPoint before you create a PDF. You can also delete them from the Slide Master.
Save your work Save your template as a PowerPoint document. For printing, save as PowerPoint or “Print-quality” PDF.
Print your poster When you are ready to have your poster printed go online to PosterPresentations.com and click on the “Order Your Poster” button. Choose the poster type the best suits your needs and submit your order. If you submit a PowerPoint document you will be receiving a PDF proof for your approval prior to printing. If your order is placed and paid for before noon, Pacific, Monday through Friday, your order will ship out that same day. Next day, Second day, Third day, and Free Ground services are offered. Go to PosterPresentations.com for more information.
Student discounts are available on our Facebook page. Go to PosterPresentations.com and click on the FB icon.
©2015PosterPresenta/ons.com2117FourthStreet,[email protected]
The Spitzer Infrared Intensive Transients Survey (SPIRITS) project aims to take a mid-infrared (IR) census of luminous transient stars in a large sample of local galaxies. Data is collected from the Spitzer space telescope as well as ground-based telescopes. Studying these galaxies in the mid-IR has allowed astronomers to discover events such as Luminous Red Novae and Intermediate Luminosity Red Transients, as can be seen on the high characteristic timescale of Figure 1 [1]. In order to investigate these phenomena it is necessary to reduce raw images into images of these galaxies that are more clear and allow for higher resolution of potential transient events.
Introduc>on
Goals
Once assigned galaxies, the .fits image data is found in groups of around 360 images for each galaxy. Each image of the 360 contains 3 pictures as seen in the figure. They are split according to the filter in which the image was taken: J, H, or Ks. The galaxies and other interesting objects are not visible in single pictures do to their faintness against the background sky. The images run through a python script which creates a mask that ignores pixels that are “hot”, or those that seem to be errors from the telescopes. Once these have been fixed, the raw image file, which looks like Figure 2 to the right, is run through code that splits it into three separate pictures based on filter. This is iterated for each of the ~360 images. Now, since each image is taken of a different area of the sky, the next step is to coarsely align them so that they are generally overlapping. Throughout these steps the images are periodically examined using the image software ds9 to read the .fits files. Anomalous images are sought out and deleted from the bunch due to containing marks that cause issues such as streaky images, which are caused by the telescope taking images during a time in which it is adjusting its positioning to take pictures of a different section of the sky. Now, since we want a larger contrast between bright objects and background noise, the images are fed into a program that outputs a file for the average background of each filter. These output averages can then be divided out of the original images depending on filter. This leaves us with images in which the galaxy and stars are much easier to resolve. The images can then be finely aligned. This process is done by choosing an area of reference on an image that contains the galaxy as well as a bright foreground star for reference. This allows the software to detect this same region in other images and further align them very accurately. If these images do not turn out satisfactory, the pre-alignment images can be examined and the problematic images can be targeted and removed and the remaining pictures realigned. If the resulting image is clear and of high quality it can be uploaded to software that recognizes galactic locations based on an image and outputs galactic coordinates which we can then append to the final images we created. These are important to the research for record keeping, so they must be included in the finalized files. The final necessary step is to perform analysis on the limiting magnitude. The 2MASS point sources catalog can be used to detect infrared sources. Imexamine software is used to collect data from around these point sources such as their apparent magnitudes, full width at half maximum, and standard deviation. These values are used to calculate the limiting visual magnitude. This process is performed a few times for each filter and the results are averaged and the uncertainty is calculated. This data is then appended to the image files for use by other team members on the project once the files are uploaded to the SPIRITS database of completed galactic image reductions. The 2MASS point source analysis can be seen in Figure 5 to the right.
Methods
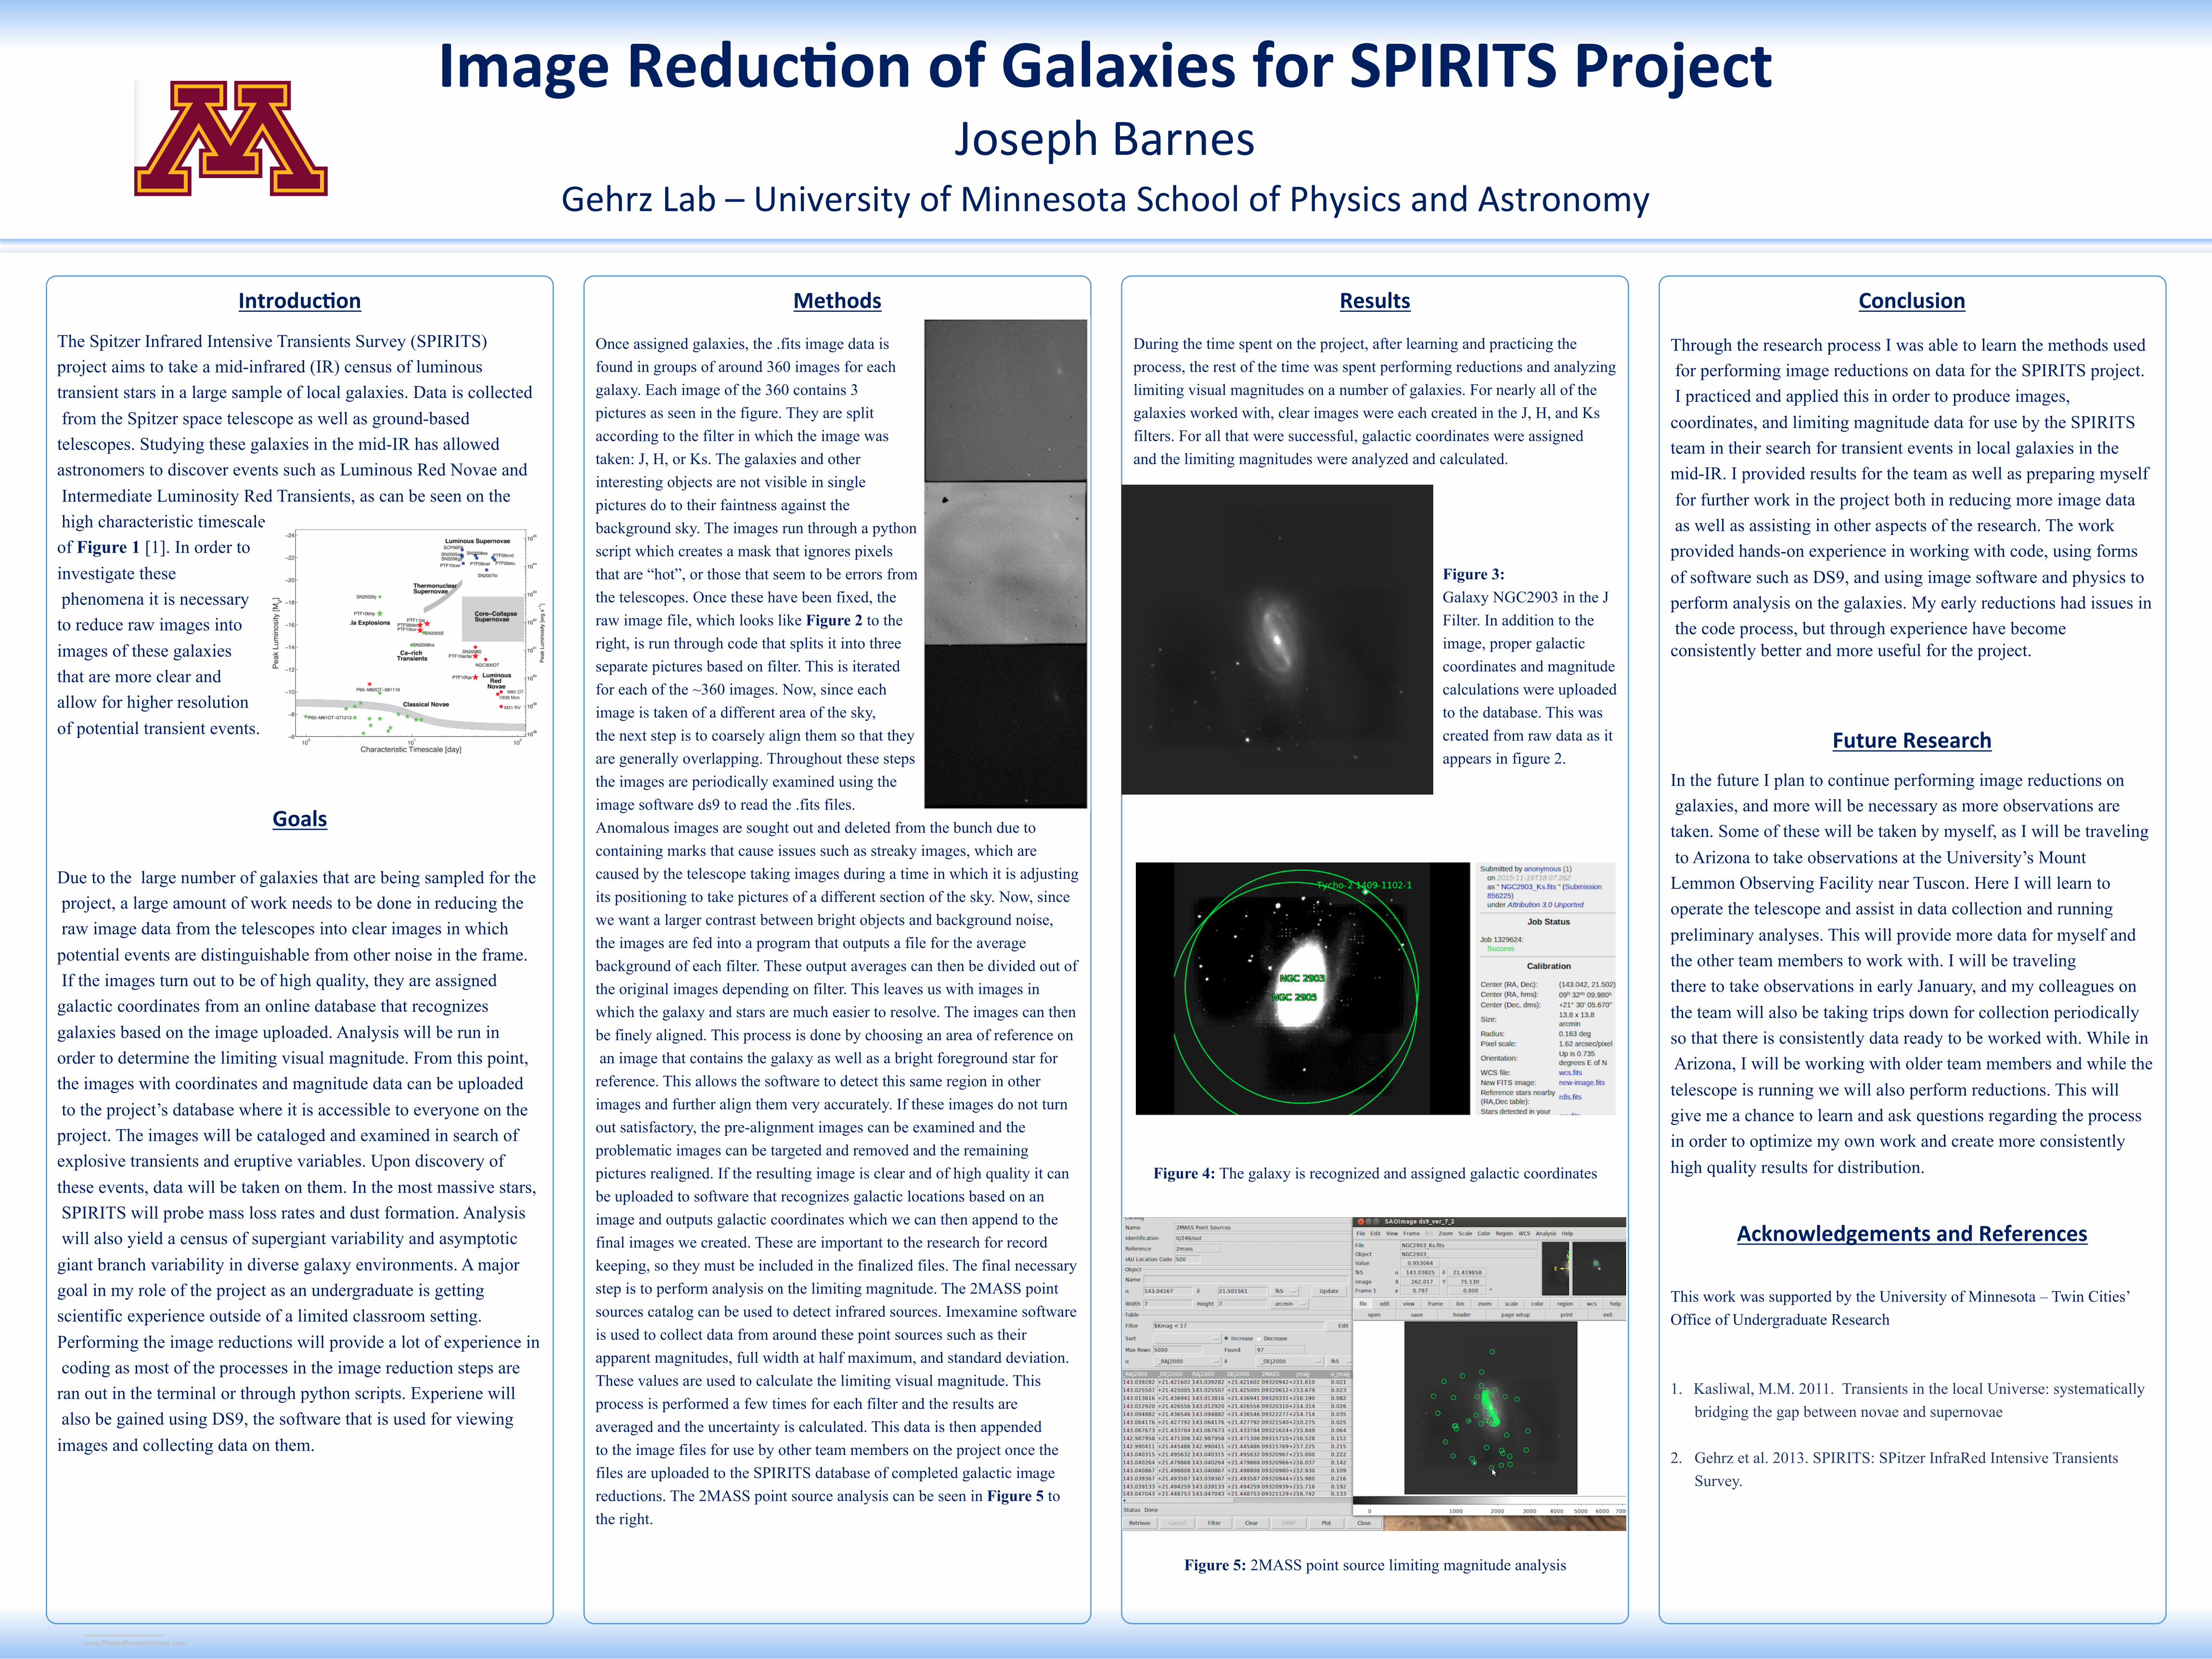
During the time spent on the project, after learning and practicing the process, the rest of the time was spent performing reductions and analyzing limiting visual magnitudes on a number of galaxies. For nearly all of the galaxies worked with, clear images were each created in the J, H, and Ks filters. For all that were successful, galactic coordinates were assigned and the limiting magnitudes were analyzed and calculated.
Figure 3: Galaxy NGC2903 in the J Filter. In addition to the image, proper galactic coordinates and magnitude calculations were uploaded to the database. This was created from raw data as it appears in figure 2.
Figure 4: The galaxy is recognized and assigned galactic coordinates
Figure 5: 2MASS point source limiting magnitude analysis .
Results Conclusion
Through the research process I was able to learn the methods used for performing image reductions on data for the SPIRITS project. I practiced and applied this in order to produce images, coordinates, and limiting magnitude data for use by the SPIRITS team in their search for transient events in local galaxies in the mid-IR. I provided results for the team as well as preparing myself for further work in the project both in reducing more image data as well as assisting in other aspects of the research. The work provided hands-on experience in working with code, using forms of software such as DS9, and using image software and physics to perform analysis on the galaxies. My early reductions had issues in the code process, but through experience have become consistently better and more useful for the project.
FutureResearch
In the future I plan to continue performing image reductions on galaxies, and more will be necessary as more observations are taken. Some of these will be taken by myself, as I will be traveling to Arizona to take observations at the University’s Mount Lemmon Observing Facility near Tuscon. Here I will learn to operate the telescope and assist in data collection and running preliminary analyses. This will provide more data for myself and the other team members to work with. I will be traveling there to take observations in early January, and my colleagues on the team will also be taking trips down for collection periodically so that there is consistently data ready to be worked with. While in Arizona, I will be working with older team members and while the telescope is running we will also perform reductions. This will give me a chance to learn and ask questions regarding the process in order to optimize my own work and create more consistently high quality results for distribution.
AcknowledgementsandReferences
This work was supported by the University of Minnesota – Twin Cities’ Office of Undergraduate Research 1. Kasliwal, M.M. 2011. Transients in the local Universe: systematically bridging the gap between novae and supernovae 2. Gehrz et al. 2013. SPIRITS: SPitzer InfraRed Intensive Transients Survey.
Due to the large number of galaxies that are being sampled for the project, a large amount of work needs to be done in reducing the raw image data from the telescopes into clear images in which potential events are distinguishable from other noise in the frame. If the images turn out to be of high quality, they are assigned galactic coordinates from an online database that recognizes galaxies based on the image uploaded. Analysis will be run in order to determine the limiting visual magnitude. From this point, the images with coordinates and magnitude data can be uploaded to the project’s database where it is accessible to everyone on the project. The images will be cataloged and examined in search of explosive transients and eruptive variables. Upon discovery of these events, data will be taken on them. In the most massive stars, SPIRITS will probe mass loss rates and dust formation. Analysis will also yield a census of supergiant variability and asymptotic giant branch variability in diverse galaxy environments. A major goal in my role of the project as an undergraduate is getting scientific experience outside of a limited classroom setting. Performing the image reductions will provide a lot of experience in coding as most of the processes in the image reduction steps are ran out in the terminal or through python scripts. Experiene will also be gained using DS9, the software that is used for viewing images and collecting data on them.
GehrzLab–UniversityofMinnesotaSchoolofPhysicsandAstronomyJosephBarnes
ImageReduc>onofGalaxiesforSPIRITSProject