design for high voltage control and monitoring system for ...hep placement... · industrial...
TRANSCRIPT

Industrial Placement Project Report
Design for High Voltage Control and Monitoring System for CMS Endcap
Electromagnetic Calorimeter
Author: Funai Xing
Supervisors:
Dr. Helen Heath (Bristol)
Dr. Claire Shepherd-Themistocleous (RAL)
May, 2005
H. H. Wills Physics laboratory University of Bristol

Abstract A design based on the lead-tungstate (PbWO4) scintillating crystal and Vacuum Phototriode (VPT) was chosen for the CMS Endcap Electromagnetic Calorimeter. The goal of this project is to design and construct a remote software Control and Monitoring system for the VPT High Voltages. This system is designed using PVSS and a CERN software Framework. The core of the system is now implemented, it has been tested with actual hardware and met the operation requirements. Additional components are under construction and the integration of the final version into the CMS central system is planned in a near future.
Note: this report contains information prior to June, 2005. Since then some modifications have been made to the system and certain information (mainly in the technical section) contained in this report is out of date.
For more up-to-date information on the system, please refer to the <CMS Endcap High Voltage PVSS System User’s Manual>. It can be found at RAL at network drive CMSHVtests$ on 'hepnts3' or from ECAL Crystal Endcap Homepage at http://cmsdoc.cern.ch/~ecendcap/
- 1 -

Contents 1. Introduction 4
2. Background 5
2.1. Detector Control System 5
2.2. HV System Hardware 6
2.3. Software 7
2.3.1 PVSS II 8
2.3.2 JCOP Framework 9
2.3.3 General 10
3. Implementation Process 10
3.1 Project Creation. 10
3.2 Database Device Creation 11
3.3 Device Aliases 14
3.4 Finite State Machines 16
3.4.1 Introduction to Experimental Control hierarchy Architecture 16
3.4.2 Implementation 17
3.5 Domain Specific Panel designs 23
3.5.1 General 23
3.5.2 FwCaenChannelStd 24
3.5.3 QuadrantNode 26
3.5.4 DCSNode 28
3.5.5 The Use of Aliases 30
3.6 Control Scripts 30
3.7 Archive and Runtime Database 31
3.8 Device connection 32
4. Future Plans 34
5. Operation Instruction 36
6. Hardware Test Results 37
7. Discussion 39
7.1.Operation 39
7.2. Development 40
8. Summary 41
- 2 -

Appendices A – Tables 42
Appendices B – Figures 47
Appendices C – Scripts 49
Glossary 54
References 56
- 3 -

Chapter 1. Introduction
Chapter 1. Introduction CMS: The Compact Muon Solenoid (CMS) experiment is one of the two general-purpose detectors designed to study the physics of proton-proton collisions, with a centre-of-mass energy of 14TeV and a range of luminosities up to 1034cm-2s-1, at the Large Hadron Collider (LHC) currently under construction at CERN [Ref 4]. Its main physics motivations include:
• Understanding the origin of the particle masses by searching for Higgs bosons; • The study of new physics beyond the standard model (e.g. MSSM, SUSY); • The study of heavy ion collisions.
The detector (Figure 1.1) is composed of a cylindrical barrel closed by two endcap discs. It consists of an inner tracking system, an electromagnetic calorimeter, a hadron calorimeter and a 4T superconducting solenoid covered with a multilayer muon system.
Figure 1.1 CMS Detector [Ref 16]
ECAL: The electromagnetic calorimeter (ECAL) is designed to perform the precise measurement of the energy and position of electrons and photons. The calorimeter is composed of over 80,000 scintillating lead tungstate (PbWO4) crystals, whose scintillating light is collected by silicon Avalanche Photodiodes (APDs) in the barrel region and by Vacuum Phototriodes (VPTs) in the Endcap Region. VPT: The photodetectors for the ECAL endcaps are required to operate in a uniform 4T axial magnetic field, to withstand radiation exposures of up to 5kGy/year [Ref 4] and must offer an adequate signal-to-noise ratio with the low light yield of PbW04 crystals. The APDs are insufficiently radiation-hard for use over the whole endcap ECAL region and hence Vacuum Phototriodes (VPTs) have been chosen for their radiation tolerance.
- 4 -

Chapter 2. Background – 2.1 Detector Control System
Figure 1.2 VPT internal structure [Ref17]
The CMS group in Rutherford Appleton laboratory is responsible for the design, construction and operation of the endcap sections of electromagnetic calorimeter, including the VPT High Voltage system. [Ref 7] A VPT is illustrated in Figure 1.2. These VPTs require high voltages for their operation. Typically, the photocathode is grounded, the anode is operated at 800V and the dynode at 600V. Due to the hostile operation environment, these high voltages must be operated remotely via a software control and monitoring system and the design and construction of this system is the goal of this project. The system is designed using commercial software PVSS and a CERN custom software Framework specifically developed for the LHC experiments. Chapter 2. Background The High Voltage (HV) Control and Monitoring System is an integrated part of the CMS Detector Control System. 2.1 Detector Control System (DCS): The Detector Control System, also known as the “slow control system”, is responsible for the monitoring of the detector hardware status, the environmental parameters, as well as the detector safety system which will generate alarms and hardwired interlocks in situations which could lead to hardware damage [Ref 5]. Its hardware is based PLC, field buses etc., and its software is based on PVSS and JCOP Framework. The DCS does not directly involve in the physics data taking process, nonetheless the Data Acquisition system (DAQ) rely on a robust DCS to ensure the physics data taking process can be performed smoothly, reliably and safely. ECAL DCS: The ECAL system is separated into four sections of sub-detectors: BP, BM, EP, EM, which stand for “Barrel Plus/Minus” and “Endcap Plus/Minus”. Each section has a same structure of seven sub-systems: HV, LV, Precision Temperature Monitoring (PTM), Humidity Monitoring (HM), Cooling, Laser Monitoring and ECAL Safety System (ESS). [Ref 21]
- 5 -

Chapter 2. Background – 2.2 HV System Hardware
This project is responsible for the software supervisory level of the HV sub-system of the two endcap sub-detectors: EP and EM, which is highlighted in blue colour in Figure 2.1. It will finally be integrated into the central DCS, to form a part of the Run Control and Monitoring System.
Figure 2.1 Hierarchy of Detector Control System
The ECAL DCS communicates with Detector Safety System (DSS), Data Acquisition (DAQ) and CMS central DCS. The general duties [Ref 5] of ECAL DCS include:
Development, design, prototyping, testing, installation of environment sensors;
Control and Monitoring of the detector hardware status, setup of overall control/monitoring software;
Alarm, monitoring, archiving of system parameters; ECAL safety system, including hardware interlocks; Interfaces between sub-systems and sub-detectors; 24 hr non-stop operation during physics data taking.
2.2 HV System Hardware The Endcap Electromagnetic Calorimeter consists of two Endcaps (Plus and Minus), each is composed of two “Dees” whose names come from their half-circular shapes, a “Dee” is further divided into two quadrants. A quadrant forms a basic unit in the High Voltage (HV) system.
Each quadrant (1/4 endcap) contains 1831 crystals, glued with VPTs and grouped into Supercrystals in a 5x5 array. A quadrant is supplied by two High Voltages: 800V for the VPT anodes and 600V for the VPT dynodes.
- 6 -
Chapter 2. Background – 2.3 Software
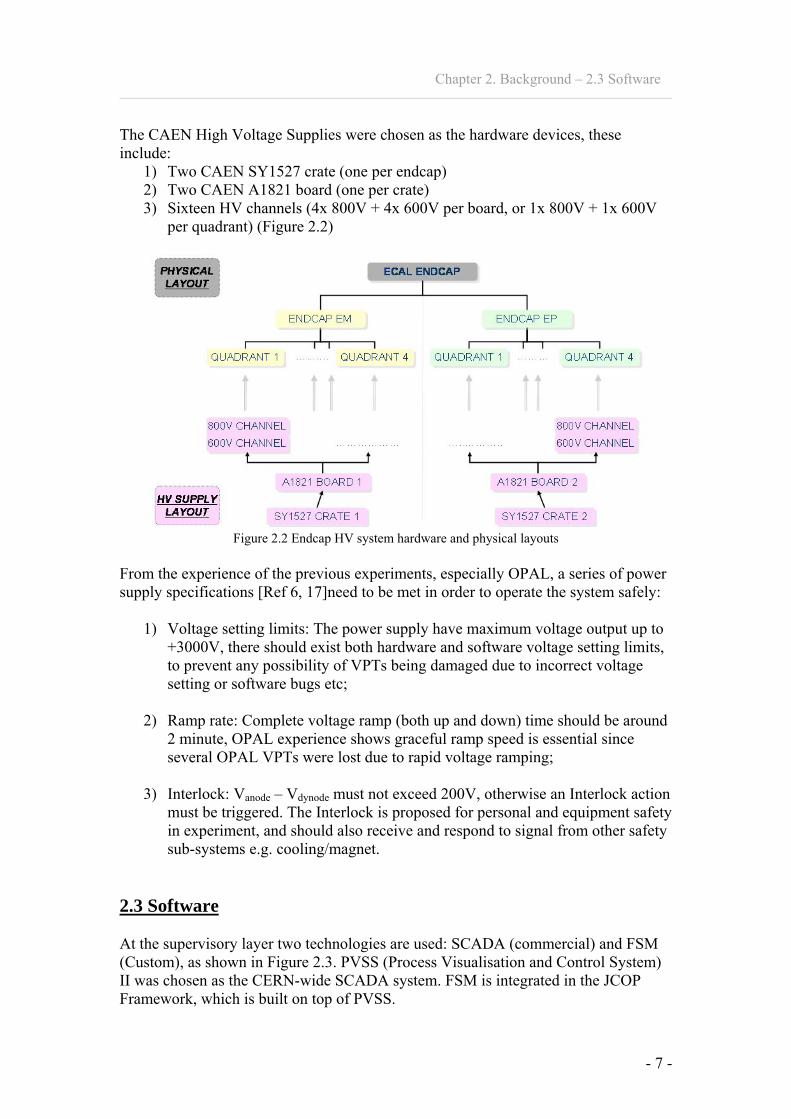
The CAEN High Voltage Supplies were chosen as the hardware devices, these include:
1) Two CAEN SY1527 crate (one per endcap) 2) Two CAEN A1821 board (one per crate) 3) Sixteen HV channels (4x 800V + 4x 600V per board, or 1x 800V + 1x 600V
per quadrant) (Figure 2.2)
Figure 2.2 Endcap HV system hardware and physical layouts
From the experience of the previous experiments, especially OPAL, a series of power supply specifications [Ref 6, 17]need to be met in order to operate the system safely:
1) Voltage setting limits: The power supply have maximum voltage output up to +3000V, there should exist both hardware and software voltage setting limits, to prevent any possibility of VPTs being damaged due to incorrect voltage setting or software bugs etc;
2) Ramp rate: Complete voltage ramp (both up and down) time should be around
2 minute, OPAL experience shows graceful ramp speed is essential since several OPAL VPTs were lost due to rapid voltage ramping;
3) Interlock: Vanode – Vdynode must not exceed 200V, otherwise an Interlock action
must be triggered. The Interlock is proposed for personal and equipment safety in experiment, and should also receive and respond to signal from other safety sub-systems e.g. cooling/magnet.
2.3 Software At the supervisory layer two technologies are used: SCADA (commercial) and FSM (Custom), as shown in Figure 2.3. PVSS (Process Visualisation and Control System) II was chosen as the CERN-wide SCADA system. FSM is integrated in the JCOP Framework, which is built on top of PVSS.
- 7 -

Chapter 2. Background – 2.3 Software
Figure 2.3 Experiment control process illustration [Ref 12]
2.3.1 PVSS II A PVSS application is composed of several processes (Figure 2.4), in PVSS terminology, Managers [Ref 14]:
1) The top layer comprises the User Interface Managers (UIM): In application mode, they provide graphical visualisation of device data received from Database and can send data to Database and devices via user commands. They can also be run in a development mode to build the control system.
2) The second layer is the Processing layer, comprised of Application
Programming Interface Managers (API) which allows user to write programs (in C/C++) using PVSS API to access the data in DB, and Control Managers (Ctrl) which provide data processing in background by running a scripting language.
3) The third layer is the heart of the system, containing the Event Manager which
is responsible for all communications, and Database Manager (DBM) which provides interface to the run time Database (DB).
4) The bottom layer are the Drivers (D), they provide interfaces to devices to be
controlled. e.g. They can be OPC clients etc.
Figure 2.4 Components of a typical PVSS project
- 8 -
Chapter 2. Background – 2.3 Software
A PVSS Project is an application with one EVM, one DBM plus any number of other Managers. All PVSS applications, as well as the majority of PVSS tools, are essentially built of panels and scripts, which are then represented through User Interfaces (UIs). [Ref 8] There are several important concepts in the PVSS system: 1) Database Structure: The device data in the PVSS database is structured as Data Points (DP) of pre-defined Data Point Types (DPT). A DPT describes the data structure of the device and a DP contains the information of a particular instance of such a device (similar to Object Oriented Terminology). 2) Building User Interfaces: Custom user interfaces can be designed via a User Interface Manager (UIM) - Graphic Editor. The graphic objects can be programmed to show the condition of the connected DPEs and to execute actions to change the DPE values. The actions are programmed using PVSS’s scripting language CTRL. 3) Control Scripts: PVSS CTRL scripts comply with the “C” syntax but with its own library of functions, they can be used in panels or at the system background, providing the interface to the PVSS database. 4) Accessing Devices: The PVSS OPC protocol driver will be used for accessing CAEN HV supply. The PVSS OPC Driver serves as a generic OPC client, while an OPC server is provided by CAEN. 2.3.2 JCOP Framework The JCOP Framework is being developed in common for the four LHC experiments by an IT group at CERN. It is based on PVSS II and provides guidelines and components for the different detector teams to build their control systems in a coherent manner. [Ref 12] The most important element in the framework is the Finite State Machine tool. The Framework development team defined a method for modelling the control system as a hierarchy of Finite State Machines. A FSM may be though of as a data-driven mechanism for modelling a hardware device or a sub-system. The ultimate control over the operation system is via this FSM hierarchy. A new Framework version is released every other month, which may provide new development tools and have some bugs in the previous versions corrected, though ironically often introduced new bugs.
- 9 -

Chapter 3. Implementation Process – 3.1 Project Creation
2.3.3 General To generalise, the communication between the system operator, software and actual detector hardware is via the connections: User ↔ Framework FSMs↔ PVSS ↔ OPC Client ↔OPC Server ↔ HV hardware The overall requirements on the Endcap High Voltage system software design are: maximum reliability and user friendliness [Ref 11]. The detailed functions required in the system include:
1) To connect to HV system hardware devices, acquire the data they produce and use it for their supervision;
2) To drive the hardware devices and generate/handle alarm; 3) Detailed channel current monitoring for fault analysis; 4) Remote setting of the HV device parameters; 5) Reliable logging, storage and archiving of system data; 6) To Hide the complexity of PVSS from system operator.
Chapter 3. Implementation Process 3.1 Project Creation The HV Control and Monitoring System will be implemented as a PVSS Project. Both PVSS II and JCOP Framework are available from the CERN IT website. To begin, the PVSS is downloaded and installed on a computer, details can be found in [Ref 15]. A license is required to run a PVSS project properly, it is obtained from CERN. The main tools for project management (Appendix B)are:
1) Project Administrator, the control centre of all the existing projects; 2) Console - the control centre for a single project; 3) Graphical Editor - where all the development processes (including database
management and operation panel design) are done; 4) Log Viewer - a record of all the process and error messages; 5) Device Editor Navigator: the main interface to the Framework
Figure 3.1.1 PVSS Project Creation
- 10 -

Chapter 3. Implementation Process – 3.2 Database Device Creation
New projects is created from PVSS Project Administrator. According to the CMS database [Ref 11], the project for the HV system is a Distributed Project with:
System number: 94 System name: CMS_ECAL_HV
In order to use the JCOP Framework functionalities, its components have to be installed on top of the PVSS Project directory. This is done by running fwInstallation panel from Graphical Editor and follow the on-screen instruction, details can be found in [Ref 15]. Six Framework components are selected for the HV project: fwAccessControl, fwCaen, fwConfigurationDB, fwCore, fwGenericExternalHandler, and fwTrending. To finalise the project creation, four PVSS Manages need to be added to the project Console manually:
1) Control Manager (options: fwFsmSrvr), this manager runs the script required for the FSM operation when the project is started;
2) Control Manager (options: -f fwScript.lst), it initialises the Framework components during the project start-up;
3) OPC DA Client (options: -num 6), the connection to OPC server; 4) User Interface Manager (options: -
fwDeviceEditorNavigator/fwDeviceEditorNavigator.pnl), it opens the Device Editor Navigator panel as the user interface to the Framework components.
3.2 Database Device Creation In order to operate hardware devices from software, the very first thing to be done is to create a structure in the database to model the actual device behaviour. The device data in the PVSS database is structured as Data Points (DPs) of pre-defined Data Point Types (DPTs). PVSS allows devices to be modelled using these DPTs/DPs as such it allows all data associated with a particular device to be grouped together rather than being held in separate variables. [Ref 14] A DPT describes the data structure of a device type (e.g. HV channel) and a DP contains the information related to a particular instance (e.g. channel1, channl2) of such a device. The DPT structure is user definable, with its hierarchy as complex as required. Each of the folders as well as the individual parameters are called Date Point Elements (DPEs). The DPE can be of various types, including float, integer, Boolean , string and dynamic array etc.. For example, in Figure 3.2.1 the structure of DP “CAEN/crateEM/board12/channel001”, of DPT “FwCaenChannel”, is fully expanded, with its DPEs grouped in different folders – actual, settings, readBackSettings etc.. Typically a DPE is connected to a specific aspect of a hardware, for example, to monitor the actual run time voltage of a HV channel, a DPE of a HV channel DP naming “actual.vMon” can be created. The DPEs can be seen as at the lowest layer in
- 11 -

Chapter 3. Implementation Process – 3.2 Database Device Creation
the PVSS system, as any process in the PVSS system wanting to communicate to the hardware is via these DPEs. In the OPC connections, it is the DPEs that will be connected to the OPC server’s OPC items (see Chapter 3.8), therefore the operations on the DPEs can be treated as the operations directly on the actual hardware devices. There are also certain “configs” which enable specific behaviours to be configured for a DPE, these include the peripheral address (in this system, OPC item address), archive and alarm handling etc.. When a DPE is referred to in a panel or script, its full address is : System Name + DP name + DPE name. For example, the address of DPE “setting.v0” of a HV channel DP “CAEN/crateEM/board03/channel005” is: “CMS_ECAL_HV:CAEN/crateEMboard03/channel005.setting.v0” A Graphical Parameterisation tool – PARA is provided in PVSS to manage the database. Generally, it is where the creation and modification of DPTs and DPs should be done. Alternatively, control scripts can be used to do the same job, which is actually more convenient for a project containing a large amount of DPTs/DPs. In the Framework those control scripts are provided and graphically visualised in the Hardware View of the Device Editor Navigator (DEN).
DPTsDPs
DPEs
Config
Figure 3.2.1 Database structures as seen in PARA tool
The hardware devices in this HV project are the CAEN crates, boards and channels. As they are also the common devices that will be used in the other LHC experiments, they are already pre-defined in the JCOP Framework, i.e. when installing the Framework the DPTs (FwCaenCrateSY1527, FwCaenBoardSY1527, FwCaenChannel) modelling the CAEN crates/boards/channels are automatically
- 12 -

Chapter 3. Implementation Process – 3.2 Database Device Creation
created in the PVSS database. The full structure of the CAEN Channel DPT is shown in Appendix A as an example. The system developer’s task is to modify the existing structure to suit the need in a particular sub-system (if desired), and to create instances (DPs) of those DPTs. All these are done via the Hardware View in the framework panel Device Editor Navigator. The naming for device DPs are chosen carefully in order to minimise the modification when connecting the DPEs to the OPC server items (see Chapter 3.8). The creation is done in three steps:
1. Create two CAEN SY1527 crates, with names crateEM for the “Endcap Minus” and crateEP for “Endcap Plus”, this process automatically creates two Data Points – “crateEM” and “crateEP” of Data Point Type FwCaenCrateSY1527 in the database;
2. Add one A1821P board for each crate, with name “boardxx”, actual xx may
vary between 00-15, depending on which slot the board is placed in the crate, “03” is used for both boards for the time being. Two DPs “crateEM/board03” and “crateEP/board03” of type FwCaenBoardSY1527 are then created;
3. Add eight channels per board: for board A1821P it can be any number
between channel000-channnel011, depending on the actual channel connected, here 000-007 will be used for both boards (Figure 3.2.2). This step creates 16 DPs with names “crateEM/board03/channel000-007” and “crateEP/board03/channel000-007”, of type FwCaenChannel.
Figure 3.2.2 HV Channel creation
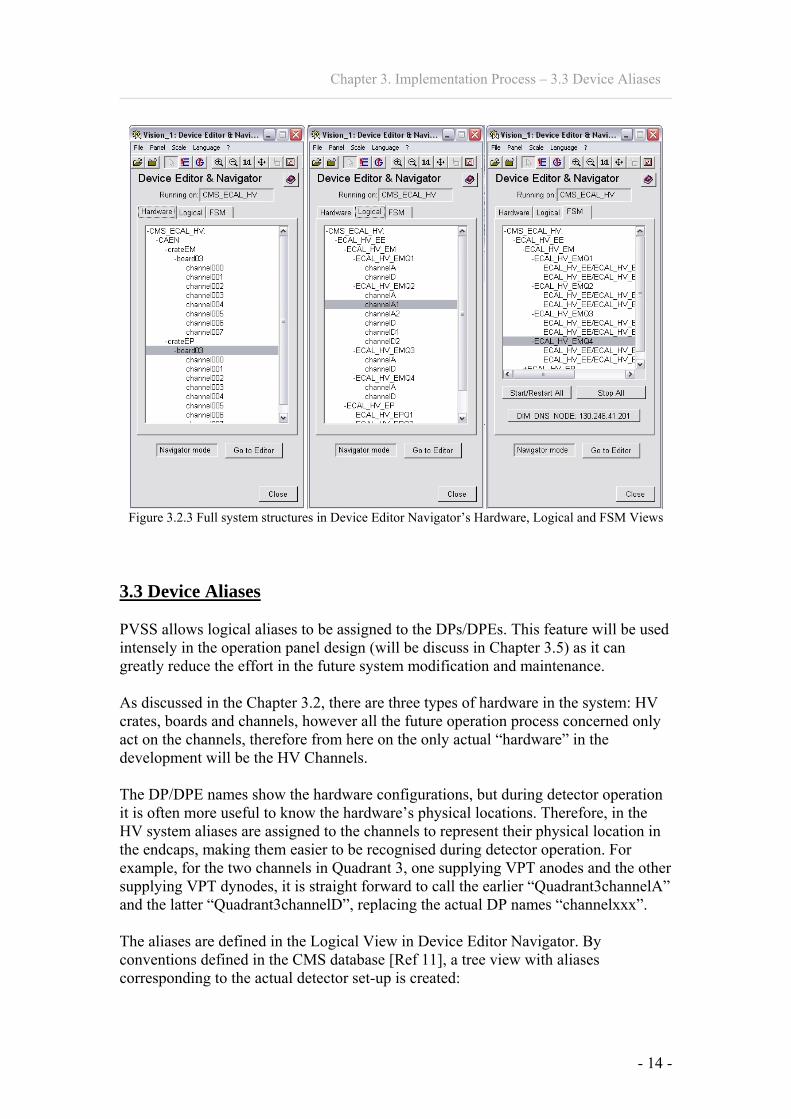
The Hardware View after the device creations is shown in Figure 3.2.3.
- 13 -
Chapter 3. Implementation Process – 3.3 Device Aliases
Figure 3.2.3 Full system structures in Device Editor Navigator’s Hardware, Logical and FSM Views
3.3 Device Aliases PVSS allows logical aliases to be assigned to the DPs/DPEs. This feature will be used intensely in the operation panel design (will be discuss in Chapter 3.5) as it can greatly reduce the effort in the future system modification and maintenance. As discussed in the Chapter 3.2, there are three types of hardware in the system: HV crates, boards and channels, however all the future operation process concerned only act on the channels, therefore from here on the only actual “hardware” in the development will be the HV Channels. The DP/DPE names show the hardware configurations, but during detector operation it is often more useful to know the hardware’s physical locations. Therefore, in the HV system aliases are assigned to the channels to represent their physical location in the endcaps, making them easier to be recognised during detector operation. For example, for the two channels in Quadrant 3, one supplying VPT anodes and the other supplying VPT dynodes, it is straight forward to call the earlier “Quadrant3channelA” and the latter “Quadrant3channelD”, replacing the actual DP names “channelxxx”. The aliases are defined in the Logical View in Device Editor Navigator. By conventions defined in the CMS database [Ref 11], a tree view with aliases corresponding to the actual detector set-up is created:
- 14 -
Chapter 3. Implementation Process – 3.3 Device Aliases
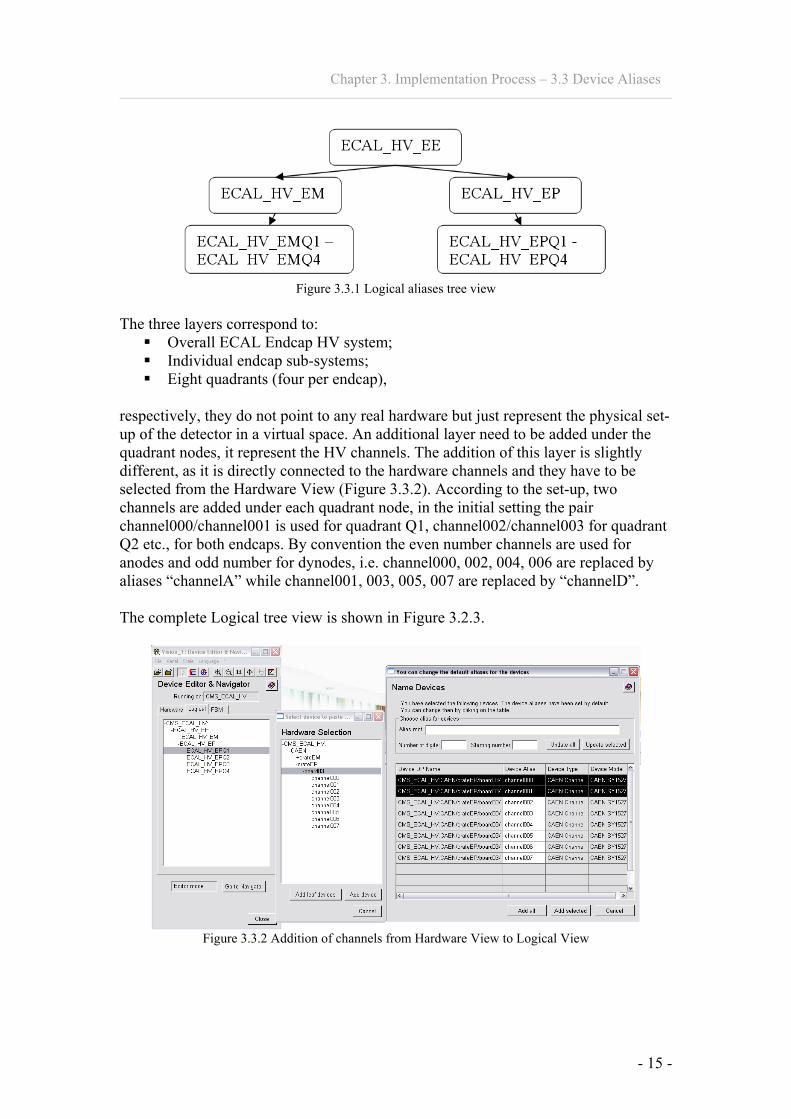
Figure 3.3.1 Logical aliases tree view
The three layers correspond to:
Overall ECAL Endcap HV system; Individual endcap sub-systems; Eight quadrants (four per endcap),
respectively, they do not point to any real hardware but just represent the physical set-up of the detector in a virtual space. An additional layer need to be added under the quadrant nodes, it represent the HV channels. The addition of this layer is slightly different, as it is directly connected to the hardware channels and they have to be selected from the Hardware View (Figure 3.3.2). According to the set-up, two channels are added under each quadrant node, in the initial setting the pair channel000/channel001 is used for quadrant Q1, channel002/channel003 for quadrant Q2 etc., for both endcaps. By convention the even number channels are used for anodes and odd number for dynodes, i.e. channel000, 002, 004, 006 are replaced by aliases “channelA” while channel001, 003, 005, 007 are replaced by “channelD”. The complete Logical tree view is shown in Figure 3.2.3.
Figure 3.3.2 Addition of channels from Hardware View to Logical View
- 15 -

Chapter 3. Implementation Process – 3.4 Finite State Machine
3.4 Finite State Machine 3.4.1 Introduction to Experimental Controls Hierarchy Architecture: The mechanism adopted for modelling the structure of sub-detectors, sub-systems and hardware components in a consistent fashion is to use a hierarchical (tree-like) structure of Finite State Machines. A FSM may be though of as a generic, data-driven mechanism for modelling the functionality of a piece of equipment or a sub-system. [Ref 9] In this mode there is a state/command interface between a parent and its children. Commands are propagated downwards from a parent to its children and the states of the children are propagated upwards to the parent. (as shown in Figure 3.4.1) The parent derives its state from those of its children. Alarms are also propagated upwards through the hierarchy.
Figure 3.4.1 FSM State/Command interface [Ref 9]
The hierarchy is composed of two types of node: Control Units (CUs) and Device Units (DUs).
Control Units are abstract objects that implement logical behaviour, they can have a list of allowed states, in each state a list of allowed actions. When an action gets triggered (either by the reception of a command or by a state change of another object) they execute instructions like sending commands to their chileren. State Transitions can be triggered by: Command reception (either from its parent or from an operator) or State change of its children. Different from DUs they do not directly linked to any hardware, and they are at the higher layers in the hierarchy. The behaviour of the object is coded using a language called SML [Ref 20]. In short, Control Units are used to monitor and control the sub-tree bellow them.
Device Units are physical objects modelling a specific piece of equipment - typically a DU is connected to a DPE. DUs are directly linked to hardware devices so are at the lowest layer in the hierarchy. They also can have a list of allowed states, and in each state a list of allowed actions, but do not implement logic behaviour and when they receive a command they have to act on the device they model. When the device’s data changes they have to change state accordingly. DU’s behaviour can be coded in C language. In short, Device Units are used for monitoring and controlling the equipment to which they correspond.
- 16 -

Chapter 3. Implementation Process – 3.4 Finite State Machine
The FSM toolkit provided in the JCOP Framework is called “SMI++” (State Management Interface), it was first developed for DELPHI experiment at LEP and now also being used by BaBar at SLAC. SMI allows the description of any sub-system as a collection of objects, each behaving as a FSM, i.e. objects are always in a well-defined state and can receive actions that will make them transit to another state. A logically related group of objects (e.g. a sub-system) is called a domain in SMI terms. [Ref 20]
3.4.2 Implementation: 3.4.2.1 FSM units creation and configuration In this project two types of Control Unit will be created: 1) DCSNode modelling the highest layers – the overall system and two individual endcaps, 2) QuadrantNode models the intermediate layer - the eight quadrants. There is only one type of Device Unit, FwCaenChannelStd, which model the lowest layer - the hardware channels. The complete structure is illustrated in Figure 3.4.2.
Figure 3.4.2 Structure of CUs/DUs
Comprehensive tools to create and configure the FSM units are also integrated in the Framework, they can be accessed from the Finite State Machine view of Device Editor Navigator. Figure 3.4.3 shows the panel for creating Device Units (via Add Device Type) and Control Units (via Create Object Type). The unit types will appear in the list after creation, their properties are configured from specific panels.
- 17 -

Chapter 3. Implementation Process – 3.4 Finite State Machine
Figure 3.4.3 FSM unit type creation panel Device Unit: The Device Unit configuration panel is shown in Figure 3.4.4. States are created with names and colours standardised in order that the tree structures in different sub-detectors/sub-systems can be integrated into a central Detector Control System tree properly. A set of conventions is defined by the Framework group [Ref 13]. The states must be comprehensive to be able to represent all possible status of a HV channel. Full states are listed in Appendix A. The states are connected to the Datapoint Elements “actual.status” of Datapoints of type FwCaenChannel, a reading from “actual.status” return a bit which correspond to one particular hardware channel status output, the bits and corresponding status is defined in [Ref 3]. A control script (see Appendix C) is written to connect the states with the correct bits, this script is evaluated at the start-up of the state machine and whenever the data of the channel changes, thus when the channel data changes the Device Unit can change state accordingly. Having done all the above, the monitoring of the channels states is fully configured. For controlling, actions are added to appropriate states where required. In this system three actions are created: SWITCH_ON, SWITCH_OFF and RECOVER, they are connected to the boolean type DPEs “setting.onOff” of type FwCaenChannel Datapoints, as such they can switch on/off the channels when a command from the parents or operator is received. This is done by writing a control script as shown in Figure 3.4.5.
- 18 -

Chapter 3. Implementation Process – 3.4 Finite State Machine
Figure 3.4.4 Device Unite configuration panel
Figure 3.4.5 Device Unit action script
Control Units The configuration on a Control Unit is slightly different: as they are not directly connected to the real hardware, there is no need to set up the connection to any DPE, instead its states is defined using logical operation on the states of its children. This is done by scripting in SML with a list of WHEN clauses (Figure 3.4.6). Each state has a unique set of WHEN clauses which is carefully designed so that any change in the children state will only result in a single state in the parent (the system may crash when the parent is both ON and OFF!). Like the scripts for DUs, these clauses are evaluated whenever a State of a child changes. Details on the SML format can be found in [Ref 20]. The settings on the DCSNode is relatively simple, it only has five states: ON, OFF, NOT_OK, WARNING and ERROR (note these are different from the states in FwCaenChannelStd), with three actions: SWITCH_ON, SWITCH_OFF and
- 19 -

Chapter 3. Implementation Process – 3.4 Finite State Machine
RECOVER, these actions will propagate all the way down to the DUs. The detailed WHEN clauses for state transitions can be found in Appendix A. The QuadrantNode is the busiest unit in the tree, as mentioned above the States defined in DCSNode differ from those in FwCaenChannelStd, the role of QuadrantNode is to summarise the states of FwCaenChannelStd into different classes and translate them upwards to DCSNode. Details of the state transitions can also be found in Appendix A. There are also three actions defined for this unit: SWITCH_ON, SWITCH_OFF and RECOVER.
Figure 3.4.6 Assignation of WHEN clauses to state ERROR
3.4.2.2 FSM Hierarchy Creation: Having created and configured the Unit types, the next step is to group them together to form a complete FSM tree structure. The FSM tree is created from the FSM view in the DEN. The naming on the tree nodes are defined in the CMS database [Ref 11], and it is rather similar to the aliases in the Logical View, the creation is done in four steps:
1) At the top level, ECAL_HV_EE is added as a CU of type DCSNode, it serves as the system top node;
2) The second level contains ECAL_HV_EM and ECAL_HV_EP, which represent the two endcaps, they also are of type DCSNode;
3) At the third level, four nodes are added under each endcap node, they are of type QuadrantNode. The structure and names are identical to the quadrant alias in the logical view. (as the above Control Units are not directly linked to the hardware, they are fully configured)
4) The channel DUs are added at the button level. The addition of the Device Units is different, because they have to be selected from either the Hardware
- 20 -

Chapter 3. Implementation Process – 3.4 Finite State Machine
View or the Logical View so that the Units “know” exactly which hardware channel they are connected to. Two FwCaenChannelStd Device Units is added from logical view under each quadrant (Figure 3.4.7), with layout similar to the Logical View.
Figure 3.4.7 DU addition in DEN FSM view 3.4.2.3 Operation View Each FSM tree node has a unique Operation Panel. In the DEN Navigator Mode, the FSM Operation Panels can be opened by right clicking on the FSM nodes. An example is shown in Figure 3.4.8, this is the operation panel for the system top domain – ECAL_HV_EE. The state of the domain can be view from Area 1, during operation it will show the states with corresponding colours. By clicking on the “State” button, a list of commands (if exist) will pop up and can be selected and sent. By Framework convention this should the only means of operating the system. The states of the sub-domains (children) can be viewed from Area 2. As can be seen there is a large blank Area 3, this is the area reserved for the Domain Specific Panel (DSP). DSPs can be custom-designed and attached to the Operation Panels, the objective is to provide as much information about the current domain as possible. For example, it would be useful to know the detail status, like all the readings of the channel voltages and have an indication of the alarm origins in case of an alert etc. By Framework convention, this area should serve as pure information display area and should not include any operation to change device state. Details on the DSP design will be discussed in Chapter 3.5.
- 21 -

Chapter 3. Implementation Process – 3.4 Finite State Machine
Figure 3.4.8 FSM Operation Panel for node ECAL_HV_EM
In the case of a Device Unit, it being at the lowest layer in the hierarchy determines there is no sub-domain display in its Operation Panel. A distinct feature of the DU Operation Panel is that whenever it is opened, two reference parameters: $1, $2 – where $1 is the name of its parent CU and $2 is the full DP name or alias of the device it models- will be automatically passed to the Domain’s Specific Panel, this feature will influence the approach in panel design. ( will be discussed in Chapter 3.5). A new concept here is the Partitioning and Ownership, as shown in Figure 3.4.9, it govern the interaction between a parent and its child, this feature will play an important role during system testing and maintenance, or when fatal error happen to particular pieces of detector which need to be excluded from the central system.
Figure 3.4.9 Recalling Figure 2.3, the FSM is built on top of the PVSS. According to the development convention, the FSM Operation Panels are the ONLY panels that will be used in general detector operation (i.e. excluding the system upgrading and maintenance etc.), all the other panels are involved in the development process or other purposes only.
- 22 -

Chapter 3. Implementation Process – 3.5 Domain Specific panel Design
3.5 Domain Specific Panel Design 3.5.1 General As the name PVSS (Process Visualisation and Control System) suggests, the main feature of the software is to visualise the operation process and to hide the complexity (scripts, codes etc) of the system behind graphical widgets. The development work is done in Graphical Editor (Figure 3.5.1).
Figure 3.5.1 PVSS Graphical Editor (Gedi)
There are two important concepts in the PVSS panel design: 1) CTRL Script and Dynamic Widget: PVSS CTRL scripts can be used in panels. They provide the interface to the PVSS database. These scripts comply to the C language syntax but contain extensions. PVSS provides a very comprehensive library of functions that give access to all PVSS functionalities. There are functions for datapoint manipulation, graphics design and file access etc. The three key functions for datapoint access are:
• dpGet(): Get the current value of a DPE from the database once. • dpSet(): Set the current value of a DPE to DB. • dpConnect(): Execute a call-back function when the value of a DPE change, to
update the DPE value continuously. The two main functions for graphical functionality are:
• getValue(): Get a property of a widget, like the, colour, size and the text etc. • setValue(): Set a property of a widget.
- 23 -

Chapter 3. Implementation Process – 3.5 Domain Specific panel Design
Control scripts are programmed to attach actions for the graphical objects. These actions can be triggered by user commands (double click, text input etc) or be initialised at the panel start-up. Scripts can be viewed and modified from the script editor (Figure 3.5.2) and it is also where the modifications on the parameters are done.
Figure 3.5.2 Panel control script programming
2) Reference Parameters: The architecture of PVSS panel is based on Object Oriented Technology, thus it allows a panel to be recalled at various instances, this is done by representing the variables in the panel scripts as $parameters, when a panel is called its $parameters are replaced by the actual assigned values. As stated in Chapter 3.4, there is one Operation Panel (OPP) for each FSM node, each OPP contains a Domain Specific Panel (DSP). The development on the DSPs for Device Unit FwCaenChannelStd will be discussed first, followed by those for Control Unit QuadrantNode and DCSNode. 3.5.2 FwCaenChannelStd The name given to the panel is fwCaenChannelStd.pnl, making it coherent with the unit type name. A panel for HV channel operation is provided in the Framework, it is a template which contains common information that may be needed for different experiments. For the purpose of this HV system, the template panel is considered to be not fully sufficient and modification is needed.
- 24 -

Chapter 3. Implementation Process – 3.5 Domain Specific panel Design
Figure 3.5.2 HV Channel Operation Panel
The modified DSP opened in channel (FwCaenChannelStd) Operation Panel is show in Figure 3.5.2. The upper half of the panel make use of much of the contents in the template panel, but with all the widgets related to system control deleted (as by convention the DSP is not responsible for operation). No modification on the parameter is needed at this stage. The cells of the left table are connected to the DPEs of sub-folder “settings” and “readBackSetting” (see Appendix A table 1) of a HV channel DP, so they can display the channel setting parameters during runtime, also new setting values can be assigned to the DPEs from here. The cells of the right table are connected to the DPEs of sub-folder “actual”, and they will display the runtime readings of the channel parameters. The two tables combined visualise all the DPE values of a particular channel DP. The panel’s lower half is a trend (in the PVSS terminology, meaning “plot”). The trending function in PVSS is not satisfactory but more powerful custom-designed templates are provided in the Framework. This trend is created from one of the templates. The purpose of this trend is to display both the voltage and current readings during operation runtime, it is connected to two DPEs: “actual.iMon” and “actual.vMon” - which stand for “actual current monitoring” and “actual voltage monitoring” respectively - of a channel DP. If the DPE is archived (see Chapter 3.7), the trend will also show the historical data. As mentioned before, PVSS allows a panel to be used as a Reference Panel, so the DP name in the full DPE addresses (in control script) can be replaced with a $parameter - $2. The reason to use “$2” is, whenever a DU panel is opened two parameters $1 and $2 are automatically passed to the domain specific panel, with $2 being the actual DP name of the device (see Chapter 3.4). That mean a single panel can then be re-used for all the 16 channels in the system, whenever the panel is opened its $parameters will
- 25 -
Chapter 3. Implementation Process – 3.5 Domain Specific panel Design
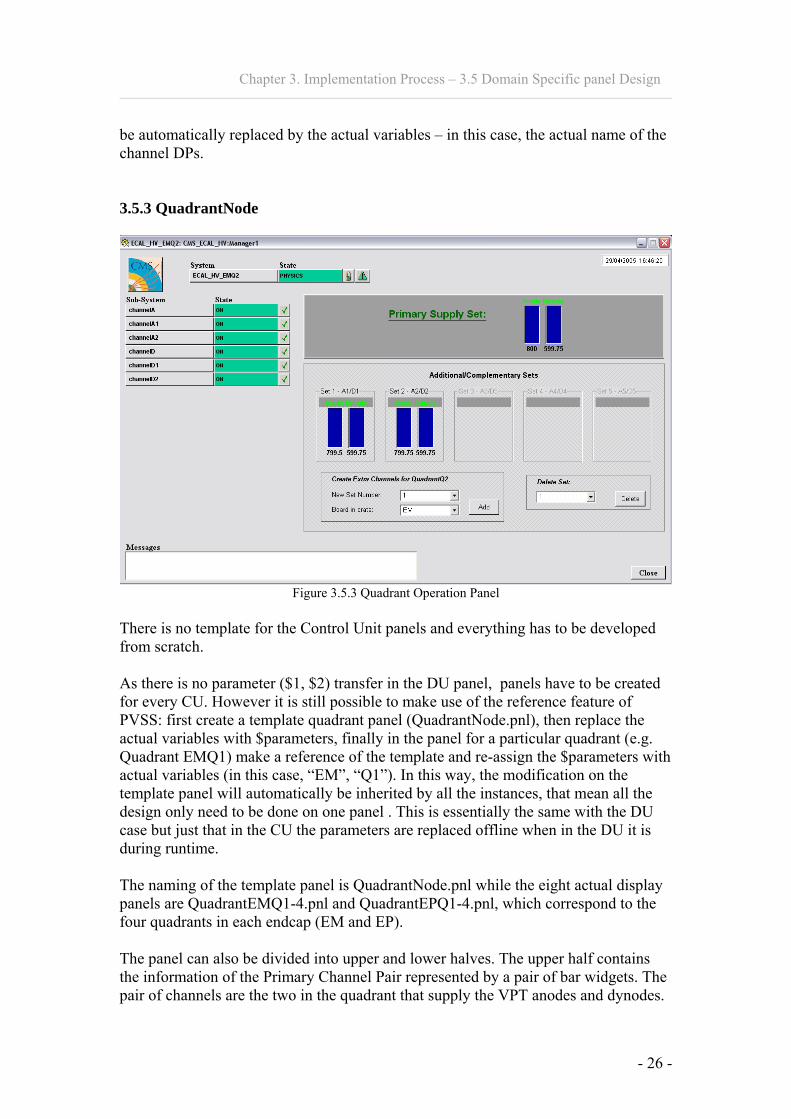
be automatically replaced by the actual variables – in this case, the actual name of the channel DPs. 3.5.3 QuadrantNode
Figure 3.5.3 Quadrant Operation Panel
There is no template for the Control Unit panels and everything has to be developed from scratch. As there is no parameter ($1, $2) transfer in the DU panel, panels have to be created for every CU. However it is still possible to make use of the reference feature of PVSS: first create a template quadrant panel (QuadrantNode.pnl), then replace the actual variables with $parameters, finally in the panel for a particular quadrant (e.g. Quadrant EMQ1) make a reference of the template and re-assign the $parameters with actual variables (in this case, “EM”, “Q1”). In this way, the modification on the template panel will automatically be inherited by all the instances, that mean all the design only need to be done on one panel . This is essentially the same with the DU case but just that in the CU the parameters are replaced offline when in the DU it is during runtime. The naming of the template panel is QuadrantNode.pnl while the eight actual display panels are QuadrantEMQ1-4.pnl and QuadrantEPQ1-4.pnl, which correspond to the four quadrants in each endcap (EM and EP). The panel can also be divided into upper and lower halves. The upper half contains the information of the Primary Channel Pair represented by a pair of bar widgets. The pair of channels are the two in the quadrant that supply the VPT anodes and dynodes.
- 26 -
Chapter 3. Implementation Process – 3.5 Domain Specific panel Design
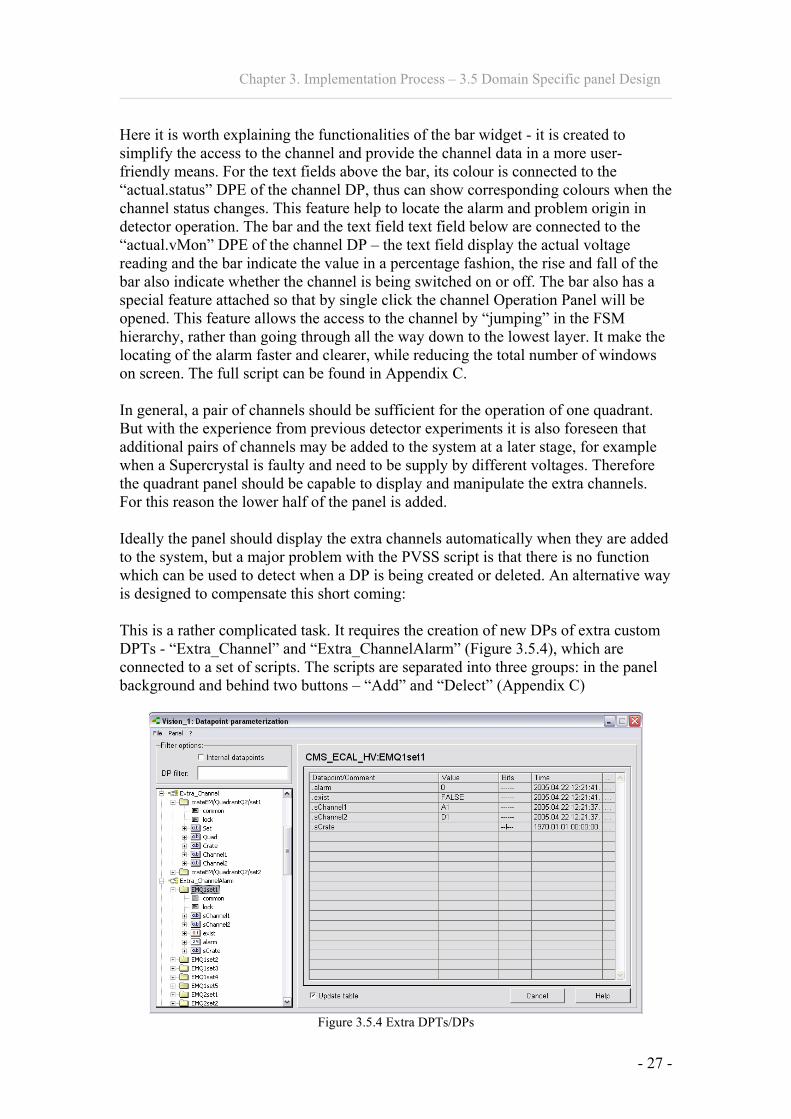
Here it is worth explaining the functionalities of the bar widget - it is created to simplify the access to the channel and provide the channel data in a more user-friendly means. For the text fields above the bar, its colour is connected to the “actual.status” DPE of the channel DP, thus can show corresponding colours when the channel status changes. This feature help to locate the alarm and problem origin in detector operation. The bar and the text field text field below are connected to the “actual.vMon” DPE of the channel DP – the text field display the actual voltage reading and the bar indicate the value in a percentage fashion, the rise and fall of the bar also indicate whether the channel is being switched on or off. The bar also has a special feature attached so that by single click the channel Operation Panel will be opened. This feature allows the access to the channel by “jumping” in the FSM hierarchy, rather than going through all the way down to the lowest layer. It make the locating of the alarm faster and clearer, while reducing the total number of windows on screen. The full script can be found in Appendix C. In general, a pair of channels should be sufficient for the operation of one quadrant. But with the experience from previous detector experiments it is also foreseen that additional pairs of channels may be added to the system at a later stage, for example when a Supercrystal is faulty and need to be supply by different voltages. Therefore the quadrant panel should be capable to display and manipulate the extra channels. For this reason the lower half of the panel is added. Ideally the panel should display the extra channels automatically when they are added to the system, but a major problem with the PVSS script is that there is no function which can be used to detect when a DP is being created or deleted. An alternative way is designed to compensate this short coming: This is a rather complicated task. It requires the creation of new DPs of extra custom DPTs - “Extra_Channel” and “Extra_ChannelAlarm” (Figure 3.5.4), which are connected to a set of scripts. The scripts are separated into three groups: in the panel background and behind two buttons – “Add” and “Delect” (Appendix C)
Figure 3.5.4 Extra DPTs/DPs
- 27 -

Chapter 3. Implementation Process – 3.5 Domain Specific panel Design
The mechanism behind this all is that whenever the panel is opened or when a user trigger an action (by clicking either button), a set of control scripts will be executed to scan the existing channel DPs in the database, whenever a DP is found, its information will be stored in the new DPs; another set of scripts then make use of the information stored and display the proper information. In this way the script in the quadrant panel can also communicate with those in the endcap panels (see Chapter 3.5.4), to display the inter-dependent information. The panel is designed to guide user to perform the full task by a maximum of 3 clicks on the panel. Dozens of reference parameters have to be used in the scripts, but it doesn’t require the system operator to have any knowledge of them, thus the complexity of the system is successfully hidden from the system operator. This implementation greatly reduce the future system modification, which otherwise can turn out to be a painstaking task. When one or more additional pairs of channels exist in a quadrant, an “i” symbol will be displayed in the Endcap panels as an indication (Figure 3.5.5). 3.5.4 DCSNode There are three nodes of type DCSNode in the FSM tree (ECAL_HV_EE, ECAL_HV_EM, ECAL_HV_EP), each of them has its own specific panel.
Figure 3.5.5 Endcap EM Operation Panel
- 28 -

Chapter 3. Implementation Process – 3.5 Domain Specific panel Design
The Operation Panel for ECAL_HV_EM is shown in Figure 3.5.5. The original ECAL endcap image is found in [Ref 16], it is then modified in Photoshop, with the Preshower detector removed, the ECAL highlighted in green colour and the area of the four quadrants clearly indicated. As can be seen, all the four Primary Channel Pairs are shown on the corresponding quadrant of the endcap image. Note there is a small “i” symbol next to the bars of Quadrant 2, it is the extra channel symbol mentioned in section 3.5.3. It being visible means that are additional channels for Quadrant 2. The symbol can also serve as an alarm indicator, as its colour is connected to the DPE “actual.status” of those additional channels. The symbols’ scripts are connected to those of “Add” and “Delete” buttons in the quadrant panels. Below the endcap image are four buttons coupled with four LEDs, they provide information of the four quadrants. The script behind the quadrant buttons is programmed so that by clicking on it, the FSM Operation Panel for that quadrant will be opened (i.e. the same function as clicking on the quadrant FSM node). The LEDs have more complicated scripts in behind. They are each connected to the “actual.status” DPEs of the two primary channel DPs in the quadrant. Basically speaking, it evaluates the status of all the channels in a quadrant and summarise it to be the status of the quadrant. The script is also programmed so that in the case that additional channels exist for a quadrant, the LED is able to detect their existence and include the evaluation of their states. The states are simplified to three states: OFF, ON and ALARM, with is indicated via the LEDs by colour grey, green and flashing red, respectively. The complete script behind the LEDs can be found in Appendix C. The ECAL_HV_EP panel is almost identical to the EM panel, with the differences being the parameters containing “EM” replaced by “EP” and the layout horizontally inversed. ECAL_HV_EE is the top node of the FSM tree and so its specific panel is the system main panel which will be called “Master Panel” (Figure 3.5.6). This panel is essentially a combination of the EM and EP panels, plus the OPC connection indications.
- 29 -

Chapter 3. Implementation Process – 3.6. Control Scripts
Figure 3.5.6 System Master Panel
3.5.5 The Use of Aliases Originally it was planned to connect the widgets with the DPEs directly, but that method is found to be not flexible against any system hardware change, thus the device aliases are used instead. In this way the panel objects can be connected to the “physical set-up” names which are stable, while the actual channel DP name may change (e.g. a channel002 may need to be replaced by channel008 if the it is not working properly). For instance, if a panel widget is connected to the DP channel002, the parameter 002 need to be changed to 008 after the hardware change; in contract if it is connected to the alias – Quadrant2channelA, then no change is needed, for no matter which channel number it is changed to, it is still supplying the Anode of Quadrant 2. A small problem is: in PVSS script it is not possible to link a graphical object directly to an alias, all the connection is done with the actual DPE names. This is solved by using a function dpAliasToName(), this function automatically finds the DPE name corresponding to a given Alias, which mean essentially the DPE names are used to connect the widgets but those DPE names have to be known by neither the system developer nor the user, the only thing they need to know is the physical layout (aliases) of the HV system. 3.6 Control Scripts PVSS CTRL scripts can be used in panels or as standalone process. They provide the interface to the PVSS database. Most of the control scripts in this HV system are panel dependent, and they are associated with particular graphical objects or will run
- 30 -

Chapter 3. Implementation Process – 3.6. Archive and Runtime Database
in the background of a particular panel, as discussed in the Chapter 3.5. But there exists one condition that should be satisfied at any time, regardless of any user panel is opened or not: as required the VPT anode voltage cannot exceed the dynode voltage by more than 200V (see Chapter 2.2), exceeding the limit will automatically trigger the “Switch Off” for both channels (interlock action), an alarm will be sent to the operation panel simultaneously and the channel will only be allowed to turned on again when the mentioned condition is satisfied. This is done in two steps:
1. Create a script file “interlock.ctl” under the project files directory. The script connects the “actual.vMon” DPEs of every pair of Anode/Dynode channel DPs, and compares their values continuously. Whenever a value exceed 200V, the pair will be switched off and an alarm message is sent to the user interfaces;
2. In the PVSS Console append a Control Manager with name “interlock.ctl”. After the set up, whenever the PVSS project is started, the script will be run in the system as a background process. All scripts in the HV system, including those used in the panel and the one mentioned above, are internally documented in the form of comments, to help the future system maintenance and to ease the understanding of the system mechanism. The content includes:
Panel name and a description of its purpose and usage; List of $parameters appeared in script; List of panels called from script ; List of reference panel called by the script and the substituted $parameters; List of script functions called from the panel and which object they acts on.
3.7 Archive and Runtime Database By default there are five runtime databases in PVSS, namely Five-minute Archive, Hour Archive, Day Archive, Command Archive and State Archive, ranging from high-definition short time storage to low-definition long time storage. New archive can be custom-made for special purpose. There is currently no official document on what data and how the system monitoring data should be archived. For the time being the voltage and current monitoring data (“actual.vMon” and “actual.iMon” DPEs) is archived and the Day Archive is used. Day Archive can record up to 400 DPs, each with 400 value entries, and the archive file change every day. It requires much less disc space than the Hour and Five-minute Archives, and is sufficient provided the HV channels are not switched no/off too frequently.
- 31 -

Chapter 3. Implementation Process – 3.6. Device Connection
Figure 3.7.1 Archive settings
There are several ways to set up the archive, the normal way is to configure the archive “config” of the “actual.vMon” and “actual.iMon DPEs” in the PARA tool, but it can take a long time for a large system. There is a mass configuration tool (Figure 3.7.1) provided in the Framework and from here the archive of several DPEs can be configured in one step. The archives will be continuously tested to evaluate the optimum balance between record resolution and disc space consumption, and if needed, custom archives will be created. 3.8 Device Connection So far, the core of the supervisory layer is completely implemented, but the software itself can not communicate with hardware directly and a protocol in between is needed. The connection mechanism depends on the type of devices being used and in the CAEN HV case the OPC protocol will be used. OPC is based on Microsoft’s COM/DCOM technology, which means the OPC Clients/Servers can only be run on the Windows platforms. There are two layers of OPC connections:
1. Connection between PVSS (as an OPC client) and OPC server 2. Connection between OPC server and the HV devices
The OPC server is provided by the hardware manufacture CAEN. An OPC server is an abstract layer between the user and the actual hardware, it provides a set of OPC items [Ref 2, 3] of the data available from the hardware and the commands they can receive. OPC items are in a way very similar to the DPEs in PVSS. When a HV
- 32 -

Chapter 3. Implementation Process – 3.6. Device Connection
device (crate, board) is connected to the OPC server, OPC items corresponding to the device data are automatically generated in the server. The settings on OPC server is done with a tool provided by CAEN (Figure 3.8.1). The OPC server can connect to the crate in several ways, at the moment the TCP/IP protocol is used. This requires the HV crate to have an IP address. The tool also allows the crates to be chosen to supply endcap EM or EP.
Figure 3.8.1 OPC Server settings
Mapping the DPEs to those corresponding OPC items allows software acquisition and manipulation with the data from actual hardware. All is done by configuring the “address” config of the DPEs: after choosing OPC as the protocol, defined which OPC items they should connects to. The configuration can be performed either using PVSS PARA tool or the Framework DEN. PVSS can serve as a generic OPC Client, provided the appropriate Driver is added to the project. In the HV project a Driver of Type “OPC DA Client” is added and it is configured as “–num 6” (see Chapter 3.1), the reason is that by using a client with No.6 the internal setting from framework will be activated, which will greatly reduce the configurations - when a DP is created, the Framework automatically generate the mapping of the DPEs to the OPC item addresses by assigning default “address” config settings to those DPEs. Since the default settings are related to the full DPEs, if the DP names are chosen appropriately the defaults can be exactly those settings required and otherwise need to be re-configured. The OPC Client settings are done in the Hardware View of DEN. A Framework Mass Configuration Panel (Figure 3.8.2) is used to set all connections in one step. Since the device DP names have been chosen carefully, no more modification is needed, otherwise every DPEs would need to be mapped to the appropriate OPC item address individually!
- 33 -

Chapter 4. Future Plans
Figure 3.8.2 OPC Client settings
Chapter 4. Future Plans With the implementations in Chapter 3. the system is capable for controlling and monitoring the HV properly, with most of the features required included. However, there still exists three main areas of development on the system before it can finally be integrated into the central Detector Control System:
1. Configuration Database 2. Access Control 3. Electronic Log Book
4.1 Configuration Database The Configuration Database contains all the information required to configure the control system. The information typically contains such as the definition of all DPTs and DPs, their full structures and associated hardware addresses, alarm limits, etc. ORACLE has been chosen to be the configuration database for CMS and the development on it is underway by the experiment central DCS group. The Framework provide tools to connect the system to the Configuration Database to allow data setting and retrieval, and the tools are accessed from the Hardware View in DEN.
- 34 -

Chapter 4. Future Plans
Development on this component is delayed resulting from the lack of documentation from the central group. 4.2 Access Control The control system will be operated by various groups of users during detector operation, most notably – shift crews, HV experts, DCS experts etc. As different users have different level of understanding on the control system, they should not be allowed to access all components of the system unrestricted. It is necessary to define a set of operation privileges for different group for users of different level, and this should include protection on some actions/settings with user password etc. An Access Control tool will be provided in the Framework for the purpose and there is a prototype release in the current Framework, but its performance is not satisfactory. Full development on this component will be carried out as soon as a complete tool is released. 4.3 Electronic Log Book Currently the only “logs” in the HV system are the PVSS runtime database and the alarm record. From the operation experience of the OPAL detector, those log information is far from enough, a robust log book should be able to take full record of the detector information throughout the operation period, these should include record of user commands, user comment as well as alarms with their locations etc., and those information should be easy to be retrieved and organised. An electronic log book will be specifically designed for the CMS experiment and it will be available in the summer (according to the central DCS group). Depend on its specification, it may be completely integrated into the central DCS or it may have a fraction integrated in the endcap HV system. 4.4 System Integration The endcap HV system will finally be integrated into the CMS central DCS, but it may be a long way to go since the construction of the other endcap control system is yet to begin. However the barrel components of the DCS was integrated during a Test Beam recently and it was fairly successful. Therefore a trial integration is planned in June, the connection and the behaviour of the HV system with the central system will then be fully tested.
The integration requires a Distributed Manager (DM) in the project Console, but there is already an existing DM, as the project was created as a Distributed Project. The integration at the PVSS level is straight forward, it is done by adding the following script in the project config file:
[general] distributed = 1 [dist]
- 35 -

Chapter 5. Operation Instruction
distPeer = "Pc1" 1 #Connect to Pc1’s system, numbered 1 distPeer = "Pc2" 2 #Connect to Pc2’s system, numbered 2 distPeer = "Pc3" 3 #Connect to Pc3’s system, numbered 3
where in practice “Pc1” etc. will be the actual PC names. In principle, up to 256 PCs can be connected to form a “distributed cluster”. No setting need to be done for the FSM integration, as long as the systems are connected at the PVSS level, the FSMs are integrated automatically. However, as mentioned before, in order that the state/command transition can function properly, the state/command definitions in different sub-systems need to be consistent, otherwise a “translation” Control Unit have to be added (like the QuadrantNode in the HV system). There are also some other issues need to be planned carefully. For example, the High Voltage system may need to communicate with the Low Voltage or the other safety systems to create cross-system interlocks. This is done via direct communication between the DPs in two or more systems, and the sub-system developers need to work together to ensure the connections are set up properly. Chapter 5. Operation Instruction
Figure 5.1 Master Panel
- 36 -

Chapter 6. Hardware Test Results
The normal operation procedure is: 1. Start the project from PVSS Project Administrator; 2. In the FSM view in DEN, choose navigator mode and click on the
ECAL_HV_EE node to open the associated FSM Operation Panel, which is the Master Panel;
3. All the normal operation functionalities are accessible from the Master Panel (Figure 5.1).
As can be seen the Master Panel can be separated into six main sections. Section 1, 2 are parts of the FSM tree structure and it is where all the commands will be sent from. The system alarm summary can also be found in section 1. Section 3 monitors the OPC connection status and either LED turning red mean the system will lost control over hardware. Details of the primary channels can be found in section 4, which include the runtime/historical reading of the current/voltage, alarm types, hardware location etc. Section 5 contains the summarised status of the quadrants as well as the extra channels information. The crate details can be viewed from Section 6. Full details of the system operation can be found in the User’s Manual [15], which is written in conjunction with the PVSS project. The user’s manual is very important, as the experience in the previous experiments suggests a good documentation is necessary to guarantee a fluent and reliable operation. The Framework is not yet finalised, with many components still being developed and debugged, and this process is not envisaged to end before September, when the development on this HV system project will be ended. Therefore the maintenance and modification instructions, with examples on some scenarios, are also added into the User’s Manual to ease the possible future development by another system developer. Chapter 6. Hardware Test Results A CAEN SY1527 crate with a A1821P board was used for the system testing. The board was placed in slot 03 in the crate (as board was initially set to 03 in PVSS, see Chapter 3.2). The crate was connected to the RAL Ethernet with a static IP address in order that it can be connected to the OPC server. The crate “name” in the server was given as “crateEM”, hence the system components corresponding to the endcap EM would be active. As there was only one crate it was not possible to test endcap EM and EP simultaneously, since they are designed to be supplied by two crates. However, as the EP components are nearly identical to those of EM, with the only difference being the parameters containing “EM” replaced by “EP”, testing the EM component also gives the behaviour of the EP. The following aspects was tested:
1. Operation under normal condition 2. Operation with alarm condition 3. Long term operation behaviour 4. System flexibility
- 37 -

Chapter 6. Hardware Test Results
The very normal operation is just ramping the channel voltages up and down, and monitoring the system status, these all went fluently: connections between OPC client-server and server-hardware were both shown to be active, settings on the device parameters received correct respond from hardware, and the software was capable to drive the hardware devices to the desired states and to acquire the device data to visualise them correctly in the user panels. Testing with alarm condition was carried out by deliberately forcing the hardware into error states, e.g. Under Current, the system responded with the correct alarm types and locations, and it is easy to access from clear indications in user interfaces. Not all the alarm conditions can be deliberately tested, for it is impossible to set the crate to the “Power Fail” condition etc. The rest of the alarm conditions were simulated using a CERN provided simulator, and they were all correctly responded and indicated. Interlock condition was also tested by toggling the interlock switch on the crate. The software system showed the correct interlock indication, the corresponding voltages were ramped down at the maximum rate and were no longer controllable from the software, exactly the way they are expected to behave. Over two weekends the crate was left on and automatically controlled by the PVSS system, which sent commands to toggle the “switch on/off” hourly, to test the long term reliability and behaviour of the system. Data was collected via archives and displayed in the channel trendings (Figure 6.1), the result turned out to be satisfactory, every channel in the system responded to the commands correctly and the connection status remained stable over the whole period. Different archives were also used in the test to compare the resolutions and hard disc consumptions. Day Archive was found to be under performed in such an operation frequency. But it is not a major concern since the operation frequency was deliberately increased in the testing in order to push the system to the “limit”.
Figure 6.1 A trend of archived voltage readings (single channel)
- 38 -

Chapter 7. Discussion
The flexibility of the system is tested by changing board slot. The addresses of the OPC items varies with their hardware representatives’ locations in the crate/board, whenever the hardware location change the OPC item addresses also change. Since the PVSS DPEs need to be connected to the right OPC items in order to operate the hardware, modifications need to be done to the system. Test result showed that modification can be easily done in the Hardware View of DEN alone, by cloning the old board setup to the new slot, and deleting the old settings, which can be finished within minutes. It has proven that using the aliases instead of directly referring to the DPEs in the panel was the correct decision, otherwise the parameters in the Domain Specific Panels also need to be changed, and that involves complicated script modifications Chapter 7. Discussion 7.1 Operation: Pros: The tests showed fairly positive results on the system operation –
The Master Panel gives a logical layout of the overall endcap system, access to the required functionalities are simple from the system Master Panel and the other sub-domain panels, often aided by dynamic indicators. The complexity of system developments is shielded from the system users by the simple user interfaces, and one do not need to have much knowledge of PVSS in order to operate the HV system, thus the objective of maximum user friendliness is achieved.
The software system is capable to acquire all useful information from
hardware devices and display them in the most easily accessible manner. The hardware device can be driven properly to the desired states. For alarm
generating and handling, the custom-designed indicators can point users to the alarm origin and indicate the correct alarm types.
Interlock actions are automatically triggered in potentially damaging condition
to protect the detector hardware.
Easy data storage and retrieval using Archive Managers and panel trendings.
The system is also shown to be flexible under hardware changes and its long term behaviour is stable and satisfactory, thus the maximum reliability requirement is achieved.
Cons: However, some negative results were also exposed -
FSM is not stable enough: sometime the system is unable to initialise the FSM tree, or the FSM control can be lost without any obvious reason, but the problem disappears after the project restart. This problem also existed for the
- 39 -
Chapter 7. Discussion
barrel system during the test beam, so it is likely to be a bug that need to be fixed in the future Framework releases.
There is no where to store log data such us user’s comments and system
description. This feature is essential since the system experts will not always be available during detector operation, and the shift crews may need to keep a record of the abnormal system state on a log book where the expert can find the time stamp of the error and the shift crew’s comment at a later stage. The implementation of this feature can only start after the release of the CMS electronic Log Book.
Insufficient alarm record: the current record only shows the type, time and
location of alarms, and there is no way to mix the alarm with the command records in a same table in time order where the commands may be found to be the cause of alarms.
There is no access protection at the moment, it is potentially dangerous to the
hardware if a user set the hardware parameters mistakenly. The protection will be implemented when the Access Control tool is available.
OPC only work on Windows platform. Infamous for its instability, there is still
fear that the windows system may not be able to cope with the 24-hour non-stop operation over a long period.
7.2 Development: In general the components and guidelines provided by the JCOP Framework greatly reduced the development effort, but the implementation process also suffered from the imperfection of the Framework. The major problem is the lack of development documentations. The components of the Framework is often provided in the form of discrete panels and script functions, but to fully employ the functionalities one need to know at least the connections between them. The Framework developers frequently need to be consulted directly in order to use the components properly. Another main problem is the software bugs. There had been bugs in every Framework release and they could sometime block the development completely. There are currently over six thousand identified bugs as shown on the Framework development webpage, and depending on their severity they may not all be fixed at the end. For that reason the development on the control system has to be carefully planned to avoid the bugs as much as possible. Problems and suggestions concerning the Framework development are often discussed with the Framework developers, mostly via emails. The exchange of ideas on how the experiment operation system should be developed turned out to be supportive for both sides: on the one hand the Framework group is more aware of what the demands from system users and developers are, and on the other the
- 40 -

Chapter 8. Summary
acceptance in certain areas of Framework improvement benefits the HV system’s development. Chapter 8. Summary The core of the software HV Control and Monitoring System is designed and constructed, with the overall requirements of maximum reliability and user friendliness achieved. The current implementations have been tested with actual hardware devices and satisfactory results are obtained. The system is capable to acquire data from hardware devices and use them for supervision purpose, it also provides the functionalities to set system parameters and to drive the hardware to the desired states. It is able to generate system alarm by evaluating device status and execute actions to automatically protect the experimental devices from damage. The user interfaces are designed to hide the complexity of the system from operators. However, more components still need to be added to the current implementations, to increase the capability of system configuration data storage and retrieval, user privilege control, and the overall logging system. The integration of the HV system into the CMS central DCS is planned in a near future.
- 41 -

Appendix A – Tables Table 1: FwCaenChannel Datapoint Type Structure
DPT Sub-folders Elements Type Description
.OvC boolean Over Current
.OvV boolean Over Voltage
.Trip boolean Channel Tripped
.UnC boolean Under Current
.UnV boolean Under Voltage
.calibrationError boolean Hardware Calibration Error
.channelPresent boolean Channel Being Used
.externalDisable boolean Channel Disabled Externally
.ecternalTrp boolean Channel Tripped Externally
.iMon float Runtime Current Monitoring Value
.isOn boolean ON/OFF Status
.kill boolean Channel is Killed
.overHvMax boolean Being Voltage Limit
.overVoltageProtection boolean Channel Off due to Over Voltage Protection
.powerFail boolean Hardware Power Supply Failure
.rampingDirection integer Turning On/Off
.status bit Summary Status of the Channel
.temperatureError boolean Temperature Out of Operation Range
.unplugged boolean Hardware Unplugged
FwCaenChannel
actual (Output from HW)
.vMon float Runtime Voltage monitoring Value
- 42 -

.i0 float Operation Current Value 0
.i1 float Operation Current Value 1
.onOff boolean Switch On/Off
.rDwn float Voltage Ramp Down Rate
.rUp float Voltage Ramp Up Rate
.tripTime integer Wait Time to Trip Channel in Case of OvC
.v0 float Operation Voltage Value 0
.v1 float Operation Voltage Value 1
settings (Input to HW)
.vMaxSoftValue float Maximum Software Settable Voltage Value .model string Channel Model Name
.i0 float Operation Current Value 0
.i1 float Operation Current Value 1
.onOff boolean Switch On/Off
.rDwn float Voltage Ramp Down Rate
.rUp float Voltage Ramp Up Rate
.tripTime integer Wait Time to Trip Channel in Case of OvC
.v0 float Operation Voltage Value 0
.v1 float Operation Voltage Value 1
readBackSettings (Hardware Confirmation of Settings)
.vMaxSoftValue float Maximum Software Settable Voltage Value
- 43 -

Table 2: State/Action definitions and device connections of Device Unit type FwCaenChannelStd State Action(s) DPE connected Value Class
State: actual.status 1 ON SWITCH_OFF
Action: settings.onOff 1 PHYSICS
State: actual.status 0 OFF SWITCH_ON Action: settings.onOff 0
OFF
SWITCH_ON State: actual.status 3 RAMPING_UP
SWITCH_OFF Action: settings.onOff 0,1 NOT_OK
SWITCH_ON State: actual.status 5 RAMPING_DOWN
SWITCH_OFF Action: settings.onOff 0,1 NOT_OK
OVER_CURRENT actual.status 9 WARNINGOVER_VOLTAGE actual.status 17 WARNINGUNDER_VOLTAGE actual.status 33 WARNINGEXTERNAL_TRIP actual.status 65 ERROROVER_HVMAX actual.status 129 ERROREXTERNAL_DISABLE actual.status 257 ERROR
State: actual.status 513 INTERNAL_TRIP RECOVER Action: settings.onOff 1
ERROR
CALIBRATION_ERROR actual.status 1025 ERRORUNPLUGGED actual.status 2049 ERRORUNDER_CURRENT actual.status 4097 WARNINGOVER_V_PROTECTION actual.status 8193 ERRORPOWER_FAIL actual.status 16385 ERRORTERMPERATURE_ERROR actual.status 32769 ERROR
- 44 -

Table 3: State Transitions and Actions of Device Units Type DCSNode.
State Actions State Transitions
PHYSICS SWTICH_ON
when ( $ANY$FwCHILDREN in_state ERROR ) move_to ERROR when ( $ANY$FwCHILDREN in_state WARNING ) move_to WARNING when ( $ANY$FwCHILDREN in_state NOT_OK ) move_to NOT_OK when ( $ALL$FwCHILDREN in_state OFF ) move_to OFF
OFF SWTICH_ON
when ( $ANY$FwCHILDREN in_state ERROR ) move_to ERROR when ( $ANY$FwCHILDREN in_state WARNING ) move_to WARNING when ( $ANY$FwCHILDREN in_state NOT_OK ) move_to NOT_OK when ( $ALL$FwCHILDREN in_state ON ) move_to PHYSICS
NOT_OK SWTICH_ON SWITCH_OFF
when ( $ANY$FwCHILDREN in_state ERROR ) move_to ERROR when ( $ANY$FwCHILDREN in_state WARNING ) move_to WARNING when ( $ALL$FwCHILDREN in_state OFF ) move_to OFF when ( $ALL$FwCHILDREN in_state ON ) move_to PHYSICS
WARNING when ( $ANY$FwCHILDREN in_state ERROR ) move_to ERROR when ( $ALL$FwCHILDREN in_state OFF ) move_to OFF when ( $ALL$FwCHILDREN in_state ON ) move_to PHYSICS
ERROR RECOVER when ( $ALL$FwCHILDREN in_state OFF ) move_to OFF when ( $ALL$FwCHILDREN in_state ON ) move_to PHYSICS
Table 4: State Transitions and Actions of Control Unit type QuadrantNode.
State Actions State Transitions
PHYSICS SWTICH_ON
when ( ( $ANY$FwCHILDREN in_state UNPLUGGED ) or ( $ANY$FwCHILDREN in_state EXTERNAL_TRIP ) or ( $ANY$FwCHILDREN in_state EXTERNAL_DISABLE ) or ( $ANY$FwCHILDREN in_state INTERNAL_TRIP ) or ( $ANY$FwCHILDREN in_state CALIBRATION_ERROR ) or ( $ANY$FwCHILDREN in_state OVER_V_PROTECTION ) or ( $ANY$FwCHILDREN in_state POWER_FAIL ) or ( $ANY$FwCHILDREN in_state TEMPERATURE_ERROR ) or ( $ANY$FwCHILDREN in_state OVER_HVMAX ) ) move_to ERROR when ( ( $ANY$FwCHILDREN in_state OVER_CURRENT ) or ( $ANY$FwCHILDREN in_state OVER_VOLTAGE ) or ( $ANY$FwCHILDREN in_state UNDER_CURRENT ) or ( $ANY$FwCHILDREN in_state UNDER_VOLTAGE ) ) move_to WARNING when ( ( $ANY$FwCHILDREN in_state RAMPING_UP ) or ( $ANY$FwCHILDREN in_state RAMPING_DOWN ) ) move_to NOT_OK when ( $ALL$FWCHILDREN in_state OFF ) move_to OFF
- 45 -
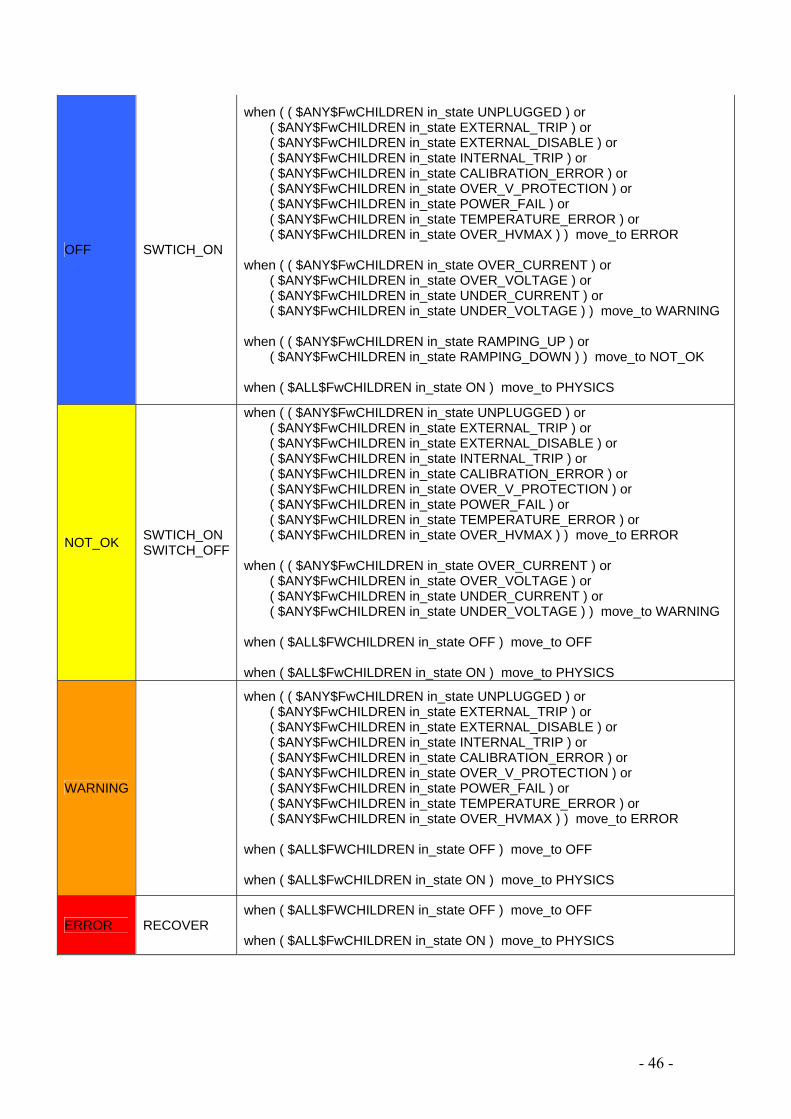
OFF SWTICH_ON
when ( ( $ANY$FwCHILDREN in_state UNPLUGGED ) or ( $ANY$FwCHILDREN in_state EXTERNAL_TRIP ) or ( $ANY$FwCHILDREN in_state EXTERNAL_DISABLE ) or ( $ANY$FwCHILDREN in_state INTERNAL_TRIP ) or ( $ANY$FwCHILDREN in_state CALIBRATION_ERROR ) or ( $ANY$FwCHILDREN in_state OVER_V_PROTECTION ) or ( $ANY$FwCHILDREN in_state POWER_FAIL ) or ( $ANY$FwCHILDREN in_state TEMPERATURE_ERROR ) or ( $ANY$FwCHILDREN in_state OVER_HVMAX ) ) move_to ERROR when ( ( $ANY$FwCHILDREN in_state OVER_CURRENT ) or ( $ANY$FwCHILDREN in_state OVER_VOLTAGE ) or ( $ANY$FwCHILDREN in_state UNDER_CURRENT ) or ( $ANY$FwCHILDREN in_state UNDER_VOLTAGE ) ) move_to WARNING when ( ( $ANY$FwCHILDREN in_state RAMPING_UP ) or ( $ANY$FwCHILDREN in_state RAMPING_DOWN ) ) move_to NOT_OK when ( $ALL$FwCHILDREN in_state ON ) move_to PHYSICS
NOT_OK SWTICH_ON SWITCH_OFF
when ( ( $ANY$FwCHILDREN in_state UNPLUGGED ) or ( $ANY$FwCHILDREN in_state EXTERNAL_TRIP ) or ( $ANY$FwCHILDREN in_state EXTERNAL_DISABLE ) or ( $ANY$FwCHILDREN in_state INTERNAL_TRIP ) or ( $ANY$FwCHILDREN in_state CALIBRATION_ERROR ) or ( $ANY$FwCHILDREN in_state OVER_V_PROTECTION ) or ( $ANY$FwCHILDREN in_state POWER_FAIL ) or ( $ANY$FwCHILDREN in_state TEMPERATURE_ERROR ) or ( $ANY$FwCHILDREN in_state OVER_HVMAX ) ) move_to ERROR when ( ( $ANY$FwCHILDREN in_state OVER_CURRENT ) or ( $ANY$FwCHILDREN in_state OVER_VOLTAGE ) or ( $ANY$FwCHILDREN in_state UNDER_CURRENT ) or ( $ANY$FwCHILDREN in_state UNDER_VOLTAGE ) ) move_to WARNING when ( $ALL$FWCHILDREN in_state OFF ) move_to OFF when ( $ALL$FwCHILDREN in_state ON ) move_to PHYSICS
WARNING
when ( ( $ANY$FwCHILDREN in_state UNPLUGGED ) or ( $ANY$FwCHILDREN in_state EXTERNAL_TRIP ) or ( $ANY$FwCHILDREN in_state EXTERNAL_DISABLE ) or ( $ANY$FwCHILDREN in_state INTERNAL_TRIP ) or ( $ANY$FwCHILDREN in_state CALIBRATION_ERROR ) or ( $ANY$FwCHILDREN in_state OVER_V_PROTECTION ) or ( $ANY$FwCHILDREN in_state POWER_FAIL ) or ( $ANY$FwCHILDREN in_state TEMPERATURE_ERROR ) or ( $ANY$FwCHILDREN in_state OVER_HVMAX ) ) move_to ERROR when ( $ALL$FWCHILDREN in_state OFF ) move_to OFF when ( $ALL$FwCHILDREN in_state ON ) move_to PHYSICS
ERROR RECOVER when ( $ALL$FWCHILDREN in_state OFF ) move_to OFF when ( $ALL$FwCHILDREN in_state ON ) move_to PHYSICS
- 46 -

Appendix B - Figures Figure 1. PVSS Project Administrator
Figure 2. PVSS Console
Figure 3. JCOP Framework Device Editor Navigator
- 47 -

Figure 4. PVSS Graphical Editor
Figure 5. PVSS Log Viewer
- 48 -

Appendix C – Scripts Script 1. QuadrantNode State Transition FwCaenChannelStd_valueChanged( string domain, string device, int actual_dot_status, string &fwState ) { if (actual_dot_status == 0) { fwState = "OFF"; } else if (actual_dot_status == 1) { fwState = "ON"; } else if (actual_dot_status == 3) { fwState = "RAMPING_UP"; } else if (actual_dot_status == 5) { fwState = "RAMPING_DOWN"; } else if (actual_dot_status == 9) { fwState = "OVER_CURRENT"; } else if (actual_dot_status == 17) { fwState = "OVER_VOLTAGE"; } else if (actual_dot_status == 33) { fwState = "UNDER_VOLTAGE"; } else if (actual_dot_status == 65) { fwState = "EXTERNAL_TRIP"; } else if (actual_dot_status == 129) { fwState = "OVER_HVMAX"; } else if (actual_dot_status == 257) { fwState = "EXTERNAL_DISABLE"; } else if (actual_dot_status == 513) { fwState = "INTERNAL_TRIP"; } else if (actual_dot_status == 1025) { fwState = "CALIBRATION_ERROR"; } else if (actual_dot_status == 2049) { fwState = "UNPLUGGED"; } else if (actual_dot_status == 4097) { fwState = "UNDER_CURRENT"; } else if (actual_dot_status == 8193) { fwState = "OVER_V_PROTECTION"; } else if (actual_dot_status == 16385)
- 49 -

{ fwState = "POWER_FAIL"; } else if (actual_dot_status == 32769) { fwState = "TEMPERATURE_ERROR"; } } Script 2. Bar Widget //Function (NoName)_EventInitialize() main() { makeDynString("$dpe_value:" + dpAliasToName("ECAL_HV_EE/ECAL_HV_"+$sCrate+"/ECAL_HV_"+$sCrate+$sQuad+"/"+$sChannel)+"actual.vMon"); } //Function Text1_EventInitialize() main() { EP_textFieldIn(); } EP_textFieldIn() { dyn_errClass err; string dp1; dp1 = dpAliasToName("ECAL_HV_EE/ECAL_HV_"+$sCrate+"/ECAL_HV_"+$sCrate+$sQuad+"/channel"+$sChannel); if( !dpExists(dp1 +"actual.vMon")) { setValue("", "color", "_dpdoesnotexist"); return; } dpConnect("EP_textFieldInCB", dp1 + "actual.vMon"); err = getLastError(); if (dynlen(err) > 0) setValue("", "color", "_dpdoesnotexist"); } EP_textFieldInCB(string dp, float fNewValue) { setValue("", "text", dpValToString(dp, fNewValue, TRUE) ); } // SimpleCtrlScript {EP_textFieldIn} // DP {CMS_ECAL_HV:CAEN/crateEM/board"+$nBoard+"/channel1.actual.vMon} // DPConfig {:_online.._value} // DPType {float} // UseDPUnit {TRUE} // UseDPFormat {TRUE} // SimpleCtrlScriptEnd {EP_textFieldIn} //Function Text2_EventInitialize() main() { string name1, name2;
- 50 -

name1 = dpAliasToName("ECAL_HV_EE/ECAL_HV_"+$sCrate+"/ECAL_HV_"+$sCrate+$sQuad+"/channel"+$sChannel1); name2 = dpAliasToName("ECAL_HV_EE/ECAL_HV_"+$sCrate+"/ECAL_HV_"+$sCrate+$sQuad+"/channel"+$sChannel2); dpConnect("updateCallback", name1 + "actual.isOn", name2 + "actual.isOn", dpAliasToName("ECAL_HV_EE/ECAL_HV_"+$sCrate+"/ECAL_HV_"+$sCrate+$sQuad+"/channel"+$sChannel)+"actual.status"); this.text = $sAD; } updateCallback(string dpe1, int isOn1, string dpe2, int isOn2, string dpe3, int status) { int error; int on; error = (status!=0)&&(status!=1)&&(status!=3)&&(status!=5); on = (isOn1)&&(isOn2); if (error > 0) setValue("", "foreCol", "alertCamUna"); else if (on) setValue("", "foreCol", "green"); else setValue("", "foreCol", "Black"); } Script 3. LED Widget main() { string name1 = dpAliasToName("ECAL_HV_EE/ECAL_HV_"+$sCrate+"/ECAL_HV_"+$sCrate+$sQuad+"/channelA"); string name2 = dpAliasToName("ECAL_HV_EE/ECAL_HV_"+$sCrate+"/ECAL_HV_"+$sCrate+$sQuad+"/channelD"); dpConnect("alarmColour", $sCrate+$sQuad+"set1.alarm", $sCrate+$sQuad+"set2.alarm", $sCrate+$sQuad+"set3.alarm", $sCrate+$sQuad+"set4.alarm", $sCrate+$sQuad+"set5.alarm", name1+"actual.status", name2+"actual.status", $sCrate+$sQuad+"set1.exist", $sCrate+$sQuad+"set2.exist", $sCrate+$sQuad+"set3.exist", $sCrate+$sQuad+"set4.exist", $sCrate+$sQuad+"set5.exist"); } alarmColour(string dpe1, int a1, string dpe2, int a2, string dpe3, int a3, string dpe4, int a4, string dpe5, int a5, string dpe6, int status1, string dpe7, int status2,
- 51 -

string dpe8, int e1, string dpe9, int e2, string dpe10, int e3, string dpe11, int e4, string dpe12, int e5) { int error; int sum1; int sum2; int on; sum1 = (status1!=0)&&(status1!=1)&&(status1!=3)&&(status1!=5); sum2 = (status2!=0)&&(status2!=1)&&(status2!=3)&&(status2!=5); error = sum1 + sum2; on = (status1)&&(status2); if (((a1>1)||(a2>1)||(a3>1)||(a4>1)||(a5>1)) || (error>0)) { setValue("", "backCol", "alertCamUna"); } else if ( ((e1+e2+e3+e4+e5>0)&&(((a1>0)||(a2>0)||(a3>0)||(a4>0)||(a5>0)) && (on))) || ((e1+e2+e3+e4+e5<1)&&(((a1>0)||(a2>0)||(a3>0)||(a4>0)||(a5>0)) || (on))) ) { setValue("", "backCol", "green"); } else { setValue("", "backCol", "Grey"); } } Script 4. Quadrant “Add” button main() { int n,x,y; string sCrate; string sQuad; getValue("ComboBox1", "text", n); getValue("ComboBox2", "text", sCrate); removeSymbol (myModuleName(), myPanelName(), "bar"+n); getValue("Frame"+n, "position", x, y); addSymbol( myModuleName(), myPanelName(), "objects/STD_INDICATORS/barAD_layer2.pnl", "bar"+n, makeDynString("$sChannel1:" + "A"+n, "$sChannel2:" + "D"+n, "$sCrate:" + sCrate, "$sQuad:" + $sQuad, "$b_IBit:", "$b_PvRange:", "$b_showAlert:", "$dpe_value:"), x+6, y-130, 0, 1, 1); if (dpExists("crate"+sCrate+"/Quadrant"+$sQuad+"/set"+n)) {
- 52 -

dpDelete("crate"+sCrate+"/Quadrant"+$sQuad+"/set"+n, "Extra_Channel"); } dpCreate("crate"+sCrate+"/Quadrant"+$sQuad+"/set"+n, "Extra_Channel"); dpSet("crate"+sCrate+"/Quadrant"+$sQuad+"/set"+n+".Set", n, "crate"+sCrate+"/Quadrant"+$sQuad+"/set"+n+".Quad", $sQuad, "crate"+sCrate+"/Quadrant"+$sQuad+"/set"+n+".Crate", sCrate, "crate"+sCrate+"/Quadrant"+$sQuad+"/set"+n+".Channel1", "A"+n, "crate"+sCrate+"/Quadrant"+$sQuad+"/set"+n+".Channel2", "D"+n); dpSet($sCrate+$sQuad+"set"+n+".sChannel1", "A"+n, $sCrate+$sQuad+"set"+n+".sChannel2", "D"+n, $sCrate+$sQuad+"set"+n+".exist", true); setValue("Frame"+n, "foreCol", "black"); } Script 5. Quadrant “Delete” Button main() { int n,x,y; string sCrate, sQuad; getValue("ComboBox7", "text", n); removeSymbol (myModuleName(), myPanelName(), "bar"+n); if (dpExists("crate"+$sCrate+"/Quadrant"+$sQuad+"/set"+n)) { dpDelete("crate"+$sCrate+"/Quadrant"+$sQuad+"/set"+n, "Extra_Channel"); } dpSet($sCrate+$sQuad+"set"+n+".exist", false); dpSet($sCrate+$sQuad+"set"+n+".alarm", 0); setValue("Frame"+n, "foreCol", "grey"); }
- 53 -

Glossary: Architecture: The description of a system in term of a number of well defined
components, hardware and software, and their interactions. Each component provides well-defined functionality and the interactions between them are described in terms of a series of interfaces.
Archive: Long term storage of information. The information stored in the archive is no longer available for immediate online retrieval but rather must be firs re-loaded into the online system.
BaBar: An electron-positron detector at SLAC.
CAEN: HV hardware manufacturer.
CERN: European Organization for Nuclear Research, the world's largest particle physics centre.
Compact Muon Solenoid (CMS): A general purpose detector being built for LHC accelerator.
Configuration Database: The database containing all the info required to configure the Control System. This will typically contain info such as a definition of all Device-Types and Devices, their structure, names, associated hardware addresses, alarm limits, behaviour and graphics.
DAQ: Data Acquisition System, it is used to acquire the physics data and to build event data sets. The volume of data as well as the event rate are very high and therefore specialised hardware and software are required.
Detector Control System (DCS): A subset of Experiment Control System and provides the monitoring and control of the detector hardware devices, e.g. High Voltage, Low Voltage, Pressure, Temperature…
DELPHI: One of the four detectors at LEP.
Device Editor Navigator (DEN): The main interface to the JCOP framework.
ECAL: Electromagnetic Calorimeter.
Field Bus: A Field Bus is a data transport medium typically used in the domain of process control for connecting field Devices to PLCs or SCADA systems.
Finite State Machine (FSM): A FSM is usually a software component which processes a STD. It is an Algorithm which can, on an Event, change the State of a system by making Transition. A FSM may be though of as a generic, data-driven mechanism for modelling the functionality of a piece of equipment or a sub-system.
JCOP: Experiments’ Joint Control Project,
LEP: Large Electron-Positron Collider, the last generation of collider at CERN.
LHC: Large Hadron Collider, the most powerful particle collider being built at CERN.
- 54 -
Log: A chronological store for info such as Alarms, User Actions and process data. The data is written to a log file and is available for subsequent online retrieval.
OLE for Process Control (OPC): An engineering software standard designed to provide Factory Automation applications with easy access to industrial plant data through a robust, high-speed communication infrastructure. At the heart of the OPC specification is a client/server model where the OPC server provides a standard interface to the OPC objects, allowing client applications to control devices and manage device data in a generic fashion. OPC-enabled applications can communicate with any OPC server, whether that server represent a sensor, valve, or programmable logic controller. Microsoft's OLE/COM and DCOM technologies are used to realise the client/server model.
Parameter: A parameter is any variable whose value may be modified. There are several types of parameters and these are Configuration, Derived, Measured, Output and User Input Parameters.
PLC: Programmable Logic Controller.
Protocol: An agreement about how and in what format data should be transmitted, especially across networks. Low level protocols define the electrical and physical standard to be observed, and deal with the transmission and error detection and correction of the bit stream. High level protocols define an agreed method of exchanging information between components.
PVSS: Process Visualization and Control System developed by ETM.
Script Library: A file containing the different functions and store in a specific directory of a PVSS project.
SLAC: Stanford Linear Accelerator Centre.
SMI++: State Management Interface, the toolkit for the JCOP Framework FSM component.
Supervisory Control And Data Acquisition (SCADA): A software tool used for developing applications for the supervisory and control of field Devices. The field Devices are usually connected to the SCADA system through intermediate intelligent process controllers, e.g. PLCs.
System developer: The person who is responsible for some part of the control system development.
Trend: A Graphical representation of a time history plot of one or more parameters.
- 55 -

Reference:
Book / Documentations: [1] CAEN, 2004, “Mod.A1821/A1821H High Voltage Board Manual Rev.2”,
CAEN Technical Information Manual.
[2] CAEN, 2004, “Mod.SY1527 Universal Multichannel Power Supply System User’s Manual Rev.6”, CAEN User’s Manual.
[3] CAEN, 2003, “OPC Server for CAEN Power Supplies (Release 2.x)”, CAEN Technical Information Manual.
[4] CMS Collaboration, 1997, “CMS The Electromagnetic Calorimeter Project Technical Design Report”, CERN/LHCC 97-33.
[5] CMS ECAL Project Group, 2002, “CMS ECAL Sub-Project Specification”, DCS Version 1.0, CERN.
[6] CMS EE Collaboration, 2001, “Requirement for the HV power supplies for the CMS ECAL Endcap Version 1 – Draft 2”, EE/263/MJT/2001.
[7] CMS UK Collaboration, 2004, “The Compact Muon Solenoid (CMS) Detector”, Proposal 892.
[8] ETM AG, 2003, “PVSS II Basic Course”, ETM Austria.
[9] Gaspar, C., 2001, “Hierarchy Controls – Configuration & Operation”, CERN IT-CO.
[10] Ofierzynski, R., 2004, “CMS ECAL DCS High Voltage (HV) PVSS Software Help”, ETH Zurich.
[11] Ofierzynski, R., 2004, “Design of the PVSS-DCS Applications for the CMS ECAL High Voltage (HV) Subsystem”, ETH Zurich.
[12] Schmeling, S.M., 2004, “Joint PVSS & JCOP Framework Course”, CERN-JCOP-2004-016.
[13] Schmeling, S.M., 2003, “JCOP Framework Guidelines - Naming and Look-and-Feel Conventions”, CERN Framework Working Group.
[14] Schmeling, S.M., 2003, “PVSS Introduction for Newcomers”, CERN IT-CO.
[15] Xing, F., 2005, “CMS Endcap High Voltage PVSS System User’s Manual”, RAL, UK.
Conference Presentations: [16] Brown, R.M., 2004. “The status of the CMS Electromagnetic Calorimeter”,
LHC Days in Split, Croatia.
[17] Brown, R.M., 2002, “The VPT HV System”, EE EDR Workshop, CERN
[18] Dissertori, G., 2004, “ECAL Detector Control System”, CMS Electronic System Review, CERN.
- 56 -

[19] Dissertori, G., 2003, “ECAL Prototype DCS System Using PVSS”, CMS ECAL DCS meeting.
[20] Gaspar, C., 2004, “SMI++ - the Finite State Machine toolkit of the JCOP Framework”, LHCb DCS Meeting, CERN.
[21] Varela, J., 2004, “Overview of the DCS Systems”, CMS Annual Review, CERN.
[22] Varela, J., 2003, “DCS Status and Plans”, DCS Coordination Board, CERN.
- 57 -