design, fabrication, testing, and delivery of byt. h ...byt. h. holland and j. t. borzoni...
TRANSCRIPT

DESIGN, FABRICATION, TESTING, AND DELIVERY OFA SOLAR ENERGY COLLECTOR SYSTEM FOR RESIDENTIAL
HEATING AND COOLING
ByT. H. Holland and J. T. Borzoni
Distribution of this report is provided in the interest ofinformation exchange. Responsibility for the contentsresides in the author or organization that prepared it.
Prepared under Contract No. NAS8-31327 byHONEYWELL INC.
Energy Resources CenterMinneapolis, Minnesota
for
NATIONAL AERONAUTICS AND SPACE ADMINISTRATION
https://ntrs.nasa.gov/search.jsp?R=19770003695 2020-03-16T04:41:50+00:00Z

ABSTRACT
This report describes the development of a low-cost flat-plate solar energycollector for the heating and cooling of residential buildings.
The objective of the collector design effort was to produce a solar collectorcapable of meeting specified performance requirements, at the desired systemoperating levels, for a useful life of 15 to 20 years, and to do it at the minimumcost, given state-of-the-art materials and technology. The primary considera-tion was to minimize costs rather than to provide performance in excess of theminimum system requirements.
The rationale for the design method was based on identifying possible materialcandidates for various collector components and then selecting the componentswhich best meet the solar collector design requirements. The criteria usedto eliminate certain materials were: performance and durability test results,cost analysis, and prior solar collector fabrication experience.
The collector determined to be the best design candidate was1 a two-sheet spot-and-seam welded steel absorber housed in a molded paper product box. Thecollector cover could have either one or two sheets of double strength glassmounted in an extruded aluminum frame. The absorber surface had an ironoxide selective coating with an organic overcoat.
This collector was built and tested, showing both ease of assembly and acceptableperformance. It was discovered, however, that the overcoat material and theinner glass cover would not withstand the high stagnation temperature due to thesuperior insulation qualities of the housing. Two changes in the design aretherefore recommended. The selective.coating should be changed to black chromeand the cover glass should be tempered.
The total materials cost of the collector incorporating these recommended changesranges from $43. 93/m2 (4. 08/f t2) to $30. 69/m2 (2. 86/ft2), depending on productionvolume. Assembly costs should be fairly low due to collector simplicity.
Two recommendations are made regarding further development of the collectordesign. First, other overcoat materials for the iron oxide coating should be investi-gated to develop a coating which will increase absorptance into the . 90 plus rangewhile not raising the emittance to unacceptable levels, and yet still not degrade athigh temperature. Secondly, in light of the insulating and cost advantages to bederived from the use of the processed paper housing, further development activityis recommended, particularly in the areas of determining useful life and additivesfor extending useful life.
in Preceding page blank

TABLE OF CONTENTS
PageSUMMARY 1
STATEMENT OF THE PROBLEM 1
Scope o 1Requirements Analysis 2Design Objective 2
DESIGN PROGRAM / 2
Introduction 2Initial Design Activity 3Absorber Panel 4Absorber Coating 8Insulation 12Housing 14Cover System 19Interconnects 25Candidate Collector Designs. 26Cost Analysis of Candidate Designs 32Recommended Collector Design 38
FINAL COLLECTOR DESIGN DRAWINGS 41
PROCUREMENT, FABRICATION, AND ASSEMBLY 53
Parts List 53Fabrication , „ 56Cover Frame Assembly „ 57Collector Assembly 60
COLLECTOR PERFORMANCE 69
Test Plan „ 69Leak Test 69Indoor Test Facility 69Test Matrix 71Data Reduction 72Performance Test Results 72Utilization. 78
PRECEDING PAGE BLANK NOT FILMEEl

TABLE OF CONTENTS (CONCLUDED)
Page
OUTDOOR TESTING AT MARSHALL SPACE FLIGHT CENTER 82
CONCLUSIONS AND RECOMMENDATIONS 85
APPENDIX A - THERMAL DESIGN ANALYSIS 87Absorber Flow Tube Size and Spacing Considerations 87Effects of Cross Tube Geometry and Header Size 93Collector Cover To Absorber Panel Spacing Considerations 97
APPENDIX B - SELECTIVE ABSORBER COATING ANALYSIS 103Coating Description 103Supplementary Discussion 110
APPENDIX C - TRADE-OFF STUDIES 115Absorber Coating „ 115Cover System 118
APPENDIX D - HOUSING MATERIAL ANALYSIS 125Material Test Program. 125Material Test Program Details 127Box Material Analysis 137
VI

LIST OF ILLUSTRATIONS
Figure Page
1 Flat-Plate Solar Collector Assembly 3
2 Single Steel Sheet with Triangular Parallel Flow 6
3 Single Steel Sheet or Aluminum Sheet with Staked CircularSteel or Copper Tubes 6
4 Current Flat-Plate Collector Design with Larger Flow 6Passages
5 Selective Absorber - Two Glass Covers 12
6 Cross-Sectional View of Extrusion 18
7 Black Nickel Coated Aluminum Absorber - One and Two GlassCovers 20
8 Design I. - Folded Sheet Metal Box with U-Channel GlassSpacer and Aluminum Cover Bracket 29
9 Design II. - Folded Aluminum Box Sides with ExtrudedAluminum Cover Frame and Chipboard Bottom 30
10 Design III. - Pultruded Plastic Box and Cover Frame withChipboard Bottom 31
11 Design IV. - Processed Paper Box with ExtrudedAluminum Cover Frame 33
12 MSFC Single-Glass Collector Assembly 39
13 MSFC Double-Glass Collector Assembly 40
14 MSFC Single-Glass Collector Assembly 42
15 MSFC Double-Glass Collector Assembly 43
16 Box and Extruded Frame—Single-Glass 44
17 Extrusion - Single Glass 45
18 Absorber Bracket Extender - Single Glass 45
19 Box and Extruded Frame - Double Glass 46
20 Extrusion - Double Glass 47
21 Absorber Bracket Extender - Double Glass 47
vii

LIST OF ILLUSTRATIONS (CONTINUED)
Figure Page
22 Panel "A"—Absorber 48
23 Panel "B"—Absorber 49
24 Absorber Assembly 50
25 Absorber Bracket Assembly - Typical 51
26 Cover Frame Fastener 51
27 Absorber Bracket Base - Single and Double Glass 51
28 Glazing Seal 52
29 Connect Tube Grommet 52
30 Reflectance Curves for Iron Oxide Coating with and withoutOrganic Overcoat. 58
31 Anchor Clip and Absorber Bracket Detail 59
32 Glazing Spline is Fitted on Glass 61
33 Frame is Secured with Sheet Metal Screws 61
34 Weep Holes are Drilled in Housing 62
35 Insulation is Cut for Housing 62
36 Insulation is Cut to Allow for Absorber Bracket.............. 63
37 Absorber Bracket is Snapped into Place 63
38 Bracket is Clamped Securely to Housing 64
39 Absorber Panel is Placed in Housing 64
40 Absorber is Fastened to Nylon Brackets 65
41 Rubber Grommets are Placed in Position 65
42 Holes are Drilled Over Brackets 66
43 Cover Frame is Screwed to Housing 66
44 Thermocouple Locations (Iron Constantan) 67
45 Diagram of Indoor Collector Test Loop 70
viii

LIST OF ILLUSTRATIONS (CONCLUDED)
Figure Page
46 Performance Curve for Single-Cover MSFC SolarCollector 75
47 Performance Curve for Two-Cover Solar MSFC Collector ... 75
48 Comparison of MSFC and Well-Designed Flat-Plate SolarCollectors 77
49 Daily Collection Curve for Summer Cooling 79
50 Daily Collection Curve for Winter Heating 80
IX

LIST OF TABLES
Table Page
1 Properties of Coating Substrates Investigated 10
2 Insulation Candidates 15
3 Properties of Cover Materials 22
4 Solar Transmission of Selected Cover Materials 23
5 Plastic Solar Exposure Tests 24
6 Design I Cost Summary 34
7 Design II Cost Summary 35
8 Design III Cost Summary 36
9 Design IV Cost Summary 37
10 Solar Collector Parts List — Single Cover Collector 54
11 Solar Collector Parts List — Double Cover Collector 55
12 Test Matrix 71
13 Collector Test Data for MSFC Solar Collector with OneGlass Cover 73
14 Collector Test Data for MSFC Solar Collector with TwoGlass Covers 74
15 Daily Collector Performance Summary 78
16 Energy Collection Increase Comparison between SeveralCollector Configurations 81

DESIGN, FABRICATION, TESTING AND DELIVERYOF A SOLAR ENERGY COLLECTOR SYSTEM FOR
RESIDENTIAL HEATING AND COOLING
By T.H. Holland and J.T. Borzoni
Energy Resources CenterHoneywell, Inc.
SUMMARY
This is the final report describing the work performed for the NASA GeorgeC. Marshall Space Flight Center, Huntsville, Alabama, under Contract Num-ber NAS8-31327, "Design, Fabrication, Testing, and Delivery of a SolarEnergy Collector System for Residential Heating and Cooling. "
This report describes the development of a low-cost flat-plate solar energycollector for the heating and cooling of residential buildings.
STATEMENT OF THE PROBLEM
All collector designs described in the literature seem to suffer from the sametwo major problems: cost, and reliability or life expectancy. Most all collec-tors on the market and projected for the market have questionable life expect-ancies. Corrosion between the absorber plate and heat transfer fluid, degra-dation of the absorber coating, housing durability, and degradation and break-age of the transparent covers are the most frequent life problems.
Performance, currently not a problem to obtain, is extremely important inthat it, too, affects costs; that is, cost of the heat collected. For example,
.adding a selective black absorber coating and an anti-reflection coating to atwo-glass-cover collector will increase the projected costs by 24 percent,but the collector will collect some 45 percent more energy.
Maintenance, aesthetics, and ease of installation and repair also greatlyaffect the use of solar systems. The task of this program has been to de-sign a collector which satisfies the above criteria and is also cost-effective.

Requirements Analysis
The system requirements for the collector are those of the experimentalsolar conditioned "house" presently in operation at Marshall Space FlightCenter. Briefly, the system is an equivalent 232 m2 (2500 ft2) conven-tional, single family residential load using a collector array of 120 m2
(1300 ft ) to provide space heating and cooling. Cooling is provided bya water fired 10. 5 -kW (3 ton) ARKLA absorption air conditioner thatreq'uires an input flow of approximately 3. 8 £pm (1 gpm) of water at atemperature of 99°C to 110°C (210°F to 230°F). Operation of both heat-ing and cooling modes is from a 13600 -liter (3600 gallon) storage tank,with make-up heat provided by auxiliary conventional heaters. The pre-sent system is a single fluid (deionized water), two loop operation withthe collectors coupled to the system by stratification levels in the storagetank.
The operating requirements, as applied to the collector, are to providea nominal 122 kg/hr m2 (25 Ibm/hr ft2) flow of outlet water at 94-110°C(2010 _ 230°F), with a 120 m2 (1300 ft2) array. The design conditionsare to collect 1293 W/day m (410 Btu/day ft2) given an input of clear skyinsolation on 21 June at 34° 45' N latitude, assuming a 45° collector tilt „angle, a 16 kph (10 mph) wind, and an insolation level of 946 cosine* W/m(300 cosine* Btu/hr ft2), where*is the angle of incidence. The design am-bient temperature is 27°C (80°F). This represents a collection efficiency,
*)j , of 21. 6 percent, integrated over the design day.
Design Objective
The objective of the collector design effort is to produce a solar collectorcapable of meeting the performance requirements, at the desired systemoperating levels, for a useful life of 15 to 20 years, and to do it at theminimum cost, given state of the art materials and technology. The pri-mary consideration is to minimize costs rather than to provide perfor-mance in excess of the minimum system requirements. However, thecontractor interprets this to mean life cycle costs, rather than first costs,and designed the collector to minimize the costs per unit of heat flux de-livered over the life of the collector.
DESIGN PROGRAM
Introduction
The rationale for the design method is based on identifying possible mater-ial candidates for various collector components and then selecting the com-ponents which will best meet the solar collector design requirements. Thecriteria used to eliminate certain materials were: performance and dura-bility test results, cost analysis, and prior solar collector fabrication ex-perience.

Initial Design Activity
Based on our existing collector design experience and a re-examinationof available literature regarding various collector types, it is our con-tention that the design objectives can best be met by a conventional flatplate collector design of a configuration similar to that shown in Figure1; that is, a parallel-flow channel absorber with insulation behind andaround the edges of the absorber, a box-like housing to hold the absorberand insulation, and a cover or covers suspended above the absorber.
Figure 1. Flat-Plate Solar Collector Assembly
To generate a collector design of this type, the following component sec-tions were isolated:
• Absorber panel
• Absorber coating
• Insulation

• Housing
• Cover system
• Interconnects
Design requirements, design considerations, and accompanying initialcandidate materials or configurations for these six components are de-tailed in the following sections.
Absorber Panel
Design Requirements
The design requirements for the absorber panel are as follows:
• Operating temperature range up to 110°C (230°F)
• Maximum stagnation temperature of 232°C (450°F)
• Operating flow of 122 kg/hr-m2 (25 lbm/hr-ft2)5 2• Operating pressure of 1.7 x 10 nt/m (25 psi)
• Temperature-cycling endurance between -29°C and 121°C(-20°F and 250° F)
Design Considerations
Absorber plate designs should consider the following minimum factorsfor an effective collector configuration:
• Absorber plate thermal performance
• Life
• Operating pressures, flow distribution in large arrays, andpumping power
• Fabrication and material costs
These factors are not mutually compatible, and trade-off studies in de-sign have been necessary.
The initial preferred absorber panel candidates are presented below, fol-lowed by a discussion of each minimum factor for an effective configura-tion, covering what design approaches were taken to optimize the absorb-er plate design.

The initial absorber candidates were:
• Single steel sheet with triangular parallel flow (Figure 2)
• Single steel or aluminum sheet with staked circular steelor copper tubes (Figure 3)
• Current flat-plate collector design with larger flow passages(Figure 4)
The thermal performance analysis, as presented later in Appendix A,considers such design criteria as cross-tube size and spacing, absorb-er material and thickness, cross-tube flow rate and geometry, and head-er size.
Life. - To develop a reliable absorber (20 year life), considerationmust be given to structural integrity, corrosion resistance in variousenvironments, quality control during fabrication and installation, andgeneral operating conditions such as pressure and pressure fluctuations,type of circulating fluid, and operating temperature. In addition, anycoatings which must be applied should be economical to apply repeatablyand have a long life span.
Steel, copper, and aluminum are likely candidates for absorber platematerial. These plates can be homogeneous or formed from combina-tions of these materials. Each material has special properties whichare optimum for some design parameters.
Fabrication processes determine to some extent the service life of agiven absorber. Welding (spot or seam) of steel structures may leavecarbide precipitation in the weld area. This would magnify corrosioneffects, especially in "crevice" areas. Flexing of material due to thesystem's pressure fluctuations, coupled with the thinness of the material,may break the welded or bonded sections. Consideration has been givento fabricating collector plates on an assembly line basis with a minimumof individual components to minimize interconnects within the collectorplate and reduce fabrication errors. Fabrication of copper, steel, andaluminum tubing is a well defined process and is highly reliable from atolerance viewpoint.
Corrosion resistance of copper, aluminum, and steel to the operatingenvironments of absorber plates must be considered. The use of wateras a circulating fluid with the addition of ethylene glycol containing var-ious inhibitors and buffers at elevated temperatures must be recognizedfor its corrosion protection properties. Ethylene glycol degrades in suchservice and forms organic acids. The accompanying reduction in pH tendsto make the mixture more corrosive.
All components in the collector plate assembly were studied for galvaniccorrosion between absorber plate components and between the absorberand other system components. Aluminum components should be galvani-cally isolated from components made of other metals, which tend to pro-duce "heavy metal" ions. Otherwise the aluminum corrodes. This weighsheavily against using this metal as a fluid carrying element.

Triangular passage
I Backing plate
Typical cross section
Figure 2. Single Steel Sheet with Triangular Parallel Flow
Stake formedfrom sheet
TubeBacking plate
Typical cross section
Figure 3. Single Steel Sheet or Aluminum Sheet withStaked Circular Steel or Copper Tubes
Formed channel
Typical cross section
Figure 4. Current Flat-Plate Collector Designwith Larger Flow Passages

Operating Pressures and Flow Distribution. - Absorber plates opera-ting at temperatures in excess of 104°C (220°F) with water as the circu-lating fluid will require greater than atmospheric pressures. Addingethylene glycol raises the boiling point to 110°C (230°F) at atmosphericpressure, with a 50-50 water/glycol mixture.
Various flow channel configurations were analyzed for uniform flow dis-tribution in arrays of series and parallel connections with regard to pump-ing energy and thermal efficiency. The collector system (thermal design)analysis described in Appendix A illustrates the analysis conducted on thesteel panels designed and manufactured by the contractor. This analysisdetermined that channels of 1. 3 mm x 6. 4 mm (0. 050 x 0. 250-inch) wereoptimum from thermal and flow distribution standpoints; but, they appearnot to be optimum for corrosion and particulate contamination when used.
Fabrication and Material Costs. - Fabrication costs were a major fac-tor in the absorber plate design. Attention was given to designs which lendthemselves to automatic fabrication and testing. Material costs vary, butit is obvious that as little copper and aluminum should be used as is consis-tent with good thermal design. The design should also consider the ease ofinstalling the absorber plate into the collector assembly.
Material Candidates
The candidate materials evaluated include:
a. Internal-flow-tube type
1. Aluminum roll bond
2. Copper roll bond
3. Steel sheets spot- and seam-welded together
b. Tube-and-plate type
1. Copper tubes on copper plate
2. Copper tubes staked, welded, soldered, or adhesivelybonded to steel plate
3. Steel channels copper-brazed to steel plate
4. Stainless steel strips welded to steel plate

Nonmetallic absorber materials were considered. Various plastics ap-peared particularly attractive from a cost standpoint, but were generallyunable to withstand the operating temperatures, particularly the expect-ed stagnation temperature. Operating pressures are also a difficulty.It is felt that an extensive study program would be required to define amaterial, and several additional costly design techniques would have tobe employed to enable the use of a plastic absorber for the program'sapplication.
Design Trade-offs
Material choices for the absorber panel were limited to steel, alumi-num/copper and steel/copper combinations due primarily to temperatureconstraints. Olin Brass presently manufactures both aluminum and cop-per Roll-Bond absorber panels. The copper, while attractive from a cor-rosion standpoint, is quite costly: $43.06/m2 ($4. 00/ft2) for 0. 10-cm(0. 040-in) wall. The aluminum, while less costly, $7.86/m2 ($0. 73/ft2)for 0. 07-cm (0. 030-in) wall, is expensive to electroplate for a selectiveabsorber coating. It also can corrode, which has not yet been adequatelyexplored. The spot- and seam- welded steel absorber panels are rela-tively inexpensive, and also permit using iron oxide for an absorber coat-ing. The primary problem associated with the steel absorber panel de-signs is the development of a reasonable production process. There isalso a mild corrosion problem between the plate surfaces that must beaddressed. Fastening copper tubes to a steel plate is attractive becauseit practically eliminates the corrosion problem and still offers the use ofiron oxide. It does, however, present a definite process developmentproblem.
Recommended Design
The best choice for absorber material is steel, and the best associateddesign incorporates spot and seam welds. This assumes that a satisfac-tory production process can be developed. The design will make use ofthe thermal analysis in Appendix A to assure optimal absorber perform-ance.
Absorber Coating
Design Requirements
The design requirements for the absorber coating may be summarized asfollows:
• High solar absorptance
• Durability over collector life
• Temperature cycling endurance between -29°C and 121°C(-20°F and 250°F)
• Low emittance (desired but not required)
8

Design Considerations
The absorber coating for a flat plate collector may be either selective ornonselective. .If the collector application is solely for heating, then a non-selective coating might be preferable. Collector performance would beabout the same with either type coating at low temperatures, but the non-selective coating may be less costly and more durable. If the collectoris used for heating and cooling, then a selective coating would be pre-ferable. Increased collector performance will more than offset the high-er cost of high performance selective coatings.
The net amount of solar energy absorption depends on the optical surfaceproperties of the absorber panel. Solar absorptance values of up to 95percent can be achieved by simply blackening the absorber panel by paint-ing, oxidizing, or anodizing; however, these surfaces also tend to haveequally high emittance levels in the infrared, the wave length regionwhere energy is emitted from the plate.
An improved type of surface preparation is the selective black solar ab-sorber coating. This surface has a relatively high solar absorptance anda low infrared emittance. Most bare metals show roughly the behaviordesired. They are all quite reflective in the infrared near 10AI , butmuch less so in the solar region. However, their solar absorptance isnot strong enough to be used alone. The absorption of the metal can begreatly increased by overcoating it with a material with high absorptionin the solar region, but transparent in the infrared. The metal sub-strate "shows through" in the infrared, so the emittance is not greatlyincreased.
One technique used to produce a selective coating is to coat the metal sur-face with an optical interference coating. If a single layer coating is soused, the coating thickness is such that light in the solar region of thespectrum which is transmitted through the coating and reflected off themetallic substrate interferes destructively with light reflected off thefront surface of the coating. The coating thickness is minimal, approx-imately 0. lyU , so that infrared, light does not "see" the coating, and thehighly reflecting character of the metal substrate is retained.
Coating Candidates
Table 1 is a tabulation of selective coatings considered, including the ab-sorptance and emittance of the various coatings and some estimation ofthe coating durability. The cost figures are an estimate of potential massproduction costs, and do not represent firm data. (The various coatings arediscussed in Appendix B. )

gva"S "w +*
* V *C3 p-
•rJ -H-* fljco to SW o^
U
cO f f l
td rH•O coOj 1
CU ^
>>|d!Q S ^rt 3 «}£ K a
Q - •
& 3O "JjjJ
!&» i
ICO 0)CO
BW
•4-3
£H0CO
cuGj
M
W
00
-*->rtOU
0CO
****
4)i— t.0
CO•cg
U f a0 0
CO Oco inCM inA A
t-o
•
COo
•
f->4)aoUfao<u
OT
Bla
ck n
ick
elon
nic
kel
o
oo •^*.
curHjQcd•c£
U f ao oCO Oco inCM inA-£
t>O
•
coO3
•
I
lum
in
<
om oCO
0 0m m^H ^<
* "
tJ "5O (L)
S3 S34> 0)
U f a U f ao o o ot- O C* OCQ O OJ O^ CO ^00A A A A
^— * -«W
OJ CMO ^
* '
m coO> CT>
• •
^aao _.
I io .5* |a> 5OT <
Bla
ck c
hro
me
on n
ick
el
0 O O
•o «i.£ Sm o3 p*" m•M CU>> 0 fc
r— * fl>V £ V
-r-> «*H •*->CU 01 4)
I—I 1— 1D, 4) Cu
S * go a §U J U
U f a U f a U f aO C 0 O 0 O
C~ O CO O t- OCM O rH O CM OT(I CO CO CD rf CO
*£
r- T}. coO rH rH
• . .
rH m inCn O3 O5
• • *
"Hi4>CO
•o0)N
fc 'ex. S* a >
co U O
4>S0
.coi! -O3m
o
1— 1£jo
^0)t;•a
U
U f a0 O
CO OrH 0co eo
inrH
•
coCO
•
4>
£oU
Bla
ck c
op
per
in in ino o o
" i i£ ! !•8 ' '0>
a
Ufa , ,00 [ J
t- 0CM O ' '
CO C- OO G3 CO
•
in r- oCO O) O
• • •
§ £ £•3 <3 <
Iro
n o
xid
e
Bla
ck p
ain
t
Hon
eyw
ell
sele
ctiv
e pai
nt
0%
1I
;
i
COo•
or-.
|C
•|H
E3
Si
Per
man
gan
ate
trea
tmen
t
m.
S!*>"2^«.gSg.o &Pi U
'1
CMCO
•
enCO•
OleouS•>>4m
•+-»•>-4
§
^
§
Org
anic
ov
erc
on i
ron
oxid
e
^H
U4)!Scu4)CS-»
3
U f a0 0O5 OTf OrH CO
O
•
Oen.
*jjIXw^_Ja
§&
inB
H-J
O4)
"S4)r-(
3
Ufao oO) O.q. orH CO
OCM
•
O>.
r-l4>4)
K
1 *
O c
s
ORIGINAL PAGE ISOF POOR QUALITY 10

Design Trade-offs
In evaluating whether to use the more costly selective coating in pre-ference to a cheap, nonselective coating, such as black paint, it isimportant to consider overall cost effectiveness in terms of total heatflux collected per dollar of coating cost.
Solar energy may well be collected more cost effectively if selectiveabsorber coatings are used. Because cooling applications require high(110°C (230°F)) absorber plate temperatures, the infra-red energy emit-tance levels from black paint absorbers significantly impair collector ef-fiency. The increase in collector performance due to the selective coat-ing is shown in Figure 5. * The selective coating presented here is blacknickel, with an absorptivity,ot , of . 95 and an emissivity, € , of . 06. Thenonselective black absorber has aniOt of . 97 and an g of . 95. As can beseen from Figure 5, if the collector operating parameters, ^in,*amb, andQinc, are such that the collector operating point is out toward the righthand side of the operating curve, significant increases in collector ef-fiency may be realized from using the selective coating. By integratingcollector performance over an extended period, such as a full calendaryear, it is possible to determine the average percentage improvementavailable from adding the selective coating. As long as the percent costincrease of adding the selective coating is less than the percent perform-ance increase, the selective collector is more cost effective. Data takenfrom prior programs indicate that for most space heating and cooling ap-plications, the selective coating is definitely cost effective. The trade-off study presented in Appendix C, further illustrates the cost effective-ness of selective coatings.
Recommended Candidates
A selective iron/oxide coating, when augmented by an organic overcoat,has a solar performance capability nearly equal to that of selective blacknickel, with significantly greater apparent durability and humidity resist-ance and half the expected cost. Iron oxide with an EPM organic overcoatis therefore the prime candidate for the absorber coating.
Experimental Evaluation of Flat-Plate Collector Configurations. J. W.Ramsey, Honeywell Inc. Presented at NSF/RAAN Workshop of SolarCollectors for Heating and Cooling of Buildings-, Nov. 21-23, 1974,New York, N.Y.
11

Ill ,
III
80
60
1
. 40>>
20
Selective, 2-glass
Black, 2-glass
.2i — °F/Btu/hr-ft
.6 .8 1.0
.2 .4 .6 .8 1.0 1.2 1.4 1.6
Figure 5. Selective Absorber - Two Glass Covers
Insulation
Design Requirements
The back surface of the collector absorber plate must be thermally in-sulated to minimize the amount of heat lost to the collector housing.The design requirements for the collector insulation are:
• Maximum temperature of 204°C (400°F)
• Temperature cycling endurance between -29 C and 121 C(-20°F and 250°F)
• Thermal conductance less than 0. 57 W/m - C(0.1 Btu/hr-ft2-°F)
• Moisture-resistant
12

Design Considerations
In the construction industry, many insulation materials are available thatcan be used in the collector assembly for reducing heat losses. There arefour basic types of insulation to consider:
• Mineral fiber
• Ceramic fiber v
• Foamed glass and plastic
• Fiberglass
The mineral fibers and ceramic fibers are generally used for much highertemperatures and their costs are also generally much higher than fiberglass,which has comparable thermal conductivity. The exception would be mineralwool, which is a loose fill material giving a reasonably low thermal conduct-ivity. However, this material tends to settle under its own weight, which e-ventually leaves an air gap behind the absorber panel and decreases the ef-ficiency of the collector by increasing the heat loss from the absorber plates.Mineral wool also loses its insulation qualities if it is subje cted to humiditycycling. This requires that the collector housing be hermetically sealed toprevent such cycling. A loose insulation would also be undesirable duringrepair or maintenance operations.
The lowest cost insulation available today is fiberglass, which is producedin a variety of densities (affecting thermal conductance) and a variety ofbinder conditions depending on the application. Manufacturers of regularbuilding fiberglass insulation with a bakelite binder specify an upper usetemperature of 177°C (350°F). When first heated above 177OC, the binderburns, giving off odor and fumes. If the fumes encountered in this burningof the binder are not objectionable, the material can be used to 371°C (700°F).The insulating value is not degraded at the higher temperatures, providedthe material does not become compressed.
Fiberglass insulation with little or no binder is made specifically for highertemperature applications. Usually there is a small amount of binder whichis allowed to burn off during the first heating of the insulated device.
The binder residue could collect on the collector covers, which would degradethe collector performance. To alleviate this possible problem area, a designconsisting of two types of insulation could be used. Immediately behind theabsorber plate, a high temperature, thin sheet of insulation would be used.An additional layer of low cost insulation would complete the design to givethe desired thermal resistance to heat flow.
13

Material Candidates
Table 2 summarizes the insulations considered; the eventual choice wasmade from among these materials.
Design Trade-offs
The basis for selection was cost effectiveness, which was determined bythe insulation thickness required for a desired minimum heat loss, andalso cost per inch of additional box depth needed to hold this thickness ofinsulation.
In addition to reducing the heat loss during normal operations, the insula-tion must withstand the high temperatures when no heat is removed (e. g.,no flow of the heat transfer fluid). The absorber plates of well-designedcollectors can reach temperatures in excess of 204°C (400°F) when noheat is removed. This high temperature imposes severe restrictions onthe use of some insulations. For example, the maximum temperaturesallowable for urethane and polystyrene are 107°C (225°F) and 74°C (165°F),respectively.
Fiberglass best fits the design requirements in that most fiberglass blanketsand boards have a maximum operating temperature of 232°C (450°F), andgood durability with regard to temperature and humidity cycling.
Recommended Material
Based on cost and performance data, the fiberglass board insulations ap-pear to offer the best combination of performance and cost. The loosefill types of insulation are significantly lower in cost; however, their tend-ency to settle, particularly when wet, is considered a significant deterrentto their use. Accordingly, we selected Certainteed Products K-231 andOwens-Corning 701 as the two alternate insulations.
Housing
Design Requirements
The physical and mechanical requirements for the collector housing arereadily satisfied by several different types of materials. The maximumoperating temperature anticipated is in the neighborhood of 121°C (250°F).The housing must be structurally sound, weather-tight, and fire resistant.It must also provide for mechanical connection to some sub-structure inorder to be fastened into an array.
14

TABLE 2.- INSULATION CANDIDATES
Type
F iberglassblanket
Fiberglassboard
GlassfoamMineralfibersBlanket '
Board
Board
BoardBlock
BlockBlockBlock
Loose
Loose
Ceramicfibers(high- tempBlanketBlanketBoard
Block
BlockFoam
MoldedMln-K
Urethane
Name
Pf-3340PF-382
K-295
K-242
K-231
730
735
701
703
705
BIB
814
817
Microllte
MicroHteMicrollte850
IB-300
IB- 600
Duct linerultra liteB-005B-010
Unbonded"B" fiber1000FescoboardFoamclass
MineralfiberMT4MT10SuperglasPV supertemp blockHT blockIV 1200SupercaltempMineralwoolKaowoolbulk
BlanketBlanketCaowool
M boardCaowool
blockSuperglasCeramicoam
5031301
Mfg.
0-C-o-cC-TP
C-TP
C-TP
0-C
0-C
0-C
0-C
0-C
JM
JM
JM
JM
JM
JM
C-TP
C-TP
C-TP
C-TP
JM
JM
JM
JM
JM
P-C
EaglePlcherE-P
E-P
E-P
E-P
48 Insul
48 Insul
Pabco
Conwed
Babcock*Wllcoz
B-WB-W
B-W
B-W
E-P
Dow
JM
JM
OwensCorning
W/m*-°C
.0414
.0317
.0577
.0461
.0418
.0533
.0389
.0490
.0432
.0404
.0505
.0418
.0389
.0692
.0562
.0447
.0432
.0432
.0404
.0548
.0447
.0403
.0389
.0403
.0519
.0548
.0386
.0418
.036
.0339
.0403
.0548
.0382
.0494
.0461
...
.0577
.0404
.0634
.0577
.0562
.0634
.0259
.0303
.0216
At meantemp.°C
...
93
93
93
93
93
93
93
93
93
93
93
93
93
93
93
93
93
93
93
93
93
93
23.8
23.8
93
93
93
93
93
148.8
93
93
23.8
204.4
204.4
204.4
204.4
204. 4'
148.8
93
148.8
23.8
Max.temp.°C
121
121232
232
232
232
232
232
232
232
nia i2ib
171B J21b
171» 121b
171» 121b
171« 121b
454
232
232
232
537.7
537.7
537.7
454
492
760
288
288
982
1037
982
649
649
649
1260
1260
1315 •
1260
1260
649
260
704
107
Structure
BlanketBlanketBlanketBlanketBlanketSemirigidSemirigidSemirigidSemirigidSemirigidSemirigidSemirigidSemirigidSemirigidSemirigidSemirigidSemirigidSemirigidSemirigid
Semirigid
BlanketBlanket
Blanket
Semirigid
Rigid
Rigid
Blanket
SemirigidSemirigidSemirigid
Rigid
SemirigidSemirigidRigid
Loose fill
...
BlanketBlanket
Rigid
Rigid
Rigid
Rigid
RigidRigid
Rigid
Requiredthicknessfor loss of31.5 W/m2
at T=11°C
11.78.9
16.213.011.715.010.913.712.211.414.211.710.920.015.712.712.212.211.4
15.5
12.711.4
10.9
11.4
14.7
15.5
10.9
11.710.29.7
11.4
15.510.713.4
12.95
...
16.311.4
17.8
16.3
15.7
17.8
7.318.64
6.9
»/m2 .2. 5 cmthick0
.462
.440
.7121.01
.6451.212.17
.7321.22.29
.462
.79061.58...
.949
1.81
1.69
2.09
2.09
2.09
1.38
1.30
2.37
7.86
4.56
3.34
.161
6.35
7.0
3.7
5.8
...
...
19.8
*/m2 for31.5 W/m
loss0
5.4
—7.13
9.26
11.8
8.84
14.8
24.7
10.4
14.0
24.9
9.24
12.4
20.0...
11.6
20.6
26.2
26.5
23.8
22.8
15.7
19.1
36.7
...
...
121.8
48.8
44.8
2.08
...
103.5
103.8
421.8
420.4
---
...
...
...
14.8
Weight.
9.65
48.2
12. B
25.7
40.2
24.1
48.2
96.4
25.7
48.2
96.4
9.69
16.1
32.2...
98.2
96.4
...
24.1
98. 2
72.9
48.2
160.8
128.6
64.3
160.8
209
257.3
385.9
176.9
193
32.2
...
48.2
128.6
93 to 257
25 to 289
09 to 273
128.6
241
321.6
...
K$/m2 ,2. 5 cmthick0
--.
...
2.54
3.28
4.22
3.16
5.23
3.69
5.0
8.9
3.19
4.49
7.1...
4.09
7.31
9.26
9.34
B.42
8.13
5.56
6.75
12.98
...
...
...
...
43.1
17.4
16.5
.742
36.6
68.7
150.3
148.9
...
— .
5.23
K»Ref.°
...
...
.50
.65
.84
™"
...
.7
1.0
1.8
.6
.9
1.4...
.6
1.5
1.8
1.9
1.1
1.6
1.1
1.3
2.6
...
...
...
...
8.5
3.5
3.4
.15
7.3
13.6
29.8
29.5
...
...
...
1.0 .
"Unfaced; bfaced; cMarch 1975 prices
0-3
^X15

Design Considerations
The initial design consideration for a choice of solar collector housing is,in fact, whether or not to have a housing for each collector. The two can-didate approaches are (1) to create collector modules, each containing oneor more absorber panels, with each module completely enclosed by a hous-ing and cover, and with discrete inlet and outlet plumbing either internalor external to the box; and (2) to create a collector array, consisting of alarge backing plate covered with insulation, with all absorber panels mount-ed on the plate and insulation and plumbed together, and with a frame en-closing the edges of the backing plate and supporting a cover system thatcovers the entire collector array. Both approaches have distinctly salientfeatures, yet both also have drawbacks significant enough to warrant a de-tailed examination of their impact on each specific collector application andits installation requirements.
In previously conducted experiments on the modular collector approach,heat loss through the sides of the housing were a major factor in poor col-lector performance. This loss component may be limited by reducing theheat path from the absorber to the housing (i. e., by increasing the insula-tion thickness, eliminating mechanical absorber supports that connect tothe housing, or moving the sides of the housing away from the absorberpanel).
Reflecting this experience back to the two housing approaches, the col-lector array approach has an advantage in large collector installations,since only the outside rows of the array have housing edges in closeproximity, so edge loss should be reduced. Of course, if the collectormodule approach is used, edge losses could be reduced by designing thehousing sufficiently larger than the enclosed absorber panel to accomo-date several inches of insulation. This however, reduces the effectiveabsorber area of the collector unit.
Apart from heat loss, the other major concern for evaluation of the can-didate approaches is installation and maintainability, once installed. Thecollector array lends itself readily to integration into the roofline build-ings, perhaps using the existing roof as a backing plate and thus requiringonly a frame to support the cover system. A modular collector installa-tion, however, would probably use a separate supporting frame work.This makes it well suited for ground installations and building installationswhere it is either not feasible or simply undesirable to use an existing roof.
During installation and subsequent collector maintenance is where the col-lector module approach shows a significant advantage. The collector ar-ray must be mounted from above, necessitating cranes or scaffolding;maintenance to the installed system must also be accomplished from above,unless ports are made in the backing plate, and that severely challengesthe weatherproof integrity of the roof. Furthermore, if the cover sectionsare reasonably large, a disproportionate amount of effort must be expendedto uncover and reach minor repair items, such as a leaking connection.
16

Material Candidates
The candidate materials considered to be viable alternatives include:
• Steel (folded sheet stock)
• Aluminum (folded sheet stock and also extruded wall)
• Various plastics (eigher molded or extruded)
• Composite wood products, including paper products(molded or pieced)
Material Trade-offs
Regardless of which housing system is chosen, the materials problem re-mains the same. The housing must be physically sound, durable, weather-proof, relatively light, nonflammable, and aesthetically appealing (or atleast neutral), and reasonably priced. Wood or wood composites were con-sidered. While they appear to have marginal durability, wood housing havethe sufficient strength, heat resistance, and the cost effectiveness requiredof a reasonable design. A more likely candidate housing material, however,is sheet steel. It possesses the necessary strength, durability (particular-ly when galvanized), workability, and is cheaper than other potential metals.Its primary disadvantage is weight. Overall, however, mild steel appears,at present, to have the best potential as housing material, although form-able wood composites will require further investigation.
Recommended Candidates
The baseline candidate for the collector housing was a sheet metal bread-pan style box. The present cost estimates for a sheet metal box are lessthan $10. 76/m2, ($l/ft2), including chromide treatment and painting. Theprincipal disadvantages of the sheet metal box are its weight and potentialcorrosion problems, aluminum, plastic extrusion, and composites havebeen considered as housing candidates. Figure 6 presents one concept fora plastic extruded wall housing, adaptable for either one or two covers.This design concept requires a bottom plate, which could be of some cheap-er materials, such as particle board. Supplier quotations were receivedfor this particular design. The lowest bid was $12. 20/m ($1. 13/ft), notincluding the bottom plate. However, the plastic extrusion does includean ultraviolet inhibitor and fire retardant, and would require no externalfinishing. A similar extrusion of aluminum would also be possible, butat a significantly higher cost. A folded aluminum side with a wood bottommay be cost effective, however. .
17

Figure 6. Cross-Sectional View of Extrusion
In addition to the sheet steel and extruded plastic housing examined, amolded processed paper product, similar to paper mache, was examinedfor use as a collector housing material. A potential supplier indicatedthat one piece housings could be molded for approximately $ 3. 77/m2
($. 35/ft2). The advantages of this type of collector housing are obvious;not only is the material light in weight, but it also has fairly good insu-lating properties. The major concern is its ability to withstand weather-ing. The manufacturer of this product believes that a 15 year operationallife is possible if the material is allowed to dry out periodically. This isa reasonable requirement for a roof-mounted collector array, providingair is allowed to circulate between the roof and collector. A low cost resinmay be used to waterproof the housing if necessary. (A detailed structuralanalysis of the material is provided in Appendix D). Four housing designswere considered:
• Folded sheet steel
• Plastic pultruded sides, wood composite bottom
• Folded aluminum sides, wood composite bottom
• Molded paper product
18

Cover System
Design Requirements
The requirements of the cover system are summarized below:
• Self-supporting
• Transmission greater than 85 percent
• Minimum degradation from exposure to weather and vandals
• Abrasion-resistant
• Temperature-cycling endurance for -29°C to 121°C (-20°F to250°F)
Design Considerations
The fundamental question in the design of the cover system is whetherto use a single cover or multiple covers. Figure 7 compares the per-formance of a collector with a selective absorber and either one or twocovers. For some operating points, the second cover produces signi-ficantly improved collector performance. The one cover, two cover,choice can best be made by once again comparing the performance equa-tions over an extended operating period and examining the cost effective-ness of that second cover. (A detailed analysis of this trade-off can befound in Appendix C).
If a two cover system is selected, the choice of materials used for thetwo covers may be varied for each cover. The outer cover must pro-vide structural strength, transmit a maximum amount of the incidentsolar energy, and limit re-radiation and convection losses. It shouldnot be subject to degradation due to ultraviolet radiation; in fact, it isdesirable that it be at least partially opaque to the ultraviolet component.The inner cover should also transmit as much of the incident radiation aspossible, and limit convection and re-radiation losses. However, it needsonly enough structural strength to be self-supporting, and if the outer cov-er serves as an ultraviolet filter, the inner cover does not have to be high-ly resistant to ultraviolet degradation.
Material Candidates
Three categories of materials were considered for a cover:
• Glass
• Self supporting plastic sheets
• Plastic films • -
19

100 -I
80 -
60 -
40 -
20 -
Two covers
One cover
.2 .4 .6 .8 1.0"F/Btn/hr-ft2
.2"C/W/m"
.6 .8 1.0 1.2 1.4 1.6
Figure 7. Black Nickel Coated Aluminum Absorber -One and Two Glass Covers
A glass cover achieves good transmission, generally in the range 85 to88 percent, and in the case of thin, low iron glass, as high as 91 percent.Also, it is self supporting, weathers well, and is moderately priced.Glass is reasonably opaque in the infrared, thereby absorbing the long-wave reradiation emitted from the absorber panel. It is also resistantto ultraviolet radiation. In addition, glass is structurally strong andable to carry wind, rain and snow loads. It has two primary disadvan-tages: it is heavy and tends to shatter under the force of a well aimedprojectile. Shatter resistance can be improved by using tempered glass,but this again increases costs. Another refinement is the use of the newglass etching process to minimize reflections. Etched glass can producea transmission factor of 97 percent, but surface etching increases the col-lector's cost. Plastics are generally cheaper and not as heavy and break-able as glass, but most plastics tend to degrade with exposure to the ultra-violet, and, when ultraviolet inhibitors are used, the transmission is de-graded. Also, most plastics are more expensive than glass, except invery thin sheets. Lexan, a polycarbonate, is highly shatter resistant andhas fairly good transmission in the range of 84. 5 to 88 percent. The sur-face is fairly soft, however, and will lose this transmission level due toboth surface weathering and ultraviolet degradation.
20

Plexiglass has fairly high transmission in the solar wave length region;however, plexiglass is not very opaque in the infrared region. Thiseffectively cancels the transmission advantage of plexiglass. Its soft-ness reduces its desirability as an outer cover; however, it is self-sup-porting and may therefore be used as an inner cover. Caution muststill be used, even if it is selected for an inner cover; when heated to75°C (162°F), distortion can occur.
The plastic films are potentially attractive because of their low cost.They are, in general, not very durable when exposed to ultraviolet ra-diation; however, if used as an inner cover, ultraviolet durability maynot be required. One major disadvantage in using plastic films is theneed for supplementary support systems to stretch and hold the mater-ial in position. These support devices increase the costs of this typeof cover. Properties of the plastic films, such as Mylar (a polyester)and Tedlar (a poly vinyl flouride), are included in Table 3 with the othercandidate cover materials.
Design Trade-offs
Previous reports have suggested that glass substitutes, such as plexi-glass or Lexan, may be desirable cover materials for collector use.Their primary appeal is in their shatter resistance, breakage beingrecognized as the most significant drawback to glass covers. Weightconsiderations also make non-glass covers a desirable choice. Onthe negative side, however, most of glass substitutes exhibit lowertransmission in the solar spectrum than do glass covers and are alsosubject to both physical and optical degradation, due to ultraviolet ex-posure and normal weathering.
To evaluate the trade-off between the positive and negative attributesof the glass substitutes, it was necessary to quantify the optical andphysical differences between the various potential cover materials.The solar transmission was examined by taking direct insolation read-ings with an Eppley Pyrheliometer, both with and without a window, ofeach candidate cover material and comparing the millivolt output ofeach measurement. Table 4 presents the results of this test for 16potential cover materials, including glass and Tedlar. An opaqueblack surface was also measured to provide a reference level. Thedata indicates several materials that have solar transmission levelswithin 5 percent of FOURCO low-iron glass. Three of these plasticmaterials were tested for direct solar transmission before and aftera two month solar exposure test using an Eppley Normal IncidencePyrheliometer. The test was made at Desert Sunshine Laboratoryin Phoenix, Arizona. (The materials and test results are given inTable 5. ) These results show that the plastic materials degraded sig-nificantly during the two month test.
21

6I
Man
uf
*
' C e oOj 4)~— .0) (H CU«•£•*
0)f. "*
rt C ...h rtU0) t*oQ. 3
fl15ca"acuc ^
•2 Mu u
EH
CM
§,*U<«-
0)u
(H 45t2 •£*o S^
CO o)
|
Mat
eria
l
0
FO
UR
C
«,
t-t-l-H
CO
in
COCM
•
rHO)
CM
0en
m
Ord
inar
y g
las
O
FO
UR
C<
t~t-i-H
CD
1-H1-H
CO
•̂
rHCO
"**
00CO
COm
Tem
per
ed g
la
o"«
FO
UR
CH
oney
w
^s
r-l-H
CO
rHi-H
CO
•̂
I-HCO
CO
CO
Tem
per
ed a
nd
etch
ed g
lass
I
COor-
oCM
Pi
O
in00
00orH
CMco
Ted
lar
to
n°a
1
o00CO
CMCO
CMCO
c-
^J*CO
COt-0
o>CO
Ple
xig
lass
DR
u
tJ
H
Gen
era]
«0t-
0CO
rH00
CO
CMCO
inl-H
CO
COCO
om00
c0>
LA
SC
O
cooCM
<<
CMCM
rH
inrH
•
rHCO
•#
CD00
Las
coli
te
o.oU
Kal
wal
l
mCOrHrH
0CO
COin
"
OrH
•
COo
"
COCO
p
1a0)
t-H
CO
u
u
s
Am
eric
COt-oo
0rHrH
COCD
1-H
mT_|
•
CO
CO
a
%
Lu
mas
ite
1
§
CMrH
CO0
0
m0o
l-H1-H
O
Z,
CO
1
1
CMinCO
COCO
m0
rHino
mrH
CM
5
1Poly
ethyle
ne,
hig
h-d
ensi
ty
$r3
10)
I
22

TABLE 4. - SOLAR TRANSMISSION OF SELECTED COVER MATERIALS
SampleNo.
1
2
3
4
5
6
7
8
9
10
11
12
13
14
15
16
17
Material
Fiberglass
Kal-lite premium
Kal-lite regular
Lascolite
Duo- wall
Fiberglass
Plexiglass
Cyanamid acrylic
Plexiglass II UVA
Lexan
0.035-in. Lumasite
0.050- in. Lumasite
CorrugatedLascolite /Tedlar
FOURCO glass
Tedlar
Sunlite
Black surface
Transmission,%
83.8
89.3
89.4
86.4
81.984.3
80.5
89.8
92.3
88.8
86.1
88.5
92.1
83.688.485.087.7
96.0
95.0
90.7
2.6
Reading, mV
Sample•window
6. 8 to 6. 9
7.1
7.4
7.1 to 7.2
6.87.0
6.8
7.5
7.8
7.5 to 7.6
7.1 to 7.2
7.3
7.5 to 7.6
6. 6 to 6. 76.8 to 6. 96. 6 to 6. 76.9 to 7.0
7.2 to 7.3
7.5 to 7. 6
6. 8 to 6. 9
0.2
Nowindow,before
8. 1 to 8. 2
7.9
8.3
8.3
8. 3 to 8. 4
8.5
8.4
8.4
8.2 to 8.3
8. 3 to 8. 4
8.2
8.3
7.98.07.7 to 7.87.9
7.5 to 7.6
7.9 to 8.0
7.5 to 7.6
7.6
Nowindow,after
8.2
8.0
8. 2 to 8. 3
8.2 to 8.3
8.2 to 8.3
8.4
8.3
8.4 to 8.5
8. 2 to 8. 3
8.2
8. 2 to 8. 3
8. 1 to 8. 2
8.07.7 to 7. 87.97.9 to 8.0
7.5 to 7.6
7.9 to 8.0
7.5 to 7.6
7.6 to 7.7
Remarks
VerticalHorizontal
Vertical T*HorizontalVertical TtHorizontal
OF POOR
23

attoHwHHWrtI
'Ui— iHCQ
i•
m
W
PQ
t*au"ju
5
j
>
)
15
1
£>
I;_g•o0)
g
•o(0
c
H11d
•c
|I
^
c
&"cCO
a;
S
•̂o
'fe
1
'
Cl
I*.3om
1
S
"3V
«5
4
Is
*.
h0)
S
<2n
K >•••§5 "te*
§•£•g^o
mC
2
u«i
Befo
re
S &x o
1|
§'3to1*n
1
i
oo N •*N -j 2M <H 1-1
CO
1-1 t- in" t- i-c t-in CD 2 «o' in CD
in
,_ t- 1-1 t- 1-C 1-
U5 CD* in CD in CD
CD
ot- in eg in CD -m *f v in* C3 **
t-d
m eg o i^ , co t*eg r- 1-1 eg i— cot- to eo oo i-i
in00
O **"00 ^ CO*
00*
a> TJ« t-C- 00 CD*
cnd
00 0t- c- **
00
d
m n c-a* eg egCO CB 1-1
g |3 ' ^5 ^G o0)(4 OD. -O ~-
w go E«•? §•>!, f S"3 ^>o " §^ U a) ~2
eg oo e«TH
J4)
1
U
I•8S
I
fr
I
24

Material Candidate
The transmission tests on various cover materials indicated that noneof the plastics had as high a transmission as the low iron glass. Fur-ther tests verify that plastic materials degrade under solar exposureand could never be expected to last the entire design life of the collec-tor. Glass is therefore the chosen cover material, to ensure contin-ued environmental protection without loss of transmission quality.
Interconnects
Design Requirements
Collector design efforts should consider the following problem areasin addressing collector interconnects:
• Fluid connections/leakage
• Repair or removal of collectors
The design criterion for a fluid connection is of course that it will notleak. It should be made of materials which will not be affected by ther-mal cycling, the collector fluid, or weather conditions, including ultra-violet exposure.
Design Considerations
The collector design should emphasize the capability of removing afaulty collector and replacing it with a new unit, as well as the abilityto repair collector covers on site. Environmental effects and access-ibility of collectors in large arrays make on site repairs difficult andcostly. Removal of the entire collector unit would simplify collectordesign in that emphasis could be placed on sealed collectors withoutthe constraints of on site repair.
Material Candidates
Possible material candidates are:
• Rubber hose and clamp
• Hard copper tubing plumbing connections
• Flexible metal hose with hard connections
• Hard soldered connections
25

Material Trade-offs
Regardless of the internal/external header configuration selected, oneobservation is relevant. The connections between collector and systemshould be hard connections. They may be welded, sweated, or flexiblemetal hose with swivel fittings,t but they should not be rubber hose andclamp fittings. The hose tends °to take a set and, at the operating temper-atures and pressures encountered in a solar installation, constant clamptightening is required to prevent leaks.
Fluid connections to a main header should be outside of the collector box.This would permit easier installation and removal of an individual collec-tor, and any leak would be easier to detect.
Recommended Design
Individual connections should be semi-permanent screw type fittings orsilicone "O" -ring and screw type fittings of noncorrosive material.
Candidate Collector Designs
Final Material Options
The various collector component materials were evaluated in detail andthe selected materials are summarized below:
a. Absorber Options
1. Spot and seam welded steel sheets
2. Steel channel strips copper-brazed to a steel sheet
b. Absorber Coating Options
1. Black chrome over bright nickel on a steel absorberi
2. Black chrome directly on steel
3. Iron oxide and an organic overcoat on a steel absorber
c. Insulation Options
1. Semi-rigid fiberglass board
26

d. Collector Housing Options
1. A one-piece molded paper product pan with an extrudedaluminum cover frame.
2. Folded aluminum sheet sides bonded to a chipboard basewith an extruded aluminum cover frame
3. Pultruded 70 percent glass-filled polyester (fiberglass)sides bonded to a chipboard base with a pultruded 70percent glass filled polyester cover frame
4. A folded sheet steel pan with a three-piece folded sheetsteel cover frame assembly
e. Glazing Options
1. Low-iron, double-strength glass, either one or twosheets
2. Kalwall Sunlite Premium
3. Tedlar
The list represents the starting point from which the candidate collectordesigns were generated. During the course of the design process, sev-eral of the above listed material options were also eliminated. The col-lector component areas affected by this further reduction of materialchoices were the absorber coating and the glazing.
In evaluating whether to use black chrome or iron oxide as the selectiveabsorber coating in the candidate collector designs, the long term pro-duction potential was chosen as the primary consideration. Althoughblack chrome performs somewhat better than iron oxide, it is believedthat the electroless dip and organic coating required in the iron oxideprocess will be sufficiently cheaper than the black chrome electroplateprocess such that iron oxide will be more cost effective, despite itslower performance. This is particularly true if it continues to be nec-essary to use a nickel undercoat for rust protection with the black chrome.
Using either Kalwall Sunlite or Tedlar for collector glazing involves somedefinite cost and/or performance penalties. The Kalwall Sunlite is signif-icantly lower in solar transmission than low iron glass. Tedlar has a goodsolar transmission, but is not self supporting. Special design considera-tions must be made for either a support structure or some type of stretch-ing frame; both of these approaches add costs to the collector design. Lowiron glass collector glazing has good solar transmission and is self sup-porting, at least in short spans required for a collector. It is also heavyand subject to breakage; however, it still represents the best compromisepresently available for collector glazing.
27

Candidate Collector Designs
Given the material options listed above, four different collector designswere generated, each design using a different collector housing option.Figures 8 through 11 illustrate the four candidate designs. A descrip-tion of each design follows.
Design I -- This design consists of a folded sheet metal box withU-channel glass spacer and aluminum cover bracket. The sheet metalcollector box is folded up and spot welded in the corners. The absorb-er is mounted on phenolic rod stand-offs and fastened to the box bottom.The inner glass cover is placed on the bracket lip and then a U-channelspacer is placed on the glass. A second glass cover is placed on thespacer frame and the entire assembly held down by the top aluminumcover bracket which is attached with sheet metal screws to the box walls.Butyl rubber tape is used on all glass/metal interfaces. Semi-rigid fi-berglass is placed behind and around the absorber plate for insulation(Across section is shown in Figure 8).
Design II -- This design has an aluminum box with an extruded alum-inum cover frame and chipboard bottom. The box consists of folded sheetaluminum sides heli-arced together in the corners and glued to a chip-board bottom. The cover assembly has an extruded aluminum frame withtwo sheets of 0. 39 cm (5/32 in.) low iron glass pressed into the frameusing polyvinyl chloride (PVC) U-shaped glazing material. The frame issecured at the corners with self tapping sheet metal screws. The absorb-er is structurally fastened to the base with phenolic rod standoffs and ma-chine screws. The insulation is semi-rigid fiberglass, which surroundsthe absorber panel on the back and sides. The cover assembly snaps in-to the box by using a resilient PVC weather stripping bead and stampedout aluminum teeth in the box side which fit into a channel in the coverframe extrusion. (A cross section of this design is shown in Figure 9. )
Design III -- This design features a pultruded plastic box and coverframe with a chipboard bottom. Pultruded 70 percent glass filled poly-ester sides are glued together and to a chipboard base. The cover frameis also a pultrusion which holds two sheets of glass with U-shaped PVCglazing material. The absorber panel is mounted on the chipboard back-ing with phenolic rod stand-offs using machine screws. Semi-rigid fiber-glass insulation is used behind and on the sides of the absorber panel. Thetop cover assembly is placed in the box and secured with pop rivets. Abutyl rubber sealing strip is used between the pultruded plastic sub-assem-blies for weather stripping. (A cross section of this design is shown inFigure 10. )
Design IV -- This design consists of a processed paper box with anextruded aluminum cover frame. A molded paper product is used as thecollector box. The cover frame is extruded aluminum and carries all ofthe structural loads. The box only holds insulation around the absorberpanel and provides a weather and thermal barrier. PVC glazing strips
28

Butyl rubber'weatherstrlpplng
Double-strengthlow-Iron glass Channel spacer
V ^^^^^^^^^
Top coverbracket
First cover
Sheet metalscrew
Bakellte standoffs
10-321/2-ln. machinescrew
Figure 8. Design I. - Folded Sheet Metal Boxwith U-Channel Glass Spacer andAluminum Cover Bracket
29

Extruded-aluminumcover frame
Double-strengthlow-Iron glass
PVC glazingchannel
10-32'1/2-in. machinescrew
Spot- and seam-weldedsteel absorber
PVC bead
7Blandex chipboard base
1-c,-_-̂
sjS~ 3/4 -in. bakellterod standoffs
Fiberglass Insulationx
r-n
Folded-aluminumbox sides
Figure 9. Design II. - Folded Aluminum Box Sides withExtruded Aluminum Cover Frame andChipboard Bottom
30

Butyl rubber weatherS stripping
Pop rivet
Double-strengthlow-iron glass
I *•—; I
-10/321/2-In. machine screw
Pultrudedglass-filledpolyester
\
L^-5/8-In. bakellterod
FiberglassInsulation
12
Ja
:
Blandex chipboard base
Figure 10. Design III. - Pultruded Plastic Box andCover Frame with Chipboard Bottom
OF • • ' • • '
31

hold the two glass lites in the aluminum frame, and the assembled cov-er is secured at the corners with self tapping sheet metal screws. In-sulating absorber stand-offs are either held by the aluminum coverframe, or the absorber mounting clips are run between the paper boxand aluminum cover assembly and fastened to the collector mountingstructure. (This design cross section is shown in Figure 11. )
Each of the four designs has some distinct advantages and disadvantages.Design I, the sheet steel collector, is similar in design to those builtpreviously. There is fabrication and assembly experience reflected inthe design. However, experience also indicates that the assembly costswill be high because of the multitude of piece parts. Design II, the sheetaluminum/chipboard collector, is more readily fabricated than Design I,but the technique for fastening the cover to the pan is still unproven. De-sign III, the fiberglass collector, is light weight and durable, but is thecostliest material. Design IV, the molded paper product collector, hasthe lowest material cost, but may have durability problems.
Cost Analysis of Candidate Designs
Costs should be an important factor in deciding on the design. The costsof each collector design can be broken into two categories: material andassembly labor. Fabrication labor can be considered a part of the costof materials. Tables 6 through 9 indicate the bill of materials and theassociated costs per collector for each of four production levels. Thefour production levels considered are 929 m2 ( 10 000 ft2), 9290 m2
(100 000 ft2), 92 900 m2 ( 1 000 000 ft2) and 464 500 m2 (5 000 000 ft2).The collector size considered here is 0. 01 m x 1. 22 m (3 ft x 4 ft), andall costs quoted in the tables are for sufficient quantity of each itemto complete one collector. The total cost of materials per collector islisted below the last item on each material list.
The material costs vary somewhat between designs, depending uponwhich production level is used. However, in general, the range is only$ 6 to $ 7 on a $30 to $40 per unit cost. This amount of material costvariation is not sufficient to recommend one of the four designs on ma-terial costs alone. The assembly labor content of each design must^also be considered. It is difficult to place a dollar value on the laborin the assembly of each design, but in relative terms, as determinedby counting the number of assembly operations required for each de-sign, it appears the Design IV, the molded paper product collector,will have the least assembly labor content. Since Design IV also hasthe lowest cost for materials, it appears reasonable that this will bethe lowest cost collector. Furthermore, since all four designs areessentially equal from the standpoint of thermal performance, De-sign IV should also be the most cost effective collector.
32

Butyl rubberweather stripping Double-strength
low-iron glass
Extruded-aluminumcover frame
PVC glazing channel̂
Steel absorber withcopper-brazed Flowchannel strips Nylon absorber
bracket
Figure 11. Design IV. - Processed Paper Box withExtruded Aluminum Cover Frame
33

TABLE 6. - DESIGN I COST SUMMARY
Item
1
2
3
4
5
6
7
8
9
10
11
12
13
Quantity
1 ea.
14 ft
14 ft
14 ft
2 lites
56 ft
32 ea
4 ea
8 ea
37. 1 bd ft
Part
Box
Inner coverbracket (
Glass spacer
Outer coverbracket
Glass*
Weatherstripping
Cover screws
Absorberstandoffs
Absorberstandoffscrews
Insulation
Absorberplate
Box undercoatand paint
Absorber *coating
Total cost of materials percollector
Extension, $/unit)
929 m2
(10 000 ft2)
$ 7. 63
2.88
2.88
2.88
6. 60
0.49
0. 10
0.63
0.03
0.41
16. 14
1.80
3.00
$45.47
9290 m2
(100 000 ft2)
4 6.36
2.40
2.40
2.40
6.60
0.48
0. 10
0. 57
0.03
0.41
13. 56
1.80
2.76
$39.87
92 900 m2
(1 000 000 ft2
$ 4 .20
1.20
1.20
1.20
6.60
0.46
0. 10
0.51
0.03
0.33
11.47
1.20
1.92
$30. 35
464 500 m2
(5 000 000 ft2
$ 4.20
1.20
1.20
1.20
6.60
0.46
0.10
0.46
0.03
0.33
9.60
1.20
1.92
$28.50
*Substitution of black chrome/bright nickel coating for iron oxide and temperingthe cover glass will result in a net increase in total material cost per collectoraccording to-.the following schedule:
Yearly volumeAdditional costof coatingAdditional costof temperingglass
10 000 ft2
8.40
1.68
100 000 ft2
8.64
1.68
1 000 000 ft24.08
1.68
5 000 000 ft2
4.08
1.68
34

TABLE 7. - DESIGN II COST SUMMARY
Item
1
2
3
4
5
6
7
8
9
10
11
12
Quantity
14 ft
14 ft
14 ft
28 ft
4 ea
8 ea
8 ea
1 ea
2 lites
37. 1 bd ft
1 ea
Part
Box sides
Cover frameextrusion
Weatherstripping
Windowglazing
Absorberstandoffs
Cover framescrews
Absorberstandoffscrews
Absorberplate
Glass
Insulation
Box bottom
Absorber*coating
Total cost of materials percollector
Extension, $/unit
929 m2
(10 000 ft2)
$4. 57
1.682.24
0.72
0.49
0.63
0.03
0.03
19.90
6.60
0.41
1.20
3.00
$41.50
9290 m2(100 000 ft2)
$4.38
1.682.24
0. 59
0.48
0.57
0.03
0.03
16.72
6.60
0.41
1.20
2.76
$37.69
92 900 m2
(1 000 000 ft2)
$4. 19
1.682.24
0.46
0.48
0.51
0.03
0.03
14.06
6.60
0.33
0.96
1.92
$33.49
464 500 m2
(5 000 000 ft2)
$4.01
1.632.24
0.33
0.48
0.46
0.03
0.03
11.84
6.60
0.33
0.96
1.92
$30.91
*Substitution of black chrome/bright nickel coating for iron oxide and temperingthe cover glass will result in a net increase in total material cost per collectoraccording to the following schedule:
Yearly volumeAdditional costof coatingAdditional costof temperingglass
10 000 ft28.40
1.68
100 000 ft2
8.64
1.68
1 000 000 ft 24.08
1.68
5 000 000 ft24.08
1.68
OPIGINAL PA^GE ISOF POOR QUALITY
35

TABLE 8. - DESIGN III COST SUMMARY
Item
1
2
3
4
5
6
7
8
9
10
11
Quantity
14 ft
14 ft
14 ft
28 ft
4 ea
1 ea
8 ea
1 ea
37. 1 bd ft
2 lites
Part
. Box side
Cover framepultrusion
Weatherstripping
Windowglazing
Absorberstandoff
Box bottom
Absorberstandoffscrews
Absorberplate
Insulation
Glass
Absorber*coating
Total cost of materials percollector
929 m2
(10 000 ft2)
$8.96
6.44
0.58
0.49
0.63
1.20
0.03
16.14
0.41V
6.60
3.00
$44.83
Extension, $/unit
9290 m2
(100 000 ft2)
$8.96
6.44
0.48
0.48
0. 57
1.20
0.03
13.56
0.41
6.60
2.76
$41.84
92 900 m2
(1 000 000 ft2)
$7.84
5.46
0.46
0.48
0.51
0.96
0.03
11.40
0.33
6.60
1.92
$36.29
464 500 m2
(5 000 000 ft2)
$7.84
5.46
0.46
0.48
0.46
0.96
0.03
9.60
0.33
6.60
1.92
>.
$34.44
'^Substitution of black chrome/bright nickel coating for iron oxide and temperingthe cover glass will result in a net increase in total material cost per collectoraccording to the following schedule:
Yearly volume
Additional costof coating
Additional costof temperingglass
10 000 ft2
8.40
1.68
100 000 ft2
8.64
•1.68
1 000 000 ft2
4.08
1.68
5 000 000 ft2
4. 08
1.68
36

TABLE 9. - DESIGN IV COST SUMMARY
Item
1
2
3
4
5
6
7
8
9
10
Quantity
1 ea
14. 2 ft
14 ft
28 ft
6 ea
8 ea
1 ea.
2 lites
33.4 bdf t
Part
Processedpaper box
Cover frameextrusion
Weather-stripping
Windowglazing
Absorberbrackets
Cover framescrews
Absorberplate
Glass
Insulation
Absorber *coating
Total cost of materials percollector
Extension, $/unit
929 m2 .(10 000 ft2)
$3.66
1.682.24
0.58
0.49
0.30
0.03
19.90
6.60
0.38
3.00
$38. 86
9290 m2
(100 000 ft2)
$3.18
1.682.24
0.48
0.48
0.24
0.03
16.72
6.60
0.38
2.76
$34. 79
92 900 m2
(1 000 000 ft2)
$2.96
1.682.24
0.46
0.48
0.18
0.03
14.06
6.60
0.30
1.92
$30.91
464 500 m2
(5 000 000 ft2)
$2.85
1.682.24
0.46
0.48
0.18
0.03
11.84
6.60
0.30
1.92
$28. 58
^Substitution of black chrome/bright nickel coating for iron oxide and temperingthe cover glass will result in a net increase in total material cost per collectoracc9rding to the following schedule:
Yearly volumeAdditional costof coatingAdditional costof temperingglass
10 000 ft28.40
1.68
100 000 ft2
8.64
1.68
1 000 000 ft2
4.08
1.68
5 000 000 ft2
4.08
1.68
37

Recommended Collector Design
The recommended collector design was a steel absorber with copperbrazed flow channel strips supported from an extruded aluminum cov-er frame by nylon brackets. The cover frame contained two sheetsof 0. 39 cm (5/ 32 in.) low iron glass, sealed with a PVC glazing chan-nel. The absorber was backed by 7. 5 cm ( 3 in.) of semi-rigid fiber-glass insulation, and the complete absorber/cover assembly was housedin a one piece, molded paper product pan. This design had a fairly lowmaterial cost, ranging from $34. 88/m2 ($3.-24/ft2) to $25. 64/m2.($2. 38/ft2)depending upon the production level, and appeared to have a fairly low as-sembly labor cost.
The recommended design was accepted by NASA project personnel withsome suggested modifications: (1) redesign of the absorber brackets toenable cover assembly to be removed without'disturbing the absorber;(2) routing of the absorber plumbing out the ends of the collector ratherthan the back; (3) changing the absorber to a two-sheet, spot and seamwelded steel design.
The question of whether to use a one cover or two cover system for thecollector was not satisfactorily resolved. Consequently, both a onecover and a two cover version of the collector were fabricated and test-ed within the course of the program. The final designs for the one andtwo cover collectors are shown in Figures 12 and 13, respectively.
The glazing material to be used in Design IV is double strength FOURCOClearlite glass. Other glazings may be used in the same aluminum cov-er frame by using different spline sizes. The following summarizes theglazing material which have been tried in the cover frames with differ-ent spline sizes:
• Plastics up to 1.3 mm (0. 050 in. ) thick
• Single-strength glass 3. 3 mm (0. 130 in. ) thick
• Double-strength glass 3. 3 mm (0. 130 in. ) thick
• Glazings 3. 8 mm to 4. 4 mm (0. 150 to 0. 175 in.) thick
38

<0
k
0)CO0}
o•4->o
6COCOcd
>-4
O
StUD
_C55OhCQ
(N
39

k
1<aCOCO
oor— Iv-4
OoCO
O
•§
UfeCQ
0)h3tuO

FINAL COLLECTOR DESIGN DRAWINGS
The final designs for the two solar collectors are detailed in this sec-tion. The collector assembly for the one and two cover collector ver-sions are shown in Figures 14 and 15, respectively. Figures 16through 18 describe box, cover frame, and absorber bracket extend-er for the one cover collector, and Figures 19 through 21 for the two-cover collector. Figures 22 through 24 detail the absorber which isequivalent for both collectors and Figures 25 through 29 provide de-tails of piece parts and subassemblies used in both collector designs.
41

COCQ
tJ0)
UCOCO
(U
fc.3CO
ufeCO
•̂t-1
0>£W)
42

men
o
IUtoen43O
1QUfeCO
0)

«_- )'T .: .• .:/
ifIS
COOJ
^3Oo>
Ii/5
I
0)acd
11T
II
(U-O
a§
W*
CO
0)fndbfl
44

Figure 17. Extrusion - Single Glass
.S7 .62
Wt
s" DRILLH6LES
Figure 18. Absorber Bracket Extender - Single Glass
45

•-HUOM* •* \
•4- f\ T
s?3*
S-s-
3J
i If I5i*s
i
I
i1\
T
i !«J§ :I!M— r
T it9
_L
~U*rr fl
-
-
-
f I1 !> <" 1 1— ji
! ?
1 i!J i
01CO
O
•soQii
0)a
73V"§
•§rt
8PQ
<uhabJD
46

/. -3/2
•
(5-1
8) ^•M
Xo^BQ
f
\ 01f\lfM»
s
^
<V<;
j
»
'ft <^ ?
30i JO-}
i
J
a05 vf
'̂ Ov
•9^ \Xf-—ftr.06—
^-t9
i
>j•
-•
f
m /*5 ^™
a PLACES.(06^ —
7^T
HX
_
t-j/•
V(r,
»_
3<
*<4
— »
!?2>
"~ 1
J3\ .
^
• . O(?O
o/ris•— . G&O fic~
Figure 20. Extrusion -
l£?\
V>/
r
5-7
t:
1
•-fe
!
-
o
N
Double Glass
1i
i
»
. i-./f~f
t
("h
•a
f
K"^. _
<«J V|
•-.
//̂
-i
/-,«
/~x/*/ e^/
*-.A5-
DftILL
Figure 21. Absorber Bracket Extender - Double Glass
47

-.IS .'MS/DC:
^ ,!_,, v ._ MIN #
U,
Figure 22. Panel A" — Absorber
48

l.fOffff) —
—H .isai—
-./ao
SfCTIOM f)-R
^rffef
4^4^
Figure 23. Panel "B" — Absorber
49

i*.
VWw
L,:
ORIGINAL PAGE ISOF POOR QUALITY
i!* «<
~HMj-™i
U
i—i
50
Si
ft!
1
o>•8oCOXI
3,

0 SHEET MTL-2
J~ \00553\\~\O\
figure 25. Absorber Bracket Assembly - Typical
/.OO
.SO *5-\ \j rv£XR.(TYP)
'—THIS T<9 BE . 57TO
Figure 26. Cover Frame Fastener
\
.50
THffLtMdtfS
Figure 27. Absorber Bracket Base - Single and DoubleGlass
ID 1

Figure 28. Glazing Seal
.Figure 29. Connect Tube Grommet
52

PROCUREMENT, FABRICATION AND ASSEMBLY
Parts List
The solar collector parts lists are given in Tables 10 and 11. None ofthe parts require any high technology fabrication processes or highlyaccurate machining. Several of the piece parts for the collector havebeen procured from outside vendors. These are listed below alongwith a brief description and manufacturer and/or supplier.
ProcuredPiece Part
Molded paperhousing
Cover framealuminumextrusion
Fiberglassinsulation
Grommets
Glazing seal
Glass
Screws
Description
3 ft. x 4 ft x 5 ft depth x 1/4in. nominal thickness
One or two channel extrusionto hold cover glass
11/2 in. bats of OC703semirigid fiberglass board
3/8 in. ID x 1 1/4 in. OD x1/2 in. thick black siliconerubber
Mfg/Supplier
Format Containers,Inc.Wisconsin
Alexandria,Extrusions, Inc.Alexandria, MN
Owens CorningFiberglass
Honeywell Plastics Lab
1/8 in. x 3/8 in. PVC window Alco Supply Co.weather stripping GC-460 Minneapolis, MN
Double strength FOURCOClearlite low iron
1/2 in. No. 6 sheet metal3/4 in. No. 7 sheet metal
Northwestern Glass Co.Minneapolis, MN
53

TABLE 10. - SOLAR COLLECTOR PARTS LIST --SINGLE COVER COLLECTOR
Qty Item
1 Housing
Approx37 bd ft
2
14 ft
1 lite
2 dz
1 dz
2
2
6
10
45-deg mitredend cover frameextrusion
45-deg. mitred sidecover frame extru-sion
Insulation
Interconnectgrommets
Glazing seal
Glass
Screws
Screws
Absorber
Interconnect tube
Compression fitting
Absorber bracketinsulation
Absorber bracketclips
Cover frame clips
Description
Brown molded paper pan, 3 ft x 4 ft x4 1 / 4 in. deep x 1/4 in. thick (nom.)
Single channel 36 in. long, OD blueanodized
Single channel 48 in. long. OD blueanodized
OC-703 11 /2 in. thick semi-rigidfiberglass boards
3/8 in. ID, 11/4 in. OD, 1/2 in.thick black silicon rubber
1/8 in. x 3/8 in. PVC window weatherstripping
34 1/2 in. x 45 1/2 in. double strengthFOURCO Clearlite low iron
3/4 in. No. 7 self tapping sheet metalscrews
1/2 in. No. 6 self tapping sheet metalscrews
33 in. x 45 in. spot and seam weldedsheet steel absorber with iron oxidecoating and organic overcoat
3/8 in. copper tubing, Sin. long
3/8 in. compression fitting nuts with nylon
Nylon blocks
0. 050 in. aluminum clips, single cover
0. 050 in. aluminum clips
54

TABLE 11. - SOLAR COLLECTOR PARTS LISTDOUBLE COVER COLLECTOR
Qty Item
1 Housing
Approx37 bd ft
2
28 ft
2 lites
2 dz
1 dz
2
2
6
6
10
45-deg mitredend cover frameextrusion
45-deg mitred sidecover frame extru-sion
Insulation
Interconnectgrommets
Glazing seal
Glass
Screws
Screws
Absorber
Interconnect tube
Compression fitting
Absorber bracketinsulation
Absorber bracketclips
Cover frame clips
Description
Brown molded paper pan, 3 ft x 4 ft x4 1 / 4 in. deep x 1/4 in. thick (nom. )
Double channel 36 in. long, OD blueanodized
Double channel 48 in. long, OD blueanodized
OC-703 11/2 in. thick semi-rigidfiberglass boards
3/8 in. ID, 1 1/4 in. OD, 1/2 in. thickblack silicon rubber
1/8 in. x 3/8 in. PCV window weatherstripping
34 1/2 in. x 46 1/2 in. double-strengthFOURCO Clearlite low iron
3/4 in. No. 7 self-tapping sheet metalscrews
1/2 in. No. 6 self-tapping sheet metalscrews
33 in. x 45 in. spot and seam weldedsheet steel absorber with iron oxidecoating and organic overcoat
3/8 in. copper tubing, 5 in. long
3/8 in. compression fitting nuts withnylon
Nylon blocks
0. 050 in. aluminum clips, double cover
0. 050 in. aluminum clips
55
Fabrication
The methods used to fabricate the collector housing, absorber, coat-ing, and brackets are described in the following paragraphs:
Housing
The process used for the manufacture of the paper boxes requires atightly knit brass screen form. This form is lowered into a papermache slurry and suction is applied within the screen mold, causinglayers of paper to build on the mold. The time and suction pressureof the process determines the product thickness. The mold is remov-ed from the slurry and the box is placed on a drying rack which can berun through an oven. The properties of the resulting paper product aredetermined by the type and rag content of paper used and by the chemi-cal binders used in the slurry. There are numerous possibilities ofbinders which can be used to increase the strength, durability, andweatherability of the collector housing. Such processes may elimi-nate the need for a second plastic impregnation step to increase col-lector housing life.
Absorber
The absorber is fabricated from two sheets of sheet steel, one withformed parallel flow channels and the other with formed headers.These sheets are then spot welded together and seam welded aroundthe periphery to make a water tight panel.
The 3/8 in. copper supply and return tubes are centered on the topand bottom sides of the absorber header using compression fittings.
Male compression fittings are welded to the headers at these pointsand the tubes are coupled to the absorber using the female fittingsand a special socket wrench. This type of fitting allows for tubingattachment from outside the collector box. After fabrication, theabsorbers are leak checked to 25 psig.
Coating
An iron oxide coating is applied to the absorbers using an Ebonal Ssolution from Enthone, Inc. The bath temperature is 290°F and theabsorbers are left in the solution for two minutes. A standard alka-line cleaning solution is used along with an acid etch prior to coat-ing.
The overcoat is an ethylene propylene material (EPM) which is ap-plied to a thickness of 0. 2 mil. The product used is Vistalon 606EPM which is a product of Exxon Company.
56

The reflectance curve for the coating is shown in Figure 30. The un-coated surface has an absorptance of . 90 and emittance of . 12 (od/c= 7. 7). The overcoated sample has an absorptance of . 92 and an emit-tance of . 20 (<*/*• = 4. 6).
Brackets
The absorber brackets are fabricated from 1. 3 mm (0. 050 in. ) alumi-num clips and nylon blocks. Self tapping screws are used to attach thenylon insulator to the aluminum clip. The cover frame clips are alsomade from 1. 3 mm (0. 050 in. ) aluminum. The absorber brackets main-tain the position of the absorber within the box by attachment to the cov-er frame. Both absorber brackets and cover frame clips are used tohold the housing to the cover assembly. See Figure 31 for anchor clipand absorber bracket sketches.
Cover Frame Assembly
The cover frames are assembled as follows:
One-Cover Frame
1. Four strips of spline are cut to length.
2. A length of PVC is placed over the glass edge and the frameside is tapped into place. Subsequent sides are tapped intoplace in the same manner.
3. Two screws are used in each corner to secure the coverframe assembly.
Two-Cover Frame
1. Eight strips of spline area are cut to length.
2. Two sheets of glass are cleaned on one side and then placedon edge with clean sides facing each other.
3. Two pieces of spline are placed on the top edges and the firstside is tapped onto the two lites.
4. The two ends are then fitted in the same manner without ro-tating the lites.
57

100 1
80 •
g 60
40 •
20
Uncoateda = 89.8%
Overcoated*= 92.2%
20.2%
.3 .4 .5 .6 .7 .8 .9 1 1.5 2 3 456 8 10 15 20
Wavelength/ ftm
Figure 30. Reflectance Curves for Iron Oxide Coatingwith and without Organic Overcoat
58

t-
I I I
' '
Figure 31. Anchor Clip and AbsorberBracket Detail
59

5. Four sheet metal screws are used to attach these threesides together.
6. The assembly is rotated, the fourth side is fitted with thespline, and then the fourth frame side is tapped into posi-tion. The frame is completed by securing these two cor-ners with four more sheet metal screws (Figures 32 & 33).
Collector Assembly
The collectors are assembled in the following steps:
1. Weep holes are drilled in the housing along the intersectionof the box back and bottom. (Figure 34)
2. The insulation is fitted in 2. 5 cm x 10. 2 cm (1 in. x 4 in.)strips around the edge, and the bottom is filled in with 7. 6cm (3 in.) of semirigid fiberglass. A black polyester fab-ric is used to cover the yellow edge insulation. The mater-ial is tested in an oven at 204°C (400° F) for shape changeor degradation. For a production collector, black insula-tion should be used. (Figure 35)
3. The absorber brackets and cover frame anchor clips areplaced in position on the box edge and squeezed into the boxmaterial. The edge fiberglass is trimmed to make room forthese brackets. (Figures 36, 37 and 38)
4. The absorber is instrumented and placed in position withouttubes connected. The absorber is fastened to the nylon ab-sorber brackets using self tapping sheet metal screws.(Figures 39 and 40)
5. Holes 2. 5 cm (1 in. ) in diameter are drilled in the box endsand fiberglass in line with the header tube outlets. The tubesare attached from the outside using a 5/8 in. socket wrenchwith a hollow handle. Rubber grommets are slid onto thetube and into the hole in the housing. (Figure 41)
6. The inside glass of the cover assembly is cleaned and thenthe cover assembly is placed in position. Holes are drilledin the appropriate positions, and sheet metal screws areused to attach the cover frame to the absorber brackets andanchor clips. (Figures 42 and 43)
7. Thermocouples are installed on the two collectors at the ap-propriate assembly steps according to the sketch providedby MSFC. Figure 44 shows the location of these thermo-couples.
60

Figure 32. Glazing Spline is Fitted on Glass
Figure 33. Frame is Secured with Sheet Metal Screws
Ctf^INAL PA 61

Figure 34. Weep Holes are Drilled in Housing
Figure 35. Insulation is Cut for Housing
62

Figure 36. Insulation is Cut to Allow forAbsorber Bracket
Figure 37. Absorber Bracket is Snapped into Place
63ORIGINAL PAGE ISOF POOR QUALITY

Figure 38. Bracket is Clamped Securely to Housing
Figure 39. Absorber Panel is Placed in Housing
64

Figure 40. Absorber is Fastened to Nylon Brackets
Figure 41. Rubber Grommets are Placed in Position
65

I •
Figure 42. Holes are Drilled Over Brackets
Figure 43. Cover Frame is Screwed to Housing
66

L/2
x *r> ©(6s
iFlow
-Air gap
Air gap
Insulation
Figure 44. Thermocouple Locations (Iron Constantan)
67

The assembled collector is a rigid unit. It is not necessarily watertight as there is no weather stripping between the cover frame andbox. This could easily be changed with the addition of a butyl rub-ber sealer along the box edge.
68

COLLECTOR PERFORMANCE
Test Plan
The tests conducted on the two collector configurations investigatedthe effects of variations in fluid inlet temperature and incident fluxlevel. The test data were used to generate steady state performancecurves for the one and two cover collector configurations.
Leak Test
The absorber panels were pressure tested to 25 psig for leaks. Thistest was made prior to application of the absorber coating.
Indoor Test Facility
The collector tests are conducted in an indoor test facility that uses asolar simulator to provide the incident flux. The solar simulator gen-erates a range of flux levels that closely approximates the distributionof the solar spectrum at air mass 2. The simulator consists of 143projection lamps evenly spaced in a 1. 83 m (6 ft) square array con-taining 14 rows and 11 columns. The output from each lamp is col-limated by a 15 cm (6 in. ) diameter plastic Fresnel lens set in an ar-ray 23 cm (9 in) in front of the lamp array. Using the Fresnel lensesresults in a flux output that is essentially 100 percent direct radiation.
The solar simulator is powered by a three phase, 208 volt "wye" con-figuration circuit capable of providing 43, 000 volt amperes of power.Each phase of the circuit is monitored by an SCR power controllerwhich restricts the power output from zero to full scale, dependenton an operator supplied control signal. The full-scale output from thesolar simulator is 1010 W/m2 (320 Btu/hr-ft2) at a distance of 4. 57 m(15 ft) from the lens array.
This solar simulator is similar in design to that at the NASA Lewis Re-search Center, Cleveland, Ohio. A detailed discussion of solar simu-lator design and operation may be found in NASA Technical Memoran-dum TMX-3059, Low Cost Air Mass 2 Solar Simulator".
The collector test loop is presented diagrammatically in Figure 45.System operation is as follows:
The gly col/water mixture is pumped from the reservoir to a 4. 57 m(15 ft) constant head tank. An overflow line to return fluid to the res-ervoir maintains a constant pressure head. This pressure headdrives fluid to a conventional hot water heater and then through a con-stant temperature bath. From there, the fluid goes through the flow-
69

Initnmnnulloo
A. Solar radiation rMasurtmnt:
B.
1. Pyranontttr - Eppley 8-482. Digital rtcordw - Doric, Digilrend 210Tmiptrature ixawrament :
1. Thatmaplltf - five Junction - Iron-constantan2. Thcrnocouplti - rron-conittntJii3. Digital record* - Doric, Digiirend 210
C. Flow meatumiem:
1. Flownetcr - Brookj
Mi.in) cup andIraptratuft MnMr
Figure 45. Diagram of Indoor Collector TestLoop
meter and to the collector. The outlet from the collector returnsfluid to the reservoir and completes the cycle. The valve placedbetween the constant temperature bath and the flowmeter regulatesthe flow.
Mixing cups, each containing a five junction thermo-pile and a ther-mocouple, are inserted at the inlet and outlet of the collector. Fromthese, the fluid temperature difference across the panel and fluid in-let and outlet temperatures can be measured. Another thermo-coupleplaced behind the collector stand measures the ambient temperature.These temperatures are recorded on a digital recorder. Iron constant-an thermocouple wire is used for these measurements.
The flow rate is determined by using a calibrated flowmeter. As thesystem approaches steady state, the flow rate is maintained at a con-stant value. This flow rate is also periodically checked by measur-ing the time for the return fluid to fill a 1000 ml graduated cylinder.
The flux from the simulator is determined using an Eppley pyrano-meter. A 16 point flux map at the collector surface is made and re-corded for each experimental run. The average value is used as theeffective incident radiation level.
70

Test Matrix
Each performance test is run with a 48. 9 kg/hr m^ (10 Ibm/hr-ft^)flow rate of nominally 50/50 water/ethylene glycol solution. The col-lector is tilted at an angle of 34 degrees with respect to horizontaland with a zero effective wind velocity across the face of the collector.The test matrix for each collector is shown in Table 12.
TABLE 12. - TEST MATRIX
Ambient temperature = 21° C ( 70° C)Wind velocity = 0 kph (0 mph)Collector tilt angle = 34°Mass flow rate = 48. 9 kg/hr-m2 (10 lbm/hr-ft2)
Flux, W/m2
(Btu/hr-ft2)
473
(150)
789
(250)
1010
(320)
Testparameter
m, lb/hr-ft2
C , Btu/lb-°F
AT, °F
Qcol, Btu/hr-ft2
Q.nc, Btu/hr-ft^
•nm, lb/hr-ft2
C , Btu/lb-°FP
AT, °F
Qcol, Btu/hr-ft2
Qinc. Btu/hr-ft2
m, lb/hr-ft2
C , Btu/lb-°FP
AT, °F
Q*°c, Btu/hr-ft2
Inlet temperture27° C
(80° F)49° C
(120° F)71°C
(160° F)93° C
(200° F)
71

A test cycle consists of preheating the fluid reservoir to the desiredinlet temperature, 27°C (80°F), 49°C (120°F), 71°C (160°F), or93°C (200°F), allowing flow through the collector to maintain inlettemperature equilibrium throughout the system. Once the desiredinlet temperature is attained, the primary heater is shut off, theflow rate is adjusted to 48. 9 kg/hr-m2 (10 lbm/hr-m2), and theinlet temperature is trimmed and maintained by the constant temp-erature bath.
After firing up the solar simulator, the flux map for th6 intended in-cident flux level is measured, and the illuminated collector is allow-ed to run until equilibrium is observed for the fluid temperature riseacross the collector. Values for the inlet temperature, fluid temp-erature rise, fluid mass flow rate, and incident flux level are then re-corded. The actual measurement process takes approximately thirtyminutes, once initial fluid inlet temperature equilibrium has been a-chieved.
The measurement process is then repeated for the next incident fluxlevel, without altering the flow rate or fluid inlet temperature.
Data Reduction
The data are reduced using a Hewlett-Packard programmable calcu-lator which calculates the thermal efficiency for each test run andprovides a linear curve fit of the data points on a graph of efficiency,T\ , versus the parameter [(^inlet - ^ambient) /QincidentJ . Fromthese performance curves a heat removal efficiency factor, * R, andan overall heat loss coefficient, L, can be found from the followingequation:
= FR
Here of is the measured plate absorptance and T is the effective trans -mittance of the cover system. These *R and UL factors may then becompared with those of other conventional flat plate solar collectorswhich have been tested on the same solar simulator. A discussion ofthe above equation and results of similar testing can be found in NASACR- 134804, "Development of Flat Plate Solar Collectors for the Heat-ing and Cooling of Buildings, " by J. W. Ramsey, J. T. Borzoni and T.H. Holland.
Performance Test Results
The one and two cover versions of the solar collector were tested usingthe contractor's solar simulator. Test results and performance curvesfor each of the two solar collectors are shown in Tables 13 and 14 andFigures 46 and 47 respectively.
72

TABLE 13.- COLLECTOR TEST DATA FOR MSFC SOLARCOLLECTOR WITH ONE GLASS COVER
Ambient temperature = 21 °C (70°F) Diffuse /direct ratio = 0Wind velocity = 0 kph (0 mph) Percent ethylene glycol inCollector tilt angle = 40° heat transfer fluid = 57%Mass flow rate = 53. 8 kg/hr-m2
(11 lbm/hr-ft2) • Note: All English units
Flux,W/m2
(Btu/hr-ft2)
473(150)
631(200)
789(250)
Testparameter a
m
VAT
Qcol
Qinc
f\
m
CPAT
Qcol
Qinc
T)
m
CPAT
Q-incr\
Inlet temperature
27°C(80°F)
7.34
.7900
13.33
77.3
134.0
.577
7.55
.7900
17.46
104.2
168.3
.618
11.89
.7896
13.80
129.6
203.7
.636
49°C(120°F)
11.49
.8109
8.87
82.6
147.4
.560
11.48
.8124
14.00
130.6
223.1
.585
11.48
.8131
16.33
152.4
262.9
.580
71°C(160°F)
11.25
.8331
5.07
47.5
134.3
.354
11.50
.8337
7.00
67.1
166.6
.403
11.24
.8336
8.87
83.1
204.1
.407
93°C(200°F)
11.26
.8553
1.07
10.3
138.6
.074
11.17
.8561
3.73
35.7
166.2
.215
11.16
.8568
6.27
59.9
199.6
.300
See Table 12 for test parameter units.
73

TABLE 14.- COLLECTOR TEST DATA FOR MSFC SOLARCOLLECTOR WITH TWO GLASS COVERS
Ambient temperature = 21°C (70°F)Wind velocity = 0 kph (0 mph)Collector tilt angle = 40°Mass flow rate = 53. 8 kg/hr-m2
(11 lbm/hr-ft2)
Diffuse/direct ratio = 0Percent ethylene glycol in
heat transfer fluid = 57%
Note; All English units
Flux,W/m2
(Btu/hr-ft2)
473(150)
631(200)
789(250)
Testparametera
m
CPAT
QcolQinc•n
m
CPAT
Qcol
Qinc
n
m
CPAT
Qcol
Q-incr\
Inlet temperature
27°C(80°F)
11.99
.7990
10.00
95.80
161.9
.592
11.67
.8009
14.67
137.1
228.3
.600
11.80
.7908
16.60
154.9
253.6
.611
49°C(120°F)
11.49
.8115
7.07
65.9
134.6
.490
11.46
.8143
12.53
117.0
214.5
.545
11.53
.8162
14.93
140.5
264.6
.531
71°C(160°F)
11.78
.8336
6.67
65.5
154.5
.424
11.78
.8351
12.00
118.1
215.1
.549
11.38
.8380
11.73
111.9
257.7
.434
93°C(200 °F)
11.42
.8564
4.80
46.9
142.3
.330
11.24
.8580
10.40
100.3
219.7
.457
11.16
.8581
12.87
123.2
265.3
.464
aSee Table 12 for test parameter units.
74

1.0
.8
.6 -
.4
.2
"
.2 .4 .6 .8 1.0
Ti_ - T__L. o i
lnc
Figure 46. Performance Curve for Single-Cover MSFC Solar Collector
1.0 ,
.8
.6 •
.4
.2 .
= .62-.32*lnc
0 .2 .4 .6 .8 1.0
'?." m* (Btu/hr-ft2-0^1
" li*lnc
Figure 47. Performance Curve for Two-Cover Solar MSFC Collector
75

The equations of the performance curves shown in Figures 46 and 47were generated by a linear regression curve fit of the test points.These resulting performance equations are as follows:
One-cover NASA MSFC solar collector:(T. - T , )
T\ = . 69 - . 60 x" amb
T.nc
Two-cover NASA MSFC solar collector:
.TV = . 62 - .32(T. - T , )in amb
For purposes of evaluation, the results are compared with those of awell designed conventional solar collector* which has been tested un-der identical conditions. Two-cover configurations for both collectortypes are .compared in Figure 48.
For a typical air conditioning application, an ambient temperature of80°F and a collector inlet temperature of 200°F, an average solar fluxof 250 Btu/hr-ft2 would generate the following collector efficiencies:
Collector efficiency forCollector configuration typical cooling application
MSFC with one cover 40 percent
MSFC with two covers 47 percent
Black paint collectorwith one cover 27 percent
Black paint collectorwith two covers 33 percent
The MSFC one and two cover collectors are 48 and 42 percent better,respectively, than the corresponding black painted collectors.
*This collector has a nonselective black painted Roll Bond aluminumabsorber in a steel box with glass covers and fiberglass insulation.
76

1.0
.6 -
.4
.2
2 covers (MSFC)
1 cover (MSFC)
1 cover X"—- 2 covers
.2 .4 .6 .8
I, -T.
1.0
NASA MSFC Solar Col lector
1-Cover : n = .69 - .60
2-Cover • fl = .62 - .32
fyW~^
rcin-W
^inc
Well-Designed Black PaintSolar Collector
1-Cover := .84 = 1.19
2-Cover : = -75- .89
Figure 48. Comparison of MSFC and Well-DesignedFlat-Plate Solar Collectors
77

For a typical heating application (i. e., an ambient temperature of 40°F and a collector inlet temperature of 120°F), a 250 Btu/hr-ft2 insola-tion level would generate the following collector performance efficien-cies:
Collector configuration
MSFC with one cover
MSFC with two covers
Black paint collectorwith one cover
Black paint collectorwith two covers
Collector efficiency fortypical heating application
50 percent
52 percent
46 percent
47 percent
The one-cover MSFC collector is 6 percent better than the two-coverblack painted collector. The one- and two-cover MSFC collectors are9 and 11 percent better, respectively, than the corresponding blackpainted collectors.
Utilization
Daily collection values for typical heating and cooling conditions havebeen obtained empirically using the performance equations given inFigure 48 and ASHRAE calculated solar insolation for a clear day inthe appropriate season. These curves are shown in Figures 49 and50 for summer cooling (June) and winter heating (December), re-spectively. The results are summarized in Table 15.
TABLE 15. - DAILY COLLECTOR PERFORMANCE SUMMARY
• Collectorconfiguration
MSFC
Black paint
1 cover
2 covers
1 cover
2 covers
Daily collector efficiency
Summercooling
Tamb= 80°F
Tinlet=200°F
33. 1
41.2
21.2
25.6
Winterheating
, Tamb= 40°F
Tinlet=120°F
45.9
49.9
40.0
42.1
78

350 J
Total Insolation6/21 at 34°N. lat34° U It angle
Figure 49. Daily Collection Curve for Summer Cooling
:,-rn-jAL PAGE IS •' QUAJOT
79

350
Total Insolation12721 at 34° N. lat.34b tilt angle
760 (42%)
720 (40%)
2 glass covers
11 12 1
Local solar time
Figure 50. Daily Collection Curve for Winter Heating
80

Table 16 summarizes the percentage increase due to the additionalcover and also compares the MSFC collector with the well designedblack painted collector.
TABLE 16. - ENERGY COLLECTION INCREASE COMPARI-SON BETWEEN SEVERAL COLLECTOR CON-FIGURATIONS
Collector configurationcomparison
Increase from
MSFC 1 cover
BLPT 1 cover
BLPT 1 cover
BLPT 2 cover
To
MSFC 2 cover
BLPT 2 cover
MSFC 1 cover
MSFC 2 cover
Percentage increase
Summer
24.5
20.8
56. 1
60.9
Winter
8.7
5.2
14.8
18.5
In all cases, the MSFC collector is superior to the conventional blackpainted collector. The MSFC collector is significantly better than theblack painted collector for heating, and especially so for cooling. Thisis due to the selective coating and also the increase in insulation due tothe box material itself.
81

OUTDOOR TESTING AT MARSHALLSPACE FLIGHT CENTER
Two assembled collector units (1 each of one and two cover units) weredelivered to NASA MSFC on 24 October 1975 for testing. They wereinstrumented with iron constantan thermocouple wire (Type J). Thethermocouples were installed using metalized silicone rubber cementand aluminum foil tape in the locations specified by NASA MSFC. Ex-ternal thermocouples were not attached but were delivered with thecollectors.
The collectors were mounted on an outdoor test rack during January,1976 by NASA personnel. Shortly thereafter, two conditions werenoted by the NASA technicians: the inner glass had cracked on thetwo cover collector, and a film had collected on the inner glass sur-face.
The contract monitor called on 27 January 1976 to indicate that he hadremoved the two cover collector from the test rack because of a crack-ed inner cover. He further indicated that both the one and two covercollectors had condensation partially obscuring the cover glass(es) andalso that both collectors were holding some water from a rain storm.The contract monitor's intent was to replace the broken cover glassand resume testing; however, he did not have a set of collector draw-ings and was reluctant to disassemble the collector without them.
It was subsequently agreed that the contractor's engineers would visitthe facility to evaluate the condition of the collectors. Upon arrivalat MSFC, the engineers examined the two cover collector and madethe following observations:
• The inner cover had a series of cracks around its peri-phery, similar to those previously observed at the con-tractor's plant, resulting from no flow operation with anonselective absorber coating.
• Both cover glasses were coated with some outgassing by-product, having an odor similar to that of Krylon.
• Deposits of a brown fluid were noted on the sides of thecover frame near the top edge of the collector.
• Approximately one quart of fluid, apparently water, drain-ed from the box beneath the absorber when it was tipped toa vertical position.
82

• A white granular deposit, probably a mineral deposit, wasnoted on the bottom outside surface of the box and also onsections of the insulation covering within the box.
• The overcoat had apparently evaporated off of the top one-third of the panel. The middle third seemed quite thick andwas sticky to the touch.
Operating data were obtained from the technician who installed the collec-tor on the test rack. He indicated that the inner cover glass had crackedduring test set-up after approximately three hours of no-flow operation.The outgassing byproduct occurred during this no-flow operation period.This operating period was followed by 2 days of rain on the exposed col-lector and another period of no-flow operation, during which additionalcracking of the inner cover glass occurred.
The glass failure was apparently due to the thermal stresses in the second(inner) glass cover. The failure could be due to the higher stagnation temp-erature resulting from the superior insulation qualities of the housing or dueto insufficient selectivity of the iron oxide coating (at -*•. 90, 6—~. 20).
The overcoat evaporization is believed to have been due to the high stagna-tion temperature reached. The collector had not been connected to the in-strumentation prior to failure so the stagnation temperature remains un-known.
The overcoat evaporization and deposition on the glass were also evident onthe single cover collector which was still on the test rack. This collectorhad been instrumented but stagnation temperature readings were not avail-able.
Corrective action taken while at MSFC included the following:
• The cover frame was removed and the broken inner coverglass replaced.
• Breathing holes were drilled through the sides of the coverframe between the glass layers. Vent holes were also drilledin the sides of the box.
• Three weep holes were drilled in the bottom edge of the boxand fitted with'rivets secured by tinnerman fasteners.
83

Several additional corrective actions were proposed, to be taken by boththe contractor and MSFC.
The proposed contractor actions included the following tasks:
• Procure tempered cover glass for installation by MSFC.
• Provide an additional absorber plate with a selective blackchrome coating.
• Evaluate the need for additional condensation protection, and,if necessary, provide a desiccant system.
For its part of the corrective action program, MSFC would:
• Add weep holes to one-cover collector.
• Return two-cover collector to test rack for additional no-flowoperation.
• Test the effect of breathing holes on the condensation prob-lem.
• Provide no-flow operating temperature data for the one-covercollector.
• Test a two-cover collector with the black chrome absorber coat-ing and tempered glass.
84

CONCLUSIONS AND RECOMMENDATIONS
The collector design developed during the course of this program was in-tended to provide good collection efficiency with a low production cost inhigh volume. Three significant design features were employed to achievethe cost/performance objective: an extruded aluminum cover system sim-ilar to conventional storm window glazing; oxidation coating on the steelabsorber; and an insulation material for the collector housing.
As was evidenced by the performance test results, the use of a nonmetallichousing significantly reduces UL in both the one-cover and two-cover col-lector models. Couple this performance improvement with the potential lowcost of manufacturing (approximately $. 30/ft^ of finished collector in the 3'x 4" size delivered) and the use of a processed-paper collector housing appearsto have considerable promise. Certainly more investigation should be per-formed to further qualify the material in terms of durability and expectedlifetime. The scope of this program did not permit extensive life testingnor did it provide for adequate examination of possible additives to improvethe durability and physical characteristics of the material. In light of thepotential advantages to be derived from the use of the processed-paperhousing, further development activity, particularly in the areas of deter-mining useful life and additives for extending useful life, is recommended.
The iron-oxide absorber coating, while less effective than the more commonblack-nickel or black-chrome electroplate coatings,, offers hope of a low-costselective absorber coating. The difficulty observed during testing at MarshallSpace Flight Center was a weakness in the particular organic overcoat appliedto the iron oxide, rather than a fault of the oxide coating itself. Since theiron-oxide coating requires an overcoat to raise its absorptance into the . 90plus range, it is strongly recommended that additional effort be expended onthe determination of a suitable organic material that will increase the absorp-tance without raising the emittance to unacceptable levels, and yet still notdegrade at high temperature. This, of course, was the failure mode notedduring operation at Marshall Space Flight Center: the organic overcoatevaporated from the absorber and condensed on the cover glass while thecollector was left under no-flow conditions. While the plate temperaturewas not measured during the no-flow operating period, it is expected thatplate temperatures in excess of 400°F were experienced.
The physical design of the collector, particularly that of the cover system,proved to be easy to both manufacture and assemble. It fastens rapidly tothe collector housing and provides a weather seal without the use of adhe-sives or sealants. This enables the collector to be easily serviced wheninstalled on a roof. One disappointing aspect of the cover design was thefailure of the inner cover glass under no-flow conditions. The failure
85

observed at Marshall Space Flight Center was one of thermal stress on theinner cover glass. Substitution of tempered glass will eliminate this failuremode, but it will also increase the material cost of the collector. A secondsolution is to substitute a lower-emissivity coating on the absorber, therebyreducing the reradiation to tolerable levels. In view of the present difficul-ties observed with the iron-oxide coating, the cost of substituting a black-chrome or black-nickel coating might be offset by avoiding the need for tem-pered glass. A study of this possibility is recommended.
Since the use of a processed-paper box significantly reduces the slope of thecollector performance curve, the analysis performed early in the programto compare the performance of the one- and two-cover versions of the samecollector should be reexamined. It may well appear that the two-cover col-lector does not make economic sense for most applications with this collectordesign. This conclusion was drawn for the case of an Atlanta installationearly in the program, but it was not obvious if the one-cover collector per-formance was superior for more severe climatic applications, such as heatingin Minneapolis. It is recommended that a study of application in key citiesaround the country be performed to resolve this question. Obviously, theapplicability of the one-cover collector provides a distinct cost savings tothe would-be user.
86

APPENDIX A
THERMAL DESIGN ANALYSIS
Analysis and tests have indicated that a flat plate absorber with parallel flowpassages is an effective design in transferring the energy absorbed on thesurface to the liquid passing through the collector. In general, the key ques-tion is: What is the average plate temperature compared with the averagefluid temperature in the collector ? The difference in these two temperaturesis due to the thermal resistance between the absorber surface and the fluid.The resistance is comprised of the conduction path in the plate and the ther-mal boundary layer in the fluid. The contractor has a computer programwhich has been effectively used to evaluate these effects for many differentflow patterns and passage designs.
The thermal relationships that govern flat plate collector performance arefairly well understood and are readily available in the literature. To eval-uate the performance impact of various collector configuration changes, itis necessary to search the literature, assemble the necessary analytic re-lationships, and actually calculate the thermal performance for each caseof interest.
The following paragraphs present an analysis of two areas of interest: ther-mal and flow considerations for sizing and spacing of absorber flow tubes,and spacing between the absorber and cover or covers.
Absorber Flow Tube Size andSpacing Considerations
In this section, the overall thermal efficiency is determined for changes incertain design parameters of a typical flat plate collector. Specifically,the parameters varied were cross tube dimensions, intertube spacing, ab-sorber material, material thickness, flow rate, and absorber header size.The typical flat plate collector considered has the following characteristics:
• Width -- 76. 2 cm (30 in.)
• Length -- 114. 3 cm (45 in. )
• Working fluid -- Water
• Tube geometry — Circular
Factors Influencing CollectorThermal Efficiency
The rate of useful heat collection is given by the rate of incident solar radia-tion minus heat losses:
87

q = fa - UT (T - T 11^u r*a L 1 alj
where
a = useful heat collected, W (Btu/hr)
a = incident solar flux on absorber surface, W (Btu/hr)
UL = a lumped loss term, W/°C (Btu/hr-°F)
T = collector temperature, °C (°F)
T = ambient temperature, °C (°F)cl
Since q_ is fixed, the collector rate is optimized by making (T - Ta) as smallas possible while still maintaining a net heat flux to the working fluid (i. e.,make T - TW_O small, where TW_O is the temperature of the incoming fluid).
A thermal efficiency factor, FR, is defined by Bliss'Al) as:
actual heat collection rate*Ci _ -in .1 • in— —.̂ — i -^^—.••• • i - i i,
R heat collected if collector were atincoming fluid temperature
and an auxiliary efficiency factor, F':
actual heat collector rateheat collected if collector were at
average fluid temperature
Using the above definitions, Equation (Al) can be written in the form:
)]% = FR [** ' UL (Tw-o - Ta) I <A2>
where U_ = overall heat loss coefficient.JLi
The expression for FR in terms of F1, UL, and flow rate per unit collectorarea, kg/hr-m2 (lb/hr-ft2), G, was derived by Bliss(Al):
i _ e - lp'VCPG!
L
GC_ , , - « .(A3)
Al Bliss, Raymond W., The Derivation of Several "Plate Efficiency Factors"Useful in the Design of Flat-Plate Solar Heat Collectors. Solar Energy 3,55 (1959).
88

where Cp = specific heat of fluid, J/kg-°C (Btu/lb-°F), and
F' = — : ] J (A4)
TTdh + T f w U T i T ~ ^w + [dU + (1 - d/w)Fj
C
and
tanh U T ( W - d)/2 kMF = UT (w - d ) / l kM (A5)
where
k = conductivity of absorber material, W/m-°C (Btu/hr-ft-°F)
d = tube diameter, m (ft)
w = tube spacing, m (ft)
M = absorber material thickness, m (ft)
h = heat transfer coefficient, W/m2-°C (Btu/hr-ft2-°F)c
U = bond conductance between tube and panel, W/°C (Btu/hr-°F)C
The heat transfer coefficient for flow in the cross tubes of the absorber panelwas calculated assuming developing laminar flow. The correlation byRohsenow*A 'is given as:
TVT hcd A OR 4. . 023 (d/x) Re Pr , . f i vN u x = "k7 1 + . 0012 (d/x) Re Pr (A6)
where
Nu = Nusselt number
x = Distance along tube
Pr = Prandtl number = 0. 72 for water
Re = Reynolds number = 40/ndv
/A 2)Rohsenow, W.M. and H. Choi, Heat, Mass and Momentum Transfer.Prentice-Hall (1961), p. 142.
89

and
0 = flow rate per tube, kg/hr (Ib/hr)
2 2v = dynamic viscosity, N • s/m (Ibf. s/ft )
The average heat transfer coefficient for each tube is:
h_ = !^L rdL J Nu dx
Ji,
Results of Computations
The efficiencies FR, F ', F, and the heat transfer coefficient, hc, were com-puted for different tube diameters and spacings (Tables Al and A2), absorbermaterials and thicknesses (Tables A3 and A4), and flow rates (Table A5),assuming a loss rate of UL = 1.2. Previous analysis has shown that UL isconstant to within 1 percent over the ranges of the variables presented here.
TABLE Al. - EFFECT OF TUBE DIAMETER
Steel, M = 1. 5mm (0. 060 in. )w = 5.1 cm (2.0 in.)
•6 =4,5 kg/hr (10 Ib/hr)
d, in.
0.1
0.2
0.3
0.4
0.5
F
.9804
.9824
.9843
.9860
.9877
F'
.9479
.9505
.9528
.9548
.9567
FR.9186
.9210
.9232
.9251
.9268
90

TABLE A2. - EFFECT OF TUBE SPACING
Steel, M = 1 . 5 mm (0. 060 in. )d = 2.5mm (0.1 in.)8 = 4.5 kg/hr (10 Ib/hr)
Tubespacing,w, in.
2.0
2.5
3.0
3.5
4.0
4.5
hc, Btu/hr-ft2-°F
212
212
212
212
212
212
F
.9804
.9691
.9558
.9404
.9233
.9047
F'
.9479
.9298
.9102
.8893
.8674
.8449
FR
.9186
.8947
.8700
.8448
.8192
.7935
TABLE A3. - EFFECT OF ABSORBER MATERIAL
M = 1. 0 mm (0. 040 in.) '6 = 4.5 kg/hr (10 Ib/hr)d = 2.5mm (0.1 in.)w = 5.1 cm (2. 0 in.)
Material
Steel
Aluminum
Copper
F
.9710
.9939
.9966
F'
.9395
.9598
.9962
FR
.9107
.9297
.9321
TABLE A4. - EFFECT OF ABSORBER THICKNESS
Steel, d = 2.5mm (0.1 in.)w = 5.1 cm (2.0 in.)6 = 4.5 kg/hr (10 Ib/hr)
M, in.
.060
.040
F
.9804
.9710
F'
.9479
.9395
FR.9186.9107
91
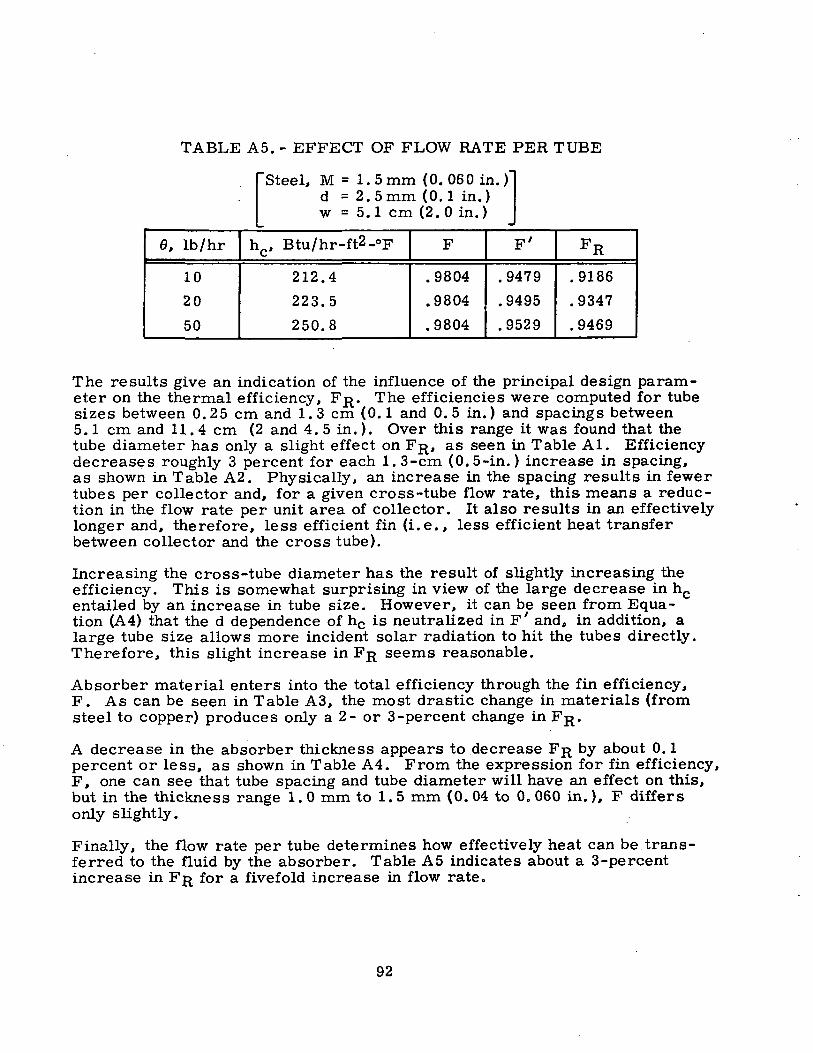
TABLE A5. - EFFECT OF FLOW RATE PER TUBE
'Steel, M = 1.5mm (0.060 in.)d = 2.5mm (0.1 in.)w = 5.1 cm (2. 0 in.)
0, lb/hr
10
20
50
h , Btu/hr-ft2-°F\*t
212.4
223.5
250.8
F
.9804
.9804
.9804
F7
.9479
.9495
.9529
FR
.9186
.9347
.9469
The results give an indication of the influence of the principal design param-eter on the thermal efficiency, FR. The efficiencies were computed for tubesizes between 0.25 cm and 1.3 cm (0.1 and 0.5 in.) and spacings between5.1 cm and 11.4 cm (2 and 4.5 in.). Over this range it was found that thetube diameter has only a slight effect on FR, as seen in Table Al. Efficiencydecreases roughly 3 percent for each 1.3-cm (0.5-in.) increase in spacing,as shown in Table A2. Physically, an increase in the spacing results in fewertubes per collector and, for a given cross -tube flow rate, this means a reduc-tion in the flow rate per unit area of collector. It also results in an effectivelylonger and, therefore, less efficient fin (i.e. , less efficient heat transferbetween collector and the cross tube).
Increasing the cross-tube diameter has the result of slightly increasing theefficiency. This is somewhat surprising in view of the large decrease in hcentailed by an increase in tube size. However, it can be seen from Equa-tion (A4) that the d dependence of hc is neutralized in F' and, in addition, alarge tube size allows more incident solar radiation to hit the tubes directly.Therefore, this slight increase in FR seems reasonable.
Absorber material enters into the total efficiency through the fin efficiency,F. As can be seen in Table A3, the most drastic change in materials (fromsteel to copper) produces only a 2- or 3 -percent change in FR.
A decrease in the absorber thickness appears to decrease FR by about 0. 1percent or less, as shown in Table A4. From the expression for fin efficiency,F, one can see that tube spacing and tube diameter will have an effect on this,but in the thickness range 1. 0 mm to 1. 5 mm (0. 04 to 0. 060 in. ), F differsonly slightly.
Finally, the flow rate per tube determines how effectively heat can be trans-ferred to the fluid by the absorber. Table A 5 indicates about a 3 -percentincrease in FR for a fivefold increase in flow rate.
92

Effects of Cross-Tube Geometry and Header Size
Previous considerations of the flow problem indicate a more efficient transferof heat from the.absorber if the flow is uniformly distributed through the crosstubes. Since the flow through each tube is dependent on the pressure changebetween the entrance and exit, this change should be kept as uniform as pos-sible. Considering the sketch of a collector that follows, an expression forthe change in pressure along the supply header can be written as:*
' 4f I) 0 T - d (A8)
Collection header
Cross tubes
Supply header
The first term is the pressure drop due to viscosity and the second representsthe pressure gain due to the loss of momentum to the cross tubes. In theequation, K is some constant factor depending on the tube entrance conditions.A similar expression for the pressure change along the collection header canbe written as:
<AP)coll = 4f X + d ( K P V c ) (A9)
*See Table A6 for definition of symbols applicable to Equations (A8)through (A20).
93

TABLE A6. - LIST OF SYMBOLS
Symbol Description
frr Friction factor (header)
X Distance along heater, m (ft)
V Velocity along header, m/hr (ft/hr)
K Entrance loss coefficient
D Header diameter, m (ft)
p Density, kg/m3 (lbm/ft3)
(Ap) .. Pressure change along collection header, kg/m^ (psig)
V Velocity along collection header, m/hr (ft/hr)
n Number of cross-tube station (measure from entrance)
N Total number of cross tubes
L Length of header, m (ft)
V Velocity along supply header, m/hr (ft/hr)s
c Velocity in cross tubes, m/hr (ft/hr)
q Flow rate per tube, kg/hr (Ibm/hr)2
Ap Average pressure change across two headers, kg/m (psig)
B Total flow rate, kg/hr (Ibm/hr)
f Friction factor (tubes)
£ Length of cross tubes, m (ft)
z.. Width of rectangular tube, m (ft)
z« Height of rectangular tube, m (ft)
f Friction factor corrected for rectangular tube
94

Since the collector consists of a finite number of cross tubes, the equivalentdiscrete equations for the n^1 cross-tube station can be written as:
'^supply ' IT I fe)pV.2-«KPo (A10)
' f1 (I) P V c2 + n K p c (All)
where L is the total length of the header, N is the total number of cross tubes,and c is some appropriate mean cross-tube velocity. In terms of the overallflow rate, Q, and flow rate per tube, q, we can write the above equations inthe form:
64fn 16nKq ,..„,(A12)
22 L\ fn , 16nKq2 ,. . „,( '
Thus,
(AP)S - (Ap)c = ApS C
or, since q = Q/N, we have:
64fn |L\ID!
/A \(Ap) =
(Q - 2nqQ) -
Q2 - 2nQ2 1 32nKQ2
T T p d
(A 14)
Notice that the pressure difference varies roughly parabolically down thelength of the header. Now, if this fluctuation in pressure is small comparedwith the cross-tube viscous pressure drop, then we can assume the flow willbe reasonably uniform. The cross-tube pressure drop is
A f [ l \ 2 A. ll\ 16q2
t= 4f(-j pc = 4 f t [ d ] —$-f
where I is the cross-tube length.
95

Therefore,
(Ap). = 64f. |J) -SU- (A15)* t l d / Ti2d4p
and the largest Ap from Equation (A7) is roughly
/A \ 64f |L\ ~2 32nKQ2 / A , _ V
(Ap) = 0 4 n Q 224 <A16>max prr^ND4 IDI N^iT^pd 4
We therefore require
.2|L\ Q2 _ 32KQ , <<64f U\In I ^ 2 9 4 ^^041. I , II D ' ^ ^ 4 t V d /9 4 In I ^ 2 9 4 xt iHJ 2 24tb^.-^rz ILJ I -KI>£_£ i^t T *Q * IITM A «rzPTT ND N TT pd N prr d
or
%
ND" '"•" 2N"d" " 1UI N2d4
or
Thus,
n4 Nfw (L/D)(A18)
for a noncircular cross section. According to Rohsenow and Choi, D may beinterpreted as an equivalent diameter given by:
D = 2e L
(A19)
and a correction function, 0, is introduced so that
T = 16/Red 0 (A20)e
96

Although rather crude, Equation (A18) gives some indication of the necessaryrelationship between cross tubes and header size. A small L/D would tend toincrease the required D/d ratio (i.e., smaller tubes or larger header), or alarge number of cross tubes would require a larger D/d ratio.
Summary
To summarize,, we have found that for reasonably small variations in the de-sign parameters of a flat-plate solar collector, the overall thermal efficiencyas given by the Bliss formulation is" altered only slightly. For tube diametersbetween 2. 5 mm and 12. 7 mm (0. 1 and 0. 5 in. ), a less than 3 percent changein FR per every 2. 5 mm (0. 1 in. ) of variation can be expected. For tubespacing in the range 5. 1 cm to 11.4 cm (2. 0 to 4. 5 in. ), a similar 3 percentchange for each 1. 3 cm (0. 5 in. ) is found. The significant material changeproduced only about a 2 or 3 percent change in the efficiency. In the thick-ness range of 1. 0 mm to 1. 5 mm (0. 040 to 0. 060 in. ), a change of less than1 percent is found, and, finally, for flow rates in the range from 4. 5 to 22. 7kg/hr tube (10 to 50 Ib/hr tube), there is less than a 5 percent effect on FR.The flow uniformity seems to depend primarily on a reasonably high ratioheader to cross tube size, so that variations in the pressure between supplyand collection headers is bounded by the viscous pressure drop across thetubes.
Collector Cover to Absorber Panel Spacing Considerations
Heat is lost from the absorber panel by conduction through the bottom and sidesof the collector assembly insulation and by convection and radiation through thetop cover. The convection heat transfer between the absorber panel and coveror between covers is dependent upon the air gap spacing. The following analy-sis was performed to assess the importance of absorber to cover spacing.
Free convection between parallel surfaces has been studied for some time anda number of correlations exist between the heat transfer coefficient and theproduct of the Grashof and Prandtl numbers. This product (the Rayleigh num-ber) is a measure of the relative importance of bouyant forces and can be writ-ten as the product of the following quantities:
Ra = g0 _ (A21)
-v *
where
Ra = Rayleigh number
2 2g = acceleration of gravity, m/sec (ft/sec )
97

/3 = coefficient of thermal expansion, °C (°F~ )
AT = temperature difference between two surfaces, °C (°F)
2 2v = kinematic viscosity, m /sec (ft /sec)
d = spacing between surfaces, m (ft)
v = kinematic viscosity, n
Pr = Prandtl number = v/o2 2
ex = coefficient of thermal diffusivity, m /sec (ft /sec)
The relationship between the Rayleigh number and the convective heat transfercoefficient, hc, has the form:
hod
Nu = ~— = C (Ra)n (A22)air
where Nu is the Nusselt number, c and n are empirically determined con-stants, and k^j. is the thermal conductivity of air in W/m-°C (Btu/hr-ft2-°F).
expressed the Rayleigh number in the following way:
Ra = a d3 AT (A23)
where
a = g /3p 2 Cp/H. ka.r
Using Equation (A23), we may rewrite Equation (A22) in the form:
unnh = C(k . an)c air d -3n (A24)
As can be seen, for fixed AT, hc decreases with increasing gap distance.However, as d increases so does the Rayleigh number, and experiments indi-cate that the coefficient, C, and the exponent, n, will be altered. Taborrecommends the following correlations between hc and Ra for typical flat-plate collectors at various orientations:
(A3)x 'Tabor, H., Radiation, Convection and Conduction Coefficients in SolarCollectors. Bull, Res. Council of Israel, Vol. 6C, pp. 155-176(1958).
98

Horizontal planes, heat flow upwards;
4. 7Nu = 0.168 (Rar" for 10* < Ra < 10*
• 4 5 -degree inclination, heat flow upwards:
Nu= 0.102 (Ra)°'310for 104 < Ra < 107
• Vertical planes:
n 397 s 7Nu = 0.0685 (Ra) ' * for 1.5 x 10 < Ra < 10
4 7For most collectors the Rayleigh number falls between 10^ to 10' so that thefunctional dependence of hc on the gap distance can be seen immediately fromEquation (A24). For a collector tilted at 45 degrees:
hc ~ ^07 <A25>
Therefore, doubling the distance between the cover and absorber decreasesthe convective heat transfer by about 5 percent.
The energy transfer between the absorber panel and the first cover is exactlythe same as between any other two adjacent glass covers and is also equal tothe energy lost to the surroundings from the top cover. The heat transferequations that describe the energy transfer are:
= hcl (Tc / V + ecl*(Tc4 - Tgl1 + K(Tc - Tgl)/dl <A26>
4q/A = hc2 (Tgl - Tg2) + e12a (Tgl4 -Tg2
4) +K(Tgl -Tg2)/d2 (A27)
q/A = hcij (Tg. - Tgj) + e. .a (Tg.4 -Tgj
4) + K(Tgi - Tg.)/d.. (A28)
• hw ^n - V + ^na" T ' T (A29>
where2
q/A = heat loss in Btu/hr-ft
h . - = convection heat transfer coefficient between itn and jtn covers
99

T = absorber temperature
T . = i cover temperaturegi
e.. = effective emissiviiy between i and j covers
cr = Boltzmann constant
K = conductivity of air, , ^ .th , .thd.. = spacing between i and j covers
h = convective heat transfer coefficient for outer cover =W 4 to 5 Btu/hr-ft2-°F
T = ambient temperature
n = number of covers
a = ambient
It is assumed that the effective sky temperature is equal to the ambienttemperature.
Each equation represents the heat flux from one cover to the next via convec-tion, radiation, and conduction, the last equation is the heat flux from the n*hcover to the environment. The equations were solved for both a single-coverand a two-cover collector. The thermal conductivity, viscosity, and Prandtlnumber for air were assumed constant. For Rayleigh numbers less than 10 ,̂it was assumed that
Nu = 1 or h = K/d (A30)c
The results of computations are shown graphically in Figure Al for a two-cover collector. The total heat loss to the environment is plotted versus theouter cover spacing for three different inner-cover spacings. The break inthe graph represents the regime where the Rayleigh number is near 10 000and a good correlation was unavailable. Below an outer spacing of about1.9 cm (0.75 in.) the Rayleigh number is below 10 000 and the convection andconduction losses are assumed equal. Above 2.2 cm (0.875 in.) the correla-tion introduced by Tabor was used for the convected heat loss.
100

CO
V)o
IQ<D
sO
5
4
3
2
1
60
9
8
7
6
5
4
3
2
1
50
49
48
3/4 In.
23 4 5 6 7 89 10 11 12 13 14 15 16
Outer spacing/ 1/8-in. increments
Figure Al. Heat Loss versus Cover Spacing
101

APPENDIX B
SELECTIVE ABSORBER COATING ANALYSIS
For a heating and cooling system, the primary requirements for the absorbercoating are high optical efficiency (high solar absorptance, a, and low infra-red emittance, e), low cost, and satisfactory environmental durability.These properties are discussed in this appendix for:
• Black nickel• Black chrome• Copper oxide• Substrates• Iron oxide coatings on steel• Organic overcoats
Following the discussion of these coating materials is a supplementary dis-cussion of iron oxide and organic overcoating.
Coating Description
Black Nickel
Black nickel is a nickel-zinc-sulfur complex which can be applied to manysubstrates by an electroplating process. This coating achieves high solarabsorption through the combined effects of interference and absorption andis transparent in the infrared (2 to 20 nm), so that a low-emittance metalsubstrate will show through in that region.
The contractor1 s preliminary durability tests on black nickel indicated it couldwithstand 1 week in air at approximately 550°F, approximately 1/3 sun yearsof ultraviolet, and the equivalent of 40 years of thermal cycles from roomtemperature to ~ 104°C (~ 220°F). Therefore, a program to improve theoptical efficiency of the coating was initiated in which the effects of bathcomposition, temperature, and pH and plating current densities and timeswere evaluated. It was found that the composition could be altered so that themaximum effect of a natural absorption of the coating in the solar wavelengthsand an optical interference effect could be obtained. These studies enabledus to improve the coating absorption from approximately 86 percent (typicalof industrial plating job shops) up to approximately 96 percent while achievingan emittance of 7 percent at 200 F. The spectral reflectance of such acoating is shown in Figure Bl.
103
BUM*

100 ,
90 •
80-
70 .
60-
50 •
40 _
30 .
Two- layerblack nickel2 • 10"5 cm
jY/SSSSSS/Si.x\\S\SvVv\V
10"3 cm Nl
Substrate
)
20 _
10
.2 i ib 2bWavelength,
Figure Bl. Spectral Reflectance of Black NickelSelective Coating
The contractor's investigation of black nickel coatings included process scale-up to 3 x 4 ft panels, evaluation of long-term bath degradation, and opticalreproducibility. The scale-up was successful except for a tendency for colorfringes to form near the edges of large panels due to optical interferenceeffects. This problem does not significantly affect performance and can beminimized with careful placement of the panel and anodes during the electro-plating. The bath itself was found to be remarkably stable over 5 months ofuse during which approximately 150 panels were plated. Under constant use,it was necessary only to adjust pH every other day and maintain a criticalthiocyanate ion concentration every week or two.
All panels that were measured (approximately 15) had ^94 percent solarabsorptance with emittance less than 10 percent at 200°F.
There were, however, variations in panel resistance to the combined effectof thermal and humidity cycling. A test regularly used follows the procedureof MIL-STD-810B, Method 507, Procedure I. This test consists of a thermal
104

and humidity cycle, from room temperature to 71°C (160°F) at 95-percentRH and from 71 °C to room temperature at >85-percent RH, over a 24-hourperiod. This is a very severe, accelerated environmental test. The testconditions impose a vapor pressure on the panels which constitutes the majorforce behind moisture migration and penetration. Some coated panels sur-vived over 1 week under this test, while others completely corroded after1 day. Some coating parameters which may be important to humidity resis-tance include:
• Low thiocyanate concentration• "Old" (oxidized) bright nickel substrates
• Pitted nickel substrate (galvanic cell problems)
There may be other parameters not yet identified.
A possible solution to the humidity-induced corrosion problem might be theuse of humidity-resistant, silicone-based coatings which can be applied overthe solar absorber coating. These coatings have high-temperature stability,do not greatly increase the overall emittance values, and in most casesincrease the solar absorptivity due to their low refractive index. Thesecoatings provide a degree of corrosion protection, but it is not known if theylead to a significant long-term improvement.
Black Chrome
Black chrome is a commercial electroplated chrome-oxide coating withdiffuse reflectance properties. Manufacturer's data indicate that the coatingremains black to temperatures of 900°F in air. Significantly, a black chromecoating developed by the contractor showed no change in optical propertiesafter 1 week in the MIL-STD-810B humidity test.
We have briefly studied the effects of current density, bath temperature, andplating times on the optical performance of black chrome. Our best blackchrome coating had an a of 96 percent with e (200°F) of 12 percent (on nickelsubstrate).
Copper Oxide
Our experience with CuO coatings is rather limited, since the performanceachieved in early studies could not greatly improve upon literature values ofa = . 90 and e = . 20. More work with this chemical-dip-type coating is justi-fied, due to its relatively low cost; however, it does require a copper substrateor copper absorber plate.
105

Substrates
The primary optical requirement of the substrate* is to provide a surface withlow infrared emittance. The material also must not easily corrode since thethin black absorber coating provides little protection.
Aluminum, zinc (galvanized steel), and copper provide substrates somewhatstable to corrosion when oxidized but have fairly high emittance under thoseconditions (greater than 10 percent). Nickel has often been used, since itforms a stable coating for several metals and results in a low emittance(~ . 07) substrate.
The Contractor's experience has been primarily with nickel-coated steel sub-strates. Steel was selected because of its low cost, high strength, ease offabrication, and compatibility with electroplated nickel. The requirements fornickel layer are quite severe, since any pores or pinholes through the nickel willquickly lead to corrosion of the steel (due to galvanic coupling) and subsequentfailure of the panel circulation system. A straightforward solution to theproblem (i. e. , using very thick nickel layers, greater than 2-mil, leads tocost penalties (S^/mil-ft* for nickel alone).
A most important, and poorly understood, requirement for the absorbercoating is the long-term durability. Candidate coatings should possess dura-bility with respect to all reasonable environmental degradation mechanismsexpected for about a 15-year life. Thermal runaway conditions of 400°F,humidity, and thermal cycling must be withstood. Long-term corrosion dueto combined effects of humidity, 220°F temperatures, and dissolved carbon-dioxide and sulphur-dioxide gases must be minimal. The question of absorbingcoating durability must be answered. The selection of tests to evaluate coat-ing durability must be carefully made in order to allow meaningful extrapola-tion of short-term accelerated test results to predict long-term lifetimes.
The cost and optical efficiency must be tied together in analysis. Althoughthe use of selective coatings is justified for 200°F flat-plate collectors, theircost is a significant consideration, and decisions concerning candidatecoatings must be based on cost-efficiency. Examples of cost-efficiency ques-tions which should be addressed include:
• What is the minimum nickel-coating thickness for acceptabledurability?
• Is the higher emittance of coatings deposited on zinc or copperjustified by the lower cost of such coatings?
• Can absorption values be further improved?
^Substrate here refers to the surface on which the absorber coating isdeposited. It can be the same as the bulk substrate material or it can bea thin layer of material plated onto the bulk substrate.
106

Coating substrate systems which have been investigated are given in thefollowing sketch:
Coatings
Black NiBlack Cr
Substrates
NI on MNI on steelZn on steel
CuO Cu
Some preliminary estimates of large-scale coat ing-substrates costs are shownin Figure B2. Each item is followed, in parentheses, by the estimated cost indollars /ft2. These costs are based on the present industrial rates and/or ourestimate of the process. The estimated cost of a particular candidate coating-substrate combination can be found by adding the component costs on thediagram. For example, the estimated cost of a black Cr (0.15) coated gal-vanized (0. 08) steel collector panel (0. 30 + 0. 70) would be $1. 23/ft2.
The use of Cu as a basic panel would seem to be unlikely due to high materialcost; hence, Cu may also be considered as an intermediate coating for acheaper metal substrate, i. e. , like Ni and Zn.
Silicon polymer overcoat (0.03)
tBlack NI (0.10)
2-mllNl(0.20)
Black Cr (0.15)
Zn (0.08)
CuO (0.05)
t(MSFC process 0.10)
t60-mll M(0.60) 50-mll steel (0.30)+ roll bond (0.20) + seam welding (0.70)
20-mll Cu (1.90)+ Cu tube brazed tosheet (0.70)
Figure B2. Preliminary Cost Estimate for Large-ScaleCoating Substrates
107

Iron Oxide Coatings on Steel
A selective iron oxide coating (presuming a steel absorber panel), whenaugmented by an organic overcoat, has solar performance capability nearlyequal to selective black nickel with significantly greater apparent durabilityand humidity resistance. The initial materials investigation for this coatingis complete arid the results are presented in the following paragraphs.
Iron oxide coating can be applied to steel substrates by a number of chemicaland thermal processes. We have investigated primarily the Ebonol S processof Enthone, Inc. In this process the iron oxide coating is produced by im-mersing a steel part into the caustic Ebonol S solution, which is heated tojust under the boiling point (~295°F). Auger analysis of the Ebonol coatingsshow that the coating is ~48 percent iron and 52 percent oxygen. Augeranalysis cannot determine the compound form of the iron oxide but two possi-bilities are 60 percent Fe3C>4 + 40 percent free Fe or the 90 percent FeO and10 percent Fe3C>4. The manufacturer claims the coating is Fe3C>4, butapparently the composition can be changed by varying the bath temperatureand concentration. The sputter-auger depth profile of the coating in Fig-ure B3 shows a constant composition and a fairly large coating thickness.
500 25001000 1500 2000
Appropriate depth, A
Figure B3. Sputter Auger Depth Profile of Black Iron on Steel
3000
108

About 30 iron-oxide coatings were prepared during our study. The steelsurface was prepared by immersion for ~10 seconds in diluted hydrochloricacid. The steel was a cold-rolled low-carbon variety which, according toEnthone, should lead to better corrosion resistance. The effect of immer-sion time on the spectral reflectance is shown in Figure B4. Note that thecutoff can be altered by changing the immersion time. The oscillations inreflectance for the shorter coating times are indicative of optical inter-ference effects. This effect cannot be used to increase the average absorp-tion over the broad solar spectral region, and coating times shorter than2 minutes generally greatly decrease the overall absorption. The funda-mental limitation is the high refractive index for the iron compounds (FegC^2. 42, FeO: 2. 32), which cause a large reflection off the front surface of thecoating. As with the copper-oxide coatings, the best performance achieved,a *** 85 percent and e « 10 percent, is marginal, but may be improved withorganic overcoats.
One steel sample with a 1-nm-thick iron-oxide coating was given the 160°Fhumidity test and survived with only a few points of rust. It remains to beseen whether thinner coatings of iron oxide will have sufficient humidityprotection value.
100 _,
80-
8*.
g 603
Vce.
40-
20-
Sample no.
C6
C3
C9
Bl
AIV
Bathtime
2 mln
6 mln
9 mln
15 mln
20 mln
or
0.84
0.86
0.89
0.86
0.89
e
0.08
0.19
0.35
0.39
0.76
C6
,'C3
09
i\ //'
•-'••
'7"%X'Bl /•"•-. AIV
./
.3 .4 .5 .7 10 20
Wavelength,
Figure B4. Effect of Immersion Time on the SpectralReflectance of Black Iron Coating
109

Organic Overcoats
Overcoating solar absorbers with polymeric organic materials was originallyconsidered as a possible means of increasing the humidity corrosion resis-tance of several coatings. It was later found that such coatings, in manycases, had the additional desirable effect of greatly increasing solar absorp-tance by reducing the mismatch in refractive index between the solar absorbingcoating and air. For example, a thick organic coating with a refractive indexof 1. 5 could reduce the. front surface reflectance of iron oxide (n ~ 2. 4) from
percent to ~9 percent.
Most polymeric organic coating materials have the disadvantage of beingstrongly absorbing in the 5- to 20-iim wavelength region and hence willgreatly increase the emittance when coated on a selective solar absorber.Therefore, about 10 organic materials were coated onto solar absorbersurfaces in thicknesses from ~0. 05 mil to ~2 mil and checked for infraredabsorption. Preliminary tests showed that all three of these materials com-pletely prevent rust from the MIL-STD humidity test on iron-oxide absorbercoatings in thicknesses of only 0. 05 to 0. 01 mil. At those thicknesses theorganic overcoat has no effect on the solar coating emittance. These mate-rials should be stable to 400°F or more.
Supplementary Discussion
Iron Oxide
The black iron-oxide test sample had an absorptance of . 94 and an emittanceof . 17. The sample was left in the solution for 4 minutes, which was thetiming determined from earlier tests to give an optimal coating. The graphof reflectance versus wavelength for this sample iron-oxide coating is shownin Figure B5.
Organic Overcoat
The organic overcoat is not only necessary to protect the iron-oxide surface,but it also improves the selectivity of the absorber coating. The two materialstested for use as an overcoat were:
• Vistaion 606 EPM, Product of Exxon Company
• XR-6-2205 Silicone, Product of Dow Corning
The material used was the EPM. This was chosen over silicone materialsbecause of its superior durability, ease of application, and superior opticalproperties and clarity.
110

100
80 .
6038
40 .
20
e = .166
> = .939
.10 .30 .50i i
.80 1 1.5 2
Wavelength, pm
10
Figure B5. Spectral Reflectance of Uncoated Iron OxideSelective Surface
The application of this material requires 20 to 30 spray coats during an 8-hourperiod. This is necessary to get the proper uniform thickness of 0. 2 to 0. 3mil. Thicker films reduce the selectivity of the surface and thinner coatingsare not as protective. MIL-STD humidity tests on the EPM-over coatedsamples show no significant performance degradation to the selective surface.
Difficulties were encountered in producing a uniform iron-oxide coating onthe absorber panels. The black iron coating without an organic overcoat hasacceptable performance but durability requires an organic overcoat, and theovercoat tends to drive the emittance to an unacceptable level (. 39). Differentcoating thicknesses were examined to find the optimal coating performance(i. e. , highest or/e). Figure B6 demonstrates the effect of immersion time.As time decreases, absorptance and emittance decrease due to the thinnercoating. The organic overcoat tends to increase absorptance and emittanceas shown in Figure B7. The dips in the curves in the 7-nm range are due toabsorption by the organic overcoat material.
Table Bl summarizes the results for these three selective-coat ing reflectancecurves.
Ill

100
80-
60-
= 40.01 ^o:
20.
.2
3 m/n.£"^— 2 min.
4 m/n.
.3 .4 .5 .6 .7 .8 .9 1 2 3 4 5 6 7 8 9 10
Wavelength, pm
Figure B6. Reflectance of Iron Oxide Samples for 2,3,and 4-Minute Coatings
100
90
80
70&"-•
| 603
I 50,
40
30.1
20
10-1
2 min.
3 min.
4 min.
.3 .4 .5 .6 .7 .8 .9 1 2
Wavelength, fan
3 4 5 6 7 8 9 10
Figure B7. Reflectance of Iron Oxide Samples withOrganic Overcoat for 2,3, and 4-MinuteCoatings
112

TABLE Bl.- TEST RESULTS
Immersiontime,_ min.
2
3
4
No overcoat
a
.862
.859
.836
e
.134
.146
.264
a/e
6.4
5.9
3.2
With overcoat
a
.912
.905
.916
e
.244
.299
.400
«/e
3.7
3.0
2.3
The selectivity of the 2-minute coating was the best of the test samples butwas not satisfactory. A coating with an a of . 90 and an e of . 16 was expected.To achieve this goal, a new chemical bath was mixed to ensure a clean solu-tion and increase coating uniformity. (Prolonged boiling tends to burn solu-tion chemicals which deposit on panels.)
Previously obtained test results have provided coatings with an a of . 84 andan e of . 08 (a/e = 10. 5) before overcoating and an a of . 90 and an e of . 16(a /e = 5.6) with a 0. 3-mil overcoat.
113

APPENDIX C
TRADEOFF STUDIES
To more accurately evaluate some of the major design choices, such aswhether to use a selective absorber coating or a nonselective absorber coat-ing, and the choice of one cover or two collector covers, utilization curveswere generated to compare the performance of the various collector typeswhen operated for both heating and cooling for a typical year. The utilizationcurves indicate the expected improvement in yearly collection efficiency thatcan be realized from adding the more costly design features, such as asecond cover. As long as the cost increase resulting from the addition ofthese design features is less than the performance improvement realized,the design features will be considered as viable possibilities. Utilizationcurves for the evaluation of a selective versus nonselective absorber coating,and the evaluation of one cover versus two collector covers are presented inthis appendix.
Absorber Coating
The choice of absorber coatings will obviously be influenced by the materialultimately used for the absorber panel itself, assuming of course that a se-lective absorber coating is recommended for the preferred collector design.The determination of whether or not to use a selective absorber coating mustbe based on the cost effectiveness of each type of coating, either selective ornonselective. Application of black paint will generally be less costly than theapplication of either an electroplated or electroless dip process, as requiredby the selective absorber coatings; however, the selective absorber coatingsare capable of capturing and retaining a significantly larger fraction of theincident flux, and as long as the increased application cost is less than theincreased absorber performance, the selective absorber coatings will delivermore heat flux per dollar of collector cost. Furthermore, for a given energylevel required to be satisfied by a solar installation, the use of selectiveabsorber coatings will enable the use of a smaller collector array, therebyeliminating some installation cost.
To provide a guideline for determining the maximum additional cost of appli-cation that will still maintain the superior cost effectiveness of a selectiveabsorber coating, an analysis was performed to compare the performance ofa collector array over a typical calendar year of actual weather conditions,considering both a selective and a nonselective absorber coating. The resultsof the analysis are presented as Figure Cl. The installation considered inthis analysis is a 121-m2 (1300-ft2) array of collectors with a tilt angle of25 degrees with respect to horizontal. The collectors have two glass coversand both edge and back insulation around the absorber panel. The non-selective absorber coating considered here is 3M Black Velvet, which has a

60
50 -
40 '
I 30 H
20 -
10 -
90.76 MBtu provided by nonselectlve collector (60.8% of total)118.51 MBtu provided by selective collector (78.7% of total load)
NonselectlveSelectiveLoad
M J JMonth
Figure Cl. Comparative Performance of Selective versusNonselective Two-Cover Collector
solar absorptivity of . 95 and an emissivity of . 90. The selective absorbercoating considered here is black nickel, having a solar absorptivity of . 94and an emissivity of . 07. The design load used for the analysis is a 232-m^(2500-ft2) house of conventional construction located in Atlanta, Georgia.The load levels are derived from degree day data obtained from the U. S.Weather Bureau. The cooling load also includes the effect of humidity levels.Collector performance is calculated from an hourly analysis of weather dataprovided for a typical year in Atlanta, including both ambient temperatureand insolation level, considering cloud cover. The load levels and collectorperformance levels have been summarized on a monthly basis and are pre-sented as Table Cl. Collector operation is assumed to be fixed at 60°C(140°F) for those months having no cooling load. .Operation is assumed fixedat 93°C (200°F) for months having a cooling load. For months having bothheating and cooling loads, operation is assumed fixed at 93°C (200°F) andthe cooling load is satisfied first. In determining how much of the coolingload can be satisfied by the collector array, a coefficient of performance(COP) of . 6 has been applied to the energy level supplied by the collectors.The efficiency for solar heating is assumed to be 1. 0. Finally, sufficientstorage is assumed to absorb the daily collected energy levels, but no energyis accrued from month to month.
116

TABLE Cl.- ATLANTA LOAD ANALYSIS
Month
1
2
3
4
5
6
7
8
9
10
11
12
Total
Heating load,MBtu
12.7
10.5
8.7
3.3
0.5
0
0
0
0.4
2.5
8.2
12.4
59.2
Cooling load,MBtu
0
0
0
0.7
3.3
20.9
24.9
23.5
14.4
1.9
0.2
0.1
90.0
Total load,MBtu
12.7
10.5
8.7
4.0
3.8
20.9
24.9
23.5
14.8
4.4
8.4
12.5
149.2
As can be seen from Figure Cl, the collector array can provide 60. 8 percentof the total load requirement if it has a nonselective absorber coating, and78. 7 percent of the total load requirement if it has a selective absorber coat-ing. This is a 17-point increase in performance directly attributable tothe selective absorber coating. This is the upper limit for additional col-lector cost due to application of the selective coating. With this guideline inmind, it appears reasonable to conclude that a selective absorber coatingwill be included in the recommended collector design.
The coatings presently considered most promising are black chrome and ironoxide. They both appear significantly more durable than the black nickelcoatings presently available. Black chrome samples also appear to haveequivalent performance to black nickel; however, iron oxide has a lowersolar absorptivity (.85) and will require an organic overcoat to raise thatvalue above . 9. This is not considered a major detriment, since iron oxideis an electroless dip process and would still be relatively inexpensive evenwith an organic overcoat. Iron oxide does, however, limit the choice ofabsorber materials to steel, while black chrome may be electroplated tosteel, aluminum, or copper, assuming appropriate processing.
117

Cover System
The investigation of the cover system candidates required the resolution ofone primary question: Should the recommended collector design have one ortwo covers? An analysis (Figure C2) was performed to compare the per-formance of both a one- and two-cover collector array. As this analysis issimilar to that performed for the absorber coating evaluation, details of theapproach are not repeated here. The reader may refer to the precedingabsorber coating discussion to review the derivation of the figure. TablesC2 through C7 present the monthly summaries of the collection levels. Theone-cover collector array can provide 71. 7 percent of the heating and cool-ing load requirement, while the two-cover collector array can provide 78. 7percent of the load requirements. This is 7-.point improvement in per-formance directly attributable to the addition of the second collector cover.This is the guideline for the additional cost of designing a two-cover collec-tor. The use of a second cover not only adds the cost of more cover material,but also requires the use of a cover spacer and larger collector housing.These additional costs may well be in excess of the benefits derived fromthe second cover. Additional detailed cost analysis is still required in orderto firmly substantiate that conclusion. It should be noted that this analysisassumes the use of a selective absorber coating for both the one- and two-cover collector configurations. A similar analysis using a nonselective ab-sorber coating would reveal a much greater improvement to be realized bythe use of a two-cover system. The additional costs of the second covermay be more justifiable.
60
50-
40-
I 30
20 ^
10
109.02 MBtu provided by 1-cover collectors (71.7% of total)118.51 MBtu provided by 2-cover collectors (78.7% of total load)
• 2 500-fr Atlanta house
• 1300-ft collector area• tilt angle: 25°
Load
1-cover
2-cover
J F M A M J J A S O N
Month
Figure C2. Comparative Performance of One versus Two Covers
118
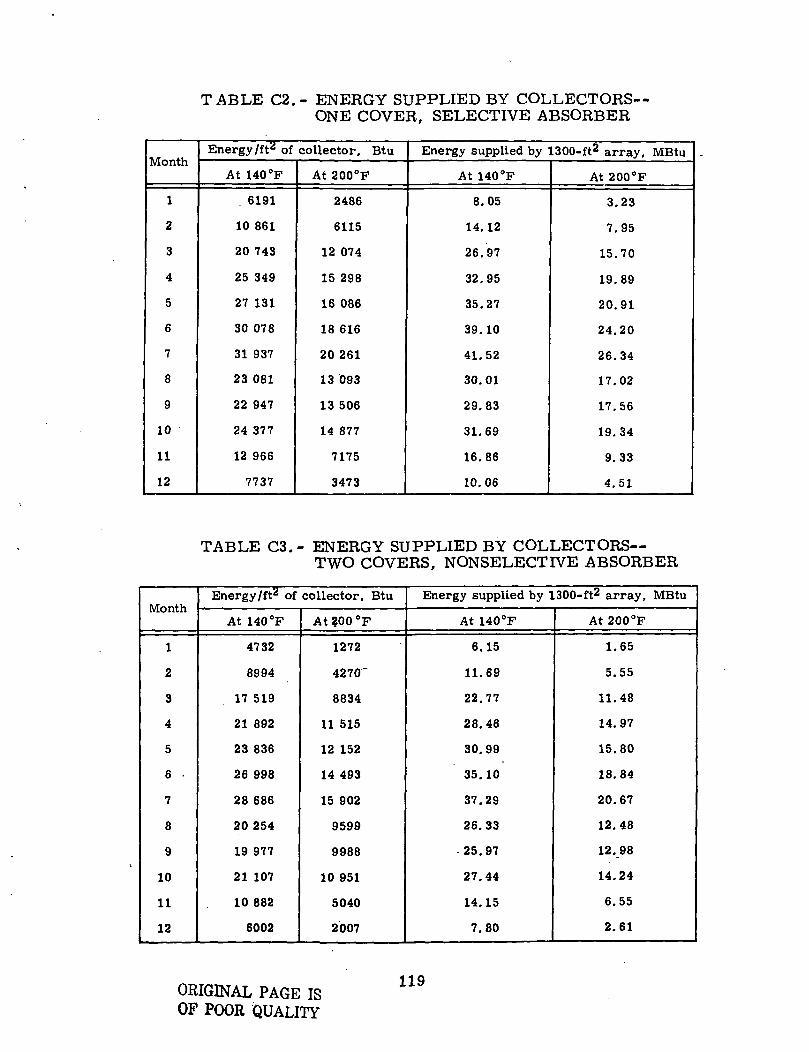
TABLE C2.- ENERGY SUPPLIED BY COLLECTORS-ONE COVER, SELECTIVE ABSORBER
Month
1
2
3
4
5
6
7
8
9
10
11
12
Energy /ft2 of collector, Btu
At 140°F
. 6191
10 861
20 743
25 349
27 131
30 078
31 937
23 081
22 947
24 377
12 966
7737
At 200°F
2486
6115
12 074
15 298
16 086
18 616
20 261
13 093
13 506
14 877
7175
3473
Energy supplied by 1300-ft2 array, MBtu
At 140°F
8.05
14.12
26.97
32.95
35.27
39.10
41.52
30.01
29.83
31.69
16.86
10.06
At 200 °F
3.23
7.95
15.70
19.89
20.91
24.20
26.34
17.02
17.56
19.34
9.33
4.51
TABLE C3.- ENERGY SUPPLIED BY COLLECTORS-TWO COVERS, NONSELECTIVE ABSORBER
Month
1
2
3
4
5
6 •
7
8
9
10
11
12
Energy/ft2 of collector, Btu
At 140°F
4732
8994
17 519
21 892
23 836
26 998
28 686
20254
19 977
21 107
10 882
6002
At?QO°F
1272
4270'
8834
11 515
12 152
14 493
15 902
9599
9988
10 951
5040
2007
Energy supplied by 1300-ft2 array, MBtu
At 140°F
6.15
11.69
22.77
28.46
30.99
35.10
37.29
26.33
25.97
27.44
14.15
7.80
At 200°F
1.65
5.55
11.48
14.97
15.80
18.84
20.67
12.48
12.98
14.24
6.55
2.61
ORIGINAL PAGE ISOF POOR QUALITY
119

TABLE C4.- ENERGY SUPPLIED BY COLLECTORS-TWO COVERS, SELECTIVE ABSORBER
Month
1
2
3
4
5
6
7
8
9
10
11
12
Energy /ft2 of collector, Btu
At 140°F
7337
11 807
21 565
25 748
27 210
29 577
31 352
23 134
23 228
24 841
13 707
8739
At 200°F
3815
7483
14 647
17 800
18 656
20 736
22 156
15 340
15 661
17 301
8914
4996
Energy supplied by 1300- ft2 array, MBtu
At 140°F
9.54
15.35
28/03
33.47
35.37
38.45
40.76
30.07
30.20
32.29
17.82
11.36
At 200°F
4.96
9.73
19.04
23.14
24.25
26.96
28.80
19.94
20.36
22.49
11.59
6.43
120

TABLE C5.- LOAD SATISFIED BY SOLAR COLLECTORSONE COVER, SELECTIVE ABSORBER
Month
1
2
3
4
5
6
7
8
9
10
11
12
Operatingtemperature, °F
140
140
140
200
200
200
200
200
200
200
200
140
Load satisfied,MBtu
8.05
10.5
8.7
3.3 + 0.75 = 4.05
0. 5 + 3.3 = 3. 8
14.5
15.8
10.2
10.5
2. 5 + 1. 9 = 4. 4
8. 2 + 0.26 = 8.46
10.06
Percent of total load 10q Q2 _ fif) „,£(Total load = 149. 21 MBtu) 109' °2 " 60< 73 *
Note: 140°F operation assumed when there is nocooling load. 200°F operation assumedwhenever there is a cooling load. A/Cload satisfied first during 200°F operation.COP of . 6 applied to cooling energy, 100-percent efficiency for heating energy.
121

TABLE C6.- LOAD SATISFIED BY SOLAR COLLECTORSTWO COVERS, SELECTIVE ABSORBER
Month
1
2
3
4
5
6
7
8
9
10
11
12
Operatingtemperature, °F
140
140
140
200
200
200
200
200
200
200
200
140
Load satisfied,MBtu
9.5
10.5
8.7
3. 3 + 0.75 = 4.05
0. 5 + 3. 3 = 3. 8
16.2
17.3
12.0
12.2
2.5 + 1.9 = 4. 4
8.2 + 0.26 = 8.46
11.4
Percent of total load -,Q [-1 no nQ<&(Total load = 149. 21 MBtu) 118' 51 ' 78' ™*
Note: 140°F operation assumed when there is nocooling load. 200 °F operation assumedwhenever there is a cooling load. A/Cload satisfied first during 200°F operation.COP of . 6 applied to cooling energy, 100-percent efficiency heating energy.
122

TABLE C7.- LOAD SATISFIED BY SOLAR COLLECTORSTWO COVERS, NONSELECTIVE ABSORBER
Month
1
2
3
4
5
6
7
8
9
10
11
12
Operatingtemperature, °F
140
140
140
200
200
200
200
2001
200
200
200
140
Load satisfied,MBtu
6. 15
10.5
8.7
3. 3 + 0.75 = 4.05
0. 5 + 3. 3 = 3.8
11.3
12.4
7.5
7.8
2.5 + 1.9 = 4. 4
6. 1 + 0.26 = 6.36
7.8
Percent of total load Qn 7R _ 71 R1 ^(Total load = 149. 21 MBtu) 90" 76 ' 71' 61*
Note: 140 °F operation assumed when there is nocooling load. 200°F operation assumedwhenever there is a cooling load. A/Cload satisfied first during 200°F operation.COP of . 6 applied to cooling energy, 100-percent efficiency heating energy.
123

APPENDIX D
HOUSING MATERIAL ANALYSIS
Material Test Program
During the course of the contract, certain reservations arose regarding thedurability and weathering characteristics of the molded-paper-product pan.The project personnel at NASA MSFC shared this concern. Accordingly, amaterial test program was conducted on the molded-paper product to moreaccurately evaluate its potential as a collector component material. However,before discussing the test program, the following observations should be noted:
• The initial considerations for assuring acceptable physicalcharacteristics are reviewed in the main text of this docu-ment.
• The question of flammability can apparently be resolved, atleast to the extent of-satisfying local building codes, by theuse of additives such as powdered boron to the slurry duringthe pan molding process.
• The other physical characteristics of the material can beappreciably improved by impregnating it with a plasticizer.Based on initial testing and evaluation of several possibleplasticizers, the most promising candidate from both a costand performance standpoint presently appears to be EPDM(ethylene-propylene-diene material) produced by Exxon.Vacuum impregnation or dipping of this material definitelyimproves moisture resistance and material hardness. Thisprocess is estimated to cost $. 65/m2 ($. 06/ft2) and may infact be highly cost effective.
The scope of the material test program consisted of conducting the followingtests on the processed-paper box material which was used as the collectorhousing:
• Permeability• Hardness• Thermal conductivity• Tensile strength and elongatione Compressive strength• Flexural strength
125
PfiECKDING PAGE BLANK NOT

• Accelerated service
• Accelerated aging
• Flammability
The general nature of these tests is described below.
Permeability
Samples were impregnated with 10-, 20-, and 30-percent solids. Thesesamples were then tested using the Contractor1 s Moisture Vapor TransmissionRate (MVTR) apparatus. The best level of impregnation was then determined,and the remaining tests (i. e., hardness, thermal conductivity, etc. ) wereperformed on samples with this chosen quantity of plastic. (Several of theremaining tests are for plastic materials because the plastic-impregnatedpaper product is similar to plastic-impregnated glass-laminate materials. )
Other tests to determine the water resistance of paper were also considered.These methods determine the time required for water to pass through thepaper-sheet material. They are ASTM D779, D1251, D895, D1276, D1008,and C355.
Hardness
The test for hardness was conducted in accordance with the requirements ofASTM D2240, which requires the use of a durometer to determine the inden-tation hardness of the material. This test was run for both wet and drysamples.
Thermal Conductivity
The test for determining the thermal conductivity constant was run in accor-dance with ASTM D2214. For this test, the sample is placed between twoplates at different temperatures. The upper plate is at a constant tempera-ture, while the temperature of the lower plate is slowly changing. The tem-perature difference is measured by thermocouples and the rate of heat flowis determined from the area, thickness, and temperature profile. The testwas run for a dry material sample and the thermal conductivity was deter-mined to be 0. 5 Btu in/hr-ft2-°F.
Tensile Strength and Elongation
Tensile strength was determined using ASTM Test D638 for Tensile Propertiesof Plastics as the guide. This test was run, for both wet and dry samples,using tensile strength testing machinery.
126

Compressive Strength
The modulus of elasticity was determined using test method ASTM D695. Inthis test, the mechanical property is found by loading the sample in compres-sion at relatively low uniform rates. The modulus was determined for bothwet and dry samples of the material.
Flexural Strength
The test method used for flexural properties was ASTM D790. In this test, abar of rectangular cross section is tested in flexure as a simple beam, the barresting on two supports and the load applied by means of a loading nose mid-way between the supports. The specimen is deflected until rupture occurs.Both wet and dry samples were tested.
Accelerated Service
The sample was tested using the MIL-STD-810B humidity test method. Thetest consists of temperature cycles from 82°F to 160°F and humidity cyclesfrom 85- to 95-percent relative humidity with 24-hour cycles for 10 days.
Accelerated Aging
Tests were performed to determine the effects of light and water exposure onthe sample material. The method used followed ASTM D1499 procedures forthe Artificial Weathering Tests (ASTM E42).
Flammability
Tests were performed to determine the relative flammability of the plastic-impregnated paper material. Two ASTM methods were referred to for thesetests. They are designated D638 and F108. The second test is a fire test forroofing materials.
The above tests are summarized in Table Dl.
Material Test Program Details
The series of structural tests previously mentioned were made on the paperbox material to evaluate its potential as a collector component. The box sam-ples tested were impregnated with 10-percent Enmar plastic. This quantity ofplastic was chosen as a tradeoff between material cost and comparative dura-bility determined from humidity tests run on a series of samples having various
127

TABLE Dl.- MATERIALS TEST MATRIX
Test
PermeabilityPermeabilityPermeability
HardnessHardness
Thermalconductivity
Thermalconductivity
Tensilestrength andelongation
CompressivestrengthCompressivestrength
Flexuralstrength
Flexuralstrength
AcceleratedserviceAcceleratedservice
Acceleratedaging
FlammabilityFlammability
Additionalpermeabilitytests
1.2.3.4.5.
Wfet
XXX
X
X
X
X
X
Dry
X
X
X
X
X
No coating
Painted withacrylic white
at 200"!
XXXXX
•>
XX
Percentsolids
(10,20,30)
102030
ASTMstandardtest no.
D779D779D779
D2240D2240
D2214
D2214
D638D638
D695
D695
D790
D790
D756
D756
D1499
D635E108
D1251D895D1276D1008C335
Test title
Water resistance of paper, paper-board, and other sheetmaterials by the dry indicator method
Indentation hardness of rubber and plastics by means ofa durometer
Thermal conductivity constant of material with Cenc-Fitch apparatus
Tensile properties of plastics
Compressive properties of rigid plastics
Flexural properties of plastics
Resistance of plastics to accelerated service
Operating light - and water - exposure apparatus(carbon-arc-type) for exposure of plastics
Flammability of self-supporting plasticsFire test of roof coverings
Water vapor permeability of packagesWater vapor permeability of packagesWater vapor transmission of shipping containersWater vapor transmission of shipping containersWater vapor transmission of thick materials
ORIGINAL PAGEMSOF POOR QUALITY
128

percentages of plastic impregnation. The plastic material used was an acryliclacquer per MIL-L-813 produced by Enman Industrial Finishes, Wichita,Kansas.
Of initial concern was the impregnant (acrylic lacquer) and the percent ofsolids to be used. Solutions of 10-, 20V,. and 30-percent solids were preparedusing the Enmar lacquer and a suitable solvent. The samples were then im-pregnated as follows:
1) The samples were cut in suitable shapes and vacuum-bakedat 212°F for 16 hours.
2) The samples were then cooled for a minimum of 2 hours in adessicator.
3) The samples were next immersed in the lacquer solution, putin a vacuum chamber at room temperature, and the chamberwas evacuated for 15 minutes.
4) The samples were removed from the chamber and the excesslacquer was removed. '
5) The samples were air-dried at room temperature for a mini-mum of 4 hours.
6) The samples were then baked in an air-circulating oven at212°F for 16 hours.
The above procedure was repeated on all lots of 10-, 20-, and 30-percentsolid lacquer solution. All samples were then subjected to 10 days of temper-ature/humidity cycling per MIL-STD-810. At the completion of the cycling,all samples were visually inspected and a hardness reading was taken. Thiswas done to determine the percent of solids to use in the final test series.Based on the visual inspection and hardness reading, plus the added concernof eventual high production and material costs, the 10-percent solution wasselected, since in appearance and hardness there was no apparent differencein the three percentages.
Mechanical strength tests were performed on the paper-mache material.These tensile, compression, and flexural tests are all standardized anddescribed by the American Society for Testing and Materials (ASTM) asD695, D638, and D790, respectively. ASTM Test 635 was used to testmaterial flame resistance. In general, the ASTM procedures were followedwith some modifications.
129

Flexural Strength Tests
Flexure strength is a measure of the force required to cause failure of a rigidmaterial when bent (flexed). The test is performed by supporting a bar-shapedspecimen (see sketch below) whose dimension has been measured at both endsand applying a steadily increasing load at the center. The specimen is flexeduntil it breaks. On the basis of the load required to break a specimen, theflexure strength of a material is calculated to show the force that would berequired to fail a sample with cross-sectional area of 1 square inch.
Force
f (1 Thickness
Span
Flexure modulus is a measure of the stiffness of a material and can be deter-mined by the formulat shown below if the amount of bending (deflection) at thecenter of the bar is measured.
Flexural stress . = f x lo^ x f Pan. - jj-:•;•• 2 width x thickness'5
Flexural modulus = (span)3 x load
4 width x thickness x deflection
Flexural Strength Test Results
The flexure properties of the paper box material are listed in Table D2. Theflexural strength is 1640 psi which is similar to that of soft wood compositionboard, 34-lb/ft3 polyethylene foam, 18 to 25-lb/ft3 urethane foam, and low-density polyethylene. The flexural modulus of 140 000 psi implies that thematerial is stiffer than the above foams: more like composition board or adenser (40- to 50-lb/ft3) foam.
The stress-strain curve for the flexural test is shown in Figure Dl.
130

TABLE D2. - FLEXURE PROPERTIES3-
100 1
80
60 .
40 .
20
Run
1
2
3
4
5
6
7
8
9
10
Average
Flexuralstrength, psi
1430
1520
1740
1710
1870
1150
1560
1590
1810
2030
1640
Flexuralmodulus, psi
134 000
122 000
158 000
155 000
91 000
134 000
139 000
160 000
169 000
140 000
aTest notes: 4-in. span; 2-in. /min. testspeed; specimen dimensions 0. 478 to0. 490 in. width, 0. 278 to 0. 348 in.thickness.
Tensile stress - strain curve
Scalet 0.001 In.
Typical flexure stress - strain curve
Scale: 0.050 In.
4 5 6
Elongation-Compression
Figure Dl. Tensile and Flexure Stress-Strain Curves
131

Tensile Tests
Tensile strength measures the force needed to pull a specimen apart. Thespecimen for a tensile test is generally a long, slender bar with enlarged endsto which grips for pulling are attached. The specimen for our tests did nothave a special grip area but were uniform in size for their entire length.
The test is performed by measuring the cross-sectional area of the sampleand pulling to failure at a designated speed. The force in pounds required tobreak is so calculated that tensile strength is reported as the force that wouldbe necessary to break a specimen of the material of 1-square-inch cross-section.
The tensile modulus (stiffness) can also be determined if the amount of elonga-tion is measured. The formula for tensile modulus is:
Modulus =load (Ib) x specimen length
cross-sectional area x deflection
Tensile Strength Test Results
The test results are summarized in Table D3. The paper material has anaverage tensile strength of 700 psi. This is comparable to the tensile strengthof the previously mentioned materials for flexural strength. Again, the modu-lus (145 000 psi) implies a stiffness greater than that of foams but similar tothat of composition board, polypropylene, or nylon. The collector box doesnot encounter any tensile loading, however, so a material with high tensilestrength should not be required. The tensile stress-strain curve is shownin Figure Dl.
TABLE D3.- TENSILE PROPERTIES6
Run
1234561
Average
Tensilestrength,
psi
810640700620800760540
700
Tensilemodulus,psi
185 000146 000127 000219 000100 000111 000127 000
145 000
Test notes:Specimens: Grip area same dimension as test area.Sample size: Width 0.475 to 0.495 in.
Thickness 0. 210 to 0. 360 in.Test speed: 0. 050 in. /min.
132

Compression Tests
Compression strength is a measure of the force required to push or compressa specimen until "failure" is reached. The type of "failure" may depend onthe dimensions of the specimen and on the material used. Some cases willresult in a shattering failure and in other cases failure will be considered asa specified deflection as the load is applied. Both of these cases were involvedin the tests on the molded paper product:
Flatwise tests -- The compressive force was applied to thethickness of the material (see sketch).
Force
Thickness
In our tests compressive strength was determined at deflec-tions of 30 percent and 50 percent of the original thickness.
Edgewise tests — The compressive force was applied in adirection perpendicular to the thickness of the material of arelatively long narrow specimen (see sketch).
Force
Thickness
The relative stiffness (modulus) can also be determined by measuring thedeflection as the load is applied:
load x thickness (in direction of compressive force)Modulus = ' — m—T-cross-section x deflection
133

Compression Strength Test Results
The flatwise and edgewise compression test results are given in Tables D4and D5, respectively. The stress-strain curves for these tests are shown inFigures D2 and D3. The compressive strength of the material is again simi-lar to that of 34-lb/ft3 polyethylene foam but stiffer.
An overall analysis of the material's structural integrity for use in solarcollectors will be made upon completion of the entire test series. Conclu-sions here are limited to a comparison with other materials because theresults of structural tests alone do not establish the paper product's overalldurability.
Flame Test Description and Results
A 0. 5-inch wide strip of the box material is cut to a length of 6 inches. Thesample is held at one end and a flame is applied to the other end for 30 sec-onds. The flame is removed and the time required for the flame to burn to the4-inch mark is recorded. The flame test data are summarized in Table D6.
All of the samples burned to the 4-inch mark with an average burn rate of 1. 2inches/minute. The material is therefore flammable and not self-extinguish-ing as many plastic materials are. Several materials with comparable burnrates are listed below;
,, . . , Burn RateMaterial (inches/minute)
ABS 1. 0 to 1. 5
Polystyrene 1. 2 to 1. 5
Acrylic 1. 6
Nylon 0. 5
134

TABLE D4. - FLATWISE COMPRESSIVEPROPERTIES'1
Run
1
2
3
4
5
Average
Compressive strength, psi
30% defl. a
470
495
540
350
325
435
50% defl. D
1310
1540
166,0
960
8C5C
1270
Linearmodulus,
nsi
15 300
15 800
17 200
10 800
10 200
13 900
Stress-strain - linear.DBeyond yield point.
"Very rough surface.
Test notes:Sample size = 1 in. x 1 in.Thickness = 0. 322 to 0. 361 in.Test speed = 0. 050 in. /min.
TABLE D5.- EDGEWISE COMPRESSIVEPROPERTIES21
Run
1
2
3
4
5
6
7
Average
Compressivestrength, psi
600
510
670
700
700
590
630
Modulus,psi
23 500
23 000
34 300
35 500
38 200
29 500
35 100
31 400
notes:
Test speed: 0. 05 in. /min.Sample size: Width = 0. 300 to 0. 061 in.
Thickness = 0. 500 ± 0.007 in.Length= 1 in ± 0. 013 in.
135

3000 -
2500
2000 '
1500 '
1000
500 .
Sample size: 1 in. x 1 in. x thicknessScale: 0.020 In.
0 1 2 3 4 5 6 7 8 9
Elongation-Compression
Figure D2. Stress-Strain Curve for Flatwise Compression Test
10
120
100
80
60
40
20. Scale : 0.020 In.
2 3 4
Elongation-Compression
Figure D3. Stress-Strain Curve for EdgewiseCompression Test
136

TABLE D6. -FLAME RESISTANCE'
Run
1
2
3
4
5
Average
Seconds to burn 4 in.
206
187
201
205
186
197
Sample dimensions: 6 in. x 0. 5 in. x thickness.
A flame retardant may be added to the paper slurry prior to molding. Thisshould significantly reduce the material's flammability to be at least self-extinguishing, if not inflammable.
Box Material Analysis
The effect of MIL-STD-810 Procedure 1. accelerated humid environment,was determined by measuring the flexural and compressive strength of papermache with and without impregnation before and after exposure. This en-vironment was originally developed to simulate exposure to a warm, highlyhumid atmosphere such as is encountered in tropical areas. This is an accel-erated environmental test, accomplished by continuous exposure to high rela-tive humidity at elevated temperature. These conditions impose a vaporpressure on materials which constitutes a driving force behind the moistureand penetration. Moisture-sensitive materials may deteriorate rapidly underhumid conditions. Absorption of moisture by materials may result in swell-ing' which destroys their functional utility and causes loss of physical strengthand changes in other important mechanical properties. Insulating materialswhich absorb moisture may suffer degradation of their electrical and thermalproperties.
137

The accelerated humidity environment shown in Figure D4 essentially con-sists of exposure where the internal chamber temperature is raised fromambient to 71°C (160°F) and 95 percent RH over 2 hours and is maintainedunder these conditions for 6 hours. A slow cool takes place over the next16 hours while maintaining the chamber above 85 percent RH. The cyclerepeats for a total of 10 days.
Relative humidity
Time, hr 0 2 8 2 4 4 8
Continue for 10 cycles (240 hr)
Figure D4. Humidity Cycle for Procedure I
The results of exposure to the accelerated humidity environment are sum-marized in Table D7. Examination of the data from Table D5 shows thatimpregnation has a beneficial effect in increasing the strength of the moldedpaper product as expected. The anomalies observed for the edgewise compres-sive modulus data are being rechecked. In general, impregnation increasedthe strength of the molded paper product by 11 percent or more before expo-sure and improved the relative advantage to 47 percent or more after humidityexposure. Molded paper product with and without impregnation showed signifi-cant reduction in strength after humidity exposure. As expected, unimpreg-nated molded paper product lost more strength as a result of humidity expo-sure than did the impregnated material.
138

TABLE D7.- RESULTS OF MIL-STD-810 HUMIDITY EXPOSUREON MOLDED PAPER PRODUCT
Parameter
Compressive strength, psi(flatwise):
30% deflection50% deflection
Compressive modulus, psi(flatwise)
Compressive strength, psi(edgewise), to failure
Compressive modulus, psi(edgewise)
Flexural strength, psiFlexural modulus, psi
Before humidity exposureNo
impregnation
440
12701390
630
30 800
1640149 000
Withimpregnation
510
16301580
700
4620
146065 000
After humidity exposureNo
impregnation
65
425
300
85
2870
15010 900
Withimpregnation
170
770
440
190
8820
45016 500
MIL-STD-810, Procedure 1.
139