design, fabrication, and experimental investigation of an
TRANSCRIPT

Design, Fabrication, and Experimental Investigation of an Additively
Manufactured Flat Plate Heat Pipe
Bharath Ram Ravi
Thesis submitted to the faculty of the Virginia Polytechnic Institute and State University
in partial fulfillment of the requirements for the degree of
Master of Science
in
Mechanical Engineering
Scott T. Huxtable Thomas E. Diller
Mark R. Paul
May 11, 2020
Blacksburg, Virginia
Keywords: Heat Pipe, Heat Sink, Thermal Management, Additive Manufacturing

Design, Fabrication, and Experimental Investigation of an Additively Manufactured Flat Plate Heat Pipe
Bharath Ram Ravi
ABSTRACT
Heat pipes are passive heat transfer devices in which a working fluid is sealed inside a metal
enclosure. Properly designed wick structures on the inner surface of the heat pipe are critical as
the wick aids in the return of the condensed liquid from the cold end back to the hot end where
the vaporization-condensation cycle begins again. Additive manufacturing techniques allow for
manufacturing complex parts that are typically not feasible with conventional manufacturing
methods. Thus, additive manufacturing opens the possibility to develop high performance heat
pipes with complex shapes. In this study, an additive manufacturing technique called Binder
Jetting is used to fabricate a fully operational compact (78 mm x 48 mm x 8 mm) flat plate heat
pipe. Rectangular grooves with converging cross section along the length act as the wicking
structure. A converging cross section was designed to enhance the capillary force and to
demonstrate the capability of additive manufacturing to manufacture complex shapes. This work
describes the challenges associated with the development of heat pipes using additive
manufacturing such as de-powdering and sintering. Multiple de-powdering holes and internal
support pillars to improve the structural strength of the heat pipe were provided in order to
overcome the manufacturing constraints. The heat pipe was experimentally characterized for
thermal performance with acetone as the working fluid for two different power inputs. The heat
pipe operated successfully with a 25% increase in effective thermal conductivity when compared
to solid copper.

Design, Fabrication, and Experimental Investigation of an Additively Manufactured Flat Plate Heat Pipe
Bharath Ram Ravi
GENERAL AUDIENCE ABSTRACT
The number of transistors in electronic packages has been on an increasing trend in recent
decades. Simultaneously there has been a push to package electronics into smaller regions. This
increase in transistor density has resulted in thermal management changes of increased heat flux
and localization of hotspots. Heat pipes are being used to overcome these challenges. Heat pipes
are passive heat transfer devices in which a working fluid is sealed inside a metal enclosure. The
fluid is vaporized at one end and condensed at the other end in order to efficiently move heat
through the pipe by taking advantage of the latent heats of vaporization and condensation of the
fluid. Properly designed wick structures on the inner surface of the heat pipe are used to move
the condensed fluid from the cold end back to the hot end, and the wick is a critical component
in a heat pipe. Additive manufacturing techniques offer the opportunity to manufacture complex
parts that are typically not feasible with conventional manufacturing methods. Thus, additive
manufacturing opens the possibility to develop high performance heat pipes with complex
shapes as well as the ability to integrate heat exchangers with the heat source. In this study, an
additive manufacturing technique called Binder Jetting is used to fabricate a fully operational
compact (78 mm x 48 mm x 8 mm) flat plate heat pipe. Rectangular grooves with converging
cross section along the length act as the wicking structure. This work describes the challenges
associated with the development of heat pipes using additive manufacturing such as de-
powdering and sintering. The heat pipe was experimentally characterized for thermal

performance with acetone as the working fluid for two different power inputs. The heat pipe was
found to operate successfully with a 25% increase in effective thermal conductivity when
compared with solid copper.
iv
ACKNOWLEDGEMENTS
I wish to express my deepest gratitude to my advisor, Dr. Scott Huxtable for
providing me an opportunity to work on this thesis topic and guiding me throughout the project.
His continuous support and encouragement helped me achieve this milestone in my life. In
addition to helping me hone my technical skills, his guidance helped me mold my overall
character. I would also like to thank members of my committee, Dr. Mark Paul and Dr. Thomas
Diller, for their guidance and support throughout the graduate program.
I sincerely thank Dr. Hadi Miyanji and Dr. Christopher Williams from the DREAMS Lab for their
invaluable assistance in the fabrication of the heat pipe. I thank the Department of Mechanical
Engineering for the teaching assistantship opportunity, as it was a great learning experience.
Most importantly I would like to thank my family for their support, encouragement and love
through every step of my life. Without their sacrifices I would not be in this position in my life. I
would like express my gratitude to all my friends for their unwavering support.
Last but certainly not the least, I would like to thank God and my gurus for showering their
blessings and guiding me throughout my life.
v
TABLE OF CONTENTS
List of Figures ....................................................................................................... vi
Chapter 1: Introduction .......................................................................................... 1
Chapter 2: Design of Heat Pipe ............................................................................. 7
Chapter 3: Experimental Setup and Test Procedure .......................................... 14
Chapter 4: Results and Discussion ...................................................................... 23
Chapter 5: Conclusion ......................................................................................... 37
Chapter 6: Future Work ...................................................................................... 38
References .......................................................................................................... 40

vi
LIST OF FIGURES
Figure 1. Schematic diagram of a functioning heat pipe ............................................................................. 2
Figure 2. CAD model of the heat pipe .......................................................................................................... 7
Figure 3. Cross sectional view of Heat Pipe (CAD model) ............................................................................. 8
Figure 4 3D printed heat pipe with valve attached . .................................................................................... 8
Figure 5 Groove structures (wick) in the heat pipe sectional sample ........................................................ 9
Figure 6 Geometric dimensions of a single groove ............................................................................. 10
Figure 7 Schematic diagram of the heat pipe setup .................................................................................. 14
Figure 8 Heat Pipe with thermocouple locations ...................................................................................... 16
Figure 9 Front Panel of the LabVIEW Program ........................................................................................... 17
Figure 10 Block Diagram of the LabVIEW Program .................................................................................... 18
Figure 11 Front Panel of the MATLAB code used to record the heat flux ................................................. 18
Figure 12 Experimental setup used to perform the experiments ............................................................. 19
Figure 13 CAD model of first design iteration ............................................................................................ 23
Figure 14 Failed print of the first design iteration ..................................................................................... 24
Figure 15 CAD model of third design iteration .......................................................................................... 25
Figure 16 3D printed green part (before sintering) of third design iteration ............................................ 26
Figure 17 Final failed third design printed part ......................................................................................... 27
Figure 18 CAD model of fourth and final design iteration ......................................................................... 28
Figure 19 Variation of temperatures with time for a heat flux (H1) .......................................................... 30
Figure 20 Heat flux variation (H1) vs time ................................................................................................. 30
Figure 21 DeltaT vs time for heat flux H1 ................................................................................................. 31
Figure 22 Temperature vs time data for heat flux H2 ............................................................................... 33
Figure 23 Delta T variation with time for heat flux H2 .............................................................................. 33
Figure 24 Heat pipe schematic with the different operating sections .…………………………………………………..35

1
CHAPTER 1: INTRODUCTION
Recent trends in the electronics industry have resulted in the development of high power
density devices. This increase in power density has resulted in higher heat dissipation and posed
thermal management challenges. The two main challenges here are the increase in heat flux and
non-uniform heat dissipation [1]. Over the past decade, researchers have developed many new
methods to address these issues. These approaches can be broadly classified into either active
or passive cooling methods. Active cooling methods use the circulation of fluids such as a water,
air, or dielectric liquids using pumps or fans to remove heat from the system. Microfluidics and
jet impingement techniques are examples of some of the latest developments in active cooling.
Active cooling methods are most commonly used in high power electronics that remain
stationary at a particular location. Although active cooling techniques are effective at higher
power inputs, they are often invasive and require periodic maintenance. On the other hand,
passive cooling systems are usually of the “fit and forget” type, and these passive systems are
generally preferred over active systems, especially in portable devices. As the name suggests,
passive systems do not require external power to provide active circulation of a working fluid.
Heat pipes are a widely adopted passive technology in thermal management applications.
They are used across an entire spectrum of devices from hand-held electronics, such as mobile
phones, to satellites in outer space. Heat pipe characteristics of excellent heat transfer
capabilities and no required maintenance have made them a popular choice in many thermal
management applications. The primary role of a heat pipe is to move or spread the heat from
the source to a sink. Essentially, heat pipes act as excellent thermal conductors with small

2
temperature gradients. Long heat pipes can have an effective thermal conductivity in the range
of 10,000 W/m-K to 200,000 W/m-K [2].
Heat Pipe Description
Heat pipes are two-phase passive heat transfer devices capable of efficiently transporting
heat from a source to a sink. A schematic diagram of a flat plate heat pipe is shown in Figure 1.
Heat pipes can operate in a multitude of temperature ranges spanning from -60 oC to 200 oC. The
operating temperature is predominantly determined by the choice of working fluid which
transports the heat. Common working fluids are deionized water, acetone, ethanol and isopropyl
alcohol. The working fluid is enclosed by an outer (structural) container, as shown in Fig. 1. Once
Evaporator Condenser
Wick
Wick
Vapor core
Outer container
Figure 1. Schematic diagram of a functioning heat pipe. The working fluid vaporizes in the evaporator section and enters into the vapor core. The vapor path is depicted using the orange arrows. In the condenser section the vapor is condensed back into liquid and transported back to the evaporator through the wicks. The path of the condensed liquid is shown using the blue arrows.

3
the structural container of the heat pipe is manufactured, it is degassed and a partial vacuum is
created inside of it. Then the heat pipe is charged with the working fluid and sealed.
Heat pipes contain three operating sections – an evaporator, an adiabatic section, and a
condenser. In most cases there are no physical distinguishing factors between these sections.
The region of the heat pipe in contact with the heat source is classified as the evaporator, and
the region farthest from the source is considered to be the condenser. The region in between the
source (evaporator) and sink (condenser) is referred to as the adiabatic section. In the evaporator
region the working fluid starts to evaporate and the vapor pressure generated pushes the vapor
through the adiabatic section towards the condenser where it cools and condenses back into a
liquid. This liquid is then transported from the condenser back to the evaporator region via a wick
structure on the inside surface of the heat pipe. The liquid moves through the wick due to
capillary forces that are created by the wick. It is crucial that the capillary pressure generated by
the wick is sufficient to circulate the desired amount of fluid. Heat pipes operating in the low
temperature range from -73 to 276 oC are often limited by the capillary pressure that the wick
can generate [3].
There are a variety of common types of wick structures including:
a. Groove type wicks created by a pattern of grooves along the heat pipe
b. Sintered wicks made from sintered metal powders
c. Screen wicks made from metal screens
d. Composite wicks that are a combination the above types

4
The wick structure should possess sufficient pumping power, yet at the same time it should offer
minimal resistance to the flow path [4]. These are competing parameters and should be carefully
balanced when designing the heat pipe. For optimal performance the wick should offer lower
resistance to the vapor to facilitate easier evaporation at evaporator. On the contrary, in the
condenser region the liquid should be readily captured by the wick. Having different types of
wicks in the different regions of the heat pipe is found to improve the overall performance of the
heat pipe [5]. However, when using different types of wicks for each region, it is important to
connect these different wick structures efficiently so that the flow path is not impeded.
Conventional manufacturing techniques often limit the complexity of wick structures that can be
created, as it is challenging to fabricate different types of wicks in a single heat pipe. Additive
manufacturing techniques, on the other hand, provide the freedom to manufacture highly
complex wick structures. These structures can be built from the ground up along with the heat
pipe.
Additive manufacturing, or three dimensional (3D) printing, was initially used only for
rapid prototyping purposes. Over the past decade, significant improvements were made leading
to the use of 3D printed parts for numerous applications [6]. For example, additively
manufactured parts are now being used in aircrafts, automobiles, and medical devices [6]. The
ability to manufacture highly complex shapes from high thermal conductivity materials makes 3D
printing increasingly attractive for heat transfer applications. Several studies have been made on
utilizing this technology for the development of heat sinks. Collins et al. developed additively
manufactured microchannel heat sink with a permeable membrane and observed a 28%
reduction in pressure drop [7]. Similarly, Dede et al. improved the coefficient of performance

5
(COP) of a 3D printed heat sink by topology optimization [8]. Robinson et al. developed a
microchannel heat sink for high heat flux applications using MICA freeform additive
manufacturing process [9].
As mentioned previously, additive manufacturing can be leveraged in the design of heat
pipes and vapor chambers. Along with the fabrication of complex wick structures, additive
manufacturing facilitates development of integrated heat sinks. Integrated heat sinks are heat
sinks built inside of the component of interest. This reduces the total number of parts and, most
importantly, reduces or eliminates the contact resistance between fastened components. Few
studies have been made on utilizing additive manufacturing for the development of heat pipes.
A 3D printed titanium alloy oscillating heat pipe was studied and a 500% increase in effective
thermal conductivity was observed compared to the metal thermal conductivity [10]. Jafari et al.
demonstrated that additively manufactured wicks in heat pipes exhibited improved thermal
performance compared to conventional wicks [11]. Similarly, wicks manufactured through
additive manufacturing showed 10% improvement in performance compared to conventional
wicks [12]. Ozguc et al. developed a fully functional vapor chamber using Direct Metal Laser
Sintering (DMLS) technology [13]. Additional work from several groups has examined wick
performance and found that additive manufacturing improved properties such as capillary
pressure [14-15].
In this work, a fully functional flat plate heat pipe is fabricated using binder jetting additive
manufacturing technology. Copper, having high thermal conductivity, is selected as the metal for
manufacturing. Rectangular grooves with converging cross sections act as wicks to transport
acetone which acts as the working fluid. Finally, experimental measurements are used to

6
determine the effective thermal conductivity, and the measured temperature gradient on the
heat pipe is examined in order to characterize the heat pipe operation. The following section
describes the design methodology followed in the development of the heat pipe.

7
CHAPTER 2: DESIGN OF THE HEAT PIPE
The overall dimensions of the flat plate heat pipe are 78 x 48 x 8 mm. These dimensions
were chosen to facilitate comparisons with studies of heat pipes of similar dimensions in the
literature. The wall thickness of the heat pipe was 2 mm. The smallest dimension or feature size
that can be printed with the binder jetting technique is approximately 50 µm. However, additively
printed parts have some amount of inherent porosity. To avoid leakage of vapor, and to improve
structural integrity, a thicker wall was designed. The CAD model and actual heat pipes are shown
in Figures 2 and 3.
Figure 2: CAD model of the heat pipe. The opening on the top is for the working fluid, while the holes on the sides are to remove the excess powder from the 3D printing process.

8
Figure 4: 3D printed heat pipe with valve attached.
Figure 3: Cross-sectional view of the heat pipe. The grooves on the bottom act as the wick, and the four pillars are for structural support during the printing process.

9
Grooves with converging rectangular cross section act as wick structures, as shown in Figs.
3b and Fig. 4. Nagayama et al. demonstrated that converging grooves with smaller cross section
in the evaporator section and grooves with wider spacing in the condenser section improved the
heat pipe performance [1]. Their work also showed that the increase in capillary force improves
the circulation of the working fluid resulting in improved overall heat pipe performance.
However, decreasing the evaporator cross section increases the solid-liquid interface resistance
which can inhibit vapor flow from the wick into the heat pipe. Optimization studies should be
performed between the capillary forces, interfacial resistance and pressure drop while designing
the wick structure. The present study focuses only on the development of a fully functional
additively manufactured heat pipe, while optimization of wick structures will be carried out in
future studies. Ten holes of 2.4 mm diameter were provided on the sides of the heat pipe to
facilitate de-powdering of the part after printing. These holes were sealed using a high
temperature adhesive (Loctite Hysol 1C) and were tested overnight for leakages. A charging port
Figure 5: Groove structures (wick) in the heat pipe sectional sample. Here, the wider grooves on the left act as the condenser, while the narrower grooves on the right are for the evaporator.

10
of diameter of 5 mm was used to charge the heat pipe with working fluid and to create a partial
vacuum inside the heat pipe. A polycarbonate vacuum desiccator valve was fitted to the charging
port to facilitate discharge and recharge of the heat pipe without permanent sealing.
Groove Dimension Estimation
The capillary pressure generated by the wick structure should be higher than the pressure loss
for the fluid flow in the wick. The capillary pressure and pressure drop were estimated using the
method described by Nagayama et al. [16]. The capillary pressure (Δpca) is calculated as
Δpca = σe cos θe ⋅ (1
We2
+1
H) − σc cos θc ⋅ (
1Wc
2
+1
H), - (1)
Figure 6: Geometric dimensions of a single groove.

11
where, σe is the surface tension of the fluid in the evaporator region (0.021 N/m), σc is the
surface tension of the fluid in the condenser region (0.021 N/m), We is the minimum width of the
evaporator section (0.5 mm), Wc is the maximum width of the condenser (0.7 mm), H is the
height of the groove (0.6 mm),and θe and θc are the contact angles of the fluid in the condenser
and evaporator regions, respectively. Previous studies [17, 18] indicate that acetone completely
wets copper surfaces, hence the contact angle is taken to be 0o.
The capillary pressure generated calculated from the above mentioned values was found to be
119 Pa. Next the pressure drop across the length of the heat pipe (Δ𝑝𝑙𝑜𝑠𝑠) was estimated as
Δ𝑝𝑙𝑜𝑠𝑠 = ∫12⋅μ⋅𝑊𝑒⋅𝑢𝑒
(𝑊𝑐−(𝑊𝑐−𝑊𝑒)⋅𝑥
𝐿)
3
𝐿
0 , - (2)
where L is the length of the heat pipe (78 mm), μ is the viscosity of acetone (0.3x10 -3 Pa-s, as
the local variations in viscosity were neglected), and 𝑢𝑒is the local fluid velocity. This velocity
should be experimentally determined, but for this calculation the velocity is taken to be 0.1 m/s.
The integration in Equation 2 was performed in Mathematica software and the pressure
drop was estimated to be 68 Pa. From the above estimations it is observed that the capillary
pressure generated is higher than the pressure drop, thus the dimensions for the grooves should
be sufficient to maintain the circulation of the fluid. However, it should be noted that these
calculations are only an approximation. The actual velocity value should be experimentally
measured and the local changes in viscosity should be accounted for as well.
The groove dimensions of the wick structure chosen here are sufficient to maintain the
circulation of fluid flow. These dimensions were chosen primarily to accommodate certain

12
manufacturing constraints, but these calculations indicate that the grooves are suitable for fluid
flow. There is further room to improve the capillary pressure by optimizing the groove
dimensions in future work.
Additive Manufacturing Process
The additive manufacturing technique used in this study is known as Binder Jetting [16].
In this technique, a binder liquid is sprayed from an inkjet print head onto a powder bed. The
binder is injected into a powder bed in a particular (programmed) pattern to selectively bind the
particles for one layer of powder. The powder bed is they lowered, and another layer of powder
is spread across the bed. The print head again selectively deposits the binder liquid to form
another layer for the part. The process continues until the part is formed. The parts formed at
this stage are called “green” parts, which require further processing before they can be used [19].
The components produced through Binder Jetting have lower residual stresses compared
to most other additive manufacturing techniques. This is mainly because the parts do not
undergo direct melting of the metal and rapid solidification. The material used for this particular
application was a mixture of two types (sizes) of gas atomized copper powder (99% pure). The
mixture was created by mixing five micron fine powder with thirty micron coarse powder in a 27-
73 weight ratio. This combination is proven to provide high density parts with up to 99.47%
density [20, 21]. The printing process was carried out using an ExOne Innovent Plus 3D printer.
After the part is printed the binder is cured and the part is de-powdered using compressed air to
remove the particles which did not bind during the process. Then the part is placed in a furnace

13
for sintering. Green parts are brittle in nature and sintering is required to improve the strength
of the part.
The sintering process is detailed as follows:
1. The temperature was raised to 450 oC at a constant rate of 5 oC/min
2. The part was held at that temperature for 30 minutes to burn off all of the binder
3. The temperature was then raised to the sintering temperature of 1075 oC at the same
rate of 5 oC/min
4. This temperature was held for 3 hours, and then the furnace was allowed to cool down
at the rate of 5 oC/min until room temperature was reached.
During the initial trials, sintering of the printed part proved to be a challenge as the walls
tended to warp. Specifically, while the part appeared to be pristine after printing and de-
powdering, the top wall of the heat pipe sagged upon sintering. It appears likely that uneven
thermal stress in the part resulted in the structural failure during sintering. To avoid these failures
and to improve the structural design, four evenly spaced out pillars of 3.6 mm diameter were
placed in the heat pipe, as shown in Fig. 2b. These pillars improved the structural strength and
prevented failure during the sintering process for subsequently printed parts. The multiple design
iterations followed in the process to develop the final product are discussed in detail in the results
section. The next sections details the experimental setup and procedure followed in the study.

14
CHAPTER 3: EXPERIMENTAL SETUP AND TEST PROCEDURE
The heat pipe was experimentally characterized for thermal performance. A schematic diagram
of the test setup is shown in Figure 5.
The heat pipe has three sections: the evaporator, condenser, and an adiabatic sections.
While each section does not have distinct boundaries along the length of the heat pipe, the
evaporator and condenser can be considered to be approximately 30 mm in length based on the
areas in contact with the heater and cooling block, respectively. Thus the adiabatic section
occupies the remaining ~20 mm in the middle of the heat pipe, and all three sections span the
48 mm width of the heat pipe.
A polyimide heater with a maximum power rating of 40 W supplied heat to the heat pipe,
and a variable DC power supply was used to control the input power. The heater was attached
Figure 7. Schematic diagram of the heat pipe setup. Heat is supplied to the heat pipe through the heater in the lower right, and heat is removed with the cooling block on the lower left where the gap pad is used to reduce the thermal contact resistance between the heat pipe and the cooling block. Here T1, T2, T3, and T4 represent four thermocouples that measure temperature along the surface of the heat pipe. The three circles along the heat pipe are ports that are used to remove excess powder after printing and are sealed before the experiments. The feature at the top left is the opening where the working fluid is inserted into the heat pipe.

15
to the heat pipe using Kapton tape, and, in order to minimize heat loss, the heater was insulated
on the other side using melamine foam.
A Corsair CPU cooler H110i pro was used to remove heat from the condenser section of
the heat pipe. The cooler used a liquid pump to move a water-gylcol mixture through a copper
cold plate (the “cooling block” in Fig. 5), and then back to a radiator that was adjacent to two
cooling fans. Both the fans and the coolant pump were maintained at a constant speed during
the experiments. Two configurations of the cold plate setup were used in the experiments. In the
first configuration, a thermal gap pad (Bergquist TGP 5000) was placed between the heat pipe
and cold plate and the heat pipe and cold plate were clamped tightly together. In the second
configuration, the gap pad and the clamp were removed. These two configurations were used to
decrease and increase the thermal contact resistance, respectively, and, therefore adjust the rate
at which heat was removed from the heat pipe. Four T-type thermocouples (Omega) of size 30
AWG (0.01 inch or 0.254 mm diameter) were used to monitor the temperature along the length
of the heat pipe. The thermocouples were placed at equidistant locations as shown in Figs. 5 and
6. The thermocouples were attached to the heat pipe using Kapton tape.

16
A National Instruments DAQ (C series – 9219) system was used to acquire the
temperature signals. Temperatures were monitored throughout the experiment using a program
written in LabVIEW 2019 software. The front panel (graphical user interface) and block diagram
(graphical program code) of the LabVIEW Program are shown in Figure 7.
The heat flux input to the heat pipe was measured using a FluxTeq one inch heat flux
sensor. The sensor was placed between the heater and the heat pipe, and a Texas Instruments
LaunchPad was used as the data acquisition interface. The heat flux data was recorded using a
program written in MATLAB, and the MATLAB front panel (Graphical User Interface) is shown in
Figure 8. Heat Pipe with thermocouple locations. Schematic diagram of the top of the heat pipe. The locations of the thermocouples are represented by T1, T2, T3, and T4. The opening for filing and removing the working fluid is shown in the lower left.

17
Figure 8. The MATLAB program was developed by several Graduate Teaching Assistants working
under the supervision of Prof. Tom Diller for use in the undergraduate Heat and Mass Transfer
(ME 3304) course at Virginia Tech.
A Welch DryFast Ultra vacuum pump was used in one of the experiments to create a
partial vacuum in the heat pipe. The pump removed air from the heat pipe with the intention of
reducing the pressure so that the working fluid would vaporize at a reduced temperature. The
overall experimental setup used for the measurements is shown in Figure 9.
Figure 9. Front panel of the LabVIEW program. Used to acquire the temperature data from the four thermocouples on the surface of the heat pipe.

18
Figure 10. Block diagram of the LabVIEW program. The icon on the left is used to read the temperatures, the four icons in the center of display the four thermocouple temperatures on the plot on the front panel, and the icon on the right writes the data to a file for further analysis.
Figure 11. Front Panel of the MATLAB code used to record the heat flux data.

19
Experimental Procedure
Two different methods of experiments were used to study the heat pipe. The initial
method involved using a vacuum pump, as discussed previously, to remove air from the heat pipe
so the system could operate at lower temperatures and pressures. Unfortunately, this method
did not yield the desired results, and a second method was used. The second method involved
vaporizing some of the working fluid at atmospheric pressure in order to drive the air out of the
heat pipe, then closing the valve. This method proved to be more successful in the experiments
conducted. Both of the methods are discussed in this section.
Valve
Thermocouple
Cold Plate
Heat Pipe
Heater
Heat Flux Sensor
Figure 12. Experimental setup used to perform the experiments. The valve at the top allows for working fluids to be added or removed from the same heat pipe without requiring a permanent seal.

20
Method 1:
In this method a vacuum pump was used to create partial vacuum in the system. First, the
heat pipe was thoroughly cleaned using acetone. For the experiments, a 50% working fluid filling
ratio was utilized (i.e. half of the internal volume of the heat pipe was filled with the working
fluid). The total internal volume of the heat pipe was designed to be 10 ml, and this volume was
confirmed by carefully filling the heat pipe with water using a syringe. Then, for each experiment,
the heat pipe was charged with 5 ml of either water, acetone, or ethanol, as is discussed further
in the results section. After charging, the heat pipe was connected to the vacuum pump via a
flexible hose. The heat pipe was degassed to a pressure of ~10 kPa absolute and temporarily
sealed using the vacuum desiccator valve attached to the heat pipe (see Fig. 9). Care was taken
to make sure the fluid was not pumped out while degassing was carried out. The purpose of
creating the partial vacuum was two-fold. First, it removes the air from the heat pipe so the air
will not interfere with the flow of vapor later. Second, the lower pressure reduces the boiling
temperature of the working fluid so that the heat pipe can work at a lower operating
temperature.
After the heat pipe was filled with the working fluid, partially evacuated, and sealed, it
was then placed on the cold plate system and fastened using a C-type clamp. This configuration
had a gap pad sandwiched between the cold plate and heat pipe. The polyimide heater was
attached to the evaporator section of the heat pipe using Kapton tape, and the ambient
temperature was recorded for 60 seconds before the start of experiment using a T-type
thermocouple. The power input from the heater was increased gradually until the required
power was reached. The input heat flux at this power level was observed to be around 104 W/m2.

21
The heat flux was monitored throughout the experiment to ensure that the heat input remained
constant during the measurements. Steady-state conditions were defined as when the difference
in temperature values remained within 0.05 oC for one minute. However, after running several
experiments, it was determined that the vacuum desiccator valve was unable to hold the partial
vacuum for the time required to conduct the measurements. Instead, the air slowly leaked back
into the heat pipe, and the device did not operate properly with air inside this heat pipe. Thus, a
second method was developed.
Method 2:
This method is similar to the previous approach expect for a few changes. The primary
difference at the start is that the vacuum pump was not utilized to create a vacuum in the heat
pipe. Instead, the heat pipe was charged with the working fluid and the valve was closed under
atmospheric conditions. The heater was turned on and the power input was gradually increased
to the maximum power level. The goal was to increase the temperature to the boiling point for
the working fluid (e.g. about 56 oC for acetone). In order to increase the temperature of the heat
pipe, the gap pad for the cold plate was removed and the cold plate was no longer clamped to
the heat pipe. This increased the thermal resistance on the condenser side and the temperature
of the heat pipe increased without requiring a more powerful heater.
Once the surface temperature was close to 50 oC, the acetone started to boil. The valve
was then opened and small amount of acetone vapor was allowed to escape and then the valve
was closed immediately. By allowing some of the fluid to vaporize and escape from the heat pipe,
some amount of the non-condensable gases (air) trapped inside are removed from the heat pipe

22
by the acetone vapor pushing it out from the inside. The removal of the non-condensable gases
will improve the heat transfer performance of the heat pipe as the vapor can move more easily
from the evaporator to the condenser. Further measurements indicated that the heat pipe was
functioning properly. These measurements and observations are discussed in detail in the
following section.

23
CHAPTER 4: RESULTS AND DISCUSSION
This section discusses the details of the design optimization and the experimental results.
Geometric features of the design and the additive manufacturing process were previously
discussed in detail in the design section. Here the results of the step-by-step design optimization
are detailed. The latter part of this section discusses the experimental observations and results
from actual operation as a heat pipe.
Design Optimization Process
Four different iterations of the design were performed before the successful print of the
component. The CAD model of the first iteration is shown in Figure 10.
Figure 13. CAD model of the first design iteration. Only two de-powdering holes were provided. The diameters of these holes were 0.8 mm, or 1.6 mm smaller than the final design of 2.4 mm.

24
The initial intent of the design was to have the fewest number of de-powdering holes as
possible. The purpose behind limiting the number of de-powdering holes was to reduce the
challenge of properly sealing the heat pipe during operation. Accordingly there were only four
holes in the first design and the diameter of the holes was 0.8 mm, or 1.6mm smaller than the
final dimension of 2.4 mm. However, the component failed while de-powdering using
compressed air. Figure 11 shows the failed 3D printed part. Upon inspection, it was deciphered
that the hole diameter was not sufficient for the compressed air to exit. The compressed air
created a pressure buildup inside which caused the fragile green part to break before it could be
sintered.
Figure 14. Failed print of the first design iteration. The de-powdering holes were not sufficient to allow the compressed air to escape without pressure buildup which lead to the part failing.

25
Reducing the compressed air pressure was not an attractive option since that would cause
the loose copper powder to be stuck inside the heat pipe. Hence, in the next iteration the
diameter of the holes was increased to 2.4 mm. To accommodate the increase in diameter the
internal volume of the heat pipe was also slightly increased. Unfortunately, this increase in
diameter still did not yield the desired result, as the part still failed while de-powdering. Thus, it
was determined that holes were also required in the longitudinal direction to facilitate easy
removal of the powder from the middle of the heat pipe. Therefore, two additional holes of the
same diameter were added along the length of the heat pipe. The CAD model of this heat pipe is
shown in Figure 12.
Figure 15. CAD model of the third design iteration. Two additional holes of the same diameter (2.4 mm) were added along the longitudinal direction of the heat pipe.

26
This first print of this third design iteration turned out to be unsuccessful while de-powdering.
However, the second printing attempt was successful, and the printed component (green part –
before sintering) is shown in Figure 13.
Though the printing of the green part was successful, the component failed during sintering as a
crack formed along the top surface. Additionally, after sintering the top surface was not
completely flat, as the top wall had warped and caved in. The crack and warping can be clearly
seen in Figure 14. Further analysis was carried out to identify the causes for the failure of the
part. One suspected reason for the warping of the part was the component’s length, as it was
significantly longer than other parts that have been successfully manufactured using this
technique previously. When exposed to the sintering environment of 600 oC, excessive thermal
stresses could have been developed leading to component sagging in the middle.
Figure 16. 3D printed green part (before sintering) of third design iteration. Though the print was successful the component failed during the sintering process.

27
The fourth, and final, design iteration took into consideration the two main issues listed
below. The CAD model of the final design is shown in Figure 15.
1. The design must enable successful de-powdering of the part. To ensure successful de-
powdering, one additional hole of the same dimension was added along the length of the
heat pipe. In total ten holes were provided for de-powdering. These holes made the de-
powdering process easier and the part was depowdered successfully in the first attempt.
2. The design must avoid excessive sagging of the top wall in the heat pipe. To enhance the
structural rigidity of the component four small pillars were designed inside the heat pipe
as shown in Fig. 7. These pillars provided additional support and prevented the top wall
from excessive sagging during the sintering process. The final component still did not have
the precise shape as per the design, as there was some amount of warpage. The base of
the heat pipe was not perfectly flat, and it had a slight amount of curvature. However,
this small deviation is not expected to have a significant impact on the heat pipe
performance.
Figure 17. Final failed third design printed part. Sintered component with crack on the top wall (left), Top wall of the sintered component caved inwards (right).

28
After the successful manufacturing of the heat pipe, the next step was to experimentally
characterize the heat pipe performance. The performance is discussed in detail in the next
section.
Figure 18. CAD model of fourth and final design iteration. Component with ten de-powdering holes (left). The cross sectional view of the final design shows the pillars used to increase the structural stiffness (right).

29
Experimental Results of the Thermal Performance
The experimental measurement process that was followed was discussed in detail
previously in the experimental setup and procedures section. In the initial set of experiments,
water was used as the working fluid. Water was the first choice due to its high heat carrying
capacity when compared to other liquids of interest. Additionally, water is a safe liquid to use
with no toxicity, and it is commonly used in commercial heat pipes. However, using water did not
prove to be successful since the boiling point (100 oC at atmospheric pressure) was too high to
be reached with the current setup. It was difficult to keep the heat pipe pressure below
atmospheric pressure, so it was not possible to reduce the boiling point, and it was difficult to
control the heater and temperature up to 100 oC. After experimenting with acetone, ethanol and
isopropyl alcohol – acetone was chosen as the working fluid.
Acetone was chosen due to the low boiling point (56 oC at atmospheric pressure) which
can be achieved with the current setup. Two power input levels were used for the measurements.
The corresponding heat flux levels for these power inputs were 104 W/m2 (H1) and 1.3x10⁴ W/m2
(H2). Figure 16 shows the variation of temperatures across the heat pipe as a function of time for
heat flux H1. T1 and T4 correspond to the evaporator and condenser temperatures as measured
by the thermocouples on the top surface of the heat pipe as shown in Fig 6. T2 and T3 are the
temperatures measured on the heat pipe surface at equidistant points between T1 and T4. Figure
17 shows the heat flux variation with time and demonstrates that the heat input to the heat pipe
was relatively constant.

30
Figure 19. Variation of temperatures with time for a heat flux of 104 W/m2 (H1). T1 and T2 are measured on top surface of the evaporator section of the heat pipe and T3 and T4 are measured on the top surface of the condenser section. When T1 reaches the maximum temperature, the acetone begins to vaporize, and then all four temperatures begin to drop as the evaporation and condensation cycle of the heat pipe operation begins.
Figure 20. Heat flux variation (H1) with time. The heat flux was measured with a sensor placed between the heater and the evaporator section of the heat pipe.

31
When the temperature T1 reaches slightly above 50 oC, at t ~1200 s, the acetone starts to
boil. It is important to emphasize that these temperatures (T1, T2, T3, and T4) were measured on
the outer surface of the top of the heat pipe, and that the temperature of the acetone inside the
heat pipe, directly over the heater, will certainly be greater than the maximum temperature (T1)
observed by the thermocouples. The initial acetone vapor was allowed to escape the heat pipe
(to drive out the air in the heat pipe) by briefly opening the desiccator valve, and then the valve
was closed again. Once the valve is closed, the heat pipe should only contain saturated acetone
as a liquid and a vapor. At this point temperatures across the heat pipe begin to drop. This marks
the onset of the phase change process and the start of the heat pipe operation. To further
illustrate and understand this phenomenon the difference in temperatures was tracked with time
and these differences are shown in Figure 18. Temperature T1 is taken as the reference and the
Figure 21. DeltaT variation with time for heat flux H1. The temperature difference drops by a factor of 2.5 after the heat pipe operation begins around 1200 seconds, when the temperature in the evaporator reaches the boiling point of acetone. This drop in the temperature gradient indicates that the heat pipe is operating properly.

32
other temperatures are subtracted from T1, i.e. delta T1 = T1-T2, delta T2 = T1-T3, delta T3 = T1-
T4. It is evident that the temperature gradient decreases by a factor of 2.5 after the heat pipe
operation begins, again indicating that heat pipe operation starts at a surface temperature of
about 50 oC. This operation temperature can be further reduced if pressures below one
atmosphere are maintained inside the heat pipe in order to reduce the boiling point. These trends
illustrate important characteristics of a functional heat pipe, namely a reduction in the
temperature gradient and close to uniform heat spreading. The experiment was repeated again
for the same heat flux to ensure the validity of the data. A similar drop in the temperature and
temperature gradient was observed in the second experiment.
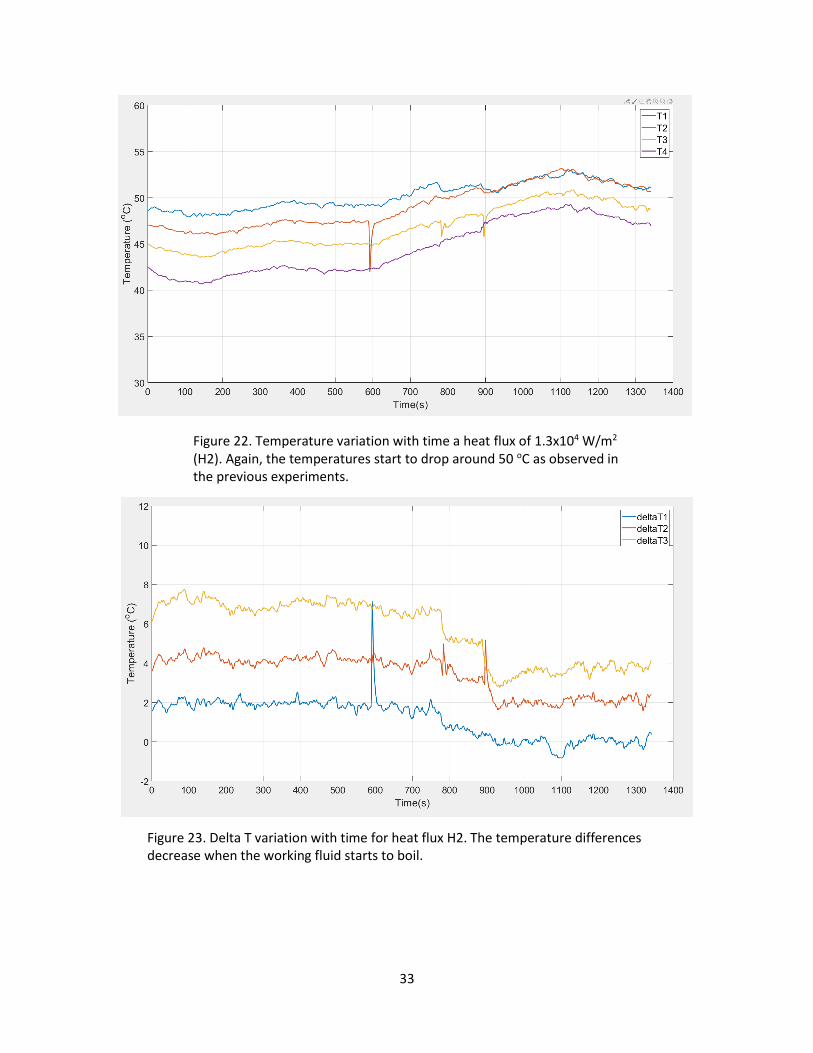
The experiment was also carried out for a higher heat flux of 1.3x10⁴ W/m2 (H2), and the
results are shown in Figures 19 and 20. The trends were similar to previous experiments at the
lower heat flux. Again, when the temperatures reached 50 oC, the temperature and temperatures
gradients started to drop. However, the decrease in temperature gradients were not as large as
they were for heat flux H1. This trend can possibly be attributed to the higher input heat flux into
the system, as the heat pipe could have difficulty in removing the larger heat flux. Similar trends
were observed in previous work [10, 16].
33
Figure 23. Delta T variation with time for heat flux H2. The temperature differences decrease when the working fluid starts to boil.
Figure 22. Temperature variation with time a heat flux of 1.3x10⁴ W/m2 (H2). Again, the temperatures start to drop around 50 oC as observed in the previous experiments.

34
Effective Thermal Conductivity Calculation
The primary purpose of a heat pipe is to transport heat over a distance as efficiently as
possible. Essentially, a properly configured heat pipe will operate as a material with an
exceptionally large thermal conductivity. Materials with large thermal conductivity will move
heat with a small temperature drop between the hot and cold ends. Thus looking at the
temperature gradients in these experiments gives some insight on how well the heat pipe is
operating. Whereas the thermal conductivity is used to characterize common materials, an
“effective thermal conductivity,” as defined in equation 3, is used to quantify the heat carrying
ability of a heat pipe.
The effective thermal conductivity, keff is calculated as
𝑘𝑒𝑓𝑓 = (𝑄⋅𝑙𝑒𝑓𝑓)
Δ𝑇⋅𝐴𝑐 - (3)
where Q is input power in watts, T is the temperature difference between T1 and T4, Ac is the
cross-sectional area of the heat pipe, and leff is the effective length of the heat pipe and is defined
as
𝑙𝑒𝑓𝑓 = (𝑙𝑒+𝑙𝑐 )
2+ 𝑙𝑎 - (4)
where le and lc are the lengths of the evaporator and condenser sections, respectively, and la is
the length of the adiabatic section as shown in Figure 21.

35
In general, heat pipes can have significantly higher thermal conductivities when compared
to the solid metal they are made from. The addictively manufactured heat pipe used in this study
is made from copper. The thermal conductivity of bulk copper at room temperature is nearly 400
W/mK, but this 3D printed copper is not quite fully dense and has an estimated thermal
conductivity of ~350 W/mK. When printed into the form of the heat pipe, the effective thermal
conductivity of the heat pipe is when it is below the operating temperature (i.e. when it acts
essentially as a hollow piece of copper) is approximately 200 W/mK. Once the heat pipe begins
operating at approximately 50 oC, the temperature drop is reduced by a factor of about 2.5
leading to an effective thermal conductivity of 500 W/mK with an applied heat flux of 104 W/m2.
Thus, under heat pipe operation the effective conductivity of the heat pipe increases by a factor
of 2.5, and the heat pipe effective conductivity is 25% greater than the thermal conductivity of
bulk copper.
From the above results it can be stated with confidence that, while not optimized, the
heat pipe is functional and it provides a thermal conductivity about 25% greater than solid
Figure 24. Heat pipe schematic showing the different operating sections.

36
copper. The goal of this study was to develop an additively manufactured heat pipe that would
function properly. Further optimization studies are planned for the future to better characterize
and further improve the heat pipe performance, and these plans are discussed in the future work
section.

37
CHAPTER 5: CONCLUSIONS
The focus of this study was to demonstrate the feasibility of developing heat pipes through an
additive manufacturing technique. A flat plate heat pipe with grooved wick structures was
manufactured using Binder Jetting additive manufacturing. Copper was chosen for
manufacturing due to its high thermal conductivity and acetone as the working fluid due to its
low boiling point. Through experiments, the heat pipe was found to be functional with a 25%
increase in thermal conductivity in comparison with solid copper. The work also described the
design challenges associated with the fabrication of heat pipes using additive manufacturing.
Consequently the design was improved for manufacturing by providing additional vent holes for
de-powdering. Four support pillars were provided on the inside of the heat pipe to enhance the
structural strength during the sintering process. Further optimization studies to enhance the
performance are detailed in the future work section.

38
CHAPTER 6: FUTURE WORK
The focus of this work was to develop a functional heat pipe fabricated through an additive
manufacturing process called Binder Jetting. While that goal was successfully accomplished,
there are opportunities to further characterize, understand, and improve the performance of the
heat pipe. The future work can be classified broadly into analytical and experimental studies.
Analytical work:
1. Perform optimization of the groove structure. Capillary pressure and solid-liquid vapor
resistance are the two main parameters which govern the functioning of the heat pipe. A
theoretical force balance can be performed on these forces to help design an optimal
groove structure.
2. Geometric optimization for a specific applications. For a particular industry application,
the heat pipe could be designed specifically to address that need.
Experimental work:
1. Study the surface phenomenon such as wetting for additively manufactured grooves.
While the analytic work is useful in designing the grooves, experimental measurements
of the wetting and adhesion of the liquid(s) on the printed surfaces are also important as
the printed surfaces have texture and are not smooth.
2. Examine the performance of the heat pipe with various fluids at higher temperatures
and/or lower pressures. The current setup made it difficult to reach higher temperatures
thus using water at atmospheric pressure was impossible. Similarly, it will be interesting

39
to look at lower pressures where the fluids can vaporize easier. In order to reach lower
pressures, the valve (or other method for sealing the heat pipe) will need to be improved.
3. Examine the effect of working fluid ratio on the thermal performance of the heat pipe.
4. Repeat and confirm initial measurements for various heat fluxes and for different working
fluids. The measurements conducted thus far should be repeated to determine
uncertainty and to confirm the results thus far.

40
REFERENCES
1. Murshed, SM Sohel, and CA Nieto De Castro. "A critical review of traditional and emerging techniques and fluids for electronics cooling." Renewable and Sustainable Energy Reviews 78 (2017): 821-833.
2. Weyant, J., et al. "Heat pipe embedded AlSiC plates for high conductivity-low CTE heat spreaders." 2010 12th IEEE Intersociety Conference on Thermal and Thermomechanical Phenomena in Electronic Systems. IEEE, 2010.
3. Faghri, Amir. "Heat pipes: review, opportunities and challenges." Frontiers in Heat Pipes (FHP) 5.1 (2014).
4. Yeh, Lain-Tuu, and Richard C. Chu. "Thermal Management of Microelectronic Equipment. 2002."
5. Faghri, Amir. Heat pipe science and technology. Global Digital Press, 1995. 6. Gao, Wei, et al. "The status, challenges, and future of additive manufacturing in
engineering." Computer-Aided Design 69 (2015): 65-89. 7. Collins, Ivel L., et al. "A permeable-membrane microchannel heat sink made by additive
manufacturing." International Journal of Heat and Mass Transfer 131 (2019): 1174-1183. 8. Dede, Ercan M., Shailesh N. Joshi, and Feng Zhou. "Topology optimization, additive layer
manufacturing, and experimental testing of an air-cooled heat sink." Journal of Mechanical Design 137.11 (2015).
9. Robinson, A. J., et al. "A new hybrid heat sink with impinging micro-jet arrays and microchannels fabricated using high volume additive manufacturing." 2017 33rd Thermal Measurement, Modeling & Management Symposium (SEMI-THERM). IEEE, 2017.
10. Thompson, Scott M., et al. "Additive manufacturing of heat exchangers: A case study on a multi-layered Ti–6Al–4V oscillating heat pipe." Additive Manufacturing 8 (2015): 163-174.
11. Jafari, Davoud, Wessel W. Wits, and Bernard J. Geurts. "Phase change heat transfer characteristics of an additively manufactured wick for heat pipe applications." Applied thermal engineering 168 (2020): 114890.
12. Esarte, J., et al. "Optimizing the design of a two-phase cooling system loop heat pipe: Wick manufacturing with the 3D selective laser melting printing technique and prototype testing." Applied Thermal Engineering 111 (2017): 407-419.
13. Ozguc, Serdar, et al. "Experimental Demonstration of an Additively Manufactured Vapor Chamber Heat Spreader." 2019 18th IEEE Intersociety Conference on Thermal and Thermomechanical Phenomena in Electronic Systems (ITherm). IEEE, 2019.
14. Ameli, Masoud, et al. "A novel method for manufacturing sintered aluminium heat pipes (SAHP)." Applied Thermal Engineering 52.2 (2013): 498-504.
15. Jafari, Davoud, Wessel W. Wits, and Bernard J. Geurts. "Metal 3D-printed wick structures for heat pipe application: Capillary performance analysis." Applied thermal engineering 143 (2018): 403-414.
16. Nagayama, Gyoko, Shunya Gyotoku, and Takaharu Tsuruta. "Thermal performance of flat micro heat pipe with converging microchannels." International Journal of Heat and Mass Transfer 122 (2018): 375-382.

41
17. Wong, Shwin-Chung, and Yu-Chung Lin. "Effect of copper surface wettability on the evaporation performance: Tests in a flat-plate heat pipe with visualization." International journal of heat and mass transfer 54.17-18 (2011): 3921-3926.
18. Wong, Shwin-Chung. "The evaporation mechanism in the wick of copper heat pipes." The Evaporation Mechanism in the Wick of Copper Heat Pipes. Springer, Cham, 2014. 1-36
19. Miyanaji H: Binder jetting additive manufacturing process fundamentals and the resultant influences on part quality. University of Louisville, Mechanical Engineering; 2018.
20. Bai Y, Wagner G, Williams CB: Effect of Particle Size Distribution on Powder Packing and Sintering in Binder Jetting Additive Manufacturing of Metals. Journal of Manufacturing Science and Engineering 2017, 139:081019-081019-081016.
21. Kumar A, Bai Y, Eklund A, Williams CB: Effects of Hot Isostatic Pressing on Copper Parts Fabricated via Binder Jetting. Procedia Manufacturing 2017, 10:935-944.