design description document - hajim.rochester.edu · plexiglass box are painted with black spray...
TRANSCRIPT

Sleek Analyzer Design Description Document
UNIVERSITY OF ROCHESTER
Design Description Document
Sleek Analyzer
Alex Anderson, Jiajian He, Tyler Berryman, Zhiqi Wang
Customer: Sydor Optics Engineers: Alex Anderson, Jiajian He, Tyler Berryman, Zhiqi Wang Advisor committee: Wayne H. Knox
Document Number: 02
Revision Level: E
Date: 04/27/2016
This is a computer generated document and the electronic master is the official revision. This paper copy is authenticated for the following purpose only: An instrument which can quantitatively distinguish between laser grade and standard grade optical flats with an accuracy of greater than 99 percent correlation. This measurement should be able to be performed in under 1 minute per side of each flat. The instrument should be production robust.
Authentication Block
Rev. E Page | 1

Sleek Analyzer Design Description Document
Table of Contents Product Requirement Document
Prior Instrument Development
Theoretical Background
System Block Diagram
Optical Design
Mechanical Design
GUI Development
Specifications Table
Testing Protocol
Before Device Assembly
During Device Assembly
After Device Assembly
Results
Risk Assessment
Transition Plans
Appendix A: Initial Photon Budget Analysis
Appendix B: User Guide
Appendix C: Recommendations for Future Improvement
Appendix D: Guide to Developing and Debugging Matlab GUI
Rev. E Page | 2

Sleek Analyzer Design Description Document
Product Requirement Document (See digital reference document 01)
Prior Instrument Development
In prior iterations of this project, the roughness of the optical flats was attempted to be measured using Fourier Analysis, GPI interferometry, and scatterometry. After analysis of all 3 techniques, only scatterometry was found to be sensitive enough to differentiate between the standard grade and laser grade levels of roughness. The rms roughness of standard grade optical flats is approximately 810 Å, whereas the laser grade optical flats are usually 35 Å. In the initial scatterometry results, the scatterometer was set up in transmission mode. This led to extremely high intensities at 0°, saturating the detector. To remedy this problem, the scatterometer was redesigned for reflection mode such that the laser beam was linearly polarized to ppolarization and was incident on the optic’s surface at Brewster’s angle. This greatly reduced the spectral reflection (theoretically to 0) ppolarized light incident on a surface at Brewster’s angle has 100% transmission. This method was effective in lowering the central peak reflection such that the lower intensity scattered light could be measured. When measuring the scattered light, the prior design team compared results from a 632.8 nm HeNe laser and a 405nm laser pointer. For the 632.8 nm HeNe laser, there was not a measurable difference in the scatter from a standard grade optical flat and a laser grade optical flat. However, the 405 nm laser pointer yielded a significant difference in the scattered light between standard and laser grade optics, allowing a correlation to be drawn between the surface roughness and the scattered light. This phenomenon can be explained by the wavelength dependence of Rayleigh scattering. Because Rayleigh scattering is proportional to λ4, shorter wavelengths are much more strongly scattered. For the same reason, it is expected that a UV source would produce an even larger difference in the power of the scattered light between laser grade and standard grade optics. In designing a scatterometer to measure the roughness of these optical flats, it will be desirable to use a short wavelength source (405nm or less) and to place the sample in reflection mode at Brewster’s angle. An angular offset from Brewster’s angle will slightly increase the specular reflection; while this will increase the reflection at the central peak, the scatter measurement should not be impaired, provided that A) the detector is not saturated, and B) the angular position of all samples is consistent. In fact, this detuning from Brewster’s angle may raise the value of
Rev. E Page | 3

Sleek Analyzer Design Description Document
the total integrated scatter (see Appendix A on photon budget). However, this detuning may also potentially increase the stray light.
Theoretical Background
In order to predict the RMS (root mean square) roughness of the optical flats based on the scatter information, the RayleighRice and the BeckmannKirchhoff theories could be used [1]. In our case of a “smooth” surface, the RayleighRice theory agrees better because it works with wideangle scatter measurements regardless incident and scattering angles while the BeckmannKirchhoff scattering theory is only valid with paraxial assumption (small angles). The BRDF (bidirectional reflectance distribution function) is used as the parameter to indicate the amount of scatter light from the sample surface [1]:
BRDF was defined by Nicodemus in 1970 as the radiance (L) of the scatter light divided by the incident light irradiance (E). In the classical RayleighRice theory, the surface ACV(autocovariance)function is used to dictate the behavior of light scattering.
Assuming ACV has a Gaussian distribution, the ACV function Cs is defined as [1]:
Where the σs is the RMS surface roughness, Lc is the halfwidth of the ACV function at 1/e height. Figure 1 is the schematic diagram of the surface profile and relevant statistical parameters from the section of surface characteristics in Krywonons [1]. As it shows in figure 1, the value of the ACV function at its origin is the surface variance, which is square of the RMS surface roughness.
Rev. E Page | 4

Sleek Analyzer Design Description Document
The surface PSD (power spectral distribution) function is defined as a plot of surface variance as a function of the spatial frequency of the surface roughness. Surface PSD function is the Fourier Transform of surface ACV function. In the RayleighRice theory, the PSD has a relation with BRDF defined as [1]:
Where Q is the angledependent polarization reflectance, which is a real number related with the sample surface property. The value depends on the sample dielectric constant, angle of incident and scatter,incident polarization and the polarization states allows to pass through the detector[2]. ϴi is the incident angle of light source and ϴs is the scattering angle. In our project, the real value of Q would vary during the scanning process which would cost more time to process data. Thus, in our project with the scatter information gathered by the detector, we could calculate the BRDF function, and then use the RayleighRice theory to calculate the PSD function. By performing a Fourier Transform on the PSD function, we could get the ACV function. The amplitude of the ACV function is the surface variance value of the sample, which is the square of the RMS surface roughness value. *We planned to provide this algorithm in the software GUI in order to directly report the roughness of the surface and to provide a check for Sydor. However, this feature will likely require the instrument to measure a large number of data points, which will take more time for data acquisition and slow the measurement process. As speed of measurement is highly desirable,(we decided) it will likely be faster to take a minimum number of data points and just use these to compare to the a database of mean scattering intensities at the same angle from training samples with known rms roughnesses. Therefore, we expect calculating and reporting the rms roughness will be an addon rather than a default/primary feature. So in order to build up the database to distinguish between laser grade and standard grade optical flats, the scattering intensity profile of ten optical flats each for laser grade and standard grade with different surface rms value are measured by New View white light interferometer. By comparing the scattering distributions to their respective interferometric data, we can build a reference database to characterize pieces of unknown roughness and quality.
Rev. E Page | 5

Sleek Analyzer Design Description Document
System Block Diagram
Fig. 2 . System Block Diagram for scatterometer
Optical Design
A scatterometer is designed to measure the angular scattering intensity distribution of sample surface over the desired angular range. Based on the theory that the amount of scattered power in the angular light distribution would vary proportionally with surface roughness, the roughness level of optics surface will be determined by comparing the intensity profiles of scattered light for different surfaces. A rougher surface will scatter more light, and thus more power would be detected by the detector. By comparing the intensity profile of the reflected light to an average of measurements of reference samples with known RMS roughnesses, we can correlate intensity profiles to surface roughness.
Rev. E Page | 6

Sleek Analyzer Design Description Document
Fig. 3 . Scanning diagram
We use a reflection geometry with the sample at Brewster’s angle to reduce the measured power at the central peak. A 405 nm, 38.5mW laser will generate a linearly polarized beam, which is rotated with a half wave plate and passes through a polarizer to ensure it is ppolarized; this minimizes the specular reflection, and the measured signal will consist only of scattered light (to the limit of the polarizer and our ability to set it to the correct angle). A rotational scanner with a power meter on the end of a mechanical arm rotates over a range of angles to measure the scattering power from the surface. The transmitted beam is attenuated at a beam dump. The entire instrument is placed within a 26”x26”x16” box of black plexiglass in order to prevent room lights from affecting the measurements.
Fig. 4 . Laser and polarizing optics Fig. 5 . Instrument with box covering stray light
In order to reduce the amount of stray light in the system, a box is placed around the laser and polarizing optics. The front of this box contains an rudimentary aperture to block light which was scattered by the polarizer and waveplate. This aperture is constructed by putting black electrical tape on 4 microscope slides and taping the slides together such that a square aperture is open between the slides to allow the unscattered beam to pass through it. The inside faces of the black plexiglass box are painted with black spray paint (RustOleumTM) in order to reduce the glossiness of the box and give it a matte finish instead. This will reduce the amount of reflections
Rev. E Page | 7

Sleek Analyzer Design Description Document
of stray light within the box. Because the sample may not be exactly at Brewster’s angle, a second beam dump is taped to the top of the box where the specular reflection will hit the box. Additional baffling was added at the detector by attaching a black anodized aluminum tube approximately 2 inches long, and 0.875 inches diameter to the front of the detector. This limits the field of view of the detector to reduce the stray light able to reach the detector. A similar black anodized aluminum tube was taped to the aperture, in order to reduce the stray light from the beam reflecting off the edges of the aperture.
Fig. 6 . Aluminum tubes attached on the detector and the box
Mechanical Design
The CAD drawings below illustrates the current design for the instrument. While the prior art for this instrument used the configuration with the motor behind the sample, we have placed the motor and arm to the side of the sample in order to enable the use of a shorter arm.
Rev. E Page | 8

Sleek Analyzer Design Description Document
Fig. 7 . CAD drawing for whole system
CAD drawing from front: Laser shown reflecting off sample. Sample is at Brewster’s angle for fused silica. On left, knob to adjust tilt stage is visible. Orange detector can rotate through 180° (although only about 120° of these are above the sample. A mechanical stop shown in black on motor mount will prevent the detector from rotating into instrument.
Fig. 8 Slots in aluminum angle mount to decrease machining tolerances
In order to accommodate machining tolerances, slots were added to aluminum angle mounting structures. An example of these slots are shown in the picture above.
Rev. E Page | 9

Sleek Analyzer Design Description Document
Fig. 9 . Sample retainer
Sample Retainer: Easily removed and replaced with 3 standoffs that fit into matching holes on the platform. Retainer is machined from acrylic.
The two sample retainers shown in the complete model are shaped for circular parts of diameter 200mm and of 13inch diameter. For smaller parts or for parts of an arbitrary shapes, a different sample retainer of different size and/or shape may be built and used. Requirements for these retainers is that they hold the optic such that the center of the optic is approximately at the same height of the laser. The retainers should also have ½ inch standoffs spaced at multiples of 1.5 or 3 inches for the upper row of mount holes, and spaced at 4 inches for the lower row of holes. Because the standoffs on the retainers simply slide into the holes, it is very easy for a user to swap out different retainers needed for different parts.
The polarization controlling optics are held in the ThorLabs rotation mounts, shown in the CAD drawing. The first of optical component following the laser will be a half wave plate to rotate the polarization to be vertical with respect to the table. The second optical component is a polarizer to filter out any remaining spolarized light from the laser. If we found the laser to be circularly polarized, we would consider adding a quarter waveplate. This would reduce the wasted light that otherwise would not be transmitted through the polarizer. However, if the gain in signal is minimal, we would need to consider whether this gain in signal is significant enough to warrant adding the quarter waveplate. If the waveplate itself attenuates a fraction of the beam and scatters some of the light, it may be advantageous to omit it if the signal gain is minimal.
The arm, which scans the detector of the sample, is modeled after the arm used in the prior year’s scatterometer, and is shown in the picture above. The arm is attached to the motor by a hub which screws into the face of the motor, and a short steel arm was securely bolted through the center of this hub. The original arm was built from stainless steel optical posts, but we found these posts were much too heavy; the motor had the potential to stall out in certain conditions. We therefore switched to using wooden dowels in place of steel rods. This new arm was much lighter and was much easier for the motor to lift. The detector was attached to the arm by tapping
Rev. E Page | 10

Sleek Analyzer Design Description Document
a hole in the end of the dowel and screwing in a set screw. The wooden dowel arm has somewhat less rigidity than the steel arm, which causes the arm to vibrate back and forth when it is abruptly accelerated or stopped. The motor code was therefore adapted to slow the acceleration to minimize this vibration.
As a failsafe feature, the motor mount will include a padded mechanical stop to gently stop the motor from rotating the detector into the polarization optics and sample mount. We plan to implement virtual limit switches within the code to prevent the motor from reaching these mechanical stops, however, if the arm slips on the motor, this mechanical stop will catch the arm before it damages the detector. A future revision of this design may include limit switches which will trigger a deceleration of the arm before it hits anything. Such a limit switch would also provide better information of the angular position of the arm relative to precisely known position of the arm. The limit switch has not yet been designed into the system due to the additional communication and integration requirements inherent to using another I/O device.
Additionally, when the system is at rest, the arm will be rested on a foam pad behind the sample mount. This will ensure that the motor is not loaded while at rest and will provide a safe place for the arm to rest.
The entire instrument sits within a lighttight box, constructed of 80/20 and black plexiglass. This box will be rigidly fixed to the instrument breadboard. To quickly place and remove samples, the front and top of the box are on hinges and can be lifted and propped up. Future revisions of this box may include a notched stand to hold the door up more conveniently. Due to the design of this box, there are small slots along the sides at the front where the access door rests which can let in some ambient light. In order to cut out this light, black foam board “fins” were taped over these slots.
The laser mount uses the laser pointer in its original housing and use a postmounted three finger clamp.
The sample platform will be lasercut polycarb, and will be mounted with leverlock hinges with countersunk mounting holes. A fine adjustment (¼80 thread) knob will be used to precisely adjust the angle of the platform. If the rigidity is an issue, we will add an aluminum brace along the back; this will determined once the polycarb is cut and we are able to assess its rigidity. The range of Brewster’s angles required for different materials ranges from 55.77° to 56.83°, but we plan to be able to rotate over at least 5° to account for manufacturing and assembly tolerances. Our current design includes the ability to rotate the sample to different angles, but we hope to test whether a central angle can be picked instead of requiring this sample stage to move.
Rev. E Page | 11

Sleek Analyzer Design Description Document
Fig. 10 . CAD drawing for fine adjustment knob
View beneath sample stage:Note the brace for the tilt stage knob to push against, as well as the lever lock hinge in the upper left.
The motor is positioned such that its axis of rotation is 5mm above the surface of the sample platform. (The most common sample thickness is around 3mm, but the thickest samples are 10mm)
Electrical Design
The 3 main components of the scatterometer system are the laser, the motor, and the power meter and detector.
Laser subsystem Laser pointer: 405nm, 50mW
Measured output power to be 38.5mW Power supply
It was desired to not use batteries for the laser pointer as this would require frequent monitoring of the voltage of the batteries; a drop in voltage may not be immediately noticed, but would significantly diminish the output power of the laser.
Originally intended to run on a simple AC/DC converter and wire the converter into the laser pointer battery terminals. However, while the converter provided the correct voltage and current, the laser pointer emitted less than 1mW of power. We suspect that this was caused by ripple in the AC/DC converter.
Rev. E Page | 12

Sleek Analyzer Design Description Document
The power supply was substituted with a Hewlett Packard E3630A Triple Output DC Power Supply. It was set to 3V and wired to the laser pointer’s terminals.
In order to protect the terminals and to enable laser pointers to be easily swapped out, the wires from the power supply are routed through the body of the laser pointer and mechanically connected to the terminals (but not soldered).
Controls In order to be able to turn the laser on and off remotely, a USB controlled
relay was used. The relay is placed in series with the power supply and the laser pointer terminals such that when the relay is activated, the circuit closes and the laser pointer turns on. This requires the button on the laser pointer to be held down, which is accomplished with a hose clamp. This device uses a USBA to USBB cable to communicate with a computer. The computer may or may not recognize the device; this problem is suspected to be caused because the device somehow deviates from USB power specifications. However, as a workaround, we found that plugging the device into a USB hub then plugging the hub into the computer allows the computer to recognize the device. (Reference)
Motor Zaber: XRSW60A
Includes motor, controller, and power supply This motor was originally chosen in part for the amount of torque that it
could supply (2.25 Nm). Because the arm was shortened and the material was changed to wooden dowels, the torque requirement is no longer as restrictive of a specification. Future iterations of this scatterometer could most likely use a less powerful motor.
Power Meter/Detector Newport 1830R power meter Newport UV Detector, 2001100nm 818UV/DB
GUI Development
The GUI and the other device communication software are compiled into executable file in order to run on a desktop computer provided by Sydor.
Development of the GUI for operation of the scatterometer is broken down into two main areas: changing the GUI we obtained from Pedro and adding in additional features that are specified from the PRD. A short breakdown of the actual changes is shown below:
Rev. E Page | 13

Sleek Analyzer Design Description Document
GUI Modifications Add in laser v. standard grade indicator Add quantitative roughness output Add Scanning parameters text box which takes user input of angular positions
*For testing version of GUI, the grade indicator has not yet been implemented.
Additional Features Added communication with different hardware (motor, detector, etc.)
USBcontrolled relay to control Laser pointer Include an on/off button controlling the laser pointer Include a static text box indicating the status of laser pointer
Zaber Motor Controller Set the speed and acceleration of motor as default Include a Home button to move the arm to the set position
Newport Power Meter Set 50ms between each measurements at one position as default
Added a Save button which save the data taken from the power meter including a text box for user to name the file
Added a Scan button which move arm to the input angular positions and take seven measurements at each position
Rev. E Page | 14

Sleek Analyzer Design Description Document
Table.1. Flow chart for scanning process
Rev. E Page | 15

Sleek Analyzer Design Description Document
GUI Sample Window
Fig. 11 . GUI interface
Specifications Table
Required Desired
Maximum Sample Diameter ≤ 200 mm ≤13” = 330.2 mm
Sample Thickness 26 mm 110 mm
Measurement and Processing Time ≤ 1 minute/side
Roughness Sensitivity Sensitive to 12 Å rms roughness
Device Size < 3x4x2 ft
Detector Wavelength Sensitivity (Range required for prototype only)
405 nm 300 – 405 nm
Rev. E Page | 16

Sleek Analyzer Design Description Document
Table.2 . Specifications Table
Testing Protocol Before Device Assembly
1. Check power level of laser pointer a. The power detector has a limited range, so to measure power on the order of
milliwatts, the attenuator should be screwed on to the detector, and the attenuator button of the power meter must also be toggled on. Once the laser power has been measured, make sure to remove the attenuator and to toggle off the attenuator button on the power meter.
2. Set the polarizer such that it only transmits ppolarized light.
a. A rough estimate of the polarization direction can be found by rotating the polarizer and looking for the angle at which the reflection off the floor is extinguished.
3. Find Brewster’s angle for fused silica sample(s) (completed)
a. Assess Brewster’s angle theoretical sensitivity b. Determine angular adjustments needed for different sample thicknesses
During Device Assembly
1. Assess maximum angular scanning range based on setup. Set this as the limits of the motor in the software.
a. Angular scan range is currently set to 0 to 180°. The negative refers to the direction of the motor’s rotation. The home position is always defined as 0°. In the software, these limits are applied by checking the user’s input angular positions to scan.
2. Set the angle for the waveplate and the laser
a. Set the laser pointer in any arbitrary orientation and securely place it in the clamp. Place the detector in the optical path behind the polarizer. Place the waveplate between the laser pointer and the polarizer. Rotate the waveplate while measuring the transmitted power. Set the position of the waveplate to that which maximizes the transmitted power. When the waveplate is rotating the laser beam to Ppolarization, this will result in the maximum transmitted power.
Rev. E Page | 17

Sleek Analyzer Design Description Document
3. Set the sample holder at Brewster’s angle
a. Place a fused silica sample on the sample holder. Use a notecard to view the reflection. Slowly turn the adjustment knob and look for the extinction of the beam. Rotating the polarizer slightly as well can help view the extinction.
4. Set the forearm length and the laser pointer direction such that the detector is in the same
plane as the laser beam.
5. Find position and secure beam dump on top of box to extinguish the specular reflection. a. Tape a white paper with a target on it to the top of the box in the general vicinity
of the specularly reflected beam. Place a phone (or camera) below this target such that it has a line of sight to the target. Place a turned on flashlight into box, shining light near (but not necessarily directly onto) the target. (Alternatively, the flash of the camera might be able to be used, but this might washout the target). Turn the laser pointer on. Activate a timer on the phone/camera and press the button to take a picture. Close the box and wait for the picture to be taken. The location of the beam on the target is where the beam dump should be placed.
After Device Assembly (Order changed)
1. Ensure software compatibility with hardware a. Fix bugs as needed; for example, when sending the home command to the arm,
the command must be changed so that the arm is not homed through the table. The position of the arm should be checked before sending the home command.
2. Check enclosure for stray light a. Add baffles, apertures, etc to reduce stray light.
3. Measure the instrument signaturemeasure the scan with no sample in the instrument.
4. Assess detector power and change solid angle/light source if required (shorten arm, more
power)
5. Assess stepresolution of arm along arc required for sufficient correlation of sample part to training samples of known roughness. I.E. how many data points are required to accurately characterize a sample optic under test as standard grade or laser grade.
Rev. E Page | 18
Sleek Analyzer Design Description Document
a. Once the scatter distribution has been characterized by training samples, it is expected that a small subset of angles can be preselected to measure rather than requiring user input every time.
6. Compare data with previous year’s results a. Build statistics for correlation of scattered light to surface roughness
7. Measure scattered light at discrete points on sample to determine how many data points along the surface are required for an accurate surface characterization
8. Compare scattered light results of different sources
b. Possibly test a UV LED or flashlight. May use a pinhole to limit angular spread of LED light if required.
9. Determine needed changes for measuring fused silica versus borofloat c. Check the sensitivity of the device to the angle of the sample—is there a decrease
in performance if the angle of laser at the sample is a couple degrees away from the Brewster’s angle? Can both materials be set at the same angle?
Results
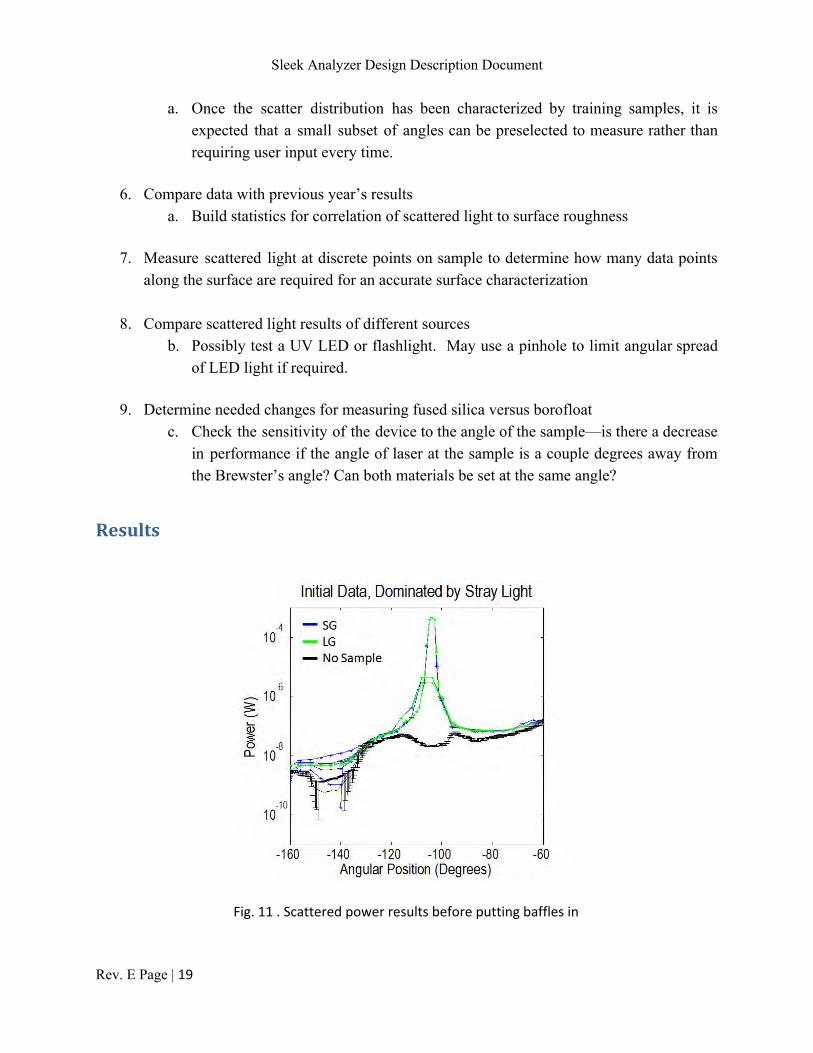
Fig. 11 . Scattered power results before putting baffles in
Rev. E Page | 19
Sleek Analyzer Design Description Document
This scattered power data was first measured before the aperture or baffles were added to the system, and before the inside of the box was spray painted with black matte paint.It was also found that during these measurements, the polarizer had been rotated 20° from the correct position, allowing both Ppolarization and Spolarization to pass to the sample. This created a much stronger specular reflection than desired. Additionally, this specular reflection was allowed to reflect off the top of the glossy black polycarbonate box, which may have contributed to stray light elsewhere during the measurement.
As can be seen, the laser grade and standard grade samples had no distinguishable differences in the amount of light they scattered. To assess the amount of the stray light present in the instrument, 7 scans were performed without a sample in place. These measurements, referred to as the instrument signature, were averaged, then plotted (in black in the plot). As can be seen, the power measured with the samples in place very closely follows the trend of the instrument signature. This prompted an investigation of stray light present in the box.
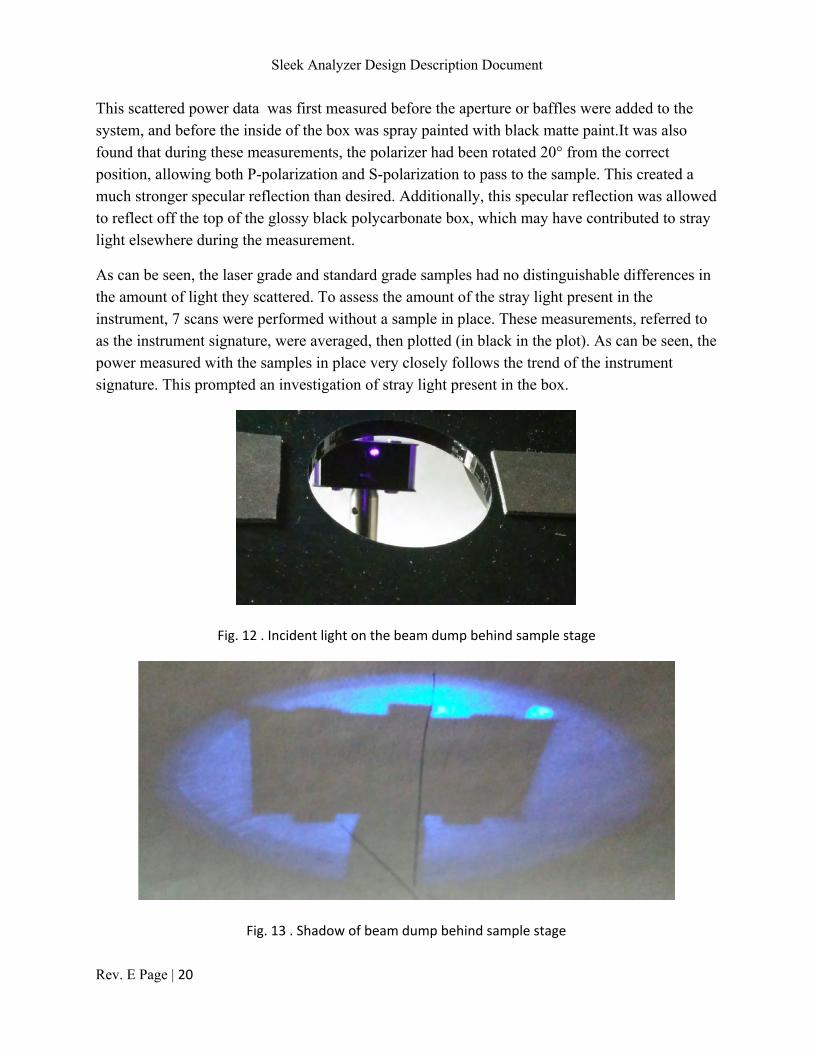
Fig. 12 . Incident light on the beam dump behind sample stage
Fig. 13 . Shadow of beam dump behind sample stage
Rev. E Page | 20

Sleek Analyzer Design Description Document
When investigating the stray light, we first checked that the beam dump was correctly placed in order to extinguish the transmitted beam. We next placed a white sheet of paper behind the beam dump in order to see if there was any light passing around the beam dump. As can be seen above, the laser beam had significantly scattered as it passed from the laser pointer through the half wave plate and polarizer. We also observed that the laser and the polarizing optics were sometimes in the field of view of the detector. In order to reduce the stray light scattering from these optics, we placed a box around the optics with an aperture to clip the scattered light. While these modifications reduced stray light significantly, it was still necessary to further control the stray light, with baffles on the detector around around the aperture by the polarizing optics, and by spray painting the inside of the light tight box with a black matte paint to reduce its glossiness.
Fig. 14 .Median filtered scattered power plot before putting baffles in
This is a plot of the 5 standard grade samples (blue) and 5 laser grade samples (green). The power at each angular position of the arm was measured 7 times and a dark measurement at this position was subtracted from the mean scattered power. The error bars are the standard error of the mean of the power at each position. With the exception of 1 standard grade sample, which had significantly more power than the rest, there was no measurable difference between the laser grade samples and the standard grade samples. This data was taken with a box around the optics,
Rev. E Page | 21

Sleek Analyzer Design Description Document
with a makeshift aperture in place, with a aluminum tube fixed to the detector, and with the second beam dump in place at the top of the box. The box had not yet been painted black matte.
After seeing this data, we are considering testing whether the laser pointer diminishes in brightness after its use in the first scan of a measurement session. Comparing this data to other data sets, the first sample measured has tended to have higher scattered power than the following samples.
Fig. 15 .Median filtered scattered power plot with moving averages 5 degs before putting baffles in
This shows the same data with a moving average over 5 degrees. As expected from the previous plot, this moving average still shows no difference between the grades of the samples.
Rev. E Page | 22

Sleek Analyzer Design Description Document
Fig. 16 .Power plot of instrument signature without sample in
This is a plot of the measured power with the laser on but with no sample under test. This is essentially a measurement of the stray light in the box. This measurement is referred to as the instrument signature, as it is approximately the background we expect to see in any measurement. As we can see, this is on the same order of magnitude that we saw in the scans with a sample. This means that the signal of the stray light is nearly as strong as the scattered signal itself. Shown below are the dark measurements from the instrument signature, provided for a comparison. They are around the range of 1050 picowatts.
Rev. E Page | 23

Sleek Analyzer Design Description Document
Fig. 17 .Dark measurements plot subtracted from instrument signature
A final data set was acquired after all the baffles and painted panels were in place. While the averaged data suggests that the device is capable of measuring a mean difference in scattered power between the standard and laser grade, the varying baseline of the scattered power seen in the raw data is too variable to allow the classification of individual samples.
Additionally, in the raw data, there are a couple data sets with anomalous trends. These samples were measured to have significantly higher power than the other scans and had especially higher power measured on the right shoulder compared to the expected values. These anomalous scattered power measurements are assumed to be the result of an as yet undetermined, inconsistent source of stray light. These trials removed before averaging. One potential cause could be that the cardboard box to which the aperture is mounted is not completely stable and may shift slightly, clipping and diffracting the edge of the laser beam.
Rev. E Page | 24

Sleek Analyzer Design Description Document
Fig. 18 Data collected in instrument’s final configuration. a) Raw data of SG and LG samples. b) Mean
scattered power for each grade, error: standard error of the mean, 9 samples.
The mean scattered power and standard error of the mean plotted in figure 18 suggests that with slight improvements in consistency and a reduction of stray light, the instrument may be able to measure a difference in the mean scattered power between the two different sample grades. (There are section of this curve with error bars which do not overlap, though they are still close). However, the consistency of the measurements must be improved before the mean scattered power of the two grades can be reliably separated. Additionally, the moving baseline of the measurement prevents the characterization of individual samples as standard or laser grade; an improvement in measurement stability and an increase in incident laser power may enable a characterization of individual samples.
We hesitate to report this data too confidently. There may potentially still be systematic errors which need to be verified. The standard grade samples were all measured before the laser grade samples; this presents the possibility that the laser may have slightly dropped in output as it heated up, so further investigation is warranted. Also, we have not determined the source of the wandering baseline, which could be due to laser power instability or small shifts in the locations of makeshift baffles.
Risk Assessment Stray light has serious implications for the accuracy of our measurements. While makeshift baffles and apertures have been placed, they are not ideal and are not completely stable. Better control of this stray light will improve the measurement.
Rev. E Page | 25
Sleek Analyzer Design Description Document
As with any scatterometer, output power of the laser will drastically affect measurements. While the laser can be run on batteries, the DC power supply yields more reliable and consistent measurements by better regulating the output power. A more stable laser rather than a consumer grade laser pointer may also help to output a more constant laser power. Additionally, the power of the laser must be strong enough for the difference in scattered power from the laser grade and standard grade optics to be above the noise of the system.
Without a properly controlled enclosure, ambient light can get into the device and wash out the signal, degrading the measurement. Other parts of the internal design can also scatter light within the device, thereby throwing off measurements. Due to the sensitivity of our measurements, a consistent alignment will be necessary in order to obtain good data. Any unexpected change in the alignment may have significant effects on the scatter profile. Our power source is not completely linearly polarized, which may affect the power scattering of the sample.
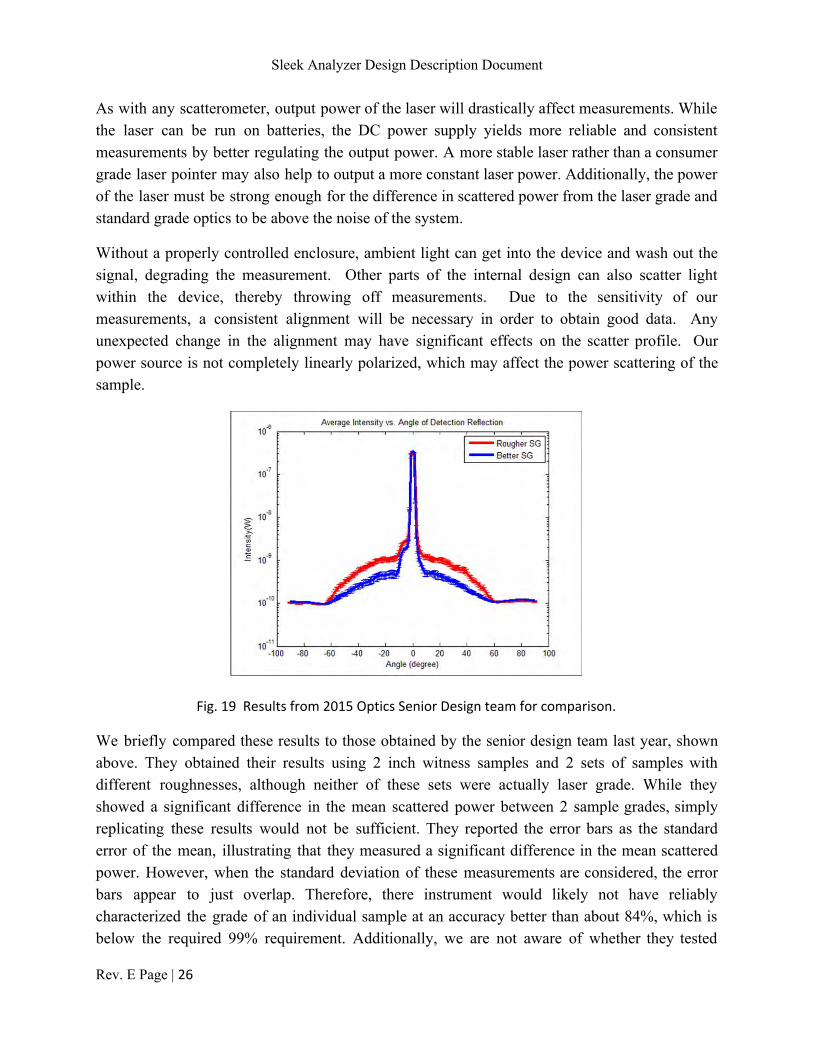
Fig. 19 Results from 2015 Optics Senior Design team for comparison.
We briefly compared these results to those obtained by the senior design team last year, shown above. They obtained their results using 2 inch witness samples and 2 sets of samples with different roughnesses, although neither of these sets were actually laser grade. While they showed a significant difference in the mean scattered power between 2 sample grades, simply replicating these results would not be sufficient. They reported the error bars as the standard error of the mean, illustrating that they measured a significant difference in the mean scattered power. However, when the standard deviation of these measurements are considered, the error bars appear to just overlap. Therefore, there instrument would likely not have reliably characterized the grade of an individual sample at an accuracy better than about 84%, which is below the required 99% requirement. Additionally, we are not aware of whether they tested
Rev. E Page | 26

Sleek Analyzer Design Description Document
whether the output power of their laser pointer was stable; as we believe they may have been running it on batteries, it is possible that it may have slightly dropped in power as they conducted their measurements. We discuss these results not to cast doubt on the results from the previous year, but merely observe that our ultimate goal was to not only build, design, and scale up their scatterometer, but also to significantly improve its performance. While we believe it is theoretically possible obtain these results, we did not have time to fully optimize the results ourselves.
Transition Plans We will deliver our instrument, including the physical device and the user software to our customer, Sydor Optics. We will also provide a user manual for the instrument as well as a guide for using and debugging the software, and recommendations for further development of the instrument. (See appendices)
References: [1] Krywonos, Andrey, James E. Harvey, and Narak Choi. "Linear Systems Formulation of Scattering Theory for Rough Surfaces with Arbitrary Incident and Scattering Angles."Journal of the Optical Society of America A J. Opt. Soc. Am. A28.6 (2011): 1121. Web. [2] Stover, John C. Optical Scattering: Measurement and Analysis. New York: McGrawHill, 1990. Print. [3] Vorburger, T. V., Marx, E. & Lettieri, T. R. Regimes of surface roughness measurable with light scattering. Applied Optics 32, 3401–3408 (1993). [4] Guenther, K. H., Wierer, P. G. & Bennett, J. M. Surface roughness measurements of lowscatter
mirrors and roughness standards. Applied optics 23, 3820–3836 (1984).
Rev. E Page | 27

Sleek Analyzer Design Description Document
Appendix A: Initial Photon Budget Analysis
Initial Photon Budget Analysis Using the theory outlined below, an initial estimate is made of the expected power of the scattered light. We have, however, concluded that this method is likely not accurate due to the assumptions it makes.
The TIS stands for total integrated scatter, and represents the ratio of scattered light to all reflected light. The total reflected light in this equation is assumed to be nearly equivalent to the Fresnel reflectance. This is accurate in most cases, but because the laser beam in this instrument is incident at Brewster’s angle, the Fresnel reflection is expected to be extremely low. This theory also does not inform us on the distribution of the scattered power but yields the total integrated power; to this end, we guessed a cosine squared distribution, but this assumption would be worth revisiting. [3], [4]
To calculate the total integrated scatter from a surface, we used the equation below, where Rq is the rms roughness of the surface, R0 is the theoretical reflection on the surface, and θ is the incident angle of the light on the surface. The Fresnel reflection for R0 was calculated at normal incidence to allow an approximation of the scatter because our polarized beam of light would have no theoretical reflection. (This indicates that this equation may not be a good approximation for our setup, so we will continue research on this area). This analysis will be amended once we begin to take data.
"Optical Scattering and Surface Roughness." Eckhardt Optics LLC. Web. 10 Dec. 2015.
<http://eckop.com/opticalscatter2/opticalscatteringversussurfaceroughness/>. Value units n_air 1 n_material 1.4696
Brewster’s angle (angle of incidence) 55.8 degrees wavelength 4.05E07 m
area of detector 0.0001 m2 length of detector arm 0.21 m
Fresnel Reflectance (normal) 0.036 RMS Roughness 1.00E09 m
Rev. E Page | 28
Sleek Analyzer Design Description Document
Theoretical Total Integrated Scatter 1.10E05 %
Solid Angle of detector (normal orientation) 0.0023 Str Input Power 0.005 W
Table.A.1. Photon Budget Table
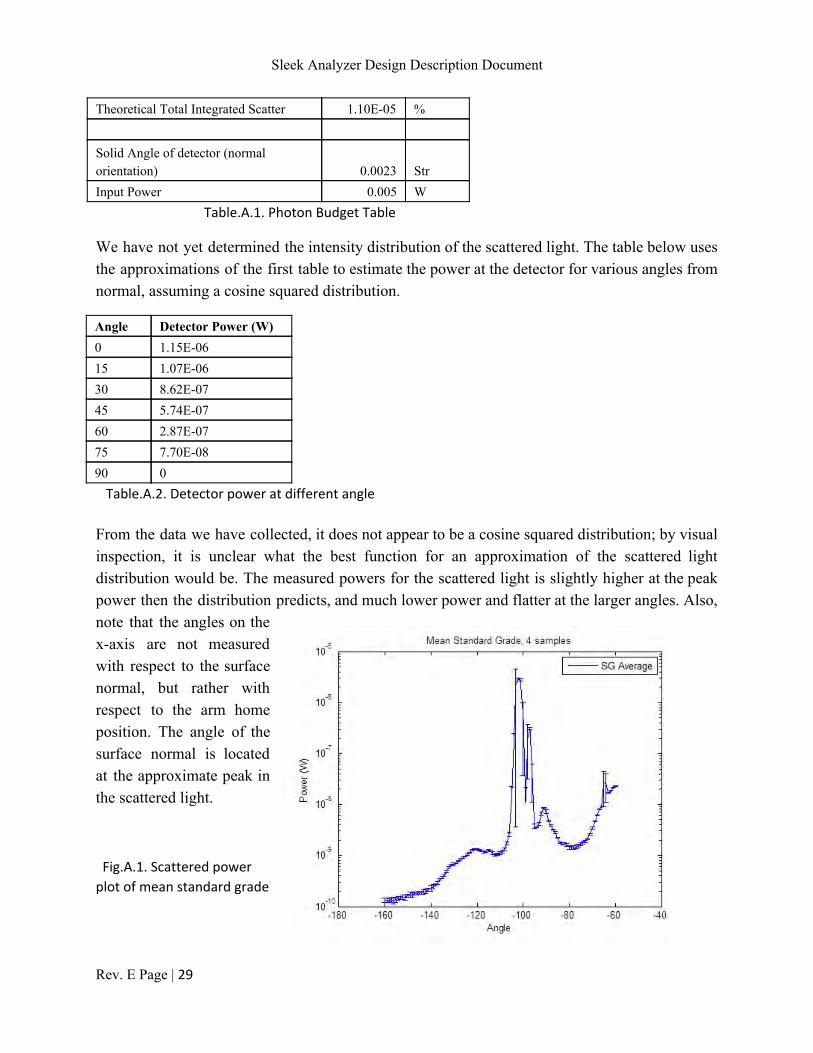
We have not yet determined the intensity distribution of the scattered light. The table below uses the approximations of the first table to estimate the power at the detector for various angles from normal, assuming a cosine squared distribution.
Angle Detector Power (W) 0 1.15E06 15 1.07E06 30 8.62E07 45 5.74E07 60 2.87E07 75 7.70E08 90 0 Table.A.2. Detector power at different angle
From the data we have collected, it does not appear to be a cosine squared distribution; by visual inspection, it is unclear what the best function for an approximation of the scattered light distribution would be. The measured powers for the scattered light is slightly higher at the peak power then the distribution predicts, and much lower power and flatter at the larger angles. Also, note that the angles on the xaxis are not measured with respect to the surface normal, but rather with respect to the arm home position. The angle of the surface normal is located at the approximate peak in the scattered light.
Fig.A.1. Scattered power
plot of mean standard grade
Rev. E Page | 29

Sleek Analyzer Design Description Document
Appendix B: User Guide A few steps for using scatterometer to run tests on optical flats sample:
1. Open the top lip of light tight box carefully.
2. Put sample on the sample mount and adjust the position of sample in order to line up the
target region on the sample with the center of the hole on the sample mount.
Rev. E Page | 30
Sleek Analyzer Design Description Document
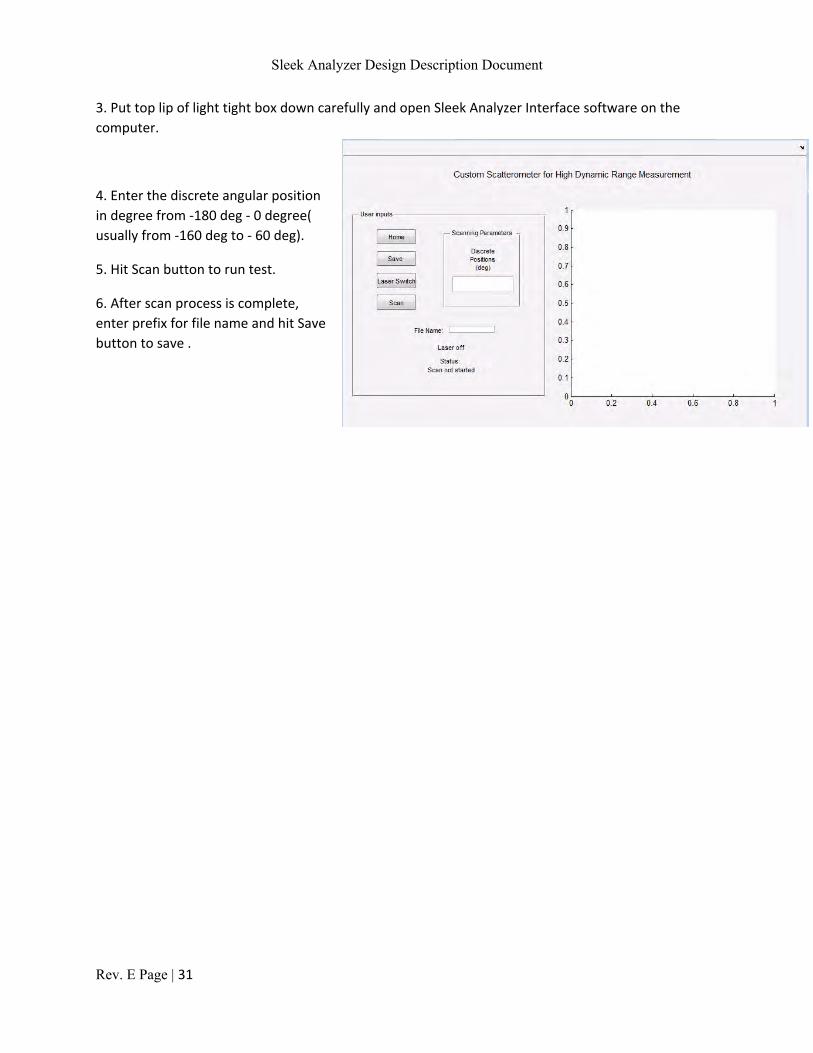
3. Put top lip of light tight box down carefully and open Sleek Analyzer Interface software on the
computer.
4. Enter the discrete angular position
in degree from 180 deg 0 degree(
usually from 160 deg to 60 deg).
5. Hit Scan button to run test.
6. After scan process is complete,
enter prefix for file name and hit Save
button to save .
Rev. E Page | 31
Sleek Analyzer Design Description Document
Appendix C: Recommendations for Future Improvement
We advise further optimization and testing, including the implementation of:
A spatial filter following the polarizer to better extinguish stray light scattered from the
instrument itself with more stable and consistent alignment
A more permanent and stable baffle around the laser and polarization optics.
A higher power laser with a more stable emission power. The stability of the laser
pointer is suspect but has not been specifically tested.
If light is suspected of scattering off the beam dump, it may be advantageous to drill a
hole for the laser to exit the box before it strikes the beam dump.
Reduce the reflections of stray light from the sample holder by spray painting it black, or
by some other equivalent treatment.
A second beam dumpwas taped to the top of the box to extinguish any specular reflection. This
mount should be mademore permanent. Additionally, due tomakeshift mounting of this beam
dump, it is possible that it has shifted slightly, so the correct placement of this beam dump
should be verified. Additionally, this beam dump may need to be relocated if the sample stage
changes angle. See the testing protocol for positioning the beam dump.
If the above recommendations do not work, another more involved change could be to move
the motor so that it scans in a plane normal to the laser beam rather than in the same plane.
This would match the setup that the the senior design team used last year. Theoretically, this
would not make a difference in the measured power because Rayleigh scatter should be
isotropic. However, scanning in this planemay reduce stray light. It would be important to scan
the detector through a plane such that the specular reflection was incident on the detector.
Additional samples may be required to generate an appropriate statistical characterization of
the scattered power from each quality grade.
Theoretically, a shorter wavelength laser would also increase the scatter off the sample.
However, this may be cost prohibitive. If the laser wavelength is changed, the software will
need to be changed to set the power meter to this wavelength (line 260261)
Once the instrument is optimized such that the grade of an individual sample can be
determined, the GUI should bemodified to automatically scan over only theminimum required
angular range, rather than requiring a user input range.
Rev. E Page | 32

Sleek Analyzer Design Description Document
Appendix D: Guide to Developing and Debugging Matlab GUI
Required files are in a folder on the Newport flashdrive entitled “Other Software”. A readme.txt
file describes the specific contents of this folder.
In order to enable debugging of individual devices, it is strongly advised to install the drivers for
the Zaber motor controller and for the Newport power meter.
Zaber Console
http://www.zaber.com/wiki/Software/Zaber_Console
Newport Power Meter
Drivers are on a Newport flashdrive. Ensure that the correct version of the
drivers are installed. (If theMatlab version is 32bit running on a 64bit machine,
you will need to install the “32 on 64 bit” version)
If the Matlab version being used to run the software is 64bit, line 242 in
SleekAnalyzerInterface.m should be changed as shown below:
32 bit:
loadlibrary('C:\Program Files (x86)\Newport\Newport USB Driver\Bin\usbdll.dll',headerFile);
64 bit:
loadlibrary('C:\Program Files\Newport\Newport USB Driver\Bin\usbdll.dll',headerFile);
Before attempting to run the Matlab software, confirm that the computer has a C/C++ compiler
for mex files. Run following the command in Matlab, and follow the prompts to select a default
compiler. This command should only need to be run once.
mex setup;
Rev. E Page | 33

Sleek Analyzer Design Description Document
To run the Matlab Sleek Analyzer Interface, run SleekAnalyzerInterface.m. The following files
are required within the same folder:
SleekAnalyzerInterface.fig
Figure used for GUI
CommandApp_USBRelay.exe
Executable which turns USB relay on and off
usb_relay_device.dll
USB relay driver library used by the executable file
PM_USB.h
Header file required to import Newport .dll driver functions
Common Issues:
The USB relay is not recognized by the computer.
Ensure it is connected to a USB 2.0 port rather than a USB 3.0 port. This is
expected to be an issue of the amount of power required by the device
Try plugging the relay into a USB hub rather than directly into the computer. We
are not sure why this workaround works, but it may be because the device
somehow deviates from the USB power specifications and the hub better
regulates the power.
(Reference: http://vusb.wikidot.com/project:driverlessusbrelayshidinterface) Unable to connect to the motor.
This is usually an issue of which serial communication port is being used. The
code was recently amended to query the user for the correct COM port if the
default COM port fails to open. (This part of the code has not been rigorously
tested due to time and other constraints). This can be caused by the existence of
multiple COM ports of different types. The correct type of COM port should be
“USB Serial Port COM#”. The COM ports available on the computer can be found
in the Device Manager.
If other bugs are found, theMatlab code is reasonably well commented to allow a third party to
understand what is written. (There are some commented sections of the code and potentially
some functions that are not used; these may just be legacy items from previous versions of the
GUI that have not been deleted).
Rev. E Page | 34

Sleek Analyzer Design Description Document
Creation of a Standalone Executable:
Unfortunately, we were not able to successfully create a standalone version of this code. This
was attempted by using the “Matlab Application Compiler”. Some of the issues are outlined
below:
When the program is installed, any files written (i.e. the data files) must be written
somewhere that does not require administrator privileges to write the files.
To use loadlibrary() in a compiledMatlab file, the function requires a prototype function
in place of a header file.
To generate a prototype file, use the following syntax:
loadlibrary(library.dll, header.h, ‘mfilename’, PrototypeFilename)
When generating this file, Matlab threw 2 pages of errors while generating the
prototype file. The resulting prototype file did not appear to be functional. This
may be an issue with the header file. Newport does not support Matlab, so this
header file might not be official. (I had to search file archives for it so it may have
been written by a third party).
Other Notes:
To change the acceleration and speed of the motor, see line 398408
To change the allowable angles for the arm to scan, modify limits in line 588
Rev. E Page | 35