design, characterization and impurity profiling of
TRANSCRIPT
www.wjpps.com Vol 6, Issue 4, 2017.
1829
Rajkumar et al. World Journal of Pharmacy and Pharmaceutical Sciences
DESIGN, CHARACTERIZATION AND IMPURITY PROFILING OF
CELECOXIB BY RP-HPLC
Rajkumar Prava*1, Ganapathy Seru
1, Sabbella Radha Krishna
2 and Surendra Babu
Lagu1
1A.U College of Pharmaceutical Sciences, Andhra University, Visakhapatnam, India.
2Quagen Pharma, Tnanam Village, Parawada, Visakhapatnam, Andhra Pradesh, India.
ABSTRACT
Celecoxib is one of the most widely used drug around the world. There
are various pharmacological activities reported for the wonder moiety.
Celecoxib is a non-steroidal anti-inflammatory drug (NSAID) used in
the treatment of osteoarthritis, rheumatoid arthritis, juvenile
rheumatoid arthritis, acute pain and primary dysmenorrhoea. The most
common side effects upon usage of Celecoxib include indigestion,
diarrhoea and abdominal pain. Celecoxib produces its therapeutic
effects by inhibiting cyclooxygenase (COX), an enzyme which is
responsible for the production of prostaglandins. Celecoxib, in addition
has other pharmacological activities that are entirely independent of its
COX-2 inhibitory activity. This selectivity allows Celecoxib and other COX-2 inhibitors to
reduce inflammation (and pain) while minimizing gastrointestinal adverse drug reactions (e.g.
stomach ulcers) that are common with non-selective NSAIDs. The present study is based on
the synthesis and impurity profiling. A new isocratic RP-HPLC method was developed for
the separation and determination of process related impurities in Celecoxib and validated as
per ICH guidelines. The method was found to be simple, sensitive, precise, robust and
accurate. Therefore, this method can be used for routine testing as well as stability analysis of
Celecoxib drug substance. All statistical results (Mean, % RSD and % recovery) were within
the acceptance criteria.
KEYWORDS: Celecoxib, pharmacological activity, chromatographic techniques, impurity
profile.
WORLD JOURNAL OF PHARMACY AND PHARMACEUTICAL SCIENCES
SJIF Impact Factor 6.647
Volume 6, Issue 4, 1829-1851 Research Article ISSN 2278 – 4357
*Corresponding Author
Dr. Rajkumar Prava
A.U College of
Pharmaceutical Sciences,
Andhra University,
Visakhapatnam, India.
Article Received on
13 Feb. 2017,
Revised on 07 March 2017, Accepted on 27 March 2017
DOI: 10.20959/wjpps20174-9001
www.wjpps.com Vol 6, Issue 4, 2017.
1830
Rajkumar et al. World Journal of Pharmacy and Pharmaceutical Sciences
INTRODUCTION
Celecoxib is a non-steroidal anti-inflammatory drug (NSAID) used in the treatment of
osteoarthritis, rheumatoid arthritis, juvenile rheumatoid arthritis, acute pain and primary
dysmenorrhoea. It acts as an anti-inflammatory, analgesic and antipyretic drug and also
reduces the number of adenomatous colorectal polyps in FAP (Familial Adenomatous
Polyposis). The most common side effects upon usage of Celecoxib include indigestion,
diarrhoea and abdominal pain.[1-4]
Celecoxib produces its therapeutic effects by inhibiting
cyclooxygenase (COX), an enzyme which is responsible for the production of prostaglandins.
There are two iso forms of COX.COX-1 and COX-2 which differ in substrate and inhibitor
selectivity. Celecoxib is a selective inhibitor of COX-2 produced through the mediation of
inflammatory ligands such as cytokines.[5]
In contrast the traditional NSAID’s inhibit both
isoforms of cyclooxygenase and inhibit platelet aggregation.[6]
This selectivity allows
Celecoxib and other COX-2 inhibitors to reduce inflammation (and pain) while minimizing
gastrointestinal adverse drug reactions (e.g. stomach ulcers) that are common with non-
selective NSAIDs.[7]
Celecoxib is approximately 10-20 times more selective for COX-2
inhibition over COX-1 where it binds with its polar sulfonamide side chain to a hydrophilic
side pocket region close to the active COX-2 binding site.[8]
Due to its specificity for the
COX-2 inhibition, it has the potential to cause less gastropathy and risk of GI bleeding.[9-11]
Both the isoforms of cyclooxygenases are involved in the production of prostaglandins
whereas in addition COX-1 synthesizes thromboxane. Hence, inhibition of COX-2 leads to
diminished prostaglandin synthesis without affecting thromboxane and thus has no effect on
platelet aggregation or blood clotting.[12]
Celecoxib, in addition has other pharmacological
activities that are entirely independent of its COX-2 inhibitory activity.[13]
Procurement of API
Pfizer markets Celecoxib under the brand name Celebrex. Celecoxib is not currently
available as a generic in the United States, because the intellectual property is still controlled
by Pfizer. However, in other countries, including India and the Philippines, it is legally
available as under the brand names Cobix and Celcoxx.[12]
Literature survey
Literature survey revealed that only a few analytical methods for determination of Celecoxib
in pharmaceuticals as well as biological fluids such as blood, urine, serum and plasma were
reported.
www.wjpps.com Vol 6, Issue 4, 2017.
1831
Rajkumar et al. World Journal of Pharmacy and Pharmaceutical Sciences
Rose et al. have reported a normal phase high-performance liquid chromatography method
for the determination of Celecoxib in human plasma by UV detection.[14]
Srinivasu et al.
reported a validated LC method for the quantitative determination of Celecoxib in
pharmaceutical dosage forms and purity evaluation in bulk drugs. In this method, separation
was achieved by Novapak C18 column (300x3.9 mm) with 4 μm(particle size) and mobile
phase consisting potassium dihydrogen phosphate buffer and acetonitrile with pH 4.8, the
detection being made at 252 nm.[15]
Srinivasu et al. developed a method for the determination
of Celecoxib in pharmaceutical dosage forms by MEKC.[16]
Saha et al. have developed a
liquid chromatographic method for the determination of Celecoxib in pharmaceutical
formulations using UV spectrophotometry.[17]
Schonberger et al. reported a HPLC method for
the determination of Celecoxib in human serum with fluorescence detection.[18]
Chow et al.
developed a HPLC method for the determination of Celecoxib in human plasma.[19]
Zhang et
al. have used HPLC method for the determination of Celecoxib in human plasma and breast
milk.[20]
Zarghi et al. have described a simple and rapid high-performance liquid
chromatographic method for determination of Celecoxib in plasma using UV detection.[21]
So far there is no method reported for the determination of process-related substances of
Celecoxib in the literature. The present study is aimed at developing a reversed phase HPLC
method to determine the process-related impurities originating from the starting materials and
intermediates of Celecoxib in bulk drugs. Forced degradation studies of CXB were carried
out under thermal, photo, acidic, basic and peroxide conditions. A comprehensive study was
undertaken to characterize process impurities by FT-IR, MS and 1H NMR spectroscopy. The
study protocols and details are given in following pages.
MATERIALS AND METHODS
Instrumentation
High performance liquid chromatography
An integrated HPLC system with computer based chromatography software (Empower) was
used. The Waters alliance system with 2695 quaternary low pressure gradient system auto
sampler, column thermostat and photodiode array detector was used for this experiment.
Chemicals and reagents
Celecoxib working standard and its process related impurities were synthesized at Pharmazell
R&D Centre, Visakhapatnam (India) and obtained as gift samples. HPLC grade acetonitrile
was obtained from Merck. Analytical grade dipotassium hydrogen phosphate and
www.wjpps.com Vol 6, Issue 4, 2017.
1832
Rajkumar et al. World Journal of Pharmacy and Pharmaceutical Sciences
orthophosphoric acid were used. High purity water was prepared by using Milli-Q Elix and
then using Milli-Q academic purification system (Milli-pore). 4-Methyl acetophenone
(impurity-A) was purchased from SL Drugs & Pharmaceuticals.
Preparation of Buffer
1.74 g of dipotassium hydrogen phosphate was dissolved in 1000 ml of water and pH was
adjusted to 3.5 ± 0.05 with orthophosphoric acid. Then the solution was filtered through 0.45
µ filter paper and degassed in ultrasonic bath.
Preparation of mobile phase and diluent
A mixture of the buffer and acetonitrile in the ratio 45:55% v/v was prepared and degassed.
Mobile phase was used as diluent.
Preparation of Standard solution
Standard solution was prepared by weighing accurately 50 mg of Celecoxib and transferring
into 50 ml volumetric flask containing 30 ml of diluent. The contents of flask were sonicated
for 15 min. to dissolve the drug completely and the volume was made up to 50 ml with the
diluent (1 mg/ml).
Preparation of test solution
About 50 mg of sample was weighed accurately and transferred into 50ml volumetric flask,
30 ml of diluent was added, sonicated for 15 min. to dissolve the drug completely and the
volume was made up to 50 ml with diluent.
Preparation of impurity mixture
About 37.5 mg of Celecoxib and its process related impurities (impurity A, B, C and D) were
weighed accurately and transferred into 100 ml volumetric flask, 60 ml of diluent was added
to dissolve the compounds and the volume was made up to 100 ml with diluent. 5 ml of this
solution was made up to 50 ml with diluent to get a concentration of 37.5 µg/ml. This
impurity stock solution was adequately diluted to study accuracy, precision, linearity, limit of
detection and limit of quantitation.
Method Development and Optimization of Celecoxib by RP-HPLC
In order to develop a suitable and robust RP-HPLC method for the determination of
Celecoxib and its process related impurities, an attempt was made using a C18 column and
mobile phase composed of phosphate buffer and methanol in the ratio 60:40% v/v. In this
www.wjpps.com Vol 6, Issue 4, 2017.
1833
Rajkumar et al. World Journal of Pharmacy and Pharmaceutical Sciences
mobile phase, peak symmetry is not satisfactory, peaks are splitting and separation was also
not good. Therefore organic modifier concentration was changed to 40-50% but no
improvement was observed. Many experiments were conducted using different columns,
different buffers and different organic modifier concentrations. Even then no improvement
was observed and hence, methanol was replaced with acetonitrile. Some improvement was
observed but the impurity peaks were merging with Celecoxib peak. So further trails were
carried out by varying the pH and concentration of buffer and acetonitrile. Eventually a
mobile phase composed of phosphate buffer (pH 3.5) and acetonitrile in the ratio 45:55% v/v
gave sharp peaks with minimum tailing and good resolution for both the drug and impurities.
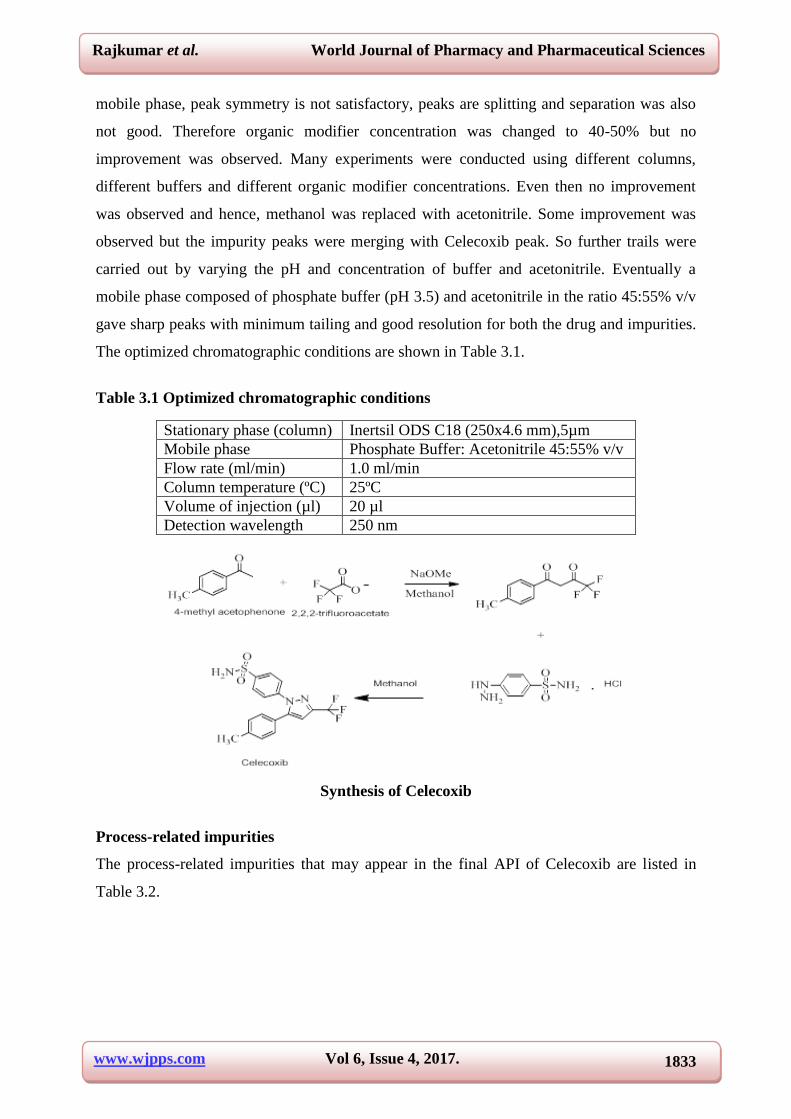
The optimized chromatographic conditions are shown in Table 3.1.
Table 3.1 Optimized chromatographic conditions
Synthesis of Celecoxib
Process-related impurities
The process-related impurities that may appear in the final API of Celecoxib are listed in
Table 3.2.
Stationary phase (column) Inertsil ODS C18 (250x4.6 mm),5µm
Mobile phase Phosphate Buffer: Acetonitrile 45:55% v/v
Flow rate (ml/min) 1.0 ml/min
Column temperature (ºC) 25ºC
Volume of injection (µl) 20 µl
Detection wavelength 250 nm
www.wjpps.com Vol 6, Issue 4, 2017.
1834
Rajkumar et al. World Journal of Pharmacy and Pharmaceutical Sciences
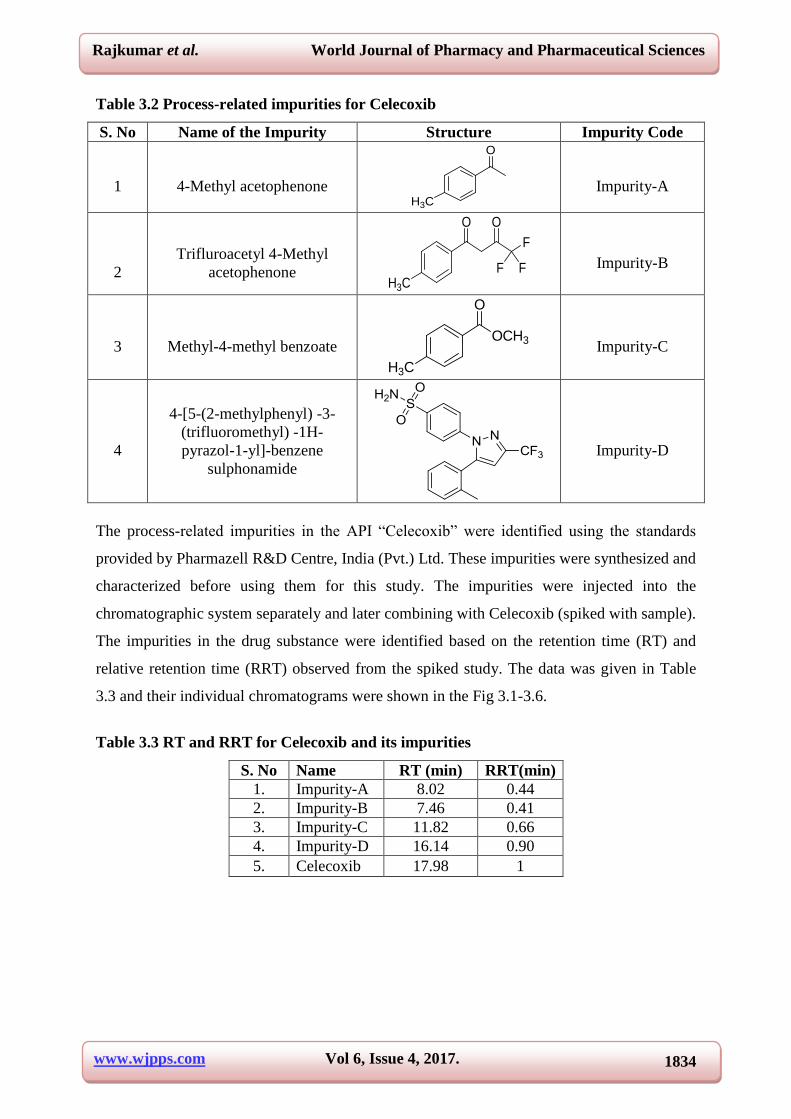
Table 3.2 Process-related impurities for Celecoxib
S. No Name of the Impurity Structure Impurity Code
1
4-Methyl acetophenone
O
H3C
Impurity-A
2
Trifluroacetyl 4-Methyl
acetophenone
O
H3C
O
F F
F
Impurity-B
3
Methyl-4-methyl benzoate OCH3
O
H3C
Impurity-C
4
4-[5-(2-methylphenyl) -3-
(trifluoromethyl) -1H-
pyrazol-1-yl]-benzene
sulphonamide
Impurity-D
The process-related impurities in the API “Celecoxib” were identified using the standards
provided by Pharmazell R&D Centre, India (Pvt.) Ltd. These impurities were synthesized and
characterized before using them for this study. The impurities were injected into the
chromatographic system separately and later combining with Celecoxib (spiked with sample).
The impurities in the drug substance were identified based on the retention time (RT) and
relative retention time (RRT) observed from the spiked study. The data was given in Table
3.3 and their individual chromatograms were shown in the Fig 3.1-3.6.
Table 3.3 RT and RRT for Celecoxib and its impurities
S. No Name RT (min)
RRT(min)
1. Impurity-A 8.02 0.44
2. Impurity-B 7.46 0.41
3. Impurity-C 11.82 0.66
4. Impurity-D 16.14 0.90
5. Celecoxib 17.98 1
www.wjpps.com Vol 6, Issue 4, 2017.
1835
Rajkumar et al. World Journal of Pharmacy and Pharmaceutical Sciences
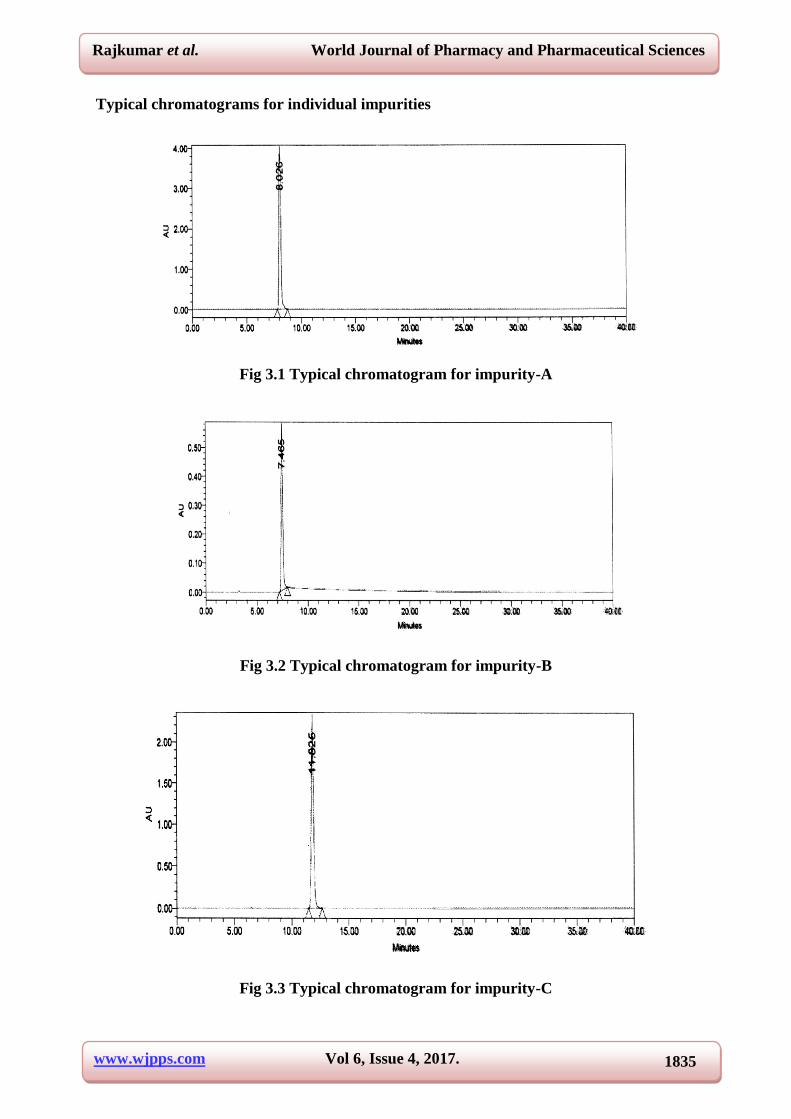
Typical chromatograms for individual impurities
Fig 3.1 Typical chromatogram for impurity-A
Fig 3.2 Typical chromatogram for impurity-B
Fig 3.3 Typical chromatogram for impurity-C
www.wjpps.com Vol 6, Issue 4, 2017.
1836
Rajkumar et al. World Journal of Pharmacy and Pharmaceutical Sciences
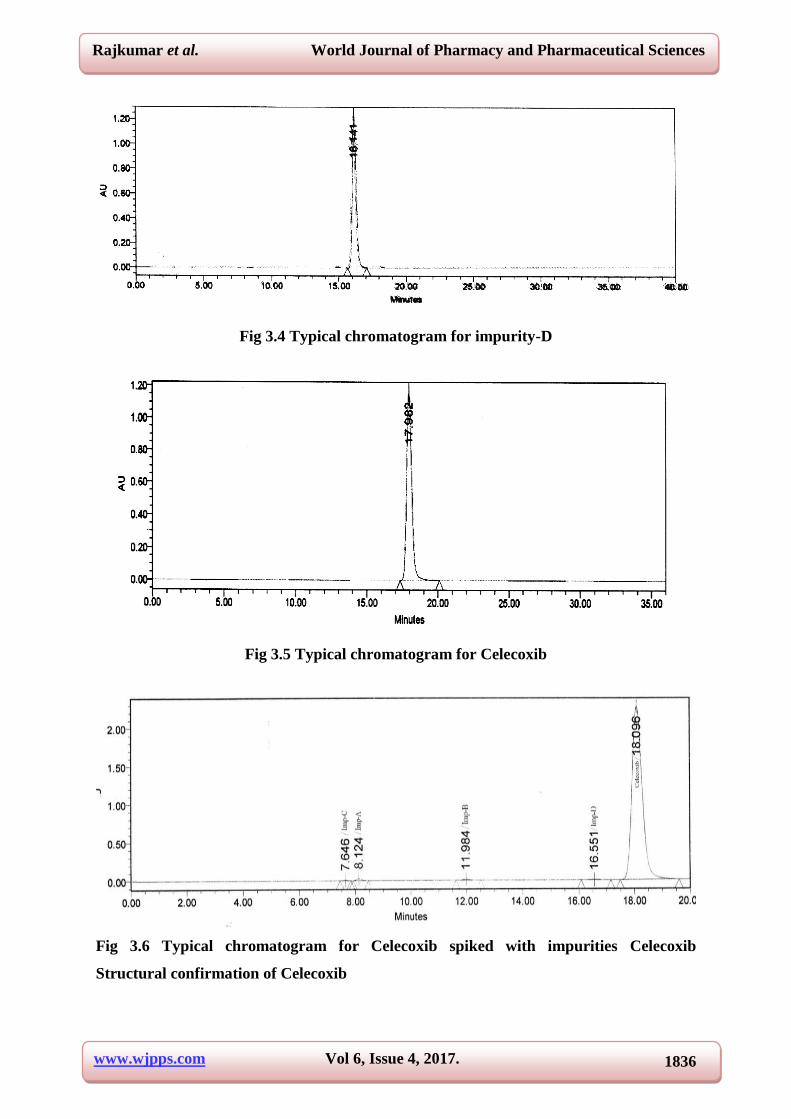
Fig 3.4 Typical chromatogram for impurity-D
Fig 3.5 Typical chromatogram for Celecoxib
Fig 3.6 Typical chromatogram for Celecoxib spiked with impurities Celecoxib
Structural confirmation of Celecoxib
www.wjpps.com Vol 6, Issue 4, 2017.
1837
Rajkumar et al. World Journal of Pharmacy and Pharmaceutical Sciences
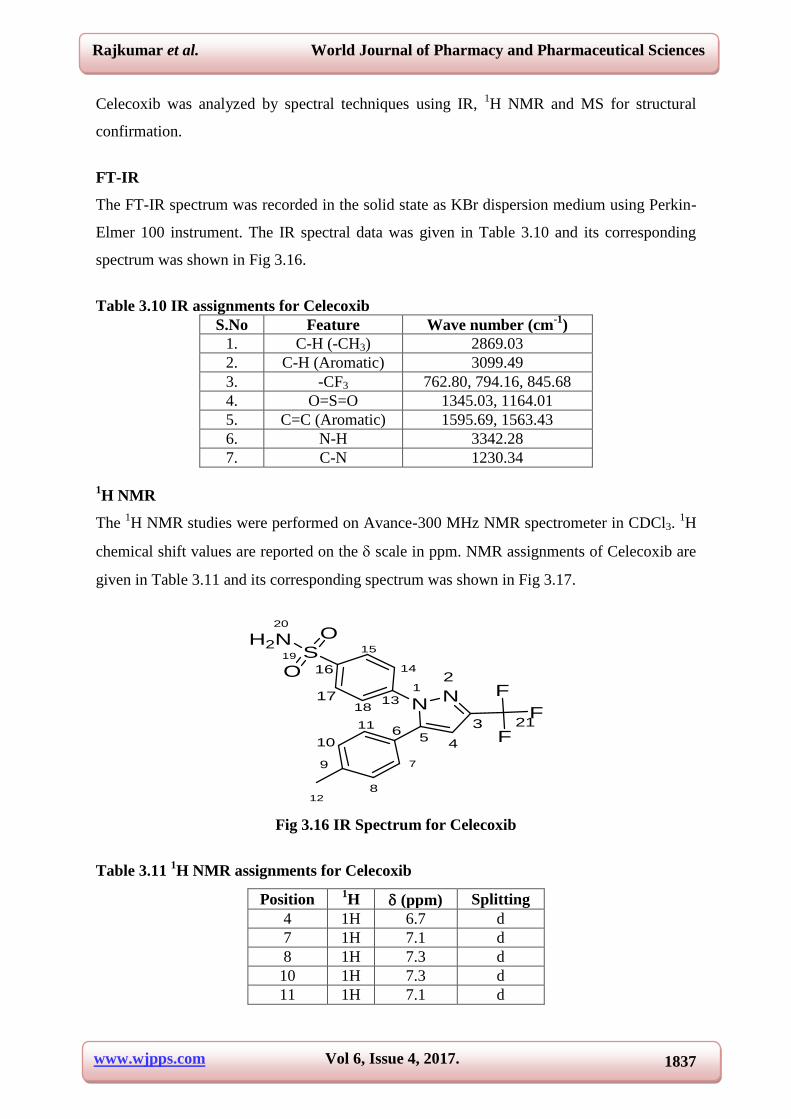
Celecoxib was analyzed by spectral techniques using IR, 1H NMR and MS for structural
confirmation.
FT-IR
The FT-IR spectrum was recorded in the solid state as KBr dispersion medium using Perkin-
Elmer 100 instrument. The IR spectral data was given in Table 3.10 and its corresponding
spectrum was shown in Fig 3.16.
Table 3.10 IR assignments for Celecoxib
S.No Feature Wave number (cm-1
)
1. C-H (-CH3) 2869.03
2. C-H (Aromatic) 3099.49
3. -CF3 762.80, 794.16, 845.68
4. O=S=O 1345.03, 1164.01
5. C=C (Aromatic) 1595.69, 1563.43
6. N-H 3342.28
7. C-N 1230.34
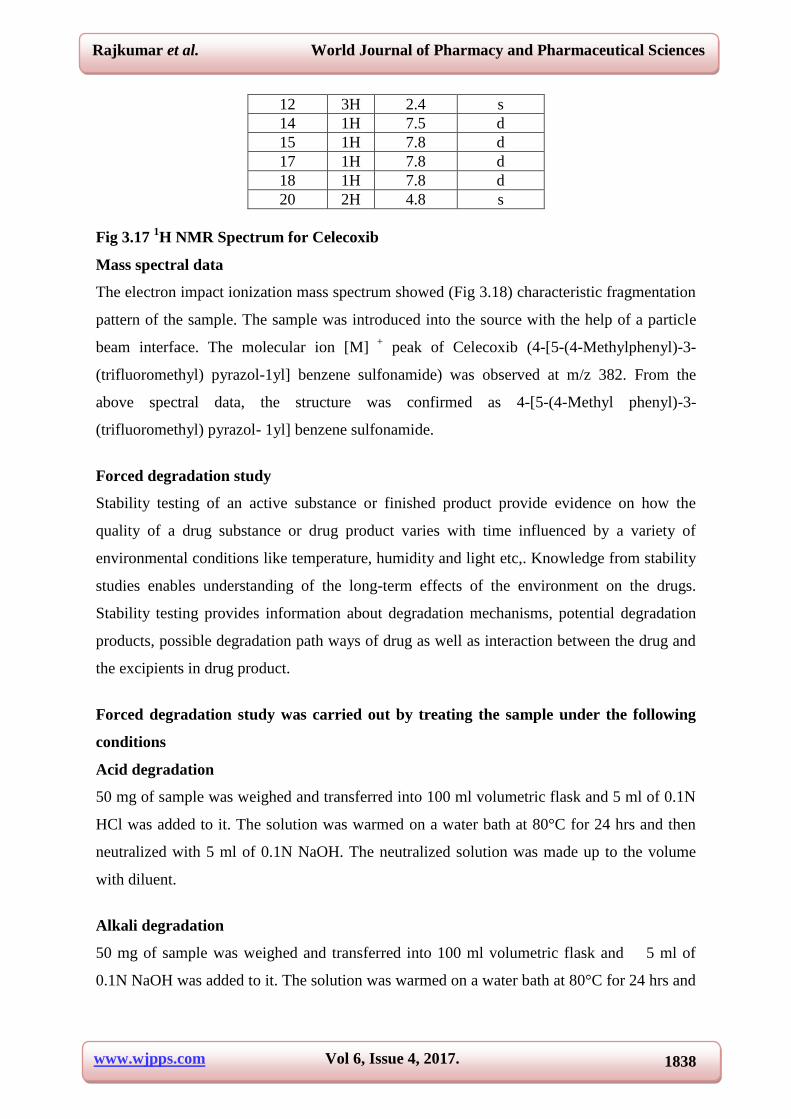
1H NMR
The 1H NMR studies were performed on Avance-300 MHz NMR spectrometer in CDCl3.
1H
chemical shift values are reported on the scale in ppm. NMR assignments of Celecoxib are
given in Table 3.11 and its corresponding spectrum was shown in Fig 3.17.
O
S
NN
F
F
F
H2N O
12
3
45
6
7
8
9
10
11
12
14
15
16
1718
19
20
21
13
Fig 3.16 IR Spectrum for Celecoxib
Table 3.11 1H NMR assignments for Celecoxib
Position 1H (ppm) Splitting
4 1H 6.7 d
7 1H 7.1 d
8 1H 7.3 d
10 1H 7.3 d
11 1H 7.1 d
www.wjpps.com Vol 6, Issue 4, 2017.
1838
Rajkumar et al. World Journal of Pharmacy and Pharmaceutical Sciences
12 3H 2.4 s
14 1H 7.5 d
15 1H 7.8 d
17 1H 7.8 d
18 1H 7.8 d
20 2H 4.8 s
Fig 3.17 1H NMR Spectrum for Celecoxib
Mass spectral data
The electron impact ionization mass spectrum showed (Fig 3.18) characteristic fragmentation
pattern of the sample. The sample was introduced into the source with the help of a particle
beam interface. The molecular ion [M] +
peak of Celecoxib (4-[5-(4-Methylphenyl)-3-
(trifluoromethyl) pyrazol-1yl] benzene sulfonamide) was observed at m/z 382. From the
above spectral data, the structure was confirmed as 4-[5-(4-Methyl phenyl)-3-
(trifluoromethyl) pyrazol- 1yl] benzene sulfonamide.
Forced degradation study
Stability testing of an active substance or finished product provide evidence on how the
quality of a drug substance or drug product varies with time influenced by a variety of
environmental conditions like temperature, humidity and light etc,. Knowledge from stability
studies enables understanding of the long-term effects of the environment on the drugs.
Stability testing provides information about degradation mechanisms, potential degradation
products, possible degradation path ways of drug as well as interaction between the drug and
the excipients in drug product.
Forced degradation study was carried out by treating the sample under the following
conditions
Acid degradation
50 mg of sample was weighed and transferred into 100 ml volumetric flask and 5 ml of 0.1N
HCl was added to it. The solution was warmed on a water bath at 80°C for 24 hrs and then
neutralized with 5 ml of 0.1N NaOH. The neutralized solution was made up to the volume
with diluent.
Alkali degradation
50 mg of sample was weighed and transferred into 100 ml volumetric flask and 5 ml of
0.1N NaOH was added to it. The solution was warmed on a water bath at 80°C for 24 hrs and
www.wjpps.com Vol 6, Issue 4, 2017.
1839
Rajkumar et al. World Journal of Pharmacy and Pharmaceutical Sciences
then neutralized with 5 ml of 0.1N HCl. The neutralized solution was made up to the volume
with diluent.
Thermal degradation
200 mg of the sample was taken in a watch glass and kept in an oven at 105°C temperature
for 24 hrs. From that sample 50 mg was accurately weighed and transferred into 100 ml
volumetric flask, dissolved and the was volume adjusted with diluent.
Humidity degradation
200 mg of the sample was left at room temperature for 24 hrs. From that sample 50 mg was
accurately weighed and transferred into 100 ml volumetric flask, dissolved and the volume
adjusted with diluent.
Photolytic degradation
200 mg of the sample was exposed to UV light under 254 nm for 24 hrs by using photo
stability chamber. From that sample 50 mg was accurately weighed and transferred into 100
ml volumetric flask, dissolved and the volume adjusted with diluent.
Oxidative degradation
50 mg of the sample was weighed and transferred into a 100 ml volumetric flask and 5 ml of
5% potassium permanganate solution was added to it. The solution was warmed on water
bath at 80°C for 3 hrs. Then the above mixture was kept aside for few minutes, and the
volume was made up with diluent.
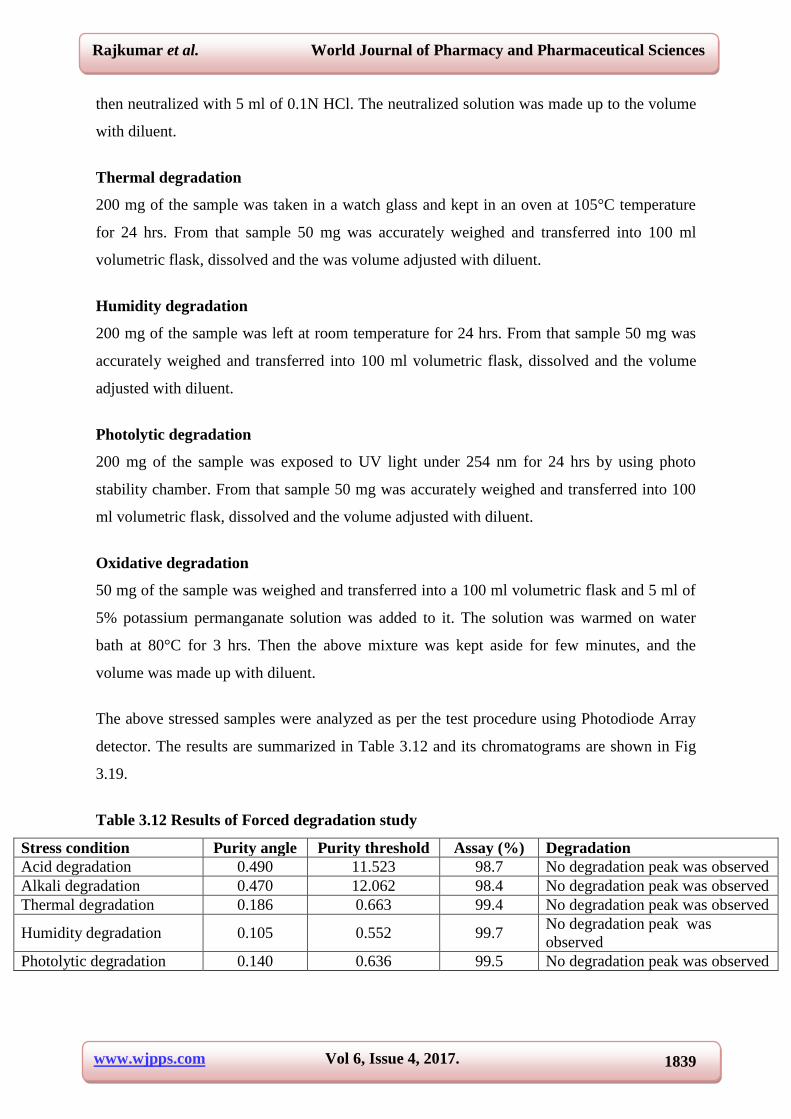
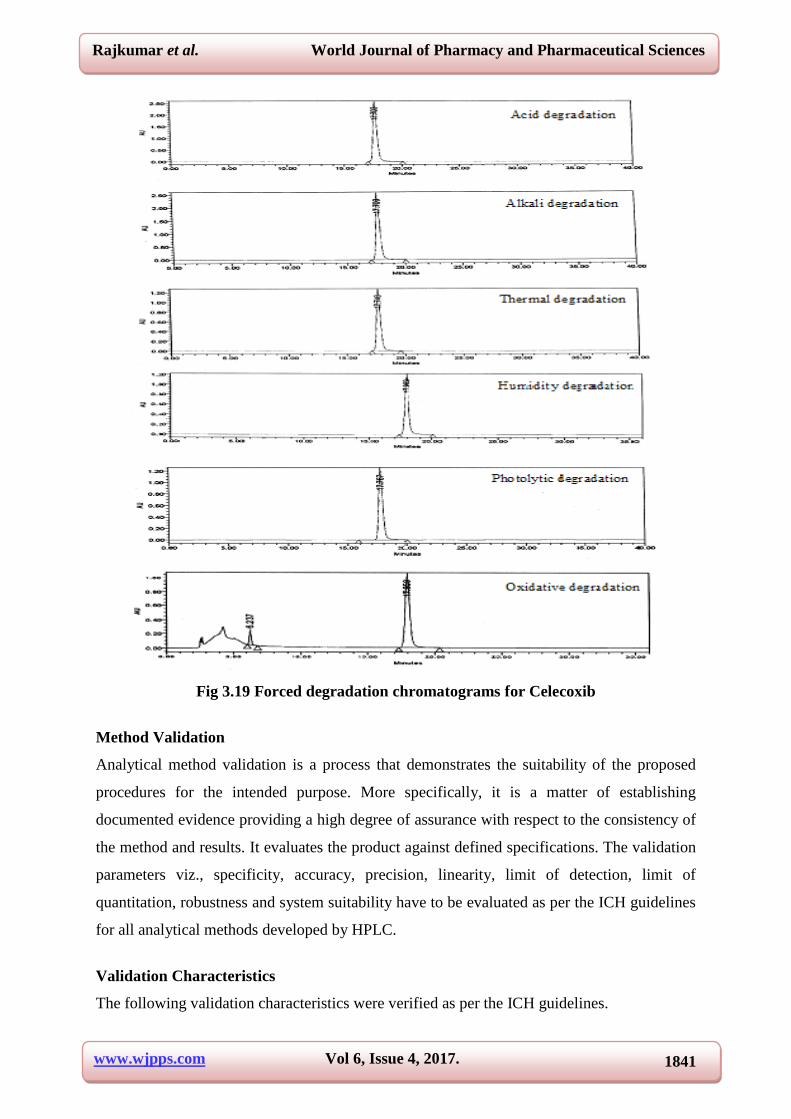
The above stressed samples were analyzed as per the test procedure using Photodiode Array
detector. The results are summarized in Table 3.12 and its chromatograms are shown in Fig
3.19.
Table 3.12 Results of Forced degradation study
Stress condition Purity angle Purity threshold Assay (%) Degradation
Acid degradation 0.490 11.523 98.7 No degradation peak was observed
Alkali degradation 0.470 12.062 98.4 No degradation peak was observed
Thermal degradation 0.186 0.663 99.4 No degradation peak was observed
Humidity degradation 0.105 0.552 99.7 No degradation peak was
observed
Photolytic degradation 0.140 0.636 99.5 No degradation peak was observed
www.wjpps.com Vol 6, Issue 4, 2017.
1840
Rajkumar et al. World Journal of Pharmacy and Pharmaceutical Sciences
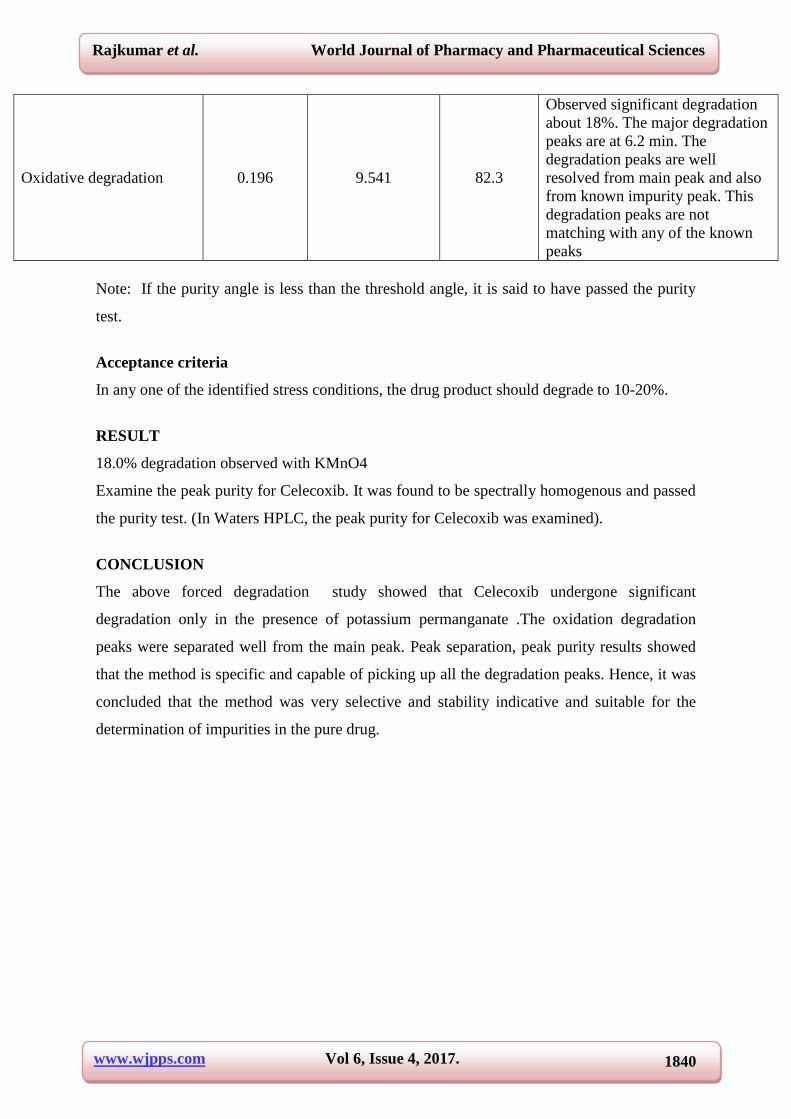
Oxidative degradation 0.196 9.541 82.3
Observed significant degradation
about 18%. The major degradation
peaks are at 6.2 min. The
degradation peaks are well
resolved from main peak and also
from known impurity peak. This
degradation peaks are not
matching with any of the known
peaks
Note: If the purity angle is less than the threshold angle, it is said to have passed the purity
test.
Acceptance criteria
In any one of the identified stress conditions, the drug product should degrade to 10-20%.
RESULT
18.0% degradation observed with KMnO4
Examine the peak purity for Celecoxib. It was found to be spectrally homogenous and passed
the purity test. (In Waters HPLC, the peak purity for Celecoxib was examined).
CONCLUSION
The above forced degradation study showed that Celecoxib undergone significant
degradation only in the presence of potassium permanganate .The oxidation degradation
peaks were separated well from the main peak. Peak separation, peak purity results showed
that the method is specific and capable of picking up all the degradation peaks. Hence, it was
concluded that the method was very selective and stability indicative and suitable for the
determination of impurities in the pure drug.
www.wjpps.com Vol 6, Issue 4, 2017.
1841
Rajkumar et al. World Journal of Pharmacy and Pharmaceutical Sciences
Fig 3.19 Forced degradation chromatograms for Celecoxib
Method Validation
Analytical method validation is a process that demonstrates the suitability of the proposed
procedures for the intended purpose. More specifically, it is a matter of establishing
documented evidence providing a high degree of assurance with respect to the consistency of
the method and results. It evaluates the product against defined specifications. The validation
parameters viz., specificity, accuracy, precision, linearity, limit of detection, limit of
quantitation, robustness and system suitability have to be evaluated as per the ICH guidelines
for all analytical methods developed by HPLC.
Validation Characteristics
The following validation characteristics were verified as per the ICH guidelines.
www.wjpps.com Vol 6, Issue 4, 2017.
1842
Rajkumar et al. World Journal of Pharmacy and Pharmaceutical Sciences
System suitability
Specificity
Linearity
Accuracy
Precision
LOD & LOQ
Robustness
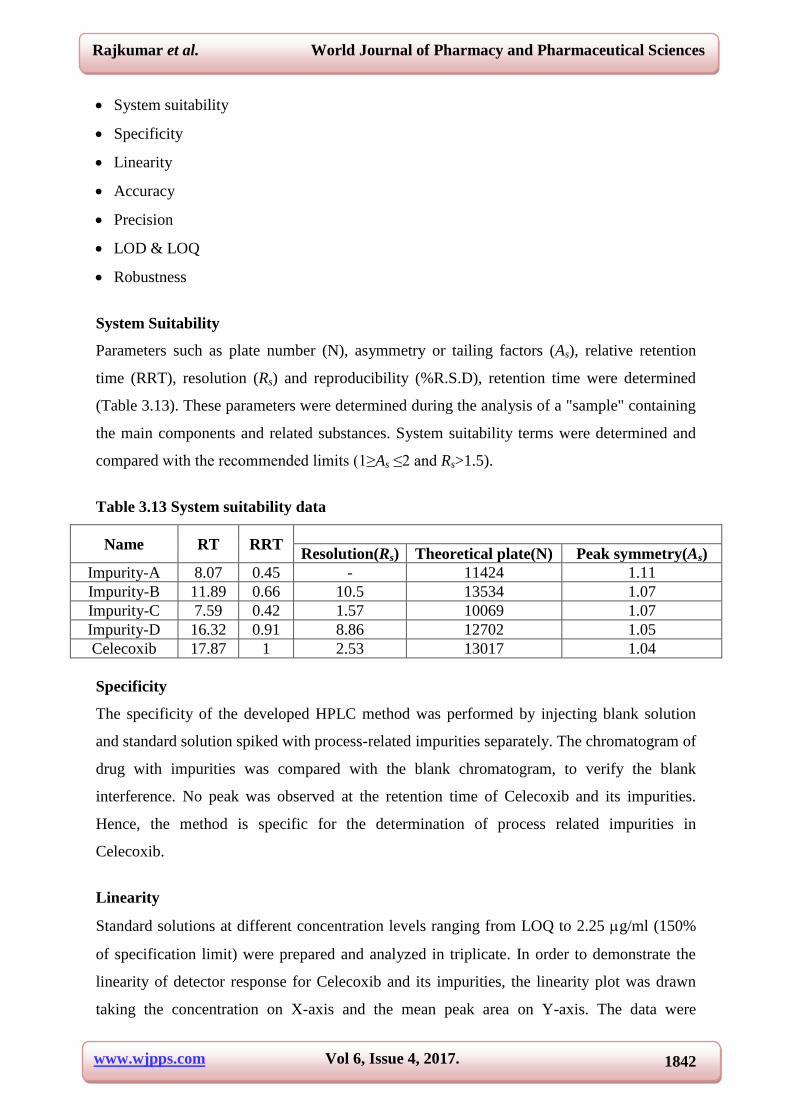
System Suitability
Parameters such as plate number (N), asymmetry or tailing factors (As), relative retention
time (RRT), resolution (Rs) and reproducibility (%R.S.D), retention time were determined
(Table 3.13). These parameters were determined during the analysis of a "sample" containing
the main components and related substances. System suitability terms were determined and
compared with the recommended limits (1≥As ≤2 and Rs>1.5).
Table 3.13 System suitability data
Name RT RRT
Resolution(Rs) Theoretical plate(N) Peak symmetry(As)
Impurity-A 8.07 0.45 - 11424 1.11
Impurity-B 11.89 0.66 10.5 13534 1.07
Impurity-C 7.59 0.42 1.57 10069 1.07
Impurity-D 16.32 0.91 8.86 12702 1.05
Celecoxib 17.87 1 2.53 13017 1.04
Specificity
The specificity of the developed HPLC method was performed by injecting blank solution
and standard solution spiked with process-related impurities separately. The chromatogram of
drug with impurities was compared with the blank chromatogram, to verify the blank
interference. No peak was observed at the retention time of Celecoxib and its impurities.
Hence, the method is specific for the determination of process related impurities in
Celecoxib.
Linearity
Standard solutions at different concentration levels ranging from LOQ to 2.25 g/ml (150%
of specification limit) were prepared and analyzed in triplicate. In order to demonstrate the
linearity of detector response for Celecoxib and its impurities, the linearity plot was drawn
taking the concentration on X-axis and the mean peak area on Y-axis. The data were
www.wjpps.com Vol 6, Issue 4, 2017.
1843
Rajkumar et al. World Journal of Pharmacy and Pharmaceutical Sciences
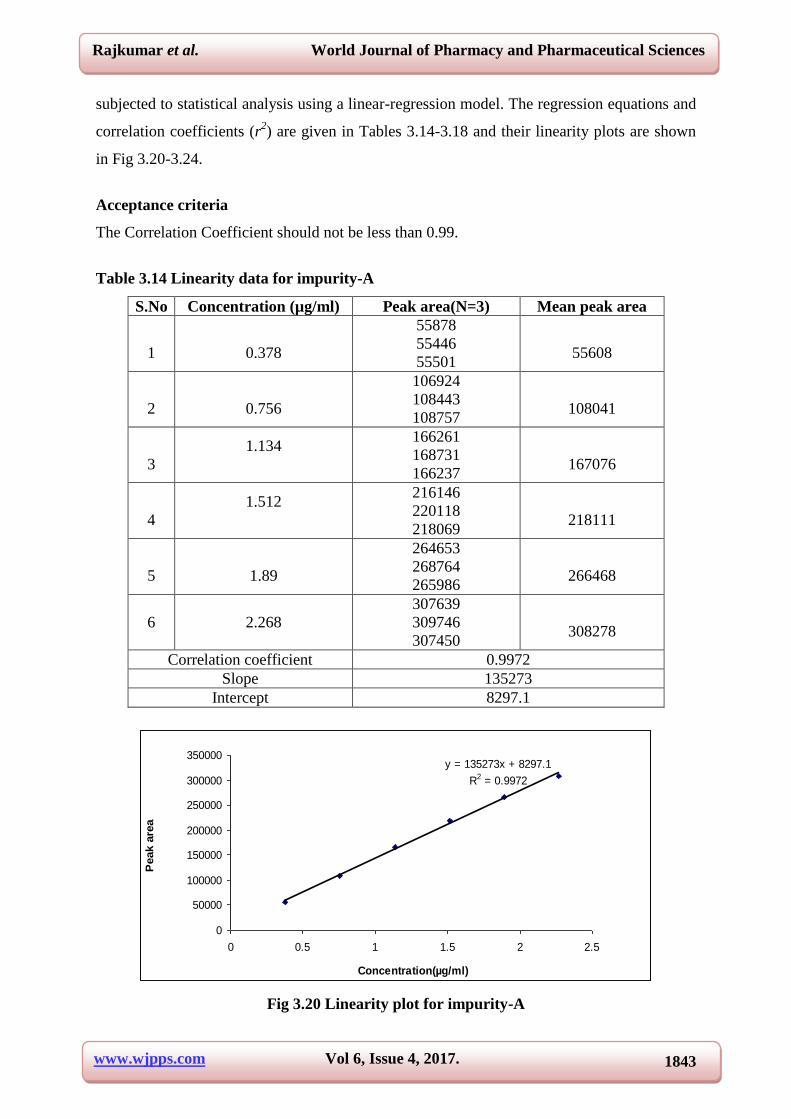
subjected to statistical analysis using a linear-regression model. The regression equations and
correlation coefficients (r2) are given in Tables 3.14-3.18 and their linearity plots are shown
in Fig 3.20-3.24.
Acceptance criteria
The Correlation Coefficient should not be less than 0.99.
Table 3.14 Linearity data for impurity-A
S.No Concentration (µg/ml) Peak area(N=3) Mean peak area
1
0.378
55878
55446
55501
55608
2
0.756
106924
108443
108757
108041
3
1.134
166261
168731
166237
167076
4
1.512
216146
220118
218069
218111
5
1.89
264653
268764
265986
266468
6 2.268
307639
309746
307450
308278
Correlation coefficient 0.9972
Slope 135273
Intercept 8297.1
y = 135273x + 8297.1
R2 = 0.9972
0
50000
100000
150000
200000
250000
300000
350000
0 0.5 1 1.5 2 2.5
Concentration(µg/ml)
Peak a
rea
Fig 3.20 Linearity plot for impurity-A
www.wjpps.com Vol 6, Issue 4, 2017.
1844
Rajkumar et al. World Journal of Pharmacy and Pharmaceutical Sciences
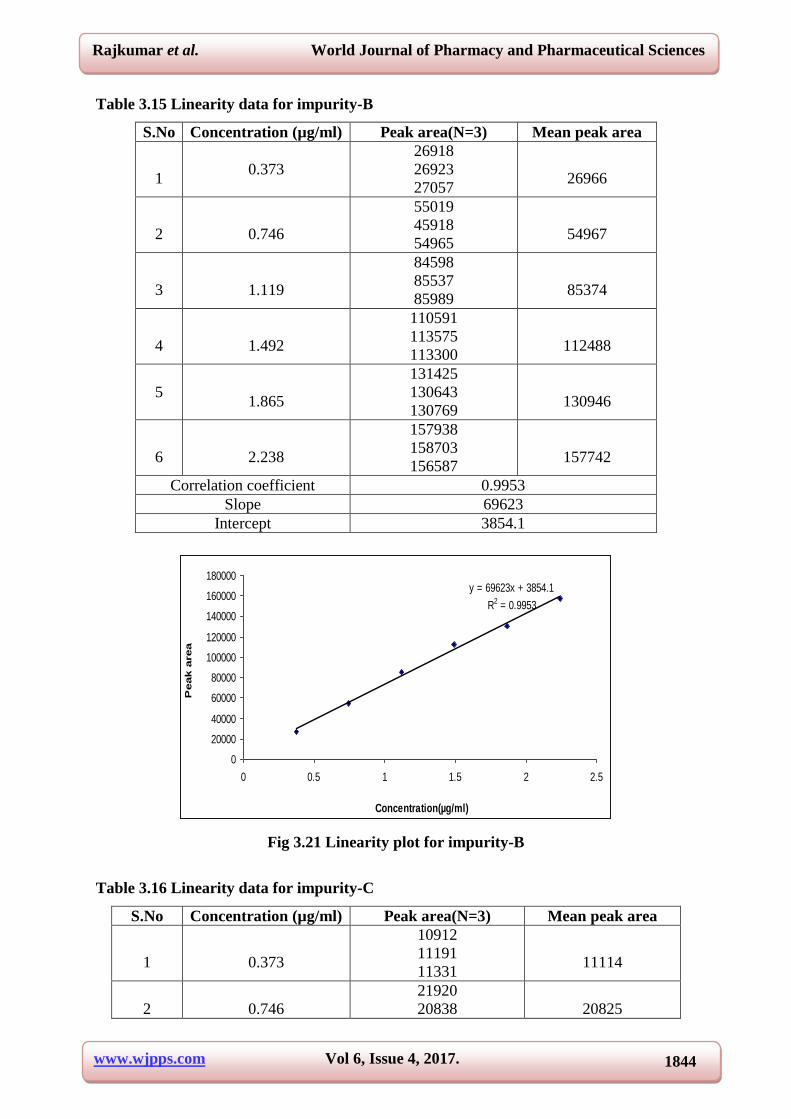
Table 3.15 Linearity data for impurity-B
S.No Concentration (µg/ml) Peak area(N=3) Mean peak area
1
0.373
26918
26923
27057
26966
2
0.746
55019
45918
54965
54967
3
1.119
84598
85537
85989
85374
4
1.492
110591
113575
113300
112488
5
1.865
131425
130643
130769
130946
6
2.238
157938
158703
156587
157742
Correlation coefficient 0.9953
Slope 69623
Intercept 3854.1
y = 69623x + 3854.1
R2 = 0.9953
0
20000
40000
60000
80000
100000
120000
140000
160000
180000
0 0.5 1 1.5 2 2.5
Concentration(µg/ml)
Peak a
rea
Fig 3.21 Linearity plot for impurity-B
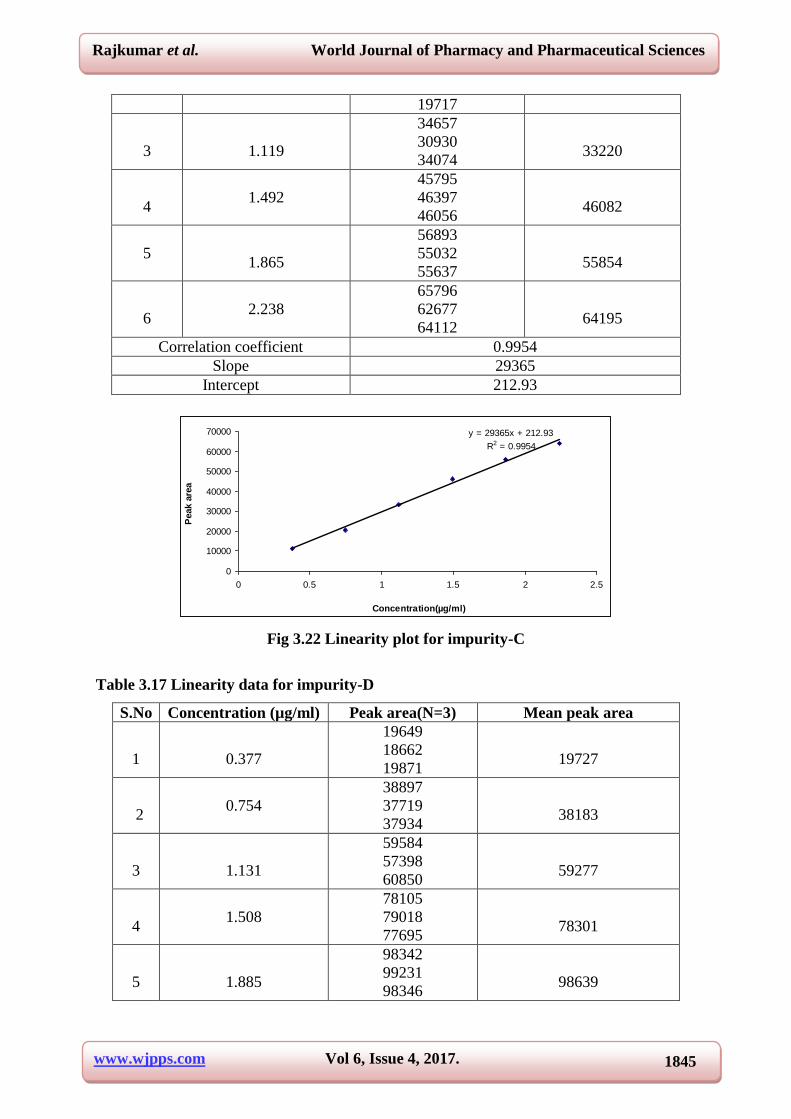
Table 3.16 Linearity data for impurity-C
S.No Concentration (µg/ml) Peak area(N=3) Mean peak area
1
0.373
10912
11191
11331
11114
2
0.746
21920
20838
20825
www.wjpps.com Vol 6, Issue 4, 2017.
1845
Rajkumar et al. World Journal of Pharmacy and Pharmaceutical Sciences
19717
3
1.119
34657
30930
34074
33220
4
1.492
45795
46397
46056
46082
5
1.865
56893
55032
55637
55854
6
2.238
65796
62677
64112
64195
Correlation coefficient 0.9954
Slope 29365
Intercept 212.93
y = 29365x + 212.93
R2 = 0.9954
0
10000
20000
30000
40000
50000
60000
70000
0 0.5 1 1.5 2 2.5
Concentration(µg/ml)
Peak a
rea
Fig 3.22 Linearity plot for impurity-C
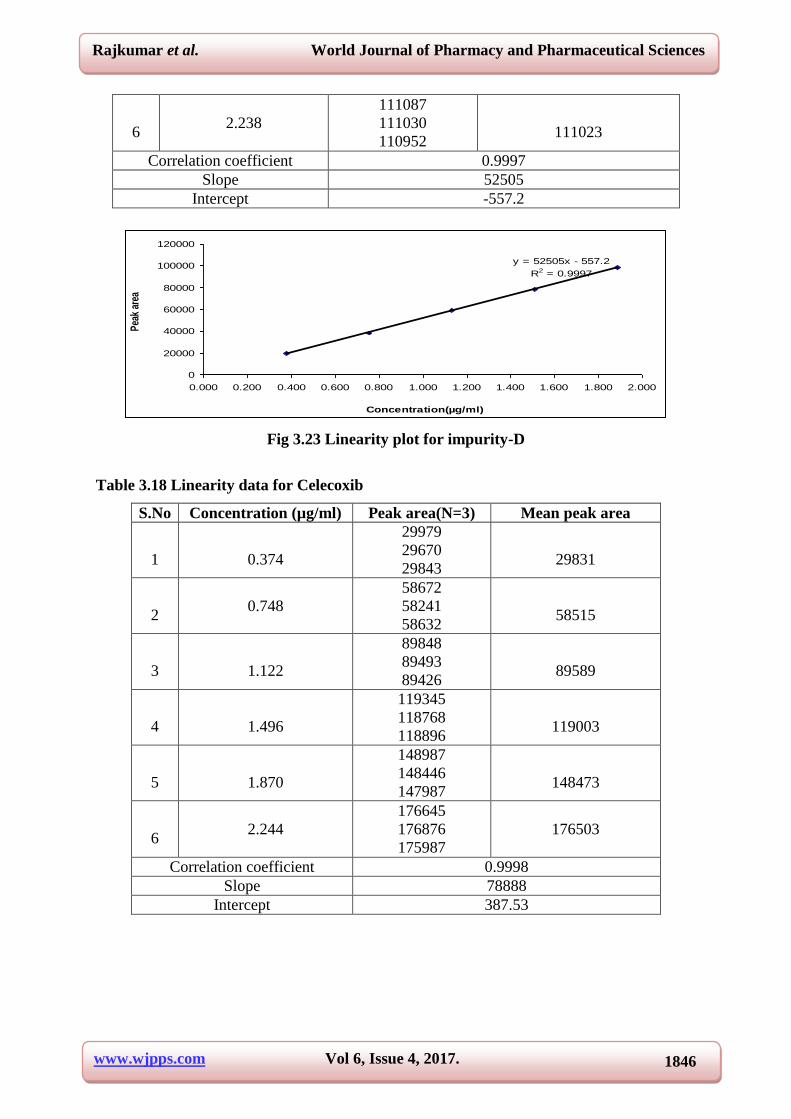
Table 3.17 Linearity data for impurity-D
S.No Concentration (µg/ml) Peak area(N=3) Mean peak area
1
0.377
19649
18662
19871
19727
2
0.754
38897
37719
37934
38183
3
1.131
59584
57398
60850
59277
4
1.508
78105
79018
77695
78301
5
1.885
98342
99231
98346
98639
www.wjpps.com Vol 6, Issue 4, 2017.
1846
Rajkumar et al. World Journal of Pharmacy and Pharmaceutical Sciences
6
2.238
111087
111030
110952
111023
Correlation coefficient 0.9997
Slope 52505
Intercept -557.2
y = 52505x - 557.2
R2 = 0.9997
0
20000
40000
60000
80000
100000
120000
0.000 0.200 0.400 0.600 0.800 1.000 1.200 1.400 1.600 1.800 2.000
Concentration(µg/ml)
Pea
k ar
ea
Fig 3.23 Linearity plot for impurity-D
Table 3.18 Linearity data for Celecoxib
S.No Concentration (µg/ml) Peak area(N=3) Mean peak area
1
0.374
29979
29670
29843
29831
2
0.748
58672
58241
58632
58515
3
1.122
89848
89493
89426
89589
4
1.496
119345
118768
118896
119003
5
1.870
148987
148446
147987
148473
6
2.244
176645
176876
175987
176503
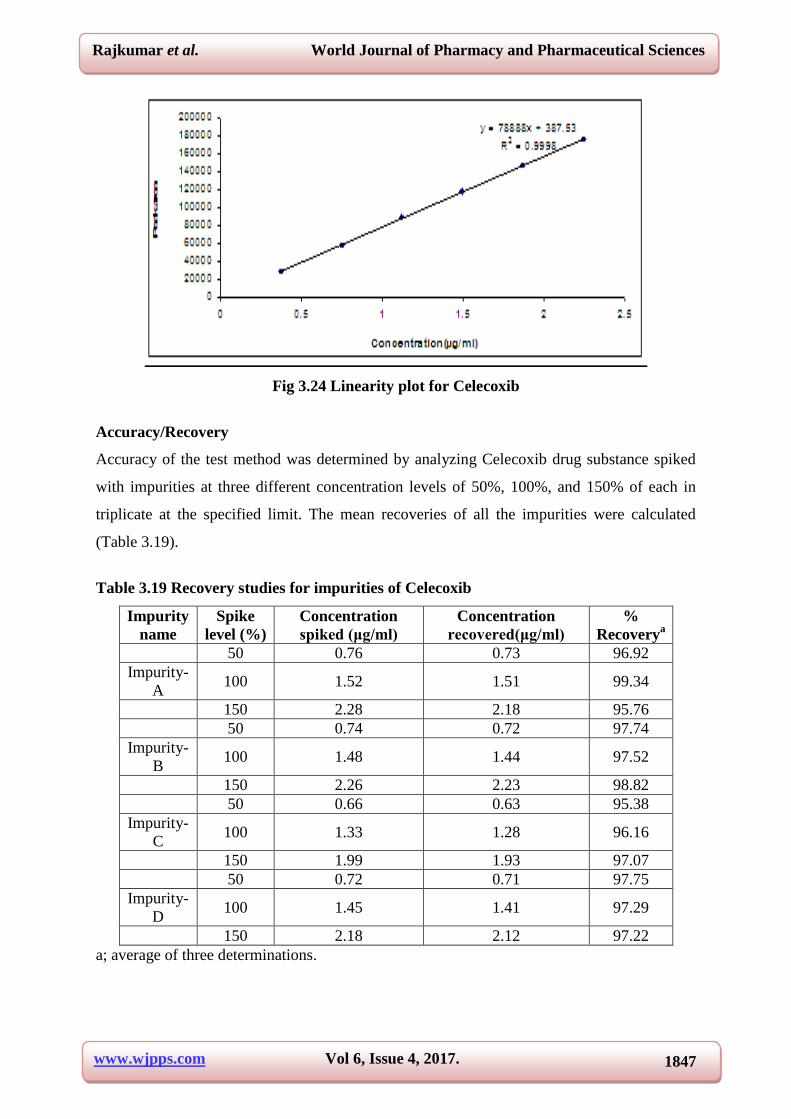
Correlation coefficient 0.9998
Slope 78888
Intercept 387.53
www.wjpps.com Vol 6, Issue 4, 2017.
1847
Rajkumar et al. World Journal of Pharmacy and Pharmaceutical Sciences
Fig 3.24 Linearity plot for Celecoxib
Accuracy/Recovery
Accuracy of the test method was determined by analyzing Celecoxib drug substance spiked
with impurities at three different concentration levels of 50%, 100%, and 150% of each in
triplicate at the specified limit. The mean recoveries of all the impurities were calculated
(Table 3.19).
Table 3.19 Recovery studies for impurities of Celecoxib
Impurity
name
Spike
level (%)
Concentration
spiked (μg/ml)
Concentration
recovered(μg/ml)
%
Recoverya
50 0.76 0.73 96.92
Impurity-
A 100 1.52 1.51 99.34
150 2.28 2.18 95.76
50 0.74 0.72 97.74
Impurity-
B 100 1.48 1.44 97.52
150 2.26 2.23 98.82
50 0.66 0.63 95.38
Impurity-
C 100 1.33 1.28 96.16
150 1.99 1.93 97.07
50 0.72 0.71 97.75
Impurity-
D 100 1.45 1.41 97.29
150 2.18 2.12 97.22
a; average of three determinations.
www.wjpps.com Vol 6, Issue 4, 2017.
1848
Rajkumar et al. World Journal of Pharmacy and Pharmaceutical Sciences
Acceptance criteria: The mean recovery of the impurities at each level should be not less
than 85.0% and not more than 115.0%.
RESULT The % recovery obtained is well within the limit of 85% - 115%. This indicated
that the method is accurate to determine the impurities in Celecoxib.
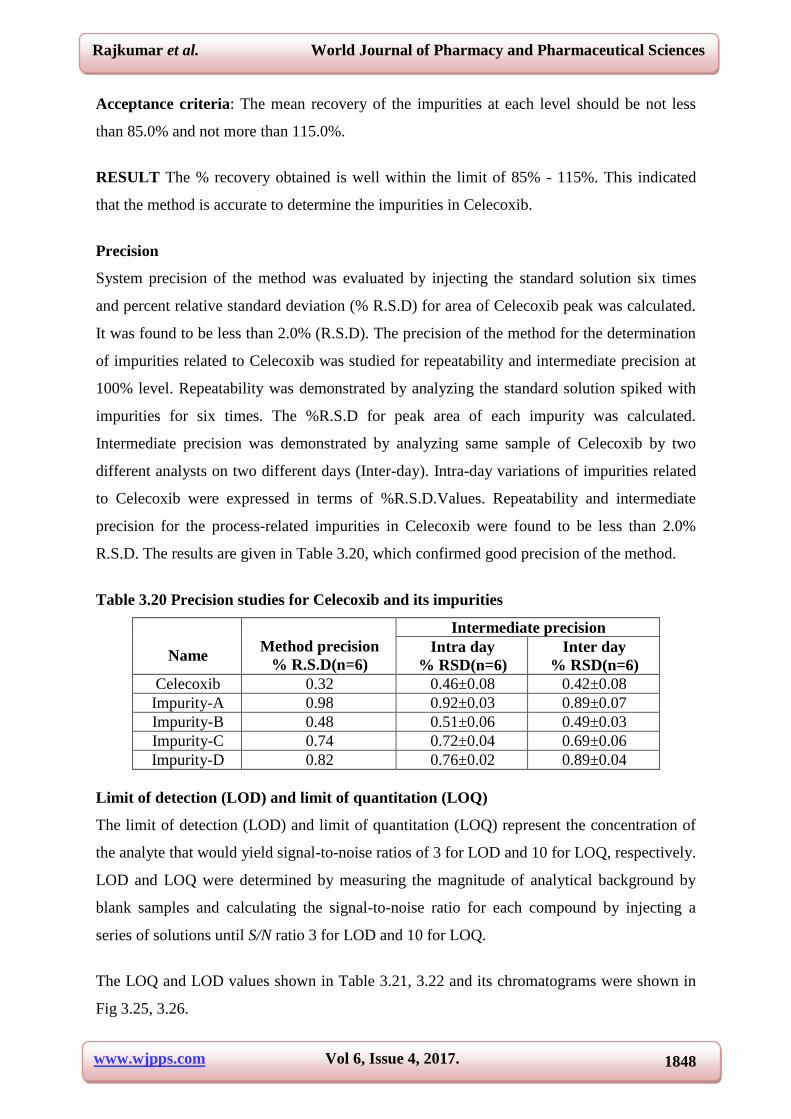
Precision
System precision of the method was evaluated by injecting the standard solution six times
and percent relative standard deviation (% R.S.D) for area of Celecoxib peak was calculated.
It was found to be less than 2.0% (R.S.D). The precision of the method for the determination
of impurities related to Celecoxib was studied for repeatability and intermediate precision at
100% level. Repeatability was demonstrated by analyzing the standard solution spiked with
impurities for six times. The %R.S.D for peak area of each impurity was calculated.
Intermediate precision was demonstrated by analyzing same sample of Celecoxib by two
different analysts on two different days (Inter-day). Intra-day variations of impurities related
to Celecoxib were expressed in terms of %R.S.D.Values. Repeatability and intermediate
precision for the process-related impurities in Celecoxib were found to be less than 2.0%
R.S.D. The results are given in Table 3.20, which confirmed good precision of the method.
Table 3.20 Precision studies for Celecoxib and its impurities
Name
Method precision
% R.S.D(n=6)
Intermediate precision
Intra day
% RSD(n=6)
Inter day
% RSD(n=6)
Celecoxib 0.32 0.46±0.08 0.42±0.08
Impurity-A 0.98 0.92±0.03 0.89±0.07
Impurity-B 0.48 0.51±0.06 0.49±0.03
Impurity-C 0.74 0.72±0.04 0.69±0.06
Impurity-D 0.82 0.76±0.02 0.89±0.04
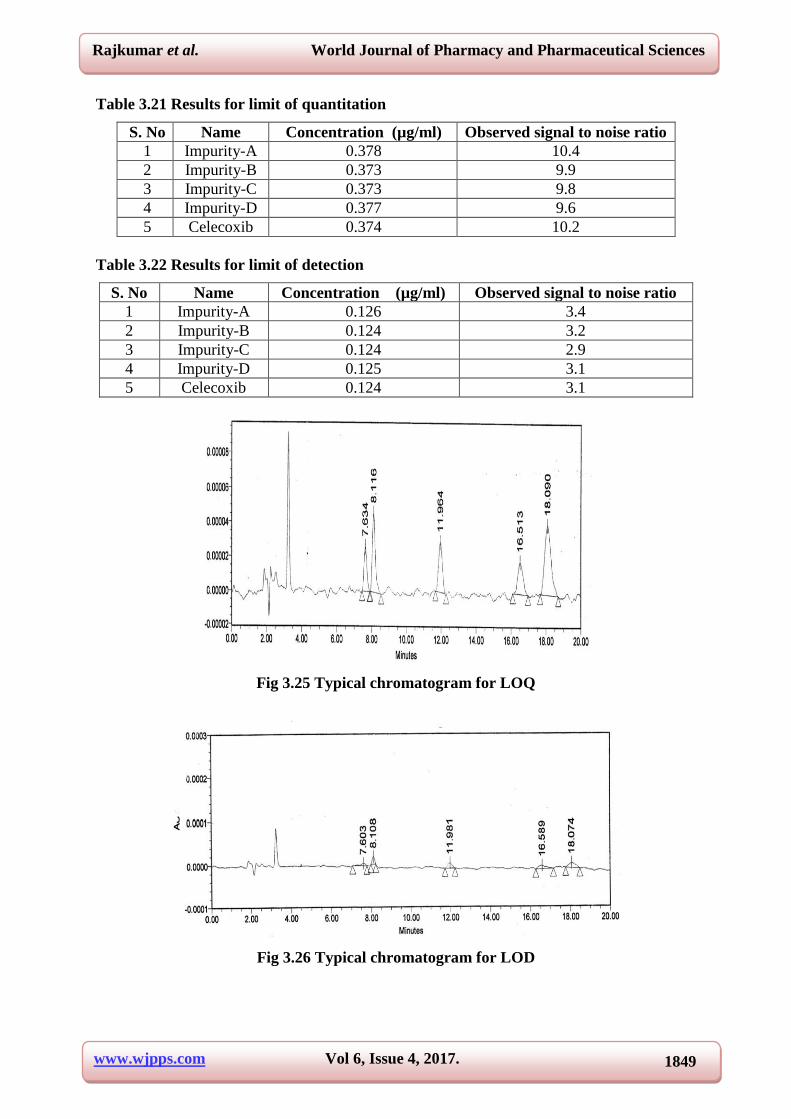
Limit of detection (LOD) and limit of quantitation (LOQ)
The limit of detection (LOD) and limit of quantitation (LOQ) represent the concentration of
the analyte that would yield signal-to-noise ratios of 3 for LOD and 10 for LOQ, respectively.
LOD and LOQ were determined by measuring the magnitude of analytical background by
blank samples and calculating the signal-to-noise ratio for each compound by injecting a
series of solutions until S/N ratio 3 for LOD and 10 for LOQ.
The LOQ and LOD values shown in Table 3.21, 3.22 and its chromatograms were shown in
Fig 3.25, 3.26.
www.wjpps.com Vol 6, Issue 4, 2017.
1849
Rajkumar et al. World Journal of Pharmacy and Pharmaceutical Sciences
Table 3.21 Results for limit of quantitation
S. No Name Concentration (µg/ml) Observed signal to noise ratio
1 Impurity-A 0.378 10.4
2 Impurity-B 0.373 9.9
3 Impurity-C 0.373 9.8
4 Impurity-D 0.377 9.6
5 Celecoxib 0.374 10.2
Table 3.22 Results for limit of detection
S. No Name Concentration (µg/ml) Observed signal to noise ratio
1 Impurity-A 0.126 3.4
2 Impurity-B 0.124 3.2
3 Impurity-C 0.124 2.9
4 Impurity-D 0.125 3.1
5 Celecoxib 0.124 3.1
Fig 3.25 Typical chromatogram for LOQ
Fig 3.26 Typical chromatogram for LOD
www.wjpps.com Vol 6, Issue 4, 2017.
1850
Rajkumar et al. World Journal of Pharmacy and Pharmaceutical Sciences
Robustness
To determine the robustness of the developed method, chromatographic conditions were
deliberately altered. The parameters selected were change in flow rate (± 0.2 ml/min), change
in pH of the buffer (± 0.2) , change in the ratio of mobile phase (± 4%) and change in the
column temperature (± 5ºC), the rest of the chromatographic conditions for each alteration
study was kept constant.
RESULT
In all the deliberately varied chromatographic conditions, no significant change was
observed, which confirmed the robustness of the developed method.
CONCLUSION
A new isocratic RP-HPLC method was developed for the separation and determination of
process related impurities in Celecoxib and validated as per ICH guidelines. The method was
found to be simple, sensitive, precise, robust and accurate. Therefore, this method can be
used for routine testing as well as stability analysis of Celecoxib drug substance. All
statistical results (Mean, % RSD and % recovery) were within the acceptance criteria.
REFERENCES
1. xPharm: The Comprehensive Pharmacology Reference, 2008; Sarah Miles.
2. J.R. Vane and R.M. Botting. Inflamm. Res. 47 suppl. 2, 1998; S78.
3. G.S. Geis, Scand. J. Rheumatol. Suppl. 1999; 109: 31.
4. J.R. Vane, Y. S. Bakhle, R.M. Botting. Annual Review of Pharmacology and Toxicology,
1998; 38: 97.
5. Joseph.T. Dipiro, Robert L. Talbert, Gary C. Yee, Gary R. Matzke, Barbara G. Wells, L.
Michael Posey, Pharmacotherapy: A Pathophysiologic Approach. New York: McGraw-
Hill Medical, 2008.
6. F.E. Silverstein, G. Faich, J.L. Goldstein, L.S. Simon, T. Pincus, A. Whelton, R. Makuch,
G. Eisen, N.M. Agrawal, W.F. Stenson, A.M. Burr, W.W. Zhao, J.D. Kent, J.B.
Lefkowith, K.M. Verburg, G.S. Geis: J. of American Medical Association, 2000; 284(10):
1247.
7. M.M. Goldenberg. Clin. Ther, 1999; 21(9): 1497.
8. J. Fort. Am. J. Orthop, 1999; 28(3): 13.
9. A.H. Schönthal. British Journal of Cancer, 2007; 97: 1465.
10. M.J. Rose, E.J. Woolf, B.K. Matuzewski. J. Chromatogr. B, 2000; 738(2): 377.
www.wjpps.com Vol 6, Issue 4, 2017.
1851
Rajkumar et al. World Journal of Pharmacy and Pharmaceutical Sciences
11. M.K. Srinivasu, Ch.Lakshmi Narayana, D.Sreenivas Rao, G.OmReddy. J.Pharm.
Biomed. Anal, 2000; 22(6): 949.
12. R.N.Saha, C.Sajeev, P.R.Jadhav, S.P.Patil, N.Srinivasan. J.Pharm. Biomed.Anal, 2002;
28: 741.
13. F.Schonberger, G.Heinkele, T.E..Murdter, S.Brenner, U.Klotz, U.Hofmann.
J.Chromatogr.B, 2002; 768: 255.
14. H.H.SherryChow,N.Anavy,D.Salazar,D.H.Frank,D.S.Alberts.J.Pharm.Biomed.Anal,
2004; 34: 167.
15. M.Zhang,G.A.Moore,S.J.Gardiner,E.J.Begg. J.Chromatogr.B, 2006; 830: 245.
16. A.Zarghi,A.Shafaati,S.M.Foroutan,A.Khoddam. J.Chromatogr.B, 2006; 835: 100.