design and test of fpga-based direction-of-arrival ...€¦ · design and test of fpga-based...
TRANSCRIPT
1
Design and Test of FPGA-Based Direction-of-Arrival Algorithms for Adaptive Array Antennas
Brock J. LaMeres
406-994-5987 [email protected]
Raymond J. Weber 406-994-2505
Yikun Huang 406-994-5983
Monther Abusultan 406-994-2505
Sam Harkness 406-994-2505
Electrical & Computer Engineering Department, Montana State University, Bozeman, MT 59717 Abstract—This paper presents the design and parametric testing of two FPGA-based, direction of arrival estimation algorithms (Bartlett and Minimum Variance Distortionless Response) for use in an adaptive array antenna system. The algorithms were implemented on a Xilinx Virtex-5 FPGA and tested using a test bed that emulates signals coming from an 8-channel, circular antenna head after being down converted to an intermediate frequency. The signals are digitized and fed to the FPGA using a custom A/D board. The algorithms were tested while sweeping the incident angle, power level, and single versus dual beams. This paper presents an overview of the digital implementation and the results of the parametric testing. 1 2
TABLE OF CONTENTS
1. INTRODUCTION ................................................................. 1 2. SYSTEM DESIGN ............................................................... 2 3. DOA ESTIMATION ALGORITHMS .................................... 2 4. FPGA IMPLEMENTATION ................................................ 3 5. TEST SETUP ...................................................................... 4 6. DOA TEST RESULTS ........................................................ 5 7. CONCLUSION .................................................................... 5 ACKNOWLEDGMENTS .......................................................... 5 REFERENCES ........................................................................ 8 BIOGRAPHY .......................................................................... 8
1. INTRODUCTION
Adaptive array antennas, often called smart antennas, consist of a set of phased antennas that are able to detect the spatial location of a transmitting node and in turn form a directional beam pattern corresponding to the node’s location. This type of directional communication system allows optimal use of transmitted power and reduces the effect of interference by reinforcing the signal(s) of interest and suppressing all others. Interfering sources can also be actively nullified using processing techniques to produce a more reliable communication link.
1 1978-1-4244-7351-9/11/$26.00 ©2011 IEEE 2 IEEEAC paper #1198, Version 7, Updated January 11, 2011 This research was carried out at Montana State University, Bozeman with funding from Advanced Acoustics Concepts (AAC) and the Montana Board for Research Commercialization and Technology (MBRCT)under grant #09-09
The process of determining the angle of the incoming signal is called the direction of arrival (DOA) estimation. This is accomplished by processing the relative phases of the incident signal as observed by each of the antenna elements. The DOA estimation is then used to perform Beamforming, which is the process of creating the outgoing radiation pattern on the antenna array in the direction of the other communication node. The ability of the smart antenna to accurately determine the DOA of an incoming signal and resolve multiple transmitting nodes depends on the complexity of the signal processing algorithms used [2]. There are two main types of estimation techniques: (1) spectral-based, and (2) parametric [1-2]. In a spectral-based DOA, the spatial spectrum of the incident signal(s) is computed and the local maximas are used to find the angle of the incident wave front(s). In a parametric DOA, knowledge about the underlying data model is used to statistically predict the incident angle. Parametric algorithms tend to be more computationally intense than spectral-based DOA, but yield higher accuracy.
The use of Field Programmable Gate Arrays (FPGAs) in adaptive array antenna systems has received great interest recently due to the potential for increased accuracy and features in a smaller form factor. Advances in digital integrated circuit fabrication technology have made the idea of portable smart antenna systems a reality. This type communication system is of great interest to the military and aerospace community due to the need for small, lightweight radios with advanced features such as multiple beam tracking and noise nullification. FPGA-based processing has emerged as one of the most attractive technologies for complex DOA estimation due to the inherent flexibility of the hardware in addition to the ability to optimize the execution of the algorithm between hardware and software [11-15]. FPGAs allow time critical tasks such as Fast Fourier Transforms (FFTs) to be implemented in custom hardware while other less computationally intense operations can be performed in soft microprocessors. The ability to tailor the hardware implementation to the specific needs of the DOA algorithm makes FPGAs an attractive technology. Furthermore, the ability to implement all of the signal processing hardware on a single chip enables the practical deployment of smart antennas in portable communication devices.
2
In this paper, we present the implementation and parametric testing of a set of DOA algorithms. A combination of hardware and software is used on the FPGA to deliver the highest performance while minimizing development time of new algorithms. The Bartlett and Minimum Variance Distortionless Response (MVDR) DOA algorithms are implemented and tested under a variety of input conditions. A laboratory test bed is used to emulate down converted signals which are digitized by the system and fed into the FPGA. This test setup enables the DOA algorithms to be evaluated while sweeping parameters of interest including single vs. multiple beams, signal-to-noise level, and different intermediate frequencies. All of the test data is recorded in the form of received power-out (dB) versus angle and the performance metrics are discussed.
2. SYSTEM DESIGN
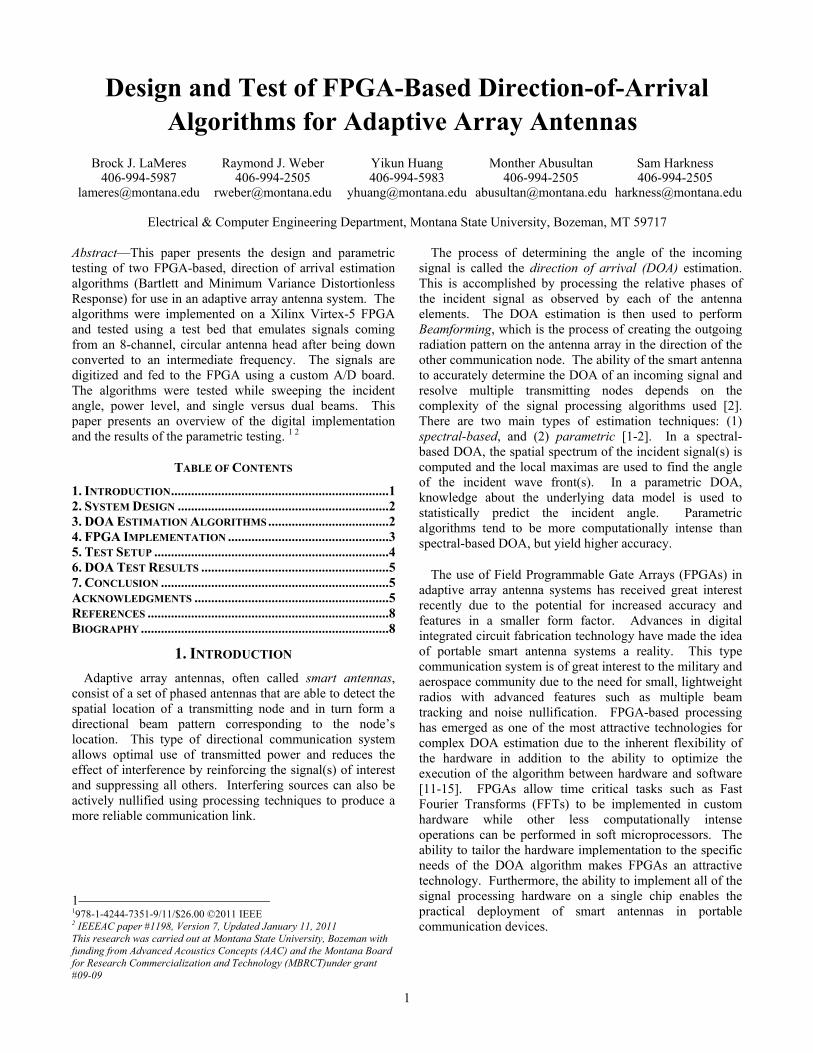
A fully digital smart antenna system is being prototyped at Montana State University (MSU). The system is based on an 8-element circular antenna array. Figure 1 shows a block diagram of our system.
Figure 1. Block diagram of fully digital smart antenna system.
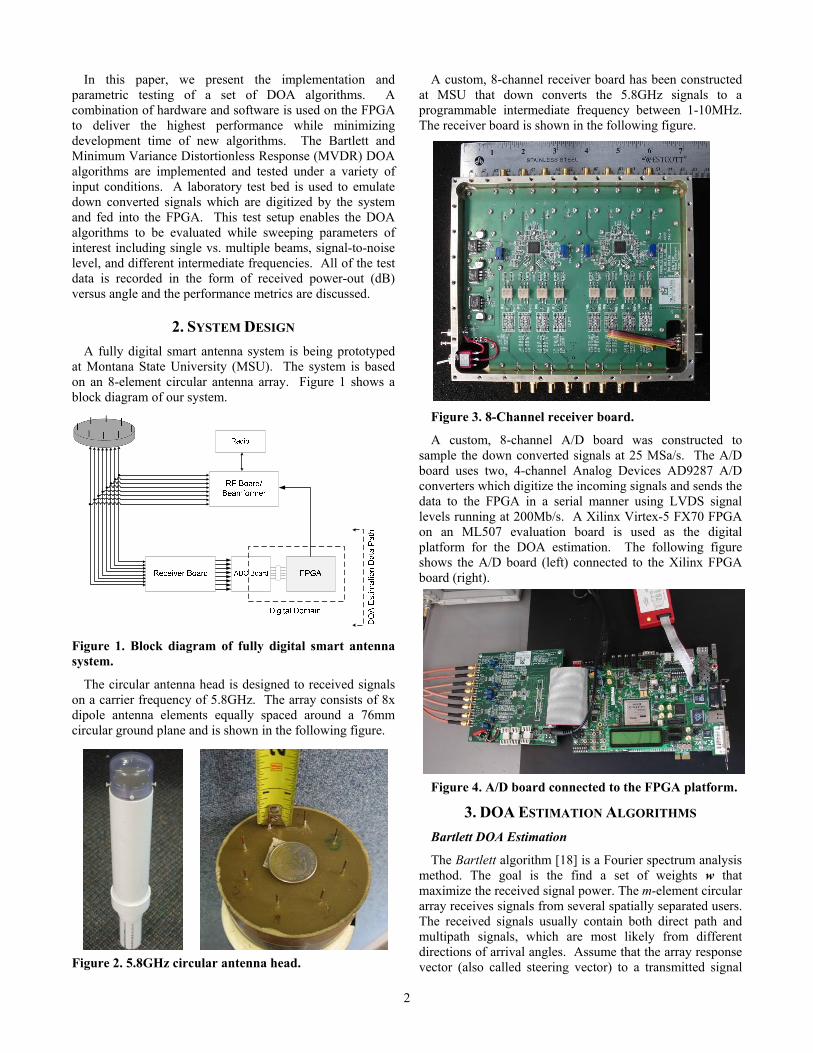
The circular antenna head is designed to received signals on a carrier frequency of 5.8GHz. The array consists of 8x dipole antenna elements equally spaced around a 76mm circular ground plane and is shown in the following figure.
Figure 2. 5.8GHz circular antenna head.
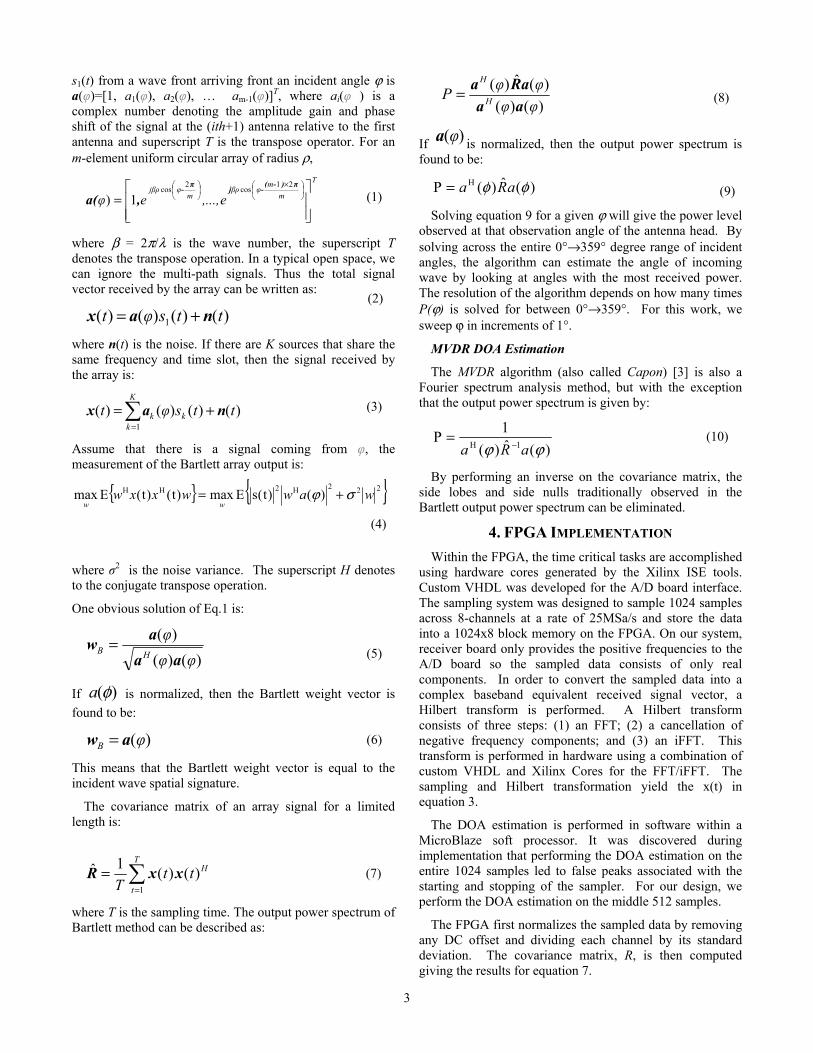
A custom, 8-channel receiver board has been constructed at MSU that down converts the 5.8GHz signals to a programmable intermediate frequency between 1-10MHz. The receiver board is shown in the following figure.
Figure 3. 8-Channel receiver board.
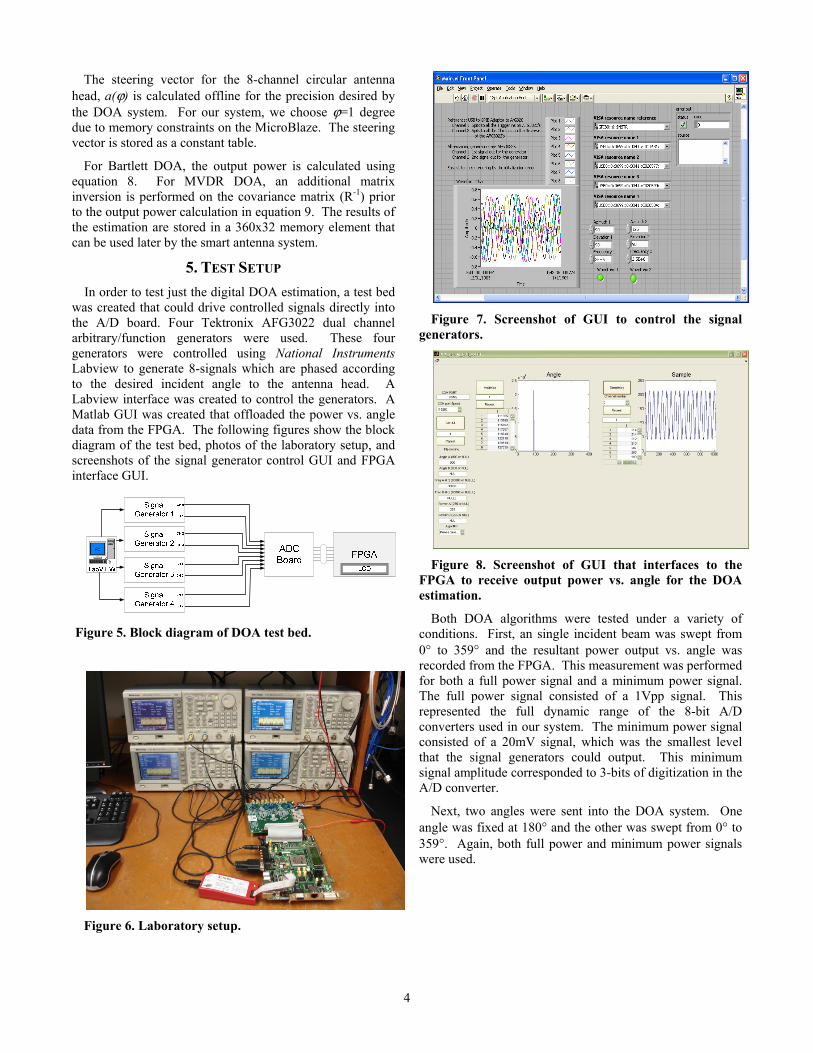
A custom, 8-channel A/D board was constructed to sample the down converted signals at 25 MSa/s. The A/D board uses two, 4-channel Analog Devices AD9287 A/D converters which digitize the incoming signals and sends the data to the FPGA in a serial manner using LVDS signal levels running at 200Mb/s. A Xilinx Virtex-5 FX70 FPGA on an ML507 evaluation board is used as the digital platform for the DOA estimation. The following figure shows the A/D board (left) connected to the Xilinx FPGA board (right).
Figure 4. A/D board connected to the FPGA platform.
3. DOA ESTIMATION ALGORITHMS
Bartlett DOA Estimation
The Bartlett algorithm [18] is a Fourier spectrum analysis method. The goal is the find a set of weights w that maximize the received signal power. The m-element circular array receives signals from several spatially separated users. The received signals usually contain both direct path and multipath signals, which are most likely from different directions of arrival angles. Assume that the array response vector (also called steering vector) to a transmitted signal
3
s1(t) from a wave front arriving front an incident angle ϕ is a(φ)=[1, a1(φ), a2(φ), … am-1(φ)]T, where ai(φ ) is a complex number denoting the amplitude gain and phase shift of the signal at the (ith+1) antenna relative to the first antenna and superscript T is the transpose operator. For an m-element uniform circular array of radius ρ,
T
m
mφβρ
mφβρj
e,...,eφ
=
×
π)-(
-jπ
-
,a(21
cos2
cos
1)
where β = 2π/λ is the wave number, the superscript T denotes the transpose operation. In a typical open space, we can ignore the multi-path signals. Thus the total signal vector received by the array can be written as:
)()()()( 1 ttsφt nax +=
where n(t) is the noise. If there are K sources that share the same frequency and time slot, then the signal received by the array is:
)()()()(1
ttsφtK
kkk nax +=
=
Assume that there is a signal coming from φ, the measurement of the Bartlett array output is:
{ } { }222H2HH )()t(sEmax)t()t(Emax wawwxxwww
σϕ +=
where σ2 is the noise variance. The superscript H denotes to the conjugate transpose operation.
One obvious solution of Eq.1 is:
)()(
)(
φφ
φHB
aa
aw =
If )(φa is normalized, then the Bartlett weight vector is
found to be:
)(φB aw =
This means that the Bartlett weight vector is equal to the incident wave spatial signature.
The covariance matrix of an array signal for a limited length is:
=
=T
t
HttT 1
)()(1ˆ xxR (7)
where T is the sampling time. The output power spectrum of Bartlett method can be described as:
)()(
)(ˆ)(
φφ
φφP
H
H
aa
aRa=
If )(φa is normalized, then the output power spectrum is found to be:
)(ˆ)(P H φφ aRa=
Solving equation 9 for a given ϕ will give the power level observed at that observation angle of the antenna head. By solving across the entire 0°→359° degree range of incident angles, the algorithm can estimate the angle of incoming wave by looking at angles with the most received power. The resolution of the algorithm depends on how many times P(ϕ) is solved for between 0°→359°. For this work, we sweep ϕ in increments of 1°.
MVDR DOA Estimation
The MVDR algorithm (also called Capon) [3] is also a Fourier spectrum analysis method, but with the exception that the output power spectrum is given by:
)(ˆ)(
1P
1H ϕϕ aRa −= (10)
By performing an inverse on the covariance matrix, the side lobes and side nulls traditionally observed in the Bartlett output power spectrum can be eliminated.
4. FPGA IMPLEMENTATION
Within the FPGA, the time critical tasks are accomplished using hardware cores generated by the Xilinx ISE tools. Custom VHDL was developed for the A/D board interface. The sampling system was designed to sample 1024 samples across 8-channels at a rate of 25MSa/s and store the data into a 1024x8 block memory on the FPGA. On our system, receiver board only provides the positive frequencies to the A/D board so the sampled data consists of only real components. In order to convert the sampled data into a complex baseband equivalent received signal vector, a Hilbert transform is performed. A Hilbert transform consists of three steps: (1) an FFT; (2) a cancellation of negative frequency components; and (3) an iFFT. This transform is performed in hardware using a combination of custom VHDL and Xilinx Cores for the FFT/iFFT. The sampling and Hilbert transformation yield the x(t) in equation 3.
The DOA estimation is performed in software within a MicroBlaze soft processor. It was discovered during implementation that performing the DOA estimation on the entire 1024 samples led to false peaks associated with the starting and stopping of the sampler. For our design, we perform the DOA estimation on the middle 512 samples.
The FPGA first normalizes the sampled data by removing any DC offset and dividing each channel by its standard deviation. The covariance matrix, R, is then computed giving the results for equation 7.
(1)
(2)
(3)
(4)
(5)
(6)
(8)
(9)
4
The steering vector for the 8-channel circular antenna head, a(ϕ) is calculated offline for the precision desired by the DOA system. For our system, we choose ϕ=1 degree due to memory constraints on the MicroBlaze. The steering vector is stored as a constant table.
For Bartlett DOA, the output power is calculated using equation 8. For MVDR DOA, an additional matrix inversion is performed on the covariance matrix (R-1) prior to the output power calculation in equation 9. The results of the estimation are stored in a 360x32 memory element that can be used later by the smart antenna system.
5. TEST SETUP
In order to test just the digital DOA estimation, a test bed was created that could drive controlled signals directly into the A/D board. Four Tektronix AFG3022 dual channel arbitrary/function generators were used. These four generators were controlled using National Instruments Labview to generate 8-signals which are phased according to the desired incident angle to the antenna head. A Labview interface was created to control the generators. A Matlab GUI was created that offloaded the power vs. angle data from the FPGA. The following figures show the block diagram of the test bed, photos of the laboratory setup, and screenshots of the signal generator control GUI and FPGA interface GUI.
Figure 5. Block diagram of DOA test bed.
Figure 6. Laboratory setup.
Figure 7. Screenshot of GUI to control the signal generators.
Figure 8. Screenshot of GUI that interfaces to the FPGA to receive output power vs. angle for the DOA estimation.
Both DOA algorithms were tested under a variety of conditions. First, an single incident beam was swept from 0° to 359° and the resultant power output vs. angle was recorded from the FPGA. This measurement was performed for both a full power signal and a minimum power signal. The full power signal consisted of a 1Vpp signal. This represented the full dynamic range of the 8-bit A/D converters used in our system. The minimum power signal consisted of a 20mV signal, which was the smallest level that the signal generators could output. This minimum signal amplitude corresponded to 3-bits of digitization in the A/D converter.
Next, two angles were sent into the DOA system. One angle was fixed at 180° and the other was swept from 0° to 359°. Again, both full power and minimum power signals were used.
5
6. DOA TEST RESULTS
Bartlett Test Results
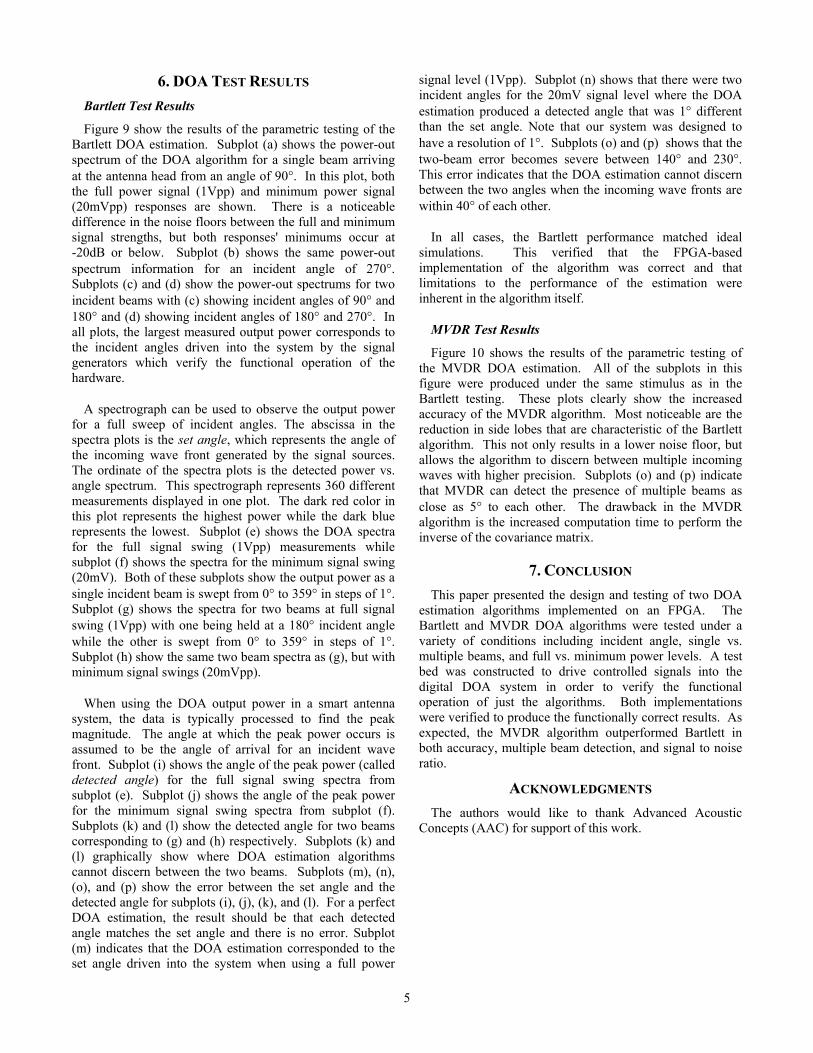
Figure 9 show the results of the parametric testing of the Bartlett DOA estimation. Subplot (a) shows the power-out spectrum of the DOA algorithm for a single beam arriving at the antenna head from an angle of 90°. In this plot, both the full power signal (1Vpp) and minimum power signal (20mVpp) responses are shown. There is a noticeable difference in the noise floors between the full and minimum signal strengths, but both responses' minimums occur at -20dB or below. Subplot (b) shows the same power-out spectrum information for an incident angle of 270°. Subplots (c) and (d) show the power-out spectrums for two incident beams with (c) showing incident angles of 90° and 180° and (d) showing incident angles of 180° and 270°. In all plots, the largest measured output power corresponds to the incident angles driven into the system by the signal generators which verify the functional operation of the hardware.
A spectrograph can be used to observe the output power for a full sweep of incident angles. The abscissa in the spectra plots is the set angle, which represents the angle of the incoming wave front generated by the signal sources. The ordinate of the spectra plots is the detected power vs. angle spectrum. This spectrograph represents 360 different measurements displayed in one plot. The dark red color in this plot represents the highest power while the dark blue represents the lowest. Subplot (e) shows the DOA spectra for the full signal swing (1Vpp) measurements while subplot (f) shows the spectra for the minimum signal swing (20mV). Both of these subplots show the output power as a single incident beam is swept from 0° to 359° in steps of 1°. Subplot (g) shows the spectra for two beams at full signal swing (1Vpp) with one being held at a 180° incident angle while the other is swept from 0° to 359° in steps of 1°. Subplot (h) show the same two beam spectra as (g), but with minimum signal swings (20mVpp).
When using the DOA output power in a smart antenna system, the data is typically processed to find the peak magnitude. The angle at which the peak power occurs is assumed to be the angle of arrival for an incident wave front. Subplot (i) shows the angle of the peak power (called detected angle) for the full signal swing spectra from subplot (e). Subplot (j) shows the angle of the peak power for the minimum signal swing spectra from subplot (f). Subplots (k) and (l) show the detected angle for two beams corresponding to (g) and (h) respectively. Subplots (k) and (l) graphically show where DOA estimation algorithms cannot discern between the two beams. Subplots (m), (n), (o), and (p) show the error between the set angle and the detected angle for subplots (i), (j), (k), and (l). For a perfect DOA estimation, the result should be that each detected angle matches the set angle and there is no error. Subplot (m) indicates that the DOA estimation corresponded to the set angle driven into the system when using a full power
signal level (1Vpp). Subplot (n) shows that there were two incident angles for the 20mV signal level where the DOA estimation produced a detected angle that was 1° different than the set angle. Note that our system was designed to have a resolution of 1°. Subplots (o) and (p) shows that the two-beam error becomes severe between 140° and 230°. This error indicates that the DOA estimation cannot discern between the two angles when the incoming wave fronts are within 40° of each other.
In all cases, the Bartlett performance matched ideal simulations. This verified that the FPGA-based implementation of the algorithm was correct and that limitations to the performance of the estimation were inherent in the algorithm itself.
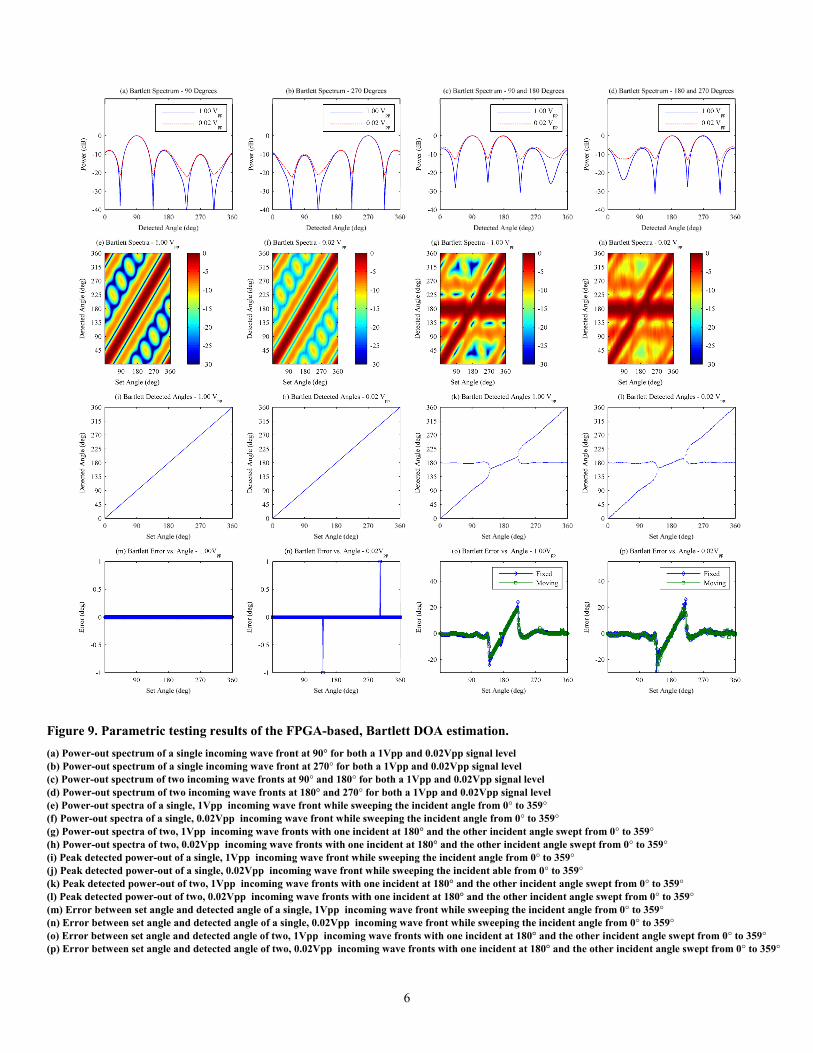
MVDR Test Results
Figure 10 shows the results of the parametric testing of the MVDR DOA estimation. All of the subplots in this figure were produced under the same stimulus as in the Bartlett testing. These plots clearly show the increased accuracy of the MVDR algorithm. Most noticeable are the reduction in side lobes that are characteristic of the Bartlett algorithm. This not only results in a lower noise floor, but allows the algorithm to discern between multiple incoming waves with higher precision. Subplots (o) and (p) indicate that MVDR can detect the presence of multiple beams as close as 5° to each other. The drawback in the MVDR algorithm is the increased computation time to perform the inverse of the covariance matrix.
7. CONCLUSION
This paper presented the design and testing of two DOA estimation algorithms implemented on an FPGA. The Bartlett and MVDR DOA algorithms were tested under a variety of conditions including incident angle, single vs. multiple beams, and full vs. minimum power levels. A test bed was constructed to drive controlled signals into the digital DOA system in order to verify the functional operation of just the algorithms. Both implementations were verified to produce the functionally correct results. As expected, the MVDR algorithm outperformed Bartlett in both accuracy, multiple beam detection, and signal to noise ratio.
ACKNOWLEDGMENTS
The authors would like to thank Advanced Acoustic Concepts (AAC) for support of this work.
6
Figure 9. Parametric testing results of the FPGA-based, Bartlett DOA estimation.
(a) Power-out spectrum of a single incoming wave front at 90° for both a 1Vpp and 0.02Vpp signal level (b) Power-out spectrum of a single incoming wave front at 270° for both a 1Vpp and 0.02Vpp signal level (c) Power-out spectrum of two incoming wave fronts at 90° and 180° for both a 1Vpp and 0.02Vpp signal level (d) Power-out spectrum of two incoming wave fronts at 180° and 270° for both a 1Vpp and 0.02Vpp signal level (e) Power-out spectra of a single, 1Vpp incoming wave front while sweeping the incident angle from 0° to 359° (f) Power-out spectra of a single, 0.02Vpp incoming wave front while sweeping the incident angle from 0° to 359° (g) Power-out spectra of two, 1Vpp incoming wave fronts with one incident at 180° and the other incident angle swept from 0° to 359° (h) Power-out spectra of two, 0.02Vpp incoming wave fronts with one incident at 180° and the other incident angle swept from 0° to 359° (i) Peak detected power-out of a single, 1Vpp incoming wave front while sweeping the incident angle from 0° to 359° (j) Peak detected power-out of a single, 0.02Vpp incoming wave front while sweeping the incident able from 0° to 359° (k) Peak detected power-out of two, 1Vpp incoming wave fronts with one incident at 180° and the other incident angle swept from 0° to 359° (l) Peak detected power-out of two, 0.02Vpp incoming wave fronts with one incident at 180° and the other incident angle swept from 0° to 359° (m) Error between set angle and detected angle of a single, 1Vpp incoming wave front while sweeping the incident angle from 0° to 359° (n) Error between set angle and detected angle of a single, 0.02Vpp incoming wave front while sweeping the incident angle from 0° to 359° (o) Error between set angle and detected angle of two, 1Vpp incoming wave fronts with one incident at 180° and the other incident angle swept from 0° to 359° (p) Error between set angle and detected angle of two, 0.02Vpp incoming wave fronts with one incident at 180° and the other incident angle swept from 0° to 359°
7
Figure 10. Parametric testing results of the FPGA-based, MVDR DOA estimation.
(a) Power-out spectrum of a single incoming wave front at 90° for both a 1Vpp and 0.02Vpp signal level (b) Power-out spectrum of a single incoming wave front at 270° for both a 1Vpp and 0.02Vpp signal level (c) Power-out spectrum of two incoming wave fronts at 90° and 180° for both a 1Vpp and 0.02Vpp signal level (d) Power-out spectrum of two incoming wave fronts at 180° and 270° for both a 1Vpp and 0.02Vpp signal level (e) Power-out spectra of a single, 1Vpp incoming wave front while sweeping the incident angle from 0° to 359° (f) Power-out spectra of a single, 0.02Vpp incoming wave front while sweeping the incident angle from 0° to 359° (g) Power-out spectra of two, 1Vpp incoming wave fronts with one incident at 180° and the other incident angle swept from 0° to 359° (h) Power-out spectra of two, 0.02Vpp incoming wave fronts with one incident at 180° and the other incident angle swept from 0° to 359° (i) Peak detected power-out of a single, 1Vpp incoming wave front while sweeping the incident angle from 0° to 359° (j) Peak detected power-out of a single, 0.02Vpp incoming wave front while sweeping the incident able from 0° to 359° (k) Peak detected power-out of two, 1Vpp incoming wave fronts with one incident at 180° and the other incident angle swept from 0° to 359° (l) Peak detected power-out of two, 0.02Vpp incoming wave fronts with one incident at 180° and the other incident angle swept from 0° to 359° (m) Error between set angle and detected angle of a single, 1Vpp incoming wave front while sweeping the incident angle from 0° to 359° (n) Error between set angle and detected angle of a single, 0.02Vpp incoming wave front while sweeping the incident angle from 0° to 359° (o) Error between set angle and detected angle of two, 1Vpp incoming wave fronts with one incident at 180° and the other incident angle swept from 0° to 359° (p) Error between set angle and detected angle of two, 0.02Vpp incoming wave fronts with one incident at 180° and the other incident angle swept from 0° to 359°
8
REFERENCES [1] H. Krim, M. Vibert, “Two Decades of Array Signal Processing
Research”, IEEE Signal Processing Magazine, July 1996. [2] L.C. Godara, “Application of Antenna Arrays to Mobile
Communications, Part II: Beam-Forming and Direction-of-Arrival Considerations”, Proc. Of the IEEE, vol. 85., no. 8, Aug 1997.
[3] Toby Haynes, “A Primer on Digital Beamforming”, Application Note, Available Online: www.spectrumsignal.com.
[4] T.W. Nuteson and G.S. Mitchell, “Digital Beamforming for Smart Antennas”, IEEE MTT-S Digest, 2001.
[5] C. Dick, F. Harris, M. Pajic, and D. Vuletic, “Implementing a Real-Time Beamformer on an FPGA Platform”, Xcell Journal, pp. 36-40, 2nd Quarter, 2007.
[6] H. Arai and K. Ichige, “Hardware Implementation of Smart Antenna Systems for High Speed Wireless Communication”, International Union of Radio Science, Proc. Of Gernal Assemblies, paper ID 01157, 2005.
[7] D. Boppana, “FPGA-Based WiMAX System Design”, Application Note CP-WIMAX-1.0, Altera Corp.
[8] M. Kim, K. Ichige, and H. Arai, “Implementation of FPGA based Fast DOA Estimator using Unitary MUSIC Algorithm”, Vehicular Technology Conference, vol. 1, pp. 213-217, Oct 6-9, 2003.
[9] M. Kim, K. Ichige, and H. Arai, “Real-time Smart Antenna System Incorporating FPGA-based Fast DOA Estimator”, Vehicular Technology Conference, vol. 1, pp. 160-164, Sept 26-29, 2004.
[10] S. Jeon, Y. Wang, Y. Qian, and T. Itoh, “A Novel Planar Array Smart Antenna System with Hybrid Analog-Digital Beamforming”, Microwave Symposium Digest, vol. 1, pp. 121-124, May 20-25, 2001.
[11] Justin L. Tripp, Anders A. Hanson, Maya Gokhale, and Henning Mortveit. Partitioning hardware and software for reconfigurable supercomputing applications: A case study. In Proc. of the 2005 ACM/IEEE Conference on Supercomputing (SC), page 27, Washington, DC, USA, Nov. 2005. IEEE Computer Society.
[12] J. Williams, A. George, J. Richardson, K. Gosrani, and S. Suresh, "Computational Density of Fixed and Reconfigurable Multi-Core Devices for Application Acceleration," Proc. of Reconfigurable Systems Summer Institute 2008 (RSSI), Urbana, IL, July 7-10, 2008.
[13] M. Huang, V. Narayana, and T. El-Ghazawi, "Efficient Mapping of Hardware Tasks on Reconfigurable Computers using Libraries of Architecture Variants," Proc. of 16th IEEE Symposium on Field-Programmable Custom Computing Machines (FCCM), Napa, CA, Apr. 5-7, 2009 (short paper).
[14] Melissa C. Smith, Jeremy S. Vetter, and Xuejun Liang. Accelerating scientific applications with the SRC-6 reconfigurable computer: Methodologies and analysis. In Proc. of the 19th IEEE International Parallel and Distributed Processing Symposium (IPDPS) - Workshop 3, page 157.2, Washington, DC, USA, Apr. 2005. IEEE Computer Society.
[15] J. Williams, A. George, J. Richardson, K. Gosrani, and S. Suresh, "Fixed and Reconfigurable Multi-Core Device Characterization for HPEC," Proc. of High-Performance Embedded Computing Workshop (HPEC), Lexington, MA, Sep. 23-25, 2008.
[16] IEEE 802.16 Task Group, Air Interface for Fixed Broadband Wireless Access Systems, 2008.
[17] Michael Panique, “Design and evaluation of test bed software for a smart antenna system supporting wireless communication in rural areas", Master’s Thesis, Montana State University, Dept. of Electrical and Computer Engineering, 2008.
[18] M. S. Bartlett, "Periodogram analysis and continuous spectra," Bio-metrica, vol. 37, no. 1/2, pp. 1-16, Jun. 1950.
[19] Barry D, Van Veen, and Kevin Buckley, "Beamforming: a versatile approach to spatial filtering," IEEE ASSP Magazine, vol. 5, no. 2, pp. 4-24, Apr 1988.
BIOGRAPHY
Brock J. LaMeres (M’98-SM’09) received the B.S. degree in electrical engineering from Montana State Univ., Bozeman in 1998, and the M.S. degree in electrical engineering from the Univ. of Colorado, Colorado Springs in 2001, and the Ph.D. degree in electrical engineering from the Univ. of Colorado, Boulder in 2005. He is currently an Assistant Professor in the Department of Electrical and Computer Engineering at Montana State University (MSU), Bozeman. LaMeres teaches and conducts research in the area of digital systems. LaMeres' research is sponsored by NASA, the National Science Foundation, the Montana Space Grant Consortium, the National Space Grant Consortium, and the Office of Naval Research. Prior to joining the faculty at MSU in 2006, he worked as a Hardware Design Engineer for Agilent Technologies in Colorado Springs from 1999 to 2006. Raymond Weber (M’06) received the B.S. degree in electrical engineering from Montana State Univ., Bozeman in 2008, and the M.S. degree in electrical engineering Montana State Univ., Bozeman in 2010. He is currently a Research Engineer in the Department of Electrical and Computer Engineering at Montana State University (MSU), Bozeman where his focus is on smart antenna systems. Yikun Huang received the Ph.D. degree in electrical engineering from the University of Illinois-Chicago. She is currently a Research Assistant Professor in the Department of Electrical and Computer Engineering at Montana State University (MSU), Bozeman. Huang conducts research in the areas of wireless communications, smart antennas, signal processing, and computational biology. Monther Abusultan (M’06) received the B.S. degree in computer engineering from Montana State University, Bozeman in 2007, and the M.S. degree in electrical engineering Montana State Univ., Bozeman in 2010. He is currently an instructor at an institute of technology in Palastine where he teaches courses on digital systems. Sam Harkness (M’06) received the B.S. degree in computer engineering from Montana State University, Bozeman in 2007. He is now in active service for the United States Air Force.