design and safety analysis of an a thesis by …
TRANSCRIPT

DESIGN AND SAFETY ANALYSIS OF AN
IN-FLIGHT, TEST AIRFOIL
A Thesis
by
CHRISTOPHER WILLIAM MCKNIGHT
Submitted to the Office of Graduate Studies of Texas A&M University
in partial fulfillment of the requirements for the degree of
MASTER OF SCIENCE
August 2006
Major Subject: Aerospace Engineering

DESIGN AND SAFETY ANALYSIS OF AN
IN-FLIGHT, TEST AIRFOIL
A Thesis
by
CHRISTOPHER WILLIAM MCKNIGHT
Submitted to the Office of Graduate Studies of Texas A&M University
in partial fulfillment of the requirements for the degree of
MASTER OF SCIENCE
Approved by: Chair of Committee, William S. Saric Committee Members, Helen Reed Rodney Bowersox J.N. Reddy Department Head, Helen Reed
August 2006
Major Subject: Aerospace Engineering

iii
ABSTRACT
Design and Safety Analysis of an In-Flight, Test Airfoil. (August 2006)
Christopher William McKnight, B.S., The University of Dayton
Chair of Advisory Committee: Dr. William Saric
The evaluation of an in-flight airfoil model requires extensive analysis of a variety of
structural systems. Determining the safety of the design is a unique task dependant on
the aircraft, flight environment, and physical requirements of the airfoil. With some
areas of aerodynamic research choosing to utilize flight testing over wind tunnels the
need to design and certify safe and reliable designs is a necessity.
Commercially available codes have routinely demonstrated an ability to simulate
complex systems. The union of three-dimensional design software with finite element
programs, such as SolidWorks and COSMOSWorks, allows for a streamlined approach
to the iterative task of design and simulation. The iterative process is essential to the
safety analysis of the system. Results from finite-element analysis are used to determine
material selection and component dimensions. These changes, in turn, produce different
stress profiles, which will affect other components.
The unique case presented in this study outlines the process required to certify a
large swept-wing model mounted to a Cessna O-2 aircraft. The process studies the affect
of aerodynamic loading on the hard-point structure inside the wing, as well as the model
mounting structure, and support strut.
The process does not end when numerical simulations indicate that each system
is safe. Following numerical work, a series of static tests are used to verify that no
unforeseen failures will occur. Although the process is tailored to one specific example,
it outlines an approach that could be applied to any test platform. A different model may
create a physically different system, but the safety analysis would remain the same.

iv
To my parents,
Fred and Sue McKnight

v
ACKNOWLEDGEMENTS
This entire project would not have been possible without Dr. William Saric. He took a
tremendous risk letting a guy who likes cars near aircraft, and I thank him for it. I must
also thank him and Dr. Helen Reed who provided me an opportunity to live in an
environment filled with horses, dogs, fish, deer, a goose named Marquette, turtles,
spiders, cows, and countless other creatures.
This work could not have been completed without the financial support from the
US Air Force Office of Scientific Research grant number FA9550-05-1-0044, P00001
and the Texas A&M Flight Research Laboratory.
I am grateful to Colleen Leatherman who has helped organize the most, if not all,
of the paperwork associated with the project. Without her ability to keep track of
deadlines, arrange travel, and handle billing procedures, the design process would have
been a far more grueling task.
Without two remarkable test pilots, Roy Martin and Don Ward, the design
process would have been at times frightening. Their positive outlook and willingness to
fly one of the most unusual aircraft has been enjoyable and relaxing.
I have also had the opportunity to work with outstanding individuals at both
Arizona State University as well as Texas A&M University. I thank; Andrew Carpenter
and Celine Kluzec for helping me quickly gain a brief understanding of aircraft and
piloting requirements- which at times was not easy, Tim Silverman, Heath Lorzel, and
Sean Walton who provided tremendous design support, Shane Schouten who was
normally responsible for the fabrication of whatever small component I forgot, Lauren
Hunt who was forced to try to put into words the hundreds of images created, and Matt
Hoyt and Cecil Rhodes the two mechanics who routinely had to come up with ways to
make my ideas feasible.
My family has supported me throughout this endeavor. My parents have never or
at least rarely questioned what I was doing. I consider myself extremely lucky to have
always had their support in whatever I have done.

vi
TABLE OF CONTENTS
Page ABSTRACT……………………………………………………………………...
DEDICATION…………………………………………………………………...
ACKNOWLEDGEMENTS ……………………………………………………..
LIST OF TABLES………………………………………………………….........
LIST OF FIGURES………………………………………………………………
NOMENCLATURE……………………………………………………………...
CHAPTER I INTRODUCTION…………………………………………………
1.1 Introduction………………………………………………………….. 1.2 Software Selection…………………………………………………… 1.3 Maximum Design Loads……………………………………………..
CHAPTER II HARD POINT BRACKETS……………………………………...
2.1 Individual Bracket Comparison……………………………………... 2.2 Evaluation of Outboard Bracket Assembly…………………………..
CHAPTER III MOUNTING STRUCTURE……………………………………..
3.1 Explanation of Mounting Structure…………………………………..
CHAPTER IV AIRFOIL MODEL DESIGN…………………………………….
4.1 Preliminary Design…………………………………………………... 4.2 Preliminary Decision Analysis…………………………………......... 4.3 Numerical Modeling of Early Designs………………………….........
4.3.1 Evaluation of Pocketed Model…………………………….. 4.3.2 Evaluation of Shelled Model………………………….........
4.4 Control of Airfoil Center of Gravity………………………………… 4.5 Intermediate Decision Analysis……………………………………... 4.6 Finalization of Airfoil Design………………………………………..
4.6.1 Structural Changes to Airfoil……………………………… 4.6.2 Numerical Evaluation of Stepped Model………………….. 4.6.3 Final Decision Analysis……………………………………
4.7 Re-evaluation of Maximum Loading………………………………...
CHAPTER V EXPLANATION OF FLUTTER CONCERNS…………………..
iii
iv
v
viii
ix
xii
1 1 2 3 5 5 6 8 8
10
10 11 13 14 15 17 18 20 20 21 22 23
24

vii
5.1 Development and Resolution of Flutter Concerns…………………...
CHAPTER VI ROCKER ARM AND PYLON ASSEMBLIES…………………..
6.1 Recognition of Potential Problem in Rocker Arm Assembly……….. 6.2 Numerical Evaluation of Original Assembly………………………... 6.3 Improvement of Rocker Arm Assembly…………………………….. 6.4 Pylon Concerns………………………………………………………
CHAPTER VII SUPPORT STRUT……………………………………………..
7.1 Design of Airfoil Support Strut……………………………………… 7.2 Numerical Evaluation of Strut……………………………………….
7.2.1 Stress Analysis of Strut Assembly………………………… 7.2.2 Buckling Analysis of Strut Assembly……………………...
CHAPTER VIII TIE-DOWN LOCATION………………………………………
8.1 Evaluation of Tie-Down Bracket……………………………….........
CHAPTER IX EVALUATION OF BOLTED CONNECTIONS IN THE MOUNTING STRUCTURE…………………………………………..
9.1 Preloading of Model Fasteners…………………………………......... 9.2 Bolt Analysis of Mounting Structure………………………………...
CHAPTER X STATIC-LOAD TESTS………………………………………….
10.1 Preliminary Static-Load Test…………………………………......... 10.2 Final Static-Load Test with Model and Aircraft……………………
CHAPTER XI CONCLUSIONS…………………………………………………
11.1 Recommendations………………………………………………….. 11.2 Conclusions…………………………………………………………
REFERENCES…………………………………………………………………...
APPENDIX A FIGURES………………………………………………………...
APPENDIX B AIRFOIL BLUEPRINTS………………………………………..
APPENDIX C MOUNTING STRUCTURE BLUEPRINTS……………………
VITA……………………………………………………………………………..
Page 24
26
26 26 27 28
29
29 30 31 32
33
33
35
35 36
39
39 40
42
42 43
45
46
104
113
117

viii
LIST OF TABLES
TABLE Page
1.1
2.1
2.2
4.1
4.2
4.3
4.4
4.5
4.6
4.7
4.8
4.9
4.10
4.11
7.1
8.1
COSMOSWorks Verification Studies………………………………
Individual Bracket Comparison…………………………………….
Outboard Bracket System Stress Results……………………………
Preliminary Decision Analysis………………………………………
Pocketed Model Stress (Maximum Loading)…………………….….
Natural Frequencies: Pocketed Model with Mounting Structure……
Shelled Model Stress (Maximum Loading)………………………….
Natural Frequencies: Shelled Model with Mounting Structure……...
Intermediate Decision Analysis………………………………….…..
Insert Effect on Stress Analysis………………………………….…..
Stepped Model Stress (Maximum Loading)…………………………
Natural Frequencies: Stepped Model with Mounting Structure…….
Final Decision Analysis………………………………………….…..
Stepped Model Stress (Revised Maximum Loading)………………..
Strut Stress (Revised Maximum Loading)……………………….…..
Tie-Down Assembly Stress Analysis…………………………….…..
3
6
7
13
14
15
16
17
19
19
21
22
22
23
31
34

ix
FIGURE
A.1
A.2
A.3
A.4
A.5
A.6
A.7
A.8
A.9
A.10
A.11
A.12
A.13
A.14
A.15
A.16
A.17
A.18
A.19
A.20
A.21
A.22
LIST OF FIGURES
Cessna O-2 with Multiple Wing Stores……………………………...
Pylon Bracket System Removed From Aircraft……………………..
Visual Comparison Original Bracket (Left) and Replacement
Bracket (Right)……………………………………………………….
Load Application (Magenta) and Restraints (Blue and Green) for
Individual Bracket Analysis………………………………………….
Outboard Pylon Bracket System……………………………………..
Application of Lifting (Magenta), Drag (Cyan), and Gravitational
(Yellow) Forces to the Four Bracket System………………………...
Restraints Applied to Each Bracket Hole in the Four Bracket System
Stress Concentrations Leading to Minimum Factor of Safety……….
Maximum Stress in the Four Bracket System………………………..
Airfoil Mounting Structure…………………………………………..
Alignment Component With 3 Rocker Arm Assemblies and Eye
Bolts………………………………………………………………….
Mounting Channel…………………………………………………....
Arcs Allowing for Mounting into Top Surface of Airfoil……………
Angle of Attack Adjustment Mechanism…………………………….
Support Bolt………………………………………………………….
Two Inch Diameter Wiring Hole…………………………………….
Main Bolt Before and After Preloading with Jack Bolt……………...
Components in Three Piece Designs………………………………...
Pocketed Model Showing 4X4 System of Weight Removal………...
Shelled Model Without Test Surface………………………………...
Composite Airfoil Model…………………………………………….
Airframe Design Illustrating Rib and Skin Panel Design……………
Page
48
49
50
51
52
53
54
55
56
57
58
59
60
61
62
63
64
65
66
67
68
69

x
FIGURE
A.23
A.24
A.25
A.26
A.27
A.28
A.29
A.30
A.31
A.32
A.33
A.34
A.35
A.36
A.37
A.38
A.39
A.40
A.41
A.42
A.43
A.44
A.45
Restraints Applied to Airfoils After Integration of Mounting
Structure……………………………………………………………...
Force Application for Airfoil Model Evaluation……………………..
Stress Analysis Results of Pocketed Model under Maximum
Loading……………………………………………………………….
Uniform Deflection of Pocketed Model under Maximum Loading….
Stress Analysis Results of Shelled Model under Maximum Loading..
Deflection of Shelled Model due to Maximum Loading…………….
Shift in Shelled Model CG Location with Addition of 20 lb
Counterweight………………………………………………………..
Shift in Pocketed Model CG Location with Addition of 20 lb
Counterweight………………………………………………………..
Cross Section Revealing Stepped Structure of Final Model ...………
Stepped Structure Applied to Leading Edge…………………………
Plates Added to the Top and Bottom of Airfoil Model………………
Stress Analysis of Stepped Model under Maximum Loading………..
Deflection of Stepped Model Illustrating Pattern Similar to Pocketed
Model…………………………………………………………….......
Original Rocker Arm Assembly……………………………………...
Weld on Original Rocker Arm Assembly……………………………
Factor of Safety Diagram, Yield Strength 90,000 psi………………..
Redesigned Rocker Arm Assembly………………………………….
Modeled Pylon……………………………………………………….
Location of Replaced Rivets in Pylon Assembly…………………….
Stiffeners Applied to Pylon Skin……………………………………..
Solid Bulkhead for Pylon Assembly…………………………………
Strut Profiles; Cessna 172 (Left), Fairing (Right)……………………
Overview of Strut Featuring Dual Ball Joints………………………..
Page
70
71
72
73
74
75
76
77
78
79
80
81
82
83
84
85
86
87
88
89
90
91
92

xi
FIGURE
A.46
A.47
A.48
A.49
A.50
A.51
A.52
A.53
A.54
A.55
A.56
A.57
Cut Away Revealing Strut Insert inside Strut Profile………………..
Restraints Applied to Both Strut Attachment Points…………………
Results Illustrating Concentrations of Stress in Both Ball Joints…….
Tie Down Assembly………………………………….
Setup of Preliminary Static Load Test……………………………….
Static Model Used to Simulate True Airfoil Model…………………
Location of Load Cells During Preliminary Static Load Test………
Setup for Second Static Load Test…………………………………
Observed Separation in Tie-Down Location During Static Load Test
with True Airfoil Model……………………………………………...
Steel Clip Added to Tie-Down System………………………………
Location of Etched Lines to Ensure Angle of Attack Alignment……
Thermal Analysis Showing Uneven Cooling due to Internal
Structure……………………………………………………………...
Page
93
94
95
96
97
98
99
100
101
102
103
104

xii
NOMENCLATURE
D = Nominal bolt diameter
Ffail = Force required for joint failure
Fi = Preload
Fp = Prying force
K = Nut friction factor
µ = Coefficient of friction
rµ = Mean radius (washer) for frictional force
T = Pre-torque
τfail = Torque required to cause unwanted model

1
CHAPTER I
INTRODUCTION 1.1 Introduction
Designing an in-flight airfoil requires more that analyzing the airfoil. A successful
design was one that could certify the safety of every system from the wing box to the
model. These systems included; the hard-point brackets, the pylon and rocker arms, the
airfoil mounting structure, the actual airfoil model, the support strut and the tie-down
bracket. Once all of these systems were determined to be safe, flight testing of the airfoil
could begin.
Design of the in-flight test airfoil began by outlining the physical requirements.
The airfoil was to have a chord of 54 inches, a span of 42 inches and be swept back at
30°. It was also determined that a 4° cut at the base of the model was necessary to
increase the rotational clearance at the trailing edge by an additional 3 inches. This
additional clearance was necessary to prevent the corner of the model from striking the
ground during landing.
Additional requirements stipulated that the airfoil needed to have a removable
aluminum leading edge. This made it possible to fabricate and utilize multiple
components. This would allow for one leading edge to be prepared while another is
being tested. The leading-edge component also needed to extend back to the 15% chord,
or 8.1 inches, to minimize the effect of the seam.
The test platform was to be designed so that it could safely be mounted under the
wing of a Cessna O-2 test aircraft. The airfoil was required to interface to the aircraft
____________
This thesis follows the style of the AIAA Journal.

2
using the bomb rack and pylon system originally used to carry various ordinances.
Although the Air Force requires that a minimum factor of safety (FOS) of 1.5 to
ultimate, the design process would require that every component demonstrate a FOS of
1.5 to yield.
Flutter concerns would require that the model achieve a high enough natural
frequency to avoid damaging oscillation. The early design process focused on two likely
causes of vibration, i.e. the engine RPM and the blade passing frequency. With the
engine RPM limited to the range between 2200 and 2800 RPM, the two ranges to avoid
were set at 38 to 47 Hz and 76 to 94 Hz.
Additionally the design of the airfoil model would be critically dependant on
weight. This requirement is unique to the in-flight testing environment. While traditional
wind-tunnel models can rely on massive support structures, aircraft limitations prevent
such structures. Increasing the weight of the model decreases the fuel capacity of the
aircraft, thereby limiting flight time. An increase in weight also creates a lateral
imbalance which degrades aircraft performance, and limits takeoff requirements.
1.2 Software Selection
Before beginning the design process it was necessary to select software packages for
design and evaluation. The airfoil model was designed in SolidWorks 2004 SP3.1, and
evaluated using COSMOSWorks SP3.1. By using a bundled set of software the iterative
process between design and evaluation is made nearly seamless. The wide scale
commercial use of SolidWorks allowed for parts to be sent electronically to machine
shops for evaluation throughout the process.
In order to understand the accuracy of COSMOSWorks a series of trial
simulations were developed. These simulations would be compared to analytical
solutions (Mischke et al. 2002, Blevins 1979), indicating the potential error in results.
The first simulation used a cantilevered beam, under an end load of 250 pounds. The
second used the same beam but applied a remote load 2 inches off the free end. Again

3
using the cantilevered beam a gravitational force of 1G was applied. The final simulation
utilized a parallelogram fixed on one side to evaluate the numerical frequency analysis.
Table 1.1 shows that the results returned by COSMOSWorks are often within
Table 1.1
COSMOSWorks Verification Studies Deflection (in) Stress (psi)
Study Theoretical Numerical Error (%) Theoretical Numerical Error
(%) End Load 0.0863 0.0857 -0.70 9000 9325 3.61
Remote Load 0.1079 0.1071 -0.74 10500 10920 4.00
Gravity 0.0003 0.0003 0.00 43.63 41.03 -5.96 Mode 1 (Hz) Mode 2 (Hz)
Frequency 65.91 64.73 -1.79 169.54 150.11 -11.46
5% of the true values. Many of the cases develop stress concentrations near the fixed
surface and, the results can be improved by looking at the values within one node of the
maximum value. It was also observed through other frequency trials that
COSMOSWorks appeared to return conservative values. While the first mode was close
to the true value the second numerical result was always lower than the true value.
1.3 Maximum Design Loads
Evaluation of structural systems was based on reactions to a worst case scenario. This
condition was determined to be a collision avoidance maneuver, where the aircraft
would be in a 30° bank and a 2G pull up. This type of maneuver would place the airfoil
model at an angle of attack of 7°. Computational simulations of the aircraft and airfoil
determined that this could produce 550 lbs of lift, and 40 pounds of drag. These two
forces in combination with twice the weight of the airfoil would be used to create a
maximum load set.
The drag of the model was not a main concern during most of the design process.
When firing, the rocket launcher applied a 1000 pound thrusting force to the aircraft

4
system. By comparison the minute drag force was not expected to cause conflicts with
any aircraft systems.
The weight of the model was not a concern when evaluating aircraft systems due
to the previous certification of the aircraft. Without an airfoil model the aircraft was
certified 3.8G with 350 pounds on each pylon. With the flight envelope for the airfoil
model restricted to 2.0G, and the objective to minimize the airfoil weight it was
anticipated that all the aircraft systems would be able to survive the 2G loading.
The lifting force was the most severe load in the set. The large force directed
towards the fuselage created a large bending moment. This moment was not typical of
the munitions certified for the O-2.

5
CHAPTER II
HARD POINT BRACKETS
2.1 Individual Bracket Comparison
The first aircraft system investigated was the hard point system. The Cessna O-2 was
designed to carry a variety of munitions under its wings (Figure A.1). These munitions
were held in bomb racks inside of pylons bolted to the aircraft wing box through four
brackets (Figure A.2). These brackets were replaced as one of the initial steps to prepare
the aircraft for testing.
The original hard-points in wings were fabricated from sheet metal, probably
2024-T3 aluminum. Three small rivets and two larger rivets secured each bracket to the
spar. The pylon was attached to the bracket by means of a ¼” bolt. These bolts would
enter into the brackets and thread through a nut plate riveted to the sheet-metal base.
Each pylon relied on four such connections, securing a payload to both the leading edge
and trailing edge spars.
The replacement brackets were designed based on the knowledge that the airfoil
model would generate a lifting load not seen with any of the approved wing stores. The
brackets would be machined from solid 7075-T6 aluminum. The change in material
increased the yield strength of the aluminum by 46%, 50,000 psi to 73,000 psi. In
addition to increasing material strength the new brackets were thicker than their
predecessors. The side wall thickness increased to 0.075 inches, and the base increased
to 0.160 in. Additionally the base of each bracket was now smooth and seamless (Figure
A.3), unlike the previous brackets which had a step due to the layered sheet metal.
Without such a step the bracket could not experience a stress concentration due to the
sharp corner.

6
Individual comparisons between the old and new brackets revealed the vast
improvement. Comparison of the brackets was done by applying a 332.5 pound force
vertically down. Figure A.4 shows the vertical force and the restraints applied to each
bracket. The results from each simulation can be seen in Table 2.1. The old brackets
Table 2.1 Individual Bracket Comparison
Component Material Yield Strength (psi)
Max Stress (psi) FOS
Orig. Outboard LE 2024-T3 50000 37710 1.3 Orig. Outboard Aft 2024-T3 50000 43394 1.2
Orig. Inboard LE 2024-T3 50000 36458 1.4 Orig. Inboard Aft 2024-T3 50000 46234 1.1
New Outboard LE 7075-T6 73000 14625 5.0 New Outboard Aft 7075-T6 73000 14343 5.1
New Inboard LE 7075-T6 73000 14010 5.2 New Inboard Aft 7075-T6 73000 15241 4.8
had an average FOS of only 1.2 while the new brackets averaged 5.0. The individual
comparison illustrated the increase in strength of the new brackets.
2.2 Evaluation of Outboard Bracket Assembly
To evaluate the effects of proposed airfoil loading on the brackets a larger assembly was
created (Figure A.5). The assembly contained four brackets, two spars, four spar caps,
and a section of the aircraft skin. The model loads were applied to the system remotely,
eliminating the need to create a model, or simulate the pylon components. The first
remote loads were the lift and drag forces. They were applied to the radial surfaces of the
bolt holes. The weight was applied to remotely to the offset surface around the bolt hole,
simulating the nut plate (Figure A.6). The forces were assumed to be located
approximately 30 inches below the brackets, and were based on the location of the center
of pressure and CG of early airfoil models.
The sides of the assembly were held fixed, and each rivet hole was given two
restraints. The first restraint prevented radial motion, and the second prevented

7
translation normal to the surface. Figure A.7 shows that the restraints are identical to
those used in the individual bracket evaluation.
A standard mesh was used on the assembly with an element size of 0.25 inches.
The simulations were run using 84,574 elements and 161,420 nodes. The simulation
assumed that all components were bonded.
Analysis of the system revealed the system is capable of surviving the airfoil
loading. The lower trailing edge spar cap demonstrated the lowest FOS, 3.9. The stress
in the component is concentrated around the bolt hole in the base of the bracket (Figure
A.8). This can bee seen in each of the four brackets, and is responsible for the maximum
stress of nearly 18,000 psi in the outboard leading edge bracket (Figure A.9).
The remaining components saw significantly lower stress values compared to the
bracket, and had higher FOS. As Table 2.2 shows both the brackets and the aircraft
Table 2.2 Outboard Bracket System Stress Results
Component Material Yield Strength (psi)
Max Stress (psi) FOS
Outboard LE 7075-T6 73000 17889 4.1 Inboard LE 7075-T6 73000 15503 4.7
Outboard TE 7075-T6 73000 16329 4.5 Inboard TE 7075-T6 73000 14106 5.2
LE Spar 2024-T3 50000 6966 7.2 LE Spar Cap (Upper) 2024-T3 50000 2488 20.1 LE Spar Cap (Lower) 2024-T3 50000 10077 5.0
TE Spar 2024-T3 50000 6977 7.2 TE Spar Cap (Upper) 2024-T3 50000 2131 23.5 TE Spar Cap (Lower) 2024-T3 50000 12673 3.9
Skin 2024-T3 50000 10371 4.8
structure have fairly large factors of safety. Had the original brackets been left in place it
was quite unlikely that they would have been able to endure the airfoil loading.

8
CHAPTER III
MOUNTING STRUCTURE
3.1 Explanation of Mounting Structure
Allowing for the model to interface with the bomb rack, the mounting structure serves a
unique role. Most of the mounting structure (Figure A.10) was designed by Timothy
Silverman (2005) and the final structure (Johnson) changed very little from his design.
The mount which is composed of two pieces, a channel and alignment component, must
be rigidly attached to the model, yet allow for the angle of attack of the model to vary
between -5° and 5°.
The alignment component is simple. Its only tasks are to interface with the rocker
arms and the bomb rack. Interfacing with the rocker arms is done via the two angled
faces on the inboard and outboard side. The rocker arms can easily press against these
surfaces locking the airfoil in place. The interface with the bomb rack is accomplished
through two eyebolts (Figure A.11). These eyebolts, each with a 5000 pound load limit,
are recessed into the component and bolted through the top of the mount.
The channel is not as simple as the alignment component. A series of holes and
arcs (Figure A.12) have been cut through the part allowing for fasteners and wires. The
component was also designed to allow for instrumentation to be mounted aft of the main
bolt if necessary.
There are eight arcs that are all concentric with the main bolt hole. These arcs lie
above 10-32 tapped holes in the model and allow for fasteners to pass through the
mount, steel plate, and into the model (Figure A.13). The arcs allow for the required 10°
range of motion. These fasteners helped to ensure that the mount is rigidly attached to
the model.

9
The slot cut in the front of the model facilitates the ability to change angles of
attack (Figure A.14). The slot lies above a second slot cut in the model, but is
perpendicular. A pin can be placed through the two intersecting slots and mated to a
block on a section of ¼-28 threaded rod. With thread locking nuts and thrust bearings on
each end of the rod, it is possible to turn the rod and allow the block to travel along the
length of the rod. As it travels the two slots must rotate to allow for the movement. This
movement causes the angle of the model with respect to the mount to vary from -5° to
5°.
Behind the slot is a ½ inch arc. This arc allows for a ½-20, grade-8 bolt to pass
through the model and mount. This bolt, referred to as the support bolt is used to relieve
some of the force exerted on the main bolt. The head of the bolt is inside the model and
Figure A.15 illustrates the flat surfaces on the threaded end that are required to preload
the connection.
Aft of the support bolt a 2 inch diameter hole was cut (Figure A.16). This hole
has no structural purpose and was designed to allow for wiring to exit the model. By
selecting such a large diameter it is possible to allow for a variety of plugs to be passed
through the opening without needing to disassemble the model.
The final hole is the clearance hole for the main bolt. Designed to be in line the
CG of the model the main bolt is a ¾-10, grade-5 bolt. Designed to withstand severe
loading the main bolt represents the strongest connection in the system. The bolt is
aligned with the axis of rotation of the model and is secured in place using a jack bolt
(Figure A.17) to ensure accurate preloading. Further discussion concerning the safety of
the bolted connections can be found later.

10
CHAPTER IV
AIRFOIL MODEL DESIGN 4.1 Preliminary Design
Design of the airfoil model began by creating as many concepts as possible. From these
early concepts four models began to emerge. Two of these models, the pocketed model
and the shelled model, were based on a three-component design. These two were to be
fabricated from aluminum and included a leading edge, test surface and non-test surface
(Figure A.18). The composite model was a two-piece design that included an aluminum
leading edge and a composite body. The fourth design featured a substantial number of
components, each fabricated from aluminum. This design, the airframe model, was
based on traditional wing design.
The pocketed model features a 4 by 4 array of hollow cavities (Figure A.19) cut
into each half of the body. These pockets were separated by 0.1875 inch thick ribs and
spars. The skin thickness was also held constant at 0.1875 inches. At the intersection of
the ribs and spars a 1 in2 block was used to allow for fasteners to join the components.
An arc was cut into each rib and spar allowing for wiring to be run between any
combination of pockets.
The shelled model was an extension of the pocketed model. If there was no
structural need for these ribs, then their elimination would further lighten the model.
Figure A.20 shows the interior cavity of a shelled model with 15 support blocks. The
support blocks were used to secure the two halves of the body together and were 1 inch
by 1 inch extrusions. These extrusions matched those seen in the pocketed model.
Concerns over weight prompted the investigation into the use of lightweight
materials. The result was a composite model, whose body was made of fiberglass or

11
carbon fiber. The design featured a foam (Figure A.21) core although if it was hoped that
the fiber body could support all of the loading, allowing for the removal of the foam.
Like the other designs a removable leading edge would still be utilized.
The fourth design was based on a more traditional airframe design. The model
would be composed of rips and spars that matched the outer mold line, OML, of the
airfoil. A series of skin panels could then be secured to the rib and spar structure (Figure
22) forming the completed airfoil. Again the leading edge would be a stand alone
component. Unlike traditional airframe design each component would be significantly
thicker. The thicker components would eliminate much of the flexibility associated with
airframes as well as allowing the structure to handle the aerodynamic loads.
4.2 Preliminary Decision Analysis
In order to simplify the numerical modeling of the models a simple decision analysis
was used to reduce the four designs down to two. The analysis focused on five criteria:
the ability to meet test requirements, weight, design complexity, cost, and maintenance.
Each criterion was assigned a weight-factor that indicated its importance to the design
process. The weight and ability to match test requirements were the most important
while the maintenance of the model was the least important.
The ability to meet requirements included the ability to integrate pressure taps
into the surface of the airfoil. Previous models indicated that there was little problem
integrating the taps into an aluminum structure, but there was concern over the ability to
create a smooth interface between a composite surface and the pressure taps. For this
reason the composite model received the lowest value of the four designs. The airframe
model also received a low mark due to the complexity associated with running all the
necessary pressure lines around all of the various components. The pocketed and shelled
models were given identical values in that they are both essentially the same three-
component model, in terms of test requirements.
The weight reflects the designed weight of each model. The composite model
received the highest ranking from the lightweight materials used to create the body of

12
the model. Although not as light as the composite model the shelled model represented
the lowest weight of any completely metal design. The airframe and pocketed models
had nearly the same weight and were given equal ratings.
Complexity was responsible for the termination of the airframe design. With so
many components hundreds of fasteners would be needed to join all of the components
together. The variety of pieces also required that the tolerances on each piece be quite
small to eliminate gaps after assembly. The composite model also received a low rating
primarily due to the fact that the entire body was a single component. Although this
would simplify assembly it would make fabrication difficult.
The cost of each model was based on any foreseeable manufacturing difficulties.
The low rating on the composite model was driven by the need for a large composite
airfoil with tight tolerances. Creating a composite structure nearly 4 ft by 3.5 ft was not
likely to be an economical process. The airframe model received high marks since the
majority of the components are small enough for an average machine shop to handle.
The pocketed and shelled models by comparison require that two large aluminum
components be fabricated.
Maintenance of a design is an indication of the ability to replace components
should they become damaged. With the pocketed, shelled, and composite model being
fabricated from only a few components, replacing any part would be a costly process.
The airframe model was an exception. While some components would still be expensive
to replace leading edge or test side skin, many other components could be fabricated
quickly and at a lower cost.
Putting this information into the decision analysis reveals that the shelled and
pocketed models were significantly better designs. Table 4.1 reveals that their

13
Table 4.1 Preliminary Decision Analysis
Pocketed Shelled Composite Airframe Criteria Weight R V R V R V R V Test Req. 9 9 81 9 81 1 9 5 45
Weight 8 3 24 7 56 10 80 3 24 Complexity 6 6 36 6 36 3 18 1 6
Cost 4 3 12 3 12 1 4 8 32 Maintenance 2 3 6 3 6 1 2 8 16
Sum 153 Sum 185 Sum 111 Sum 107
dominance in terms of test requirements and complexity far outweighed their poor
ratings in categories such as maintenance. The next step in the design process required a
numerical analysis of both the pocketed and shelled models to determine which design
would ultimately be fabricate.
4.3 Numerical Modeling of Early Designs
With the mounting structure conceived the two dominant designs could be numerically
evaluated. With the mounting structure incorporated into each airfoil design an identical
set of restraints and loads were applied to each assembly. Following the analysis of each
design a second decision analysis would be used to determine which design would be
finalized and fabricated.
Applying the restraints (Figure A.23) to the assemblies began with two restraints
placed on split surfaces on the inboard side of the mounting structure. These two
surfaces were prevented from moving in the radial direction, simulating the effect of the
rocker arm assemblies of the pylon. There were no restraints placed on the two outboard
split surfaces as the lifting load would pull the model away from those rocker arms
preventing any reaction. The other restraints were applied on the top of the alignment
component. These restraints prevented normal motion as well as radial motion,
replicating the effects of the eyebolts.

14
During frequency analysis all four rocker-arm locations were restrained. With the
model oscillating, all four rocker arms would resist motion, not just the inboard or
outboard side. The eyebolt restraints would remain the same during frequency analysis.
The loading was applied to the model with three forces (Figure A.24). The lifting
force was applied along a split line at 30% chord, which had been determined to be the
center of pressure of the airfoil. The drag was applied along the trailing edge of the
model. The weight of the assembly was applied by using the gravity feature of
COSMOSWorks. The acceleration was set at 772.2 inches/sec2, to simulate a 2G
maneuver.
The models would be compared based on worst case loading. When the
comparison was done this loading was much more severe than was discussed in section
1.3. Early CFD modeling indicated that the 7° maneuver would create 1600 pounds of
lift and 120 pounds of drag. Coupled with twice the weight, many of the early models
were evaluated with this load set.
4.3.1 Evaluation of Pocketed Model
The first of the designs to be evaluated was the pocketed airfoil. The mesh used during
the simulations was based on an element size of 0.67 inches with a control of 2 inches on
the outer surface. The result was a mesh of 296,725 nodes and 169,911 elements. Table
4.2 illustrates the results of the simulation. With a minimum factor of safety of
Table 4.2 Pocketed Model Stress (Maximum Loading)
Component Material Yield Strength (psi)
Max Stress (psi) FOS
Leading Edge 6061-T6 40000 622 64.3 Test Surface 6061-T6 40000 8396 4.8
Non-Test Surface 6061-T6 40000 4762 8.4 Channel 7075-T6 73000 16091 4.5
Alignment Comp. 7075-T6 73000 38795 1.9

15
1.9 the model demonstrated an adequate ability to handle the worst case scenario. Aside
from the alignment component all of the other parts had factors of safety above 4.0
indicating that the majority of the components could easily endure the worst case
loading. The maximum stress, 38,795 psi, appeared in the region around the leading
edge eye bolt location.
Examining the deflection of the model revealed a very uniform deformation
(Figure A.26). The base of the model had shifted little more than 0.15 inches during the
loading. More importantly the middle of the airfoil had an even deformation of
approximately 0.08 inches. With most of the testing focusing on this region a consistent
uniform deformation was ideal.
A second simulation determined that the natural frequencies of the pocked model
were outside of the engine RPM and blade passing frequencies. With a frequency of 51.7
Hz it appeared as though the model’s lowest frequency would occur between the two
ranges to avoid. Aside from the first two frequencies, Table 4.3 shows that the higher
modes are significantly higher than any expected oscillation.
Table 4.3 Natural Frequencies: Pocketed Model with Mounting Structure
Mode Period (sec) Frequency (Hz) 1 0.0193 51.7 2 0.0085 117.6 3 0.0075 132.7 4 0.0036 276.9 5 0.0029 350.3
4.3.2 Evaluation of Shelled Model
Analysis of the shelled airfoil began in the same fashion as the previous assembly. A
mesh was created based on an element size of 0.67 inches with a 0.5 inch control on the
leading edge and a 2 inch control on the outer surface. This created an assembly using
188,264 nodes and 100,347 elements.
The results of the maximum loading, seen in Table 4.4, again revealed that the
lowest FOS of the shelled airfoil was 2.0. The value is again the result of a stress

16
Table 4.4 Shelled Model Stress (Maximum Loading)
Component Material Yield Strength (psi)
Max Stress (psi) FOS
Leading Edge 6061-T6 40000 2924 13.7 Test Surface 6061-T6 40000 13328 3.0
Non-Test Surface 6061-T6 40000 11995 3.3 Channel 7075-T6 73000 10253 7.1
Alignment Comp. 7075-T6 73000 35075 2.1
concentration around the leading edge eye bolt location. Figure A.27 also shows a region
of stress developing between the leading edge of the mounting structure and the airfoil.
Unlike the pocketed model the three model components exhibited much lower factors of
safety. Although these values were not close to the limit of 1.5 each of these components
were subjected to a great deal more stress in this design.
The deflection of the shelled model also exhibits an undesirable characteristic of
the shelled design. The skin of the airfoil appears to bulge (Figure A.28) near the
application of the lifting load. The magnitude of this deflection was approximately 0.21
inches, and was nearly located in the middle half of the airfoil test surface. The
simulation revealed that the deflection of the shelled airfoil would not be as uniform as
the pocketed model.
The lack of interior structure was responsible for the significantly lower natural
frequencies of the model. The lowest frequency, 44.2 Hz, fell inside of the engine RPM
range, and the second frequency, 89.7 Hz, was located in the range of the blade passing
frequency. Both values were nearly above the ranges to avoid, and noting that
COSMOSWorks tends to return conservative values may have indicated that the true
values were safely outside of this range. Again it is seen in Table 4.5 that modes higher
than 2 are well above expected values.

17
Table 4.5 Natural Frequencies: Shelled Model with Mounting Structure
Mode Period (sec) Frequency (Hz) 1 0.0226 44.2 2 0.0111 89.7 3 0.0082 122.5 4 0.0073 136.4 5 0.0069 145.1
4.4 Control of Airfoil Center of Gravity
During the evaluation of both the designs there were growing concerns over the CG
location of the airfoil model. Flight tests with the aircraft revealed that an aft aircraft CG
degraded the stability of the aircraft. It was also believed that flutter could be avoided if
the CG of the airfoil model was located in front of the elastic axis of the aircraft. The
elastic axis of the aircraft was assumed to be 40% chord. In order to minimize the effect
of the large lifting force it was also hoped that the airfoil center of pressure could be
located inline with the aircraft CG.
Aligning the model center of pressure with the aircraft CG was accomplished by
setting the mounting distance to 12 inches. This distance is the distance from the leading
edge corner of the airfoil model to the leading edge of the aircraft wing. By setting the
value to 12 inches it also served to move the airfoil model’s CG in front of the elastic
axis.
Unfortunately, pushing the mounting location forward only resulted in a couple
of inches of clearance between the model CG and the elastic axis. In order to increase
the clearance a counter weight was added to the upper corner of the leading edge in the
shelled design. By adding 20 pounds of weight the CG moved an additional 4.5 inches
further in front of the elastic axis (Figure A.29). Adding 20 pounds had a significantly
lower effect on the pocketed model (Figure A.30) as its prior weight was nearly 40
pounds greater. A more detailed examination into flutter concerns is discussed following
the airfoil design.

18
4.5 Intermediate Decision Analysis
The numerical results from the simulations along with the plan to use an insert to control
the CG were used to again compare the two models. This time the criteria used to
differentiate between designs would include safety, weight, stiffness, deflection and
adaptability. Safety was always the highest weighted category and the deflection was the
lowest.
Ratings for safety were based on the numerical results of the two models under
the maximum loading scenario. The rating takes into account the minimum FOS as well
as the FOS for each component. The similar numerical results for both designs resulted
in identical ratings. While the shelled model exhibited a higher FOS, the pocketed design
had much lower stress values in the three model components.
The only changes in the weight that occurred since the previous decision analysis
were the addition of the mounting structure, and insert. Since identical components were
added to both assemblies the difference in weight remained the same. With a difference
of nearly 50 pounds, 126.15 to 179.34 pounds, the shelled model received a significantly
higher rating.
The pocketed model exhibited a much better frequency response, with no natural
frequencies inside the two ranges to avoid. Consequently it received a high rating, while
the shelled model struggled. Having two frequencies inside of the avoided ranges
signaled that further design may be necessary dropping its rating.
Although the deflections of both models is quite small, below 0.25 inches, the
uniform deformation of the pocketed model was seen as being much more advantageous
than the bulging surface of the shelled model.
The final criterion, adaptability, was in response to the need to control the model
CG. With a lower starting weight it would take smaller counterweights to shift the
shelled CG to a desired location. This would allow for a variety of smaller
counterweights to be fabricated allowing for a great many different CG possibilities.
The results of the analysis, seen in Table 4.6, revealed that the shelled model was
the superior design. Its low weight and ability to adapt to a variety of situations

19
Table 4.6 Intermediate Decision Analysis
Pocketed Shelled Criteria Weight R V R V
Safety 10 5 50 5 50 Weight 8 4 32 9 72
Stiffness (Freq) 5 7 35 4 20 Deflection 2 8 16 2 4
Adaptability 4 3 12 7 28 Sum 145 Sum 174
propelled the design ahead of the pocketed model. Confirming the safety of the design
after adding an insert was done by rerunning the two simulations to obtain a new set of
stresses and natural frequencies. The results in Table 4.7 confirmed that an insert has
little effect on the overall characteristics of a design.
Table 4.7 Insert Effects on Stress Analysis
Shelled Model with Insert (Maximum Loading) Comp Material Yield Max. FOS
Leading Edge 6061-T6 40000 2875 13.9 Test Surface 6061-T6 40000 13696 2.9
Non-Test Surface 6061-T6 40000 12160 3.3 Insert Alloy Steel 90000 4930 18.3
Channel 7075-T6 73000 10092 7.2 Alignment 7075-T6 73000 35437 2.1
Pocketed Model with Insert (Maximum Loading) Comp Material Yield Max. FOS
Leading Edge 6061-T6 40000 581 68.8 Test Surface 6061-T6 40000 8506 4.7
Non-Test Surface 6061-T6 40000 4799 8.3 Insert Alloy Steel 90000 120 748.1
Channel 7075-T6 73000 16491 4.4 Alignment 7075-T6 73000 39168 1.9

20
4.6 Finalization of Airfoil Design
4.6.1 Structural Changes to Airfoil
Discussions with the manufacturer (Gideon) revealed a major fabrication concern. The
shelled model would take far longer, and cost much more to fabricate than originally
hoped. With a smooth inner cavity, and a wall thickness of only 0.1875 inches
machining would have to be done slowly with precision tooling. This process was
expected to at a minimum double the cost and manufacturing time for the model. In
order to reduce the machining time and cost it was suggested that the design be revised
to include flat surfaces that could be machined with large face mills. It was also advised
that the thickness of the model should not drop below the 0.1875 inch thickness.
In order to minimize the weight of the airfoil while complying with the
machining requirements the once smooth inner cavity was replaced by a series of 2 inch
steps. Each step would have a minimum thickness of 0.1875 inches and have a surface
parallel to the seam between the two halves of the body. In addition to the steps, several
supports were added to the structure. These supports, similar to ribs, would not create a
solid region, but were added to retain some level of resistance to deflection. A cut away
view of the proposed design (Figure A.31) clearly shows the newly devised design. All
of these changes to the model dramatically reduced the machining time and cost, but also
added a great deal of weight to the model.
Other fabrication changes made to the model included the leading edge. For
similar reasons the component could not be smoothly shelled, but rather a series of steps
would be created inside the component (Figure A.32). The sweep angle made it difficult
to machine the inside of the upper corner, and it was therefore left solid. The solid corner
does not take away from the design as it leave metal in the region where a counterweight
was to be added.
The final changes to the design included the addition of steel plates (Figure A.33)
to the top and bottom of the airfoil. These plates allowed for additional fasteners to joint
the two halves together. The upper plate also prevented the sharp edges of the mounting

21
structure from digging into the softer aluminum airfoil. One of the lower plates would
also be used to create an attachment point for a strut to be added to the back of the
model. While tremendously useful the plates did add 17 pounds to the overall weight of
the structure.
4.6.2 Numerical Evaluation of Stepped Model
Obtaining numerical results on the stepped model followed the same procedure as the
previous designs. A mesh was created based on an element size of 0.5 inches, creating
an assembly with 451,553 nodes and 249,489 elements. All forces and restraints were
applied in a similar fashion to the previous simulations. The results (Figure A.34)
showed that the stepped model was also capable of withstanding the maximum loading
with a FOS of 1.9. Again the minimum FOS occurs around the leading edge eye bolt.
Table 4.8 shows that all of the other components easily passed with individual factors
Table 4.8 Stepped Model Stress (Maximum Loading)
Component Material Yield Strength (psi)
Max Stress (psi) FOS
Leading Edge 6061-T6 40000 3148 12.7 Insert Alloy Steel 90000 2808 32.0
Non-Test Surface 6061-T6 40000 8781 4.6 Test Surface 6061-T6 40000 11329 3.5
Trailing Edge Strip 6061-T6 40000 1039 38.5 Strut Plate 17-4 H-1025 170000 1306 130.2
Lower Plate 17-4 H-1025 170000 2528 67.3 Upper Plate 17-4 H-1025 170000 13228 12.9
Channel 7075-T6 73000 11037 6.6 Alignment Comp. 7075-T6 73000 37901 1.9
of safety above 3. The structure of the stepped model was also sufficient to prevent the
bulging effect (Figure A.35) seen in the shelled model.
The greatest surprise of the evaluation was the frequency response of the model.
The natural frequencies of the stepped model, Table 4.9, were far below the

22
Table 4.9 Natural Frequencies: Stepped Model with Mounting Structure
Mode Period (sec) Frequency (Hz) 1 0.0257 38.9 2 0.0102 97.7 3 0.0091 110.0 4 0.0059 169.2 5 0.0050 201.7
values of the other designs. Further investigation into flutter had revealed that a 40 Hz
natural frequency would be sufficient to alleviate concerns.
4.6.3 Final Decision Analysis
Comparing the most recent design to the previous two models revealed the superiority of
the design. Table 4.10 illustrates the narrow margin separating each design. The cost
Table 4.10 Final Decision Analysis
Pocketed Shelled Stepped Criteria Weight R V R V R V
Safety 10 5 50 5 50 5 50 Weight 8 6 48 9 72 3 24
Cost 9 3 27 1 9 9 81 Stiffness (Freq.) 5 8 40 5 25 6 30
Deflection 2 6 12 4 8 7 14 Adaptability 2 2 4 4 8 6 12
Sum 181 Sum 172 Sum 211
of each design was added as an additional criterion, and the definition of adaptability
was changed. Since the concerns over flutter had been eased there was not a strong
desire to have a large range of CG locations. Instead it was more advantageous to have a
model that could allow for a variety of instrumentation to be mounted internally. This
equipment included accelerometers and pressure scanners.
The results of the analysis revealed that the latest, or stepped, design was a
better-quality design. Although heavier, its inexpensive fabrication pushed the design

23
ahead of both the pocketed and shelled designs. The stepped model also benefited from
the flat surfaces and partial ribs throughout its structure. These features allowed for
instrumentation to be easily mounted and secured inside the cavity.
4.7 Re-evaluation of Maximum Loading
As was previously mentioned the worst case loading was re-evaluated resulting in a
reduction of nearly 33%. Reevaluating the stepped design with the new loads
demonstrated the dramatically lower stress values expected. Since the airfoil was already
being fabricated it was not possible to change the structure. The new loading did
however allow for a key change in the mounting structure. By reducing the loads by a
factor of three it was no longer necessary to fabricate the mount from aluminum 7075-
T6. Instead more economical aluminum 6061-T6 could be used. Table 4.11
Table 4.11 Stepped Model Stress (Revised Maximum Loading)
Component Material Yield Strength (psi)
Max Stress (psi) FOS
Leading Edge 6061-T6 40000 1081 37.0 Insert Alloy Steel 90000 963 93.4
Non-Test Surface 6061-T6 40000 3027 13.2 Test Surface 6061-T6 40000 3888 10.3
Trailing Edge Strip 6061-T6 40000 356 112.4 Strut Plate 17-4 H-1025 170000 461 368.8
Lower Plate 17-4 H-1025 170000 871 195.2 Upper Plate 17-4 H-1025 170000 4382 38.8
Channel 6061-T6 40000 3831 10.4 Alignment Comp. 6061-T6 40000 13902 2.9
illustrates that by using a weaker material the reduced loading resulted in an increased
FOS of the system to 2.9. The values for the individual components also soared. Outside
of the alignment component no part was returning a FOS below 10. Recalling that these
values are calculated to the yield strength and not the Air Force required ultimate
strength clearly shows the safety of the design.

24
CHAPTER V
EXPLANATION OF FLUTTER CONCERNS 5.1 Development and Resolution of Flutter Concerns
One of the large concerns facing the design of a large test platform designed to hang
from an aircraft wing is flutter. Flutter can be defined as a potentially destructive result
of increase oscillation due to aerodynamic loading.
In order to decrease the risk of flutter the design needed to place the CG of the
airfoil model in front of the elastic axis of the wing. At the time the elastic axis was
believed to be at the 40% chord location of the wing. To accommodate this request the
CG of the model need to be shifted forward. As previous sections have shown,
counterweights could easily shift the airfoil CG to a suitable location.
All of these concerns would be eliminated after learning that the actual elastic
axis of the aircraft is close to 25% chord. This was likely due to the fact that the support
strut is tied into the front spar of the wing. With the elastic axis so far forward there was
no way that the CG of the airfoil could be moved in front of this value. The forward
location also meant that all munitions designed to be carried had CG’s located beyond
the elastic axis as well.
Even though the location of the airfoil CG with respect to the elastic axis was no
longer a concern there were still concerns over the airfoils natural frequencies. The
models appeared to have at least one frequency that was near the limit of either the
engine RPM or the blade passing frequency. Reviews of the flutter report completed by
the Cessna Corporation revealed that the primary flutter mode was observed at nearly 6
Hz. This mode involved the tail and boom structure of the aircraft. The report also noted

25
that the flutter characteristics of the aircraft were nearly independent of both fuel load
and wing stores.
In order to verify the safety of the aircraft a conservative flutter flight test was
planned (Saric, et al. 2006). In addition to this flight test the model would undergo an
engine run up test prior to its first flight. This test would allow for the model to be
visually inspected as the engine is swept through a variety of RPMs. Along with the
visual inspection the model was flown with accelerometers during its early flights to
ensure that there was no growing oscillation within the structure.

26
CHAPTER VI
ROCKER ARM AND PYLON ASSEMBLIES 6.1 Recognition of Potential Problem in Rocker Arm Assembly
Examining the simulations of the model and mounting structure exposed a dangerous
situation at the restraints (Saric, et al. 2006). Those surfaces restrained to simulate the
presence of a rocker arm, returned incredibly high reaction forces. In some simulations
the resultant reaction force approached 2000 lbf. The final simulations on the stepped
model with reduced loads returned reaction forces on the leading edge and trailing edge
rocker arms of 1232 and 949 lbf respectively. With such a large force it was not possible
to assume that the original rocker arms would be capable of withstanding the load.
Verifying the safety of the rocker arms began in a similar fashion to other aircraft
systems. A model of the assembly was created (Figure A.36) as carefully as possible.
This process revealed the first potential problem of the assembly, the weld on the C-
channel. Only a few of the C-channels contained a reliable weld (Figure A.37). Most
were quite poor, and there was no way to determine the effectiveness of the weld. The
simulated assembly would use a variable radius fillet, but there was no way to model the
actual part. It was also difficult to determine what materials were used to fabricate the
original parts. Without knowing the true material any results would be based on a level
of speculation.
6.2 Numerical Evaluation of Original Assembly
Applying the largest reaction forces to the pad at the base of the rocker arms revealed
just how dangerous the system was. These forces were considerably greater than the
final values as the simulations were conducted prior to the knowledge of the reduced

27
loading. Even without knowing the actual material, the maximum stress, 613,730 psi,
was far beyond any likely material. Having made the assumption that the components
were fabricated from steel with yield strength of 90000 psi, Figure A.38 shows large
portions of the assembly that failed to achieve a FOS of 1.0. Among the most critical
regions were the arm between the C-channel and the pylon. With four holes for
adjustment the part was simply too weak to be able to survive the loading. It was also
observed that the C-Channel had significant regions of failure.
6.3 Improvement of Rocker Arm Assembly
The results indicated that the original rocker arm assemblies could not be safely used
with the airfoil model. In order to correct the failures of the original system a new
system was designed (Figure A.39). This new system would rely on newly fabricated C-
channels and arms to increase the FOS of the system above the mandatory value. These
new components were fabricated from 17-4 PH condition H-1025 stainless steel. Using
this material the yield strength of the new components was known to be 170000 psi.
The C-channel was fabricated from a solid block eliminating the need for a weld.
Leaving a rectangular block that blended into the channel using a constant radius fillet
produced the threaded section. The walls of the channel were thicker than its predecessor
in an attempt to eliminate the large stress values seen in the previous design.
The redesigned arm focused on eliminating the need for multiple holes.
Modeling the mounting structure revealed that the third hole on the original arm was the
best option for mounting. Using this knowledge a new arm was created. The arm had the
same profile, but only two holes, one to attach to the pylon and one to attach to the
channel. Similar to the channel the arm was also fabricated to be thicker than the original
component.
Simulating the new components revealed that the rocker arm system was
significantly improved. The new components increased the FOS to 3.1. While the
simulation cleared the rocker arm for use there was still a degree of uncertainty in the
system. The material of the elevator bolt was still unclear, as well as the interaction

28
between the rocker arm assembly and the pylon. These doubts were eliminated after
performing a series of static load tests to verify the system prior to flight.
6.4 Potential Pylon Concerns
Between the rocker arms and the hard points in the wing is a pylon structure designed to
hold a bomb rack, and serve as the mating structure between any ordinance and the
aircraft. Composed almost entirely of sheet metal, concern over survivability began to
increase after learning about the intense forces acting on the rocker arms. These rocker
arms are incorporated into the design of pylon, and are bolted into thin internal ribs.
Modeling the pylon (Figure A.40) proved to be quite difficult. The sheet metal
components have dozens of holes of rivets, in addition to other openings. Due to the age
of the components many had become damaged, making it difficult to obtain dimensions.
There was also little knowledge as to what types of loading the pylon was designed to
withstand.
In order to plan ahead for any potential problems the pylon to be used for the
model, was reinforced (Saric, et al. 2006). First, the rivets that hold the C-channel to the
pylon body was replaced (Figure A.41) with steel rivets. Second, a small piece of sheet
metal was attached the side of the pylon skin (Figure A.42) to strengthen likely the
location of buckling.
The third step was developed, although it would not be needed. This step
included the replacement of the thin sheet metal ribs with solid blocks (Figure A.43).
These blocks would greatly increase the stiffness of the pylon, while allowing for a
much more rigid connection between the pylon and the rocker arm.
The concerns over the pylon would continue until the system successfully
completed both static load tests. Following their successful completion the changes to
the pylon assembly stopped. Prior to every flight the pylon is carefully inspected for any
damage.

29
CHAPTER VII
SUPPORT STRUT 7.1 Design of Airfoil Support Strut
In order to eliminate some of the force being placed on the rocker arm assembly,
as well as to stiffen the airfoil a strut was added to the back side. From the beginning the
design of the strut was focused around the idea that the system should be fabricated in
house with a minimum amount of outside fabrication required. By eliminating custom
fabrication the strut profile began to fall to two separate profiles (Figure A.44). One was
a Cessna 172 strut and the other a fairing available through an aircraft supply company.
The Cessna strut was considerably larger than the fairing profile, but the newly
determined maximum loads reduced the required size of the profile. In addition to the
reduced loads, there was no clear source for the Cessna strut. Although Cessna struts
could be purchased used, the lack of knowledge concerning the struts history did not
make this an attractive option. As a result the decision was made to move forward with
the fairing profile, until it could be proven unsafe.
Complicating the strut design was the need to accommodate the potential change
in model angle of attack. By turning the model the attachment point on the model shifts
considerably, causing the angle and length of the strut to change. The change in angle
was overcome by placing a ball joint at each connection point (Figure A.45). The ball
joint would offer more than enough range of motion, and be strong enough to serve as
the link between the strut and the mounting points.
By allowing for one part to be replaceable after changing angle of attack it was
possible to overcome the changing length. All of the fastener locations at the tie down
point would be fixed. This included the insert and the bolt pattern joining the insert to

30
the strut. At the model mounting point the strut would have a similar bolt pattern, but the
insert (Figure A.46) would not be drilled until the system was assembled on the aircraft.
In this way any dimensioning error would be allowed to stack up at this single point and
be taken into account before the final fabrication steps. The process required that unique
insert be made for each angle of attack. Since the profile of the insert does not change,
only the location of the bolt holes several blanks were made prior to flight so that
fabrication time would be minimized should the angle of attack be changed.
The fabrication of the strut revealed a unique problem. With a ball joint at either
end of the strut, the component was free to rotate about the axis between the ball joints.
The solution of the problem was solved by Shane Schouten, who observed that the ball
joints have a nut incorporated into their design. By placing a small plate around the nut
and attached to the mounting block the rotation was restrained.
7.2 Numerical Evaluation of Strut Design
Evaluating the strut design would prove to be a difficult process. Integrating the
assembly into the model assembly created a situation that quickly surpassed the memory
of the computer. Attempting to create a mesh over such a large part that also featured
thin components became futile. In an effort to work around this problem the strut
assembly was evaluated without integration into a larger system.
Without the model in the assembly it was necessary to obtain two pieces of
information to evaluate the strut. First it was necessary to know what forces were acting
on the strut at the model attachment point, and the second piece of information was the
displacement of the strut. With these aspects known they could be applied to the strut
assembly, simulating the effect of the model. The strut displacements were determined
by taking the average deflection of the rectangular extrusion during simulations of the
airfoil and mount with out the strut. The forces were determined by rerunning the airfoil
simulations with a fixed restraint placed on the rectangular extrusion. The deflections
and forces would then be applied to the same location in the strut assemblies.

31
While neither the deflections or forces represent the true values they can both be
seen as approximations. The deflections being used are well below an inch, often times
below 0.10. It was unlikely that the addition of the strut would radically change these
values.
The force is a conservative value in that there was no chance the strut could see
larger values than the ones applied. Since the strut cannot hold the base of the model
fixed the actual forces at the attachment point would be less than those returned with the
fixed restraint.
After applying the deflections and forces to the rectangular extrusion at the base
of the assembly, restraints were applied to the top (Figure A.47). Two restraints were
applied to the tie down block, the first prevents the top surface from moving in the
normal direction and the second prevents the bolt hole from moving radially. These two
restraints simulate the effect of the bolted connection between the strut and the tie down
bracket attached to the spar.
7.2.1 Stress Analysis of Strut Assembly
Evaluating the strut assembly began by applying the reactions from the airfoil simulation
with maximum loading. The results in Table 7.1 show that the majority of stress in the
model is located around the ball jointed connections. While the maximum
Table 7.1 Strut Stress (Revised Maximum Loading)
Component Material Yield Strength (psi)
Max Stress (psi) FOS
Mounting Plate 6061-T6 40000 1261 31.7 Model Block 6061-T6 40000 12567 3.2 Lower Shank Bearing Steel 295000 17492 16.9
Lower Ball Bearing Steel 295000 23804 12.4 Lower Insert 6061-T6 40000 9139 4.4
Strut 6061-T6 40000 3506 11.4 Upper Insert 6061-T6 40000 14725 2.7
Upper Ball Bearing Steel 295000 33104 8.9 Upper Shank Bearing Steel 295000 17493 16.9
Tie-Down Block 6061-T6 40000 12897 3.1

32
stress occurs in the ball joints (Figure A.48) the lowest factor of safety is found in the
upper insert. The value of 2.7 is still well above the limit of 1.5 to yield and substantially
above the air force required 1.5 to maximum.
7.2.2 Buckling Analysis of Strut Assembly
The strut is a long slender component and was therefore subject to buckling. In order to
verify that no loading condition could cause such a situation a buckling analysis was
done on he assembly. The analysis used results from a reverse loading scenario. Positive
angles of attack would cause the strut to be placed in tension and would therefore
prevent buckling. If the model were subject to negative angles of attack then loading
would be oriented correctly for buckling to occur.
Knowledge of the airfoil indicated that at negative angles of attack the airfoil is
only about 50% as efficient. With this knowledge a reverse set of loading was created
using values for lift and drag of 275 pounds and 40 pounds respectively. The final load
would again be the weight of the model and a comparison of values revealed that the 2G
scenario was actually worse than 0.5G.
These loads were first applied to the airfoil models to obtain an approximate set
of displacements and loads to employ on the strut assembly. With these values in place a
buckling analysis can be run, and a buckling load factor (BLF) can be determined. The
buckling load factor is the ration between the critical load, and the actual load. This ratio
needed to be above 1.5 to agree with the required FOS. Completing the analysis revealed
that the BLF for the strut was 3.7. The value was above the 1.5 required and fabrication
of the strut began.

33
CHAPTER VIII
TIE-DOWN LOCATION 8.1 Evaluation of Tie-Down Bracket
With a strut in the design an additional aircraft component was thrust into the design
process. One end of the strut interfaced with the tie down located further outboard of the
model. Unlike the brackets examined previously the tie down location had no
replacement components.
Examining the tie-down bracket revealed that it was not identical to the brackets
used in the hard points. The tie-down bracket was made of thicker sheet metal, and also
had a section of L-channel (Figure A.49) attached to its inboard side. It is likely that
these differences result from the fact that the tie down bracket must be able to keep the
aircraft stationary in severe weather.
The modeling of the bracket was similar to that of the four-bracket system, in
that a section of skin and spar was used in the simulation. Assuming the rivets used to
secure all of the components in the assembly were critical, the decision to use a node-to-
node analysis (SolidWorks 2004) was used. This decision would require that the rivets
be included in the simulation. Due to the fact that running a node-to-node analysis is
extremely time consuming, it was decided to only include the rivets attaching the bracket
to the L-channel and any component attached to the spar. Any other connection was
assumed to be bonded.
The only restraints applied to the system were fixed restraints on the cut surfaces
of the spar, skin, and spar caps. These restraints assume that the assembly is a small
section of a larger system, and that the overall system is not affected by the strut loading.
The loads applied to the system came directly from simulations of the strut assembly.

34
The reaction forces at the tie down bolt location were applied to corresponding surfaces
in the tie down assembly.
Results of the simulation revealed that the tie down assembly was capable, FOS
4.8, of withstanding the loading caused by the strut. The results in Table 8.1 revealed
Table 8.1 Tie-Down Assembly Stress Analysis
Component Material Yield Strength (psi)
Max Stress (psi) FOS
Tie-Down Bracket 2024-T3 50000 10405 4.8 L-Channel 6061-T6 40000 6340 6.3
Spar 2024-T3 50000 9915 5.0 Upper Spar Cap 2024-T3 50000 5521 9.1 Lower Spar Cap 2024-T3 50000 5902 8.5
Upper skin 2024-T3 50000 2275 22.0 Lower Skin 2024-T3 50000 7292 6.9
that the tie down bracket was by far the weakest component. With the factor of safety
knowledge it was determined that there was no need to replace the bracket at the tie
down location.

35
CHAPTER IX
EVALUATION OF BOLTED CONNECTIONS IN THE MOUNTING STRUCTURE
9.1 Preloading of Model Fasteners
There are a variety of fasteners that join the airfoil components together. Each of these
bolts was given an assigned torque to ensure the safety of the system. An analysis for
determining the safety of the bolted connections in the mounting structure was outlined
by Timothy Silverman (2005) in his report. An identical analysis will be used to
demonstrate the safety of the mounting structure in its final form.
The bolts joining the two main halves of the airfoil are ¼-28 socket head cap
screws. Each of these eleven bolts is torqued to 180 lb*in. The individual weights of
either half is not sufficient to shear even one bolt, indicating that there is little chance of
all eleven failing in shear. The bolted connections could separate under the lifting force
if it is greater than the preload. Using
(9.1) iT KF D=
and the assumption that K≈0.3 for fasteners with a black oxide finish (Mischke, et al.
2002), it is possible to determine the approximate preload of each bolt to be 2400 lb.
With the lifting force distributed over each fastener this indicates only 50 pounds per
fastener, well below the preload value.
The leading edge is held in place by a series of seven ¼-28 socket head cap
screws which enter through the non-test side of the leading edge, pass through both of
the main half components and thread into the test side of the leading edge. These bolts
are torqued to only 70 lb*in. The dramatic decrease in torque is a result of the hollow
airfoil structure. During inspection of the airfoil it was observed that by increasing the
torque on the leading edge fasteners one could compress the components, and create a

36
significant deflection. To avoid deforming the airfoil shape and also allowing for
allowing for repeatable torquing the value was set significantly lower. Using (9.1) it is
observed that even with the lower value each bolt is still applying over 900 pounds of
clamping force.
The 10-32 screws and bolts fastening the plates to the model are all torqued to 25
lb·in. Failure in these regions would likely be a result of loosening due to vibration. The
fasteners are not needed to overcome any of the torques or loads produced by the lift or
weight of the model.
The two components of the mount are fastened together by 5/16-24 bolts torqued
to 110 lb·in. The most probable cause of failure in the joint is the separation of
components due to a 2G maneuver. With each bolt applying over 1900 lbs of clamping
force there is almost no chance that the 440 pounds of weight experienced would result
in failure.
9.2 Bolt Analysis of Mounting Structure
The original design of the mount was based around a maximum lifting condition of 120
lb. From this, Silverman (2005) designed a system which relied on a main bolt to
overcome joint failure. Any additional hardware was auxiliary. His analysis showed the
ability of the main bolt to survive the three most likely failures of joint prying, joint
sliding, and model rotation. A similar approach will be used to demonstrate the safety of
the final design.
The preload on the main bolt must be greater than the forces acting upon it
(Bickford 1981). If this condition is not met the joint will separate and likely fail.
Determining the forces acting on the main bolt is done by multiplying the aerodynamic
forces by an appropriate lever arm and then dividing by the distance the main bolt is
from rotation. The lift force is centered approximately 21 inches below the bolt and the
model half span is 3 inches. Using a maximum lift of 550 lb creates 3850 lb acting on
the bolt. The drag is also located 21 inches below the bolt, and the trailing edge of the
mount is 11.18 inches behind the bolt. With 40 lb of drag the force on the bolt is 75 lb.

37
The weight of the model is in line with the bolt and therefore during a 2G maneuver the
force on the bolt is nearly 440 lb. Summing the forces produces 4465 lb attempting to
separate the joint. The bolt is preloaded to 18400 lb resulting in a FOS of 4.1 against
joint separation.
Joint sliding is a measure of the shear force acting on the bolt. By determining
the resultant of the lift and drag, 551.5 lb, it is possible to determine the likelihood that
the forces will cause misalignment of the model. Assuming that the coefficient of
friction between aluminum and steel is approximately 0.3 the force required to break the
joint free can be found by (Bickford 1981),
(9.2) ( )fail i pF F F µ= −
Using (9.2) the force required to cause sliding is 3970 lb. The aerodynamic loading is
more than 7 times smaller than the required loading.
The final failure mode investigated was the ability of the bolted connection to
resist the model torque. With the ability to alter the angle of attack of the airfoil it is
necessary to ensure that the aerodynamic loading will not cause a sudden change.
The airfoils center of lift occurs at approximately 30% chord. At the mid span
this point is 5.82 inches in front of the main bolt location. This creates 266.75 lb·ft of
torque.
Determining the torque required for failure is done by determining the value of
the torque generated by the frictional force of the bolt (Bickford 1981).
(9.3) ( )fail i pF F rµτ µ= −
The coefficient of friction is again assumed to be 0.3 and the radius of the washer, rµ , is
assumed to be 0.7 inches. Placing these values into (9.3) reveals that the jointed
connection will rotate at 243.9 lb ·ft. This would indicate that the FOS against rotation is
only 0.91.
In order to achieve the necessary FOS the support bolt which is neglected in
Silverman’s analysis must be included. The support bolt force acts 8 inches from the axis
of rotation and is assumed to have an identical coefficient of friction. With the prying

38
force already subtracted from the main bolt Fp is set to zero. By applying 40 lb·ft to the
bolt the preload is determined to be 4800 pounds through (9.1). Taking this result and
inserting it into (9.3) produces 960 lb·ft of torque. The two bolts produce a total of over
1200 lb·ft of resistive torque. This value is significantly above the torque created by the
lifting force creating a FOS of 4.5.
The analysis of the fasteners reveals that the connection between the mounting
structure and airfoil is adequately safe. It is important to note that the eight 10-32 bolts
are never taken into account during the analysis, and that they provide even more safety.
Like many of the other calculations and results a series of static load tests would verify
the confidence in the joint.

39
CHAPTER X
STATIC LOAD TESTS 10.1 Preliminary Static-Load Test
Designed to verify the numerical results gathered over several months, static testing of
the airfoil system would be done in two tests. The first test would evaluate the mounting
structure and strut, without risking the airfoil model or aircraft. The second test would be
done on the entire system. The loading for the static load tests was based on 1.5 times
the maximum values. This required that a system be able to survive 800 pounds of lift
and 600 pounds of weight. Drag was ignored during the testing, as it was an order of
magnitude smaller.
The initial static-load test required that a substitute airfoil model and aircraft be
created. The mounting structure and strut could then be attached and tested. The
replacement aircraft was provided by Dr. Keating and the civil engineering department.
Rather than use an aircraft, the system was evaluated in the civil engineering lab. The
aircraft was simulated by bolting the system to the floor of the facility (Figure A.50). In
doing so the system was inverted. In addition to the facility Dr. Keating provided the
load cells and technicians to perform the testing.
The replacement model (Figure A.51) was created from an S6X17.25 I-beam. A
plate was attached to either end of the beam to allow for it to be connected to the mount
and the strut. Smaller gusset plates were added to ensure that the beam would not fail
during testing.
With the system bolted into the floor of the facility two load cells were attached
to the assembly (Figure A.52). One would pull on the beam at a location that matched
lifting location of the model. The second would pull up on the model simulating a multi-

40
G maneuver. The loads were slowly stepped up to their final values, and at each step the
system was inspected. Once the loads on the system were approximately 1.5 times the
maximum scenario, they were left applied for several minutes. This was done to ensure
that the system could support the loading for more than a few brief moments.
During the test it was observed that the lifting force does pull the model, causing
separation between two of the rocker arms and the alignment component. With no
observed failures the test was considered a success and plans were made to prepare for
the second static test.
10.2 Final Static Load Test with Model and Aircraft
The second static load test was conducted with the model, mounting structure, strut
assembly, and aircraft. With all model systems installed the aircraft was moved to a
secure location. The loads were again applied to the system via two load cells. One was
placed below the model in line with the CG. The other was placed in a jig (Figure A.53),
created by Cecil Rhodes, which held it in line with the lifting force.
Once everything was in place the load cells were again slowly steeped up until
the desired loads were reached. Approximately halfway through the test it was observed
that the tie down location was not performing as expected. A close inspection of the
bracket system revealed that the skin was separating from the spar cap (Figure A.54).
Testing was halted while the problem was studied and ultimately the loads were
removed while the problem was corrected.
The separation in the tie down was unexpected because the simulation of the
assembly assumed that the spar cap was bonded to the skin. With most of the attention
focused on the survivability of the bracket, no rivets were added to hold the spar cap to
the skin. This assumption was used to save computational time, and proved the necessity
of static testing.
The solution to the problem was a small steel clip that would fit around the tie
down bracket inside the wing and be secured by several screws (Figure A.55) passing
through the clip, spar cap, skin, and into the tie down block. With the clip in place the

41
testing was resumed. The clip prevented the earlier observed separation and allowed the
loading to progress to the test values.
The static load testing confirmed that the model would not damage the wing box
structure of the aircraft. The testing verified that the airfoil model and all supporting
structures would be able to endure the expected conditions. Verification that the pylon
could support the lifting loads with the new rocker arms officially confirmed that no
additional modifications were necessary. The bolted connections between the airfoil and
the mount were also successful supporting the results outlined by Timothy Silverman in
his mount design.

42
CHAPTER XI
CONCLUSIONS 11.1 Recommendations
Following several assemblies of the model, it became clear that it would have been
beneficial to have etched lines into the top of the upper plate (Figure A.56). It is not a
simple process to verify that the mount is attached in a manner such that the model will
be at 0° angle of attack. As a result it is even more difficult to verify any other angles of
attack. While the adjustment mechanism was designed to simplify the process it is not
perfect. It would have been simple to etch lines at each angle of attack adjustment from -
5° to 5° while the component was already on a CNC mill.
Another aspect of the model that could have been improved during the design
process was the interior, stepped structure. The structure was developed in a compressed
time frame and not all possibilities were considered. Among those designs not focused
on, one of the more interesting was the use of uneven steps. In the final design each step
was 2 inches wide. In regions of high curvature, this created a step that went from the
minimum 0.1875 inches thick to almost 0.75 inches thick. In order to reduce weight it
would have been possible to design a stepped structure that defined the minimum and
maximum thickness of each step, and allow the width to be uncontrolled. The process
would have created more steps in regions of high curvature and few steps where the
model flattens out.
Another interior feature that has caused some undesired effects during testing is
the use of the partial ribs and spars to stiffen the model. Thermal analysis of the model
showed that these regions cool down far slower than the rest of the model. As Figure
A.57 shows the regions associated with internal support are still several degrees warmer

43
than the rest of the model even 20 minutes after the model has been exposed to colder
air. This causes the cold soak prior to testing to take nearly 30 minutes. If the structure
was moved to be outside of the test section then it may be possible to lower the cold
soak time and speed up the testing process.
With the cost of aluminum increasing it may be beneficial to investigate the use
of alternative materials. Although composite materials were rejected early in the process
due to their potential inability to hold tolerances and interface with pressure ports, they
may be able to be used for other components. These components could include the
mounting structure as well as the plates that bookend the model.
During meetings with engineers at Tri-Models it was proposed that the non-test
side be rapid prototyped. The concept was never developed due to the time frame, and
no research had been done into this area. Since the non-test side does not have many of
the requirements of the test side, it may be possible to utilize this technology. Rapid
prototyping of the component would save machine time, but it is unknown what type of
surface finish could be achieved, as well as the materials performance in the flight
environment.
11.2 Conclusions
Even though there are a number of potential ways that the model design could be
improved, the fabricated model achieved its goals. None of the aircraft systems have
been compromised by flying with the airfoil model. The test platform has flown on many
occasions without incident. When testing completes the airfoil model and all support
structure can be removed leaving the aircraft ready for whatever future testing is needed.
This demonstrates the true success of the design; a safe test platform that can be
attached, flown and safely removed without permanently affecting the aircraft.
The removable leading edge has been utilized with great success. With testing
requiring both pressure ports, and a clean, smooth surface, the ability to have a leading
edge for each requirement has demonstrated the advantage of the unique system. In
addition to the leading edge the flat surfaces of the model proved to be advantageous.

44
Mounting both the pressure scanner and the accelerometer benefited from the flat
surfaces throughout the inner cavity.

45
REFERENCES
Bickford, John H. Introduction to the Design & Behavior of Bolted Joints. Marcel
Dekker, Inc., New York. 1981.
Blevins, Robert D. Formulas for Natural Frequency and Mode Shape. Van Nostrand
Reinhold Co., New York. 1979.
Gideon, Mike. Personal Communication. Tri-Models, Inc, Huntington Beach, CA.
August 2005.
Johnson, Bill. Personal Communication. Athena Manufacturing, Austin, TX. October
2005.
Mischke, Charles R., and Shigley, Joseph Edward. Mechanical Engineering Design. 5th
Ed. McGraw Hill., New York 2002.
Saric WS, Carpenter AL, Hunt LE, McKnight CW, Schouten SM. 2006b “SWIFT –
Safety Analysis for Swept-Wing Experiments.” TAMUS-AE-TR-06-002,
Technical Report, January 2006.
Silverman, Timothy. Design and Safety Analysis of a Model-Mounting Structure for the
Cessna O-2 Aircraft. Honor’s Thesis, Department of Mechanical and Aerospace
Engineering, Arizona State University, Tempe, AZ. 2005.
SolidWorks, Software Package, Ver. SP03.1, SolidWorks Corporation, Concord, MA,
2004.

46
APPENDIX A
FIGURES

47
Figu
re A
.1 C
essn
a O
-2 w
ith M
ultip
le W
ing
Stor
esFi
gure
A.1
Ces
sna
O-2
with
Mul
tiple
Win
g St
ores

48
Figu
re A
.2 P
ylon
Bra
cket
Sys
tem
Rem
oved
Fro
m A
ircra
ftFi
gure
A.2
Pyl
on B
rack
et S
yste
m R
emov
ed F
rom
Airc
raft

49
Figu
re A
.3 V
isua
l Com
paris
o n: O
rigin
al B
r ack
et ( L
eft)
and
Rep
l ac e
men
t B
r ack
et ( R
ight
) F i
gure
A.3
Vis
ual C
ompa
riso n
: Orig
inal
Br a
cket
( Lef
t) an
d R
epl a
c em
ent
Br a
cket
( Rig
ht)

50
Figu
re A
.4 L
oad
App
lica t
ion
(Mag
enta
) and
Res
train
t s (B
lue
and
Gre
en) f
or In
divi
dual
Bra
c ket
Ana
lysi
sFi
gure
A.4
Loa
d A
pplic
a tio
n (M
agen
ta) a
nd R
estra
int s
(Blu
e an
d G
reen
) for
Indi
vidu
al B
rac k
et A
naly
sis

51
Figu
re A
.5 O
utbo
ard
Pylo
n B
rack
et S
yste
mFi
gure
A.5
Out
boar
d Py
lon
Bra
cket
Sys
tem

52
Figu
re A
.6 A
pplic
atio
n of
Lift
ing
(Mag
enta
), D
rag
(Cya
n), a
nd G
ravi
tatio
nal (
Yel
low
) For
ces t
o th
e Fo
ur B
rack
et S
yste
mFi
gure
A.6
App
licat
ion
of L
iftin
g (M
agen
ta),
Dra
g (C
yan)
, and
Gra
vita
tiona
l (Y
ello
w) F
orce
s to
the
Four
Bra
cket
Sys
tem

53
Figu
re A
.7 R
estra
ints
App
lied
to E
ach
Bra
cket
Hol
e in
the
Four
Bra
cket
Sys
tem
Figu
re A
.7 R
estra
ints
App
lied
to E
ach
Bra
cket
Hol
e in
the
Four
Bra
cket
Sys
tem

54
Figu
re A
.8 S
tress
Con
cent
ratio
ns L
eadi
ng to
Min
imum
Fac
tors
of S
afet
yFi
gure
A.8
Stre
ss C
once
ntra
tions
Lea
ding
to M
inim
um F
acto
rs o
f Saf
ety

55
Figu
re A
.9 M
axim
um S
tress
in th
e Fo
ur B
rack
et S
yste
mFi
gure
A.9
Max
imum
Stre
ss in
the
Four
Bra
cket
Sys
tem

56
Figu
re A
.10
Airf
oil M
ount
ing
Stru
ctur
eFi
gure
A.1
0 A
irfoi
l Mou
ntin
g St
ruct
ure

57
Figu
re A
.11
Alig
nmen
t Com
pone
nt w
ith T
hree
Roc
ker A
rm A
ssem
blie
sand
Eye
Bol
ts
Figu
re A
.11
Alig
nmen
t Com
pone
nt w
ith T
hree
Roc
ker A
rm A
ssem
blie
sand
Eye
Bol
ts

58
Figu
re A
.12
Mou
ntin
g C
hann
elFi
gure
A.1
2 M
ount
ing
Cha
nnel

59
Figu
re A
.13
Arc
s Allo
win
g fo
r Mou
ntin
g in
to T
op S
urfa
ce o
f Airf
oil
Figu
re A
.13
Arc
s Allo
win
g fo
r Mou
ntin
g in
to T
op S
urfa
ce o
f Airf
oil

60
Figu
re A
.14
Ang
le o
f Atta
ck A
djus
tmen
t Mec
hani
smFi
gure
A.1
4 A
ngle
of A
ttack
Adj
ustm
ent M
echa
nism

61
Figu
re A
.15
Supp
ort B
olt
Figu
re A
.15
Supp
ort B
olt

62
Figu
re A
.16
Two-
Inch
Dia
met
er W
iring
Hol
eFi
gure
A.1
6 Tw
o-In
ch D
iam
eter
Wiri
ng H
ole

63
Figu
re A
. 17
Mai
n B
olt B
efor
e an
d A
ft er P
rel o
adin
g w
ith Ja
ck B
olt
Figu
re A
. 17
Mai
n B
olt B
efor
e an
d A
ft er P
rel o
adin
g w
ith Ja
ck B
olt

64
Figu
re A
.18
Com
pone
nts i
n Th
ree
Piec
e D
esig
nFi
gure
A.1
8 C
ompo
nent
s in
Thre
e Pi
ece
Des
ign

65
Figu
re A
.19
Pock
eted
Mod
el S
how
ing
4X4
Syst
em o
f Wei
ght R
emov
alFi
gure
A.1
9 Po
cket
ed M
odel
Sho
win
g 4X
4 Sy
stem
of W
eigh
t Rem
oval

66
Figu
re A
.20
Shel
led
Mod
el W
ithou
t Tes
t Sur
face
Figu
re A
.20
Shel
led
Mod
el W
ithou
t Tes
t Sur
face

67
Figu
re A
.21
Com
posi
te A
irfoi
l Mod
elFi
gure
A.2
1 C
ompo
site
Airf
oil M
odel

68
Figu
re A
.22
Ai rf
ram
e D
esig
n Ill
ustr a
ting
Rib
and
Ski
n Pa
nel
De s
ign
F igu
re A
.22
Ai rf
ram
e D
esig
n Ill
ustr a
ting
Rib
and
Ski
n Pa
nel
De s
ign

69
Figu
re A
.23
Res
train
ts A
pplie
d to
Airf
oils
Afte
r Int
egra
tion
of M
ount
ing
Stru
ctur
eFi
gure
A.2
3 R
estra
ints
App
lied
to A
irfoi
ls A
fter I
nteg
ratio
n of
Mou
ntin
g St
ruct
ure

70
Figu
re A
.24
Forc
e A
pplic
atio
n fo
r Airf
oil M
odel
Eva
luat
ion
Figu
re A
.24
Forc
e A
pplic
atio
n fo
r Airf
oil M
odel
Eva
luat
ion

71
Figu
re A
.25
Stre
ss A
naly
sis R
esul
ts o
f Poc
kete
d M
odel
und
er M
axim
um
Load
ing
Figu
re A
.25
Stre
ss A
naly
sis R
esul
ts o
f Poc
kete
d M
odel
und
er M
axim
um
Load
ing
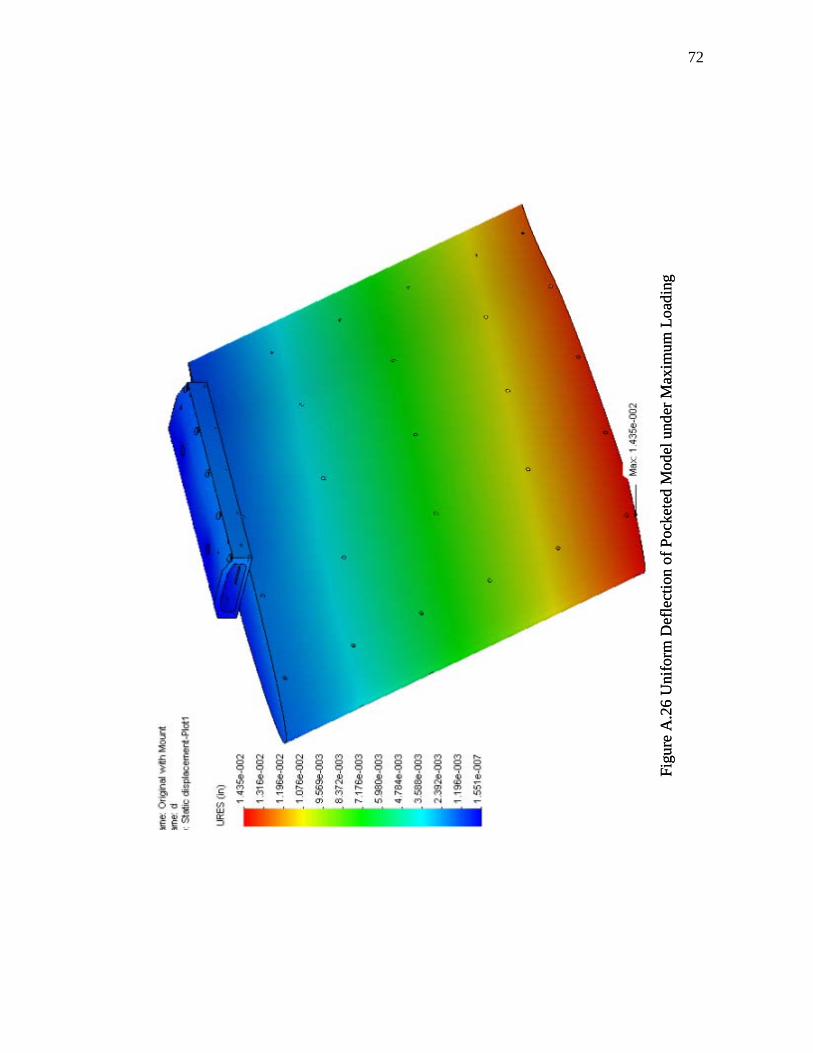
72
Figu
re A
.26
Uni
form
Def
lect
ion
of P
ocke
ted
Mod
el u
nder
Max
imum
Loa
ding
Figu
re A
.26
Uni
form
Def
lect
ion
of P
ocke
ted
Mod
el u
nder
Max
imum
Loa
ding

73
Figu
re A
.27
Stre
ss A
naly
sis R
esul
ts o
f She
lled
Mod
el u
nder
Max
imum
Loa
ding
Figu
re A
.27
Stre
ss A
naly
sis R
esul
ts o
f She
lled
Mod
el u
nder
Max
imum
Loa
ding

74
Figu
re A
.28
Def
l ect
ion
o f S
hell e
d M
odel
due
to M
axim
um L
oadi
ngFi
g ure
A.2
8 D
efl e
ctio
n o f
She
ll ed
Mod
el d
ue to
Max
imum
Loa
ding

75
Figu
re A
.29
Shift
in S
helle
d M
odel
CG
with
Add
ition
of 2
0 lb
Cou
nter
wei
ght
Figu
re A
.29
Shift
in S
helle
d M
odel
CG
with
Add
ition
of 2
0 lb
Cou
nter
wei
ght

76
Figu
re A
.30
S hift
in P
ocke
ted
Mod
e l C
G L
ocat
ion
with
Add
itio n
of2
0 lb
Cou
nter
wei
ght
Figu
re A
.30
S hift
in P
ocke
ted
Mod
e l C
G L
ocat
ion
with
Add
itio n
of2
0 lb
Cou
nter
wei
ght

77
Figu
re A
.31
Cro
ss S
ectio
n R
eve a
ling
S tep
ped
Stru
ctu r
e of
Fi n
al M
ode l
Figu
re A
.31
Cro
ss S
ectio
n R
eve a
ling
S tep
ped
Stru
ctu r
e of
Fi n
al M
ode l

78
Figu
re A
.32
Step
p ed
Stru
ctur
e A
pplie
d to
Lea
d ing
Ed g
eFi
gure
A.3
2 St
epp e
d St
ruct
ure
App
lied
to L
ead i
ng E
d ge

79
Figu
re A
.33
Plat
es A
dded
to th
e To
p an
d B
otto
m o
f Airf
oil M
odel
Figu
re A
.33
Plat
es A
dded
to th
e To
p an
d B
otto
m o
f Airf
oil M
odel

80
Figu
re A
.34
Stre
ss A
naly
sis o
f Ste
pped
Mod
el U
nder
Max
imum
Loa
ding
Figu
re A
.34
Stre
ss A
naly
sis o
f Ste
pped
Mod
el U
nder
Max
imum
Loa
ding

81
Figu
re A
.35
Def
lect
ion
of S
tepp
ed M
odel
Illu
stra
ting
Patte
rn S
imila
r to
Pock
eted
Mod
elFi
gure
A.3
5 D
efle
ctio
n of
Ste
pped
Mod
el Il
lust
ratin
g Pa
ttern
Sim
ilar t
o Po
cket
ed M
odel

82
Figu
re A
.36
Orig
inal
Roc
ker A
rm A
ssem
bly
Figu
re A
.36
Orig
inal
Roc
ker A
rm A
ssem
bly

83
Figu
re A
.37
Wel
d on
Orig
inal
Roc
ker A
rm A
ssem
bly
Figu
re A
.37
Wel
d on
Orig
inal
Roc
ker A
rm A
ssem
bly

84
Figu
re A
.38
Fact
or o
f Saf
ety
Dia
gram
, Yie
ld S
treng
th 9
0,00
0 ps
iFi
gure
A.3
8 Fa
ctor
of S
afet
y D
iagr
am, Y
ield
Stre
ngth
90,
000
psi

85
Figu
re A
.39
Red
esig
ned
Roc
ker A
rm A
ssem
bly
Figu
re A
.39
Red
esig
ned
Roc
ker A
rm A
ssem
bly

86
Figu
re A
.40
Mod
eled
Pyl
onFi
gure
A.4
0 M
odel
ed P
ylon

87
Figu
re A
.41
Loca
tion
of R
epla
ced
Riv
ets i
n Py
lon
Ass
embl
yFi
gure
A.4
1 Lo
catio
n of
Rep
lace
d R
ivet
s in
Pylo
n A
ssem
bly

88
Figu
re A
.42
Stiff
ener
s App
lied
to P
ylon
Ski
nFi
gure
A.4
2 St
iffen
ers A
pplie
d to
Pyl
on S
kin

89
Figu
re A
.43
Solid
Bul
khea
d fo
r Pyl
on A
ssem
bly
Figu
re A
.43
Solid
Bul
khea
d fo
r Pyl
on A
ssem
bly

90
Figu
re A
.44
Stru
t Pro
files
; Ces
sna
172
(Lef
t), F
airin
g (R
ight
)Fi
gure
A.4
4 St
rut P
rofil
es; C
essn
a 17
2 (L
eft),
Fai
ring
(Rig
ht)

91
Figu
re A
.45
Ove
rvie
w o
f Stru
t Fea
turin
g D
ual B
all J
oint
sFi
gure
A.4
5 O
verv
iew
of S
trut F
eatu
ring
Dua
l Bal
l Joi
nts

92
Figu
re A
.46
Cut
Aw
ay R
evea
ling
Stru
t Ins
ert I
nsid
e St
rut P
rofil
eFi
gure
A.4
6 C
ut A
way
Rev
ealin
g St
rut I
nser
t Ins
ide
Stru
t Pro
file
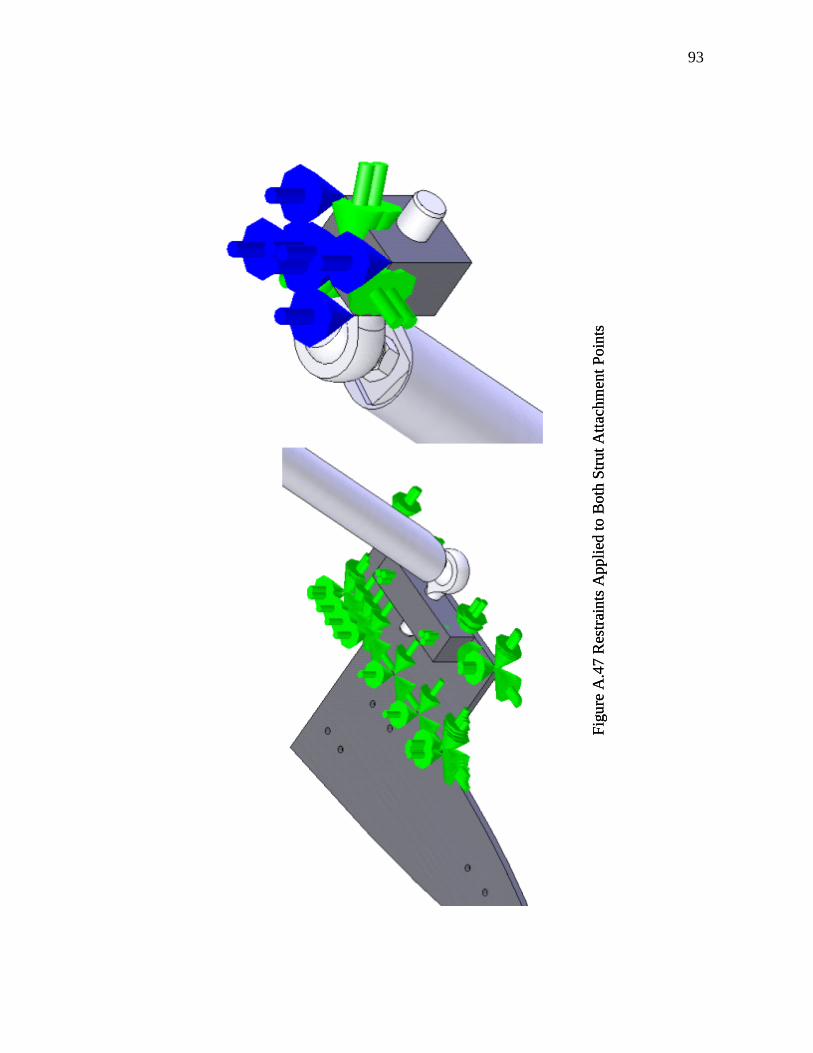
93
Figu
re A
.47
Res
train
ts A
pplie
d to
Bot
h St
rut A
ttach
men
t Poi
nts
Figu
re A
.47
Res
train
ts A
pplie
d to
Bot
h St
rut A
ttach
men
t Poi
nts

94
Figu
re A
.48
Res
ults
Illu
stra
ting
Con
cent
ratio
ns o
f Stre
ss in
Bot
h B
all J
oint
sFi
gure
A.4
8 R
esul
ts Il
lust
ratin
g C
once
ntra
tions
of S
tress
in B
oth
Bal
l Joi
nts

95
Figu
re A
.49
Tie
Dow
n A
ssem
bly
Figu
re A
.49
Tie
Dow
n A
ssem
bly

96
Figu
re A
.50
Setu
p of
Pre
limin
ary
Stat
ic L
oad
Test
Figu
re A
.50
Setu
p of
Pre
limin
ary
Stat
ic L
oad
Test

97
Figu
re A
.51
Stat
ic M
odel
Use
d to
Sim
ulat
e Tr
ue A
irfoi
l Mod
elFi
gure
A.5
1 St
atic
Mod
el U
sed
to S
imul
ate
True
Airf
oil M
odel

98
Figu
re A
.52
Loca
tion
of L
oad
Cel
ls D
urin
g Pr
elim
inar
y St
atic
Loa
d Te
stFi
gure
A.5
2 Lo
catio
n of
Loa
d C
ells
Dur
ing
Prel
imin
ary
Stat
ic L
oad
Test

99
Figu
re A
.53
Setu
p fo
r Se c
ond
S tat
ic L
o ad
Tes t
Fig u
re A
.53
Setu
p fo
r Se c
ond
S tat
ic L
o ad
Tes t

100
Figu
re A
.54
Obs
erve
d Se
para
tion
in T
ie-D
own
Loca
tion
Dur
ing
Stat
ic L
oad
Test
with
Tru
e A
irfoi
l Mod
elFi
gure
A.5
4 O
bser
ved
Sepa
ratio
n in
Tie
-Dow
n Lo
catio
n D
urin
g St
atic
Loa
d Te
st w
ith T
rue
Airf
oil M
odel

101
Figu
re A
.55
Stee
l Clip
Add
ed to
Tie
Dow
n A
ssem
bly
Figu
re A
.55
Stee
l Clip
Add
ed to
Tie
Dow
n A
ssem
bly

102
Figu
re A
.56
Loca
tion
of E
tche
d Li
nes t
o En
sure
Ang
le o
f Atta
ck A
lignm
ent
Figu
re A
.56
Loca
tion
of E
tche
d Li
nes t
o En
sure
Ang
le o
f Atta
ck A
lignm
ent

103
Figu
re A
.57
Ther
mal
Ana
lysi
s Sho
win
g U
neve
n C
oolin
g du
e to
Inte
rnal
Stru
ctur
eFi
gure
A.5
7 Th
erm
al A
naly
sis S
how
ing
Une
ven
Coo
ling
due
to In
tern
al S
truct
ure

104
APPENDIX B
AIRFOIL BLUEPRINTS

105

106

107

108

109

110

111

112

113
APPENDIX C
MOUNTING STRUCTURE BLUEPRINTS

114

115

116

117
VITA
Name: Christopher William McKnight
Address: 6921 E. Laguna Azul Ave
Mesa, AZ 85209
Email Address: [email protected]
Education: M.S., Aerospace Engineering, Texas A&M University, 2006
B.S., Mechanical Engineering, The University of Dayton, 2004