design and optimization methods for elective hospital ...helmjweb/publications/a4 (or) design...
TRANSCRIPT

This article was downloaded by: [140.182.75.230] On: 08 October 2016, At: 07:15Publisher: Institute for Operations Research and the Management Sciences (INFORMS)INFORMS is located in Maryland, USA
Operations Research
Publication details, including instructions for authors and subscription information:http://pubsonline.informs.org
Design and Optimization Methods for Elective HospitalAdmissionsJonathan E. Helm, Mark P. Van Oyen
To cite this article:Jonathan E. Helm, Mark P. Van Oyen (2014) Design and Optimization Methods for Elective Hospital Admissions. OperationsResearch 62(6):1265-1282. http://dx.doi.org/10.1287/opre.2014.1317
Full terms and conditions of use: http://pubsonline.informs.org/page/terms-and-conditions
This article may be used only for the purposes of research, teaching, and/or private study. Commercial useor systematic downloading (by robots or other automatic processes) is prohibited without explicit Publisherapproval, unless otherwise noted. For more information, contact [email protected].
The Publisher does not warrant or guarantee the article’s accuracy, completeness, merchantability, fitnessfor a particular purpose, or non-infringement. Descriptions of, or references to, products or publications, orinclusion of an advertisement in this article, neither constitutes nor implies a guarantee, endorsement, orsupport of claims made of that product, publication, or service.
Copyright © 2014, INFORMS
Please scroll down for article—it is on subsequent pages
INFORMS is the largest professional society in the world for professionals in the fields of operations research, managementscience, and analytics.For more information on INFORMS, its publications, membership, or meetings visit http://www.informs.org
OPERATIONS RESEARCHVol. 62, No. 6, November–December 2014, pp. 1265–1282ISSN 0030-364X (print) � ISSN 1526-5463 (online) http://dx.doi.org/10.1287/opre.2014.1317
© 2014 INFORMS
Design and Optimization Methods forElective Hospital Admissions
Jonathan E. HelmDepartment of Operations and Decision Technologies, Kelley School of Business, Indiana University, Bloomington, Indiana 47405,
Mark P. Van OyenDepartment of Industrial and Operations Engineering, University of Michigan, Ann Arbor, Michigan 48109,
Hospitals typically lack effective enterprise level strategic planning of bed and care resources, contributing to bed censuslevels that are statistically “out of control.” This system dysfunction manifests itself in bed block, surgical cancelation,ambulance diversions, and operational chaos. This is the classic hospital admission scheduling and control (HASC) problem,which has been addressed in its entirety only through inexact simulation-based search heuristics. This paper developsnew analytical models of controlled hospital census that can, for the first time, be incorporated into a mixed-integerprogramming model to optimally solve the strategic planning/scheduling portion of the HASC. Our new solution methodcoordinates elective admissions with other hospital subsystems to reduce system congestion. We formulate a new Poisson-arrival-location model (PALM) based on an innovative stochastic location process that we developed and call the patienttemporal resource needs model. We further extend the PALM approach to the class of deterministic controlled-arrival-location models (d-CALM) and develop linearizing approximations to stochastic blocking metrics. This work providesthe theoretical foundations for an efficient scheduled admissions planning system as well as a practical decision supportmethodology to stabilize hospital census.
Subject classifications : hospital admissions and bed management; stochastic patient flow modeling; mixed-integerprogramming; census smoothing; stochastic arrival-location models.
Area of review : Policy Modeling and Public Sector OR.History : Received April 2011; revisions received September 2012, September 2013, April 2014; accepted July 2014.
Published online in Articles in Advance October 23, 2014.
1. IntroductionThe classical hospital admission scheduling and control(HASC) problem identified in the late 1970s addressesone of the major systemic failures in hospital care deliv-ery, census variability, through better strategic planning ofinpatient admissions. Solution methodologies to reduce thisvariability are often referred to as census smoothing. In thiswork we solve the elective inpatient (by which we meanall admissions that are scheduled in advance rather thanemergency) strategic scheduling portion of the HASC prob-lem to optimality. Our collaborations with multiple hos-pitals across three continents enable a broad validation ofour approach, models, and results. Our HASC optimiza-tion creates a strategic plan, analogous to block scheduling,that allocates a specific number of slots each day for eachpatient type (similar to allocating a certain number of hoursof operating room (OR) time to each service each day) overa planning horizon to be filled by admissions personnelscheduling according to the plan.
From Practice to Theory2 A Scientific Approach to theHASC Planning Problem. The work in this paper wasdeveloped during more than four years of collaborativeresearch with hospitals around the world. We have worked
with both large and medium sized hospitals and teach-ing and nonteaching hospitals in the United States, theNetherlands, Singapore, and Canada. The causes and con-sequences of census variability detailed below, along withthe classic census patterns that lead to systemic hospitalcongestion, were observed to be similar in every case. Thissuggests that the problem we address is a global one that,despite the many differences across hospitals and healthcaresystems, occurs with remarkable consistency. For the pur-poses of cohesive exposition, we draw our examples fromand develop a complete analysis for one hospital in partic-ular, though the model is validated across all four hospitals.Our partner hospitals have agreed that this approach mer-its development and implementation as a path toward thehospital of tomorrow.
Consequences of Census Variability. Hospital censusvariability is problematic throughout the world and impactscost, access, quality, and safety in healthcare delivery. Stud-ies show that census variability leads to overcrowding ofthe emergency department (ED), intensive care unit (ICU),and post anesthesia care unit (PACU) resulting in increasedmortalities, compromised quality of care, emergency patientdiversions, and significant excess cost (see Mirel and Carper2013, Sprivulis et al. 2006, Richardson 2006, Derlet et al.
1265
Dow
nloa
ded
from
info
rms.
org
by [
140.
182.
75.2
30]
on 0
8 O
ctob
er 2
016,
at 0
7:15
. Fo
r pe
rson
al u
se o
nly,
all
righ
ts r
eser
ved.
Helm and Van Oyen: Elective Hospital Admissions Optimization1266 Operations Research 62(6), pp. 1265–1282, © 2014 INFORMS
2001, Harrison et al. 2005, McManus et al. 2003, Proudloveet al. 2003, Richardson 2006, Fatovich et al. 2005, Hootand Aronsky 2008, and Forster et al. 2003). Census vari-ability also contributes to overloaded nurse staff, which islinked to patient mortality, nurse burnout, and job dissatis-faction (see Aiken et al. 2002). High levels of congestionalso cause hospitals to divert overflow patients into non-preferred “off-ward” beds, which we call type 1 blocking(see §4.1). Patient safety, however, is not well served byplacing patients off-ward and the practice increases nursestress, job dissatisfaction, and turnover (see Anderson et al.1988, Brownson and Dowd 1997, Needleman et al. 2002).
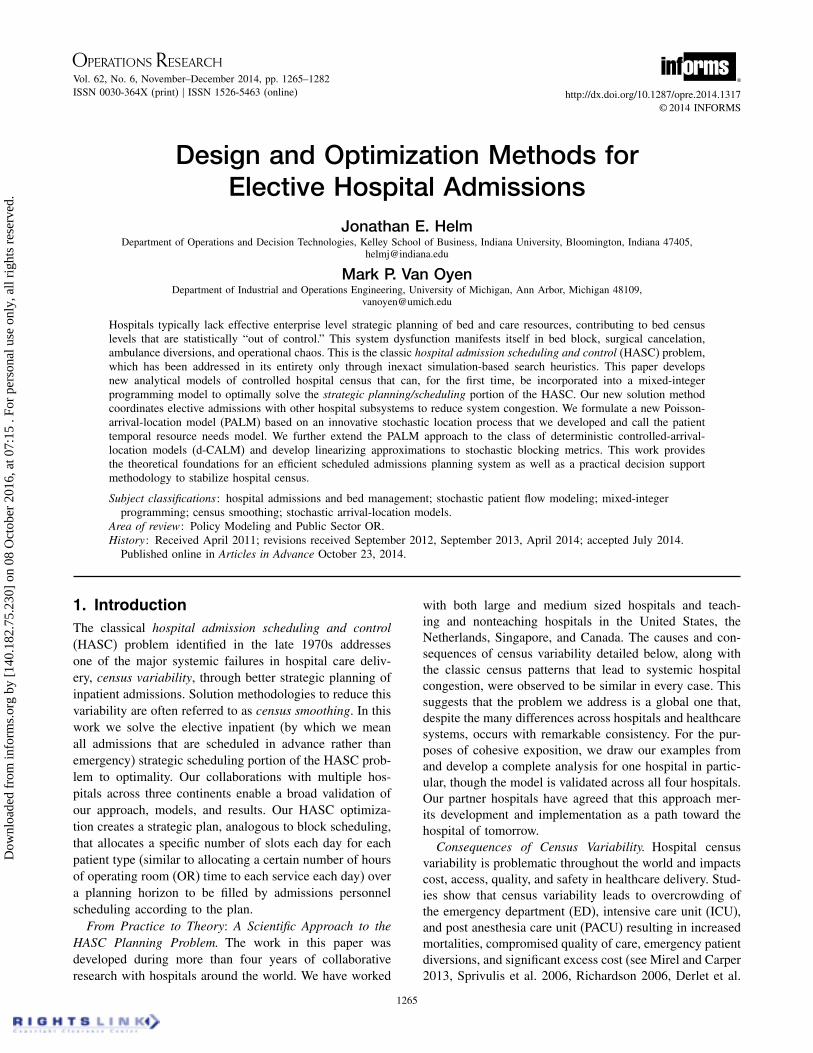
Figure 1(a) is a census time series from a partner hospitalthat illustrates typical census variability. Furthermore, mosthospitals also exhibit a pattern of a midweek census spikefollowed by a sharp drop in census on Saturday and Sunday(see Figure 1(b)). This weekly census “hump” contributesto hospital overcrowding despite a modest average census(the dotted line in Figure 1(b)).
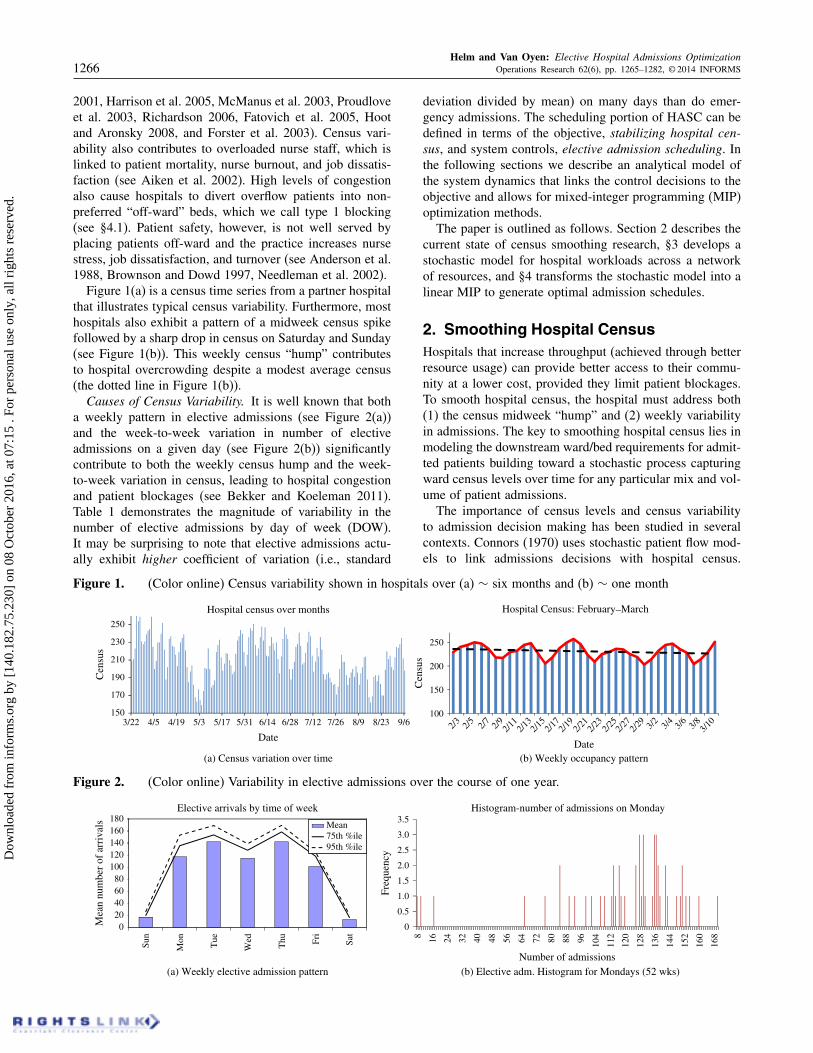
Causes of Census Variability. It is well known that botha weekly pattern in elective admissions (see Figure 2(a))and the week-to-week variation in number of electiveadmissions on a given day (see Figure 2(b)) significantlycontribute to both the weekly census hump and the week-to-week variation in census, leading to hospital congestionand patient blockages (see Bekker and Koeleman 2011).Table 1 demonstrates the magnitude of variability in thenumber of elective admissions by day of week (DOW).It may be surprising to note that elective admissions actu-ally exhibit higher coefficient of variation (i.e., standard
Figure 1. (Color online) Census variability shown in hospitals over (a) ∼ six months and (b) ∼ one month
150
170
190
210
230
250
Cen
sus
Date
Hospital census over months
100
150
200
250
3/22 4/5 4/19 5/3 5/17 5/31 6/14 6/28 7/12 7/26 8/9 8/23 9/6 2/3 2/5 2/7 2/9 2/11
2/13
2/15
2/17
2/19
2/23
2/25
2/27
2/29 3/2 3/4 3/6 3/8 3/1
0
Cen
sus
Date(b) Weekly occupancy pattern(a) Census variation over time
2/21
_Hospital Census: February March
Figure 2. (Color online) Variability in elective admissions over the course of one year.
020406080
100120140160180
Sun
Mon Tue
Wed
Thu Fr
i
Sat
Mea
n nu
mbe
r of
arr
ival
s
Elective arrivals by time of week
Mean75th %ile95th %ile
0
0.5
1.0
1.5
2.0
2.5
3.0
3.5
8 16 24 32 40 48 56 64 72 80 88 96 104
112
120
128
136
144
152
160
168
Freq
uenc
y
Number of admissions
Histogram-number of admissions on Monday
(a) Weekly elective admission pattern (b) Elective adm. Histogram for Mondays (52 wks)
deviation divided by mean) on many days than do emer-gency admissions. The scheduling portion of HASC can bedefined in terms of the objective, stabilizing hospital cen-sus, and system controls, elective admission scheduling. Inthe following sections we describe an analytical model ofthe system dynamics that links the control decisions to theobjective and allows for mixed-integer programming (MIP)optimization methods.
The paper is outlined as follows. Section 2 describes thecurrent state of census smoothing research, §3 develops astochastic model for hospital workloads across a networkof resources, and §4 transforms the stochastic model into alinear MIP to generate optimal admission schedules.
2. Smoothing Hospital CensusHospitals that increase throughput (achieved through betterresource usage) can provide better access to their commu-nity at a lower cost, provided they limit patient blockages.To smooth hospital census, the hospital must address both(1) the census midweek “hump” and (2) weekly variabilityin admissions. The key to smoothing hospital census lies inmodeling the downstream ward/bed requirements for admit-ted patients building toward a stochastic process capturingward census levels over time for any particular mix and vol-ume of patient admissions.
The importance of census levels and census variabilityto admission decision making has been studied in severalcontexts. Connors (1970) uses stochastic patient flow mod-els to link admissions decisions with hospital census.
Dow
nloa
ded
from
info
rms.
org
by [
140.
182.
75.2
30]
on 0
8 O
ctob
er 2
016,
at 0
7:15
. Fo
r pe
rson
al u
se o
nly,
all
righ
ts r
eser
ved.

Helm and Van Oyen: Elective Hospital Admissions OptimizationOperations Research 62(6), pp. 1265–1282, © 2014 INFORMS 1267
Table 1. Variation in numbers of total elective and emergency admissions by day of week (DOW).
Std. dev. Mean CV
Category DOW Emergency Elective Emergency Elective Emergency Elective
Hospital total Sun 8044 5051 48023 16057 0018 0033Hospital total Mon 13023 32098 64079 117032 0020 0028Hospital total Tue 11064 17098 62017 142026 0019 0013Hospital total Wed 10059 23088 57053 114079 0018 0021Hospital total Thu 13089 28093 58002 142004 0024 0020Hospital total Fri 10096 20049 64079 101009 0017 0020Hospital total Sat 8094 4076 52069 12083 0017 0037
Harrison et al. (2005) uses simulation to show that censusvariability in combination with high census levels increasesthe risk of hospital overcrowding. Jun et al. (1999) arguesthat effective patient flow management can benefit the hos-pital through high patient throughput, low patient waittimes, short length of stay (LOS), and low clinic overtime.
To effectively solve the HASC problem, models mustincorporate control/scheduling decisions into census fore-cast models. Early work in this area began in the late 1970swith Hancock and Walter (1979, 1983) and Griffith et al.(1978). These early approaches took a comprehensive simu-lation modeling approach to capture entire patient care path-ways through the network of wards that comprise the hos-pital. Schedule improvement relied on a simulation-basedheuristic approach to modeling the impact of admissions oncensus levels. Using simulation, the landmark work of Han-cock and Walter (1983) designed and implemented an inpa-tient admissions scheduling and control system to achievehigh average census subject to constraints on the numberof cancelations and emergency patient blockages. Gallivanand Utley (2005), Gallivan et al. (2002), Chow et al. (2011),Adan et al. (2009), Bekker and Koeleman (2011) have allstudied the impact of elective admissions on census levelsin various wards, optimizing schedules with MIP models.Recently, Harper (2002) and Helm et al. (2009) used simula-tion frameworks to improve scheduling decisions for betterhospital resource usage.
Helm et al. (2011) presented a Markov decision process(MDP) approach that focuses on the control side of theHASC problem to dynamically manage an inpatient call-inqueue and elective surgery cancelation. It also showed, viasimulation, that it can be effective to manage the schedulingside of the HASC problem.
Given the significant impact that elective scheduling hason system performance, this paper makes a contribution by(1) developing analytical census modeling methods, ratherthan simulation-based methods and (2) embedding them ina nonheuristic optimization to solve a model of the schedul-ing side of the HASC problem and to yield important man-agerial insight. Past work has either been simulation based,or has not considered the full HASC system dynamics. Forexample, the MIP papers focus on a single ward or isolatedfeed-forward subset of hospital resources. The scope of ourwork includes modeling the entire hospital, full patient care
trajectories, and census levels by ward; moreover it includesthe more realistic generalized network dynamics of the hos-pital wards and the use of flexible wards to serve patientsoff-ward. In short, we are able to solve a scheduling modelof the complete HASC problem using nonheuristic opti-mization methods. To better capture the hospital dynamics,we model the hospital as a general network of interactingwards/units, incorporating the two primary types of inter-action between wards that were not previously considered:(1) transfers between different wards within the hospital as aresult of a change in the patient’s condition and (2) off-wardservicing when a patient’s preferred ward is full.
Ignoring the off-ward and interward transfer mechanismsomits critical dynamics of hospital system functioning. Inone of our partner hospitals 56% of patients transfer wardsat least once during their hospital stay, and among patientswho transfer, the average is 1.6 transfers per visit. Consid-ering only the first ward, or a feed-forward subset of wards,ignores a significant load that patients place on other hospi-tal resources. Additionally, the percent of off-ward patientsis often quite significant; even in one of the better managedhospitals we worked with, around 17% of patients werelocated off-ward.
A primary contribution of this paper is in linking modelsthat optimize system-level objectives to stochastic modelsof patient flow using complete patient trajectories through anetwork of hospital wards and the modeling of ward interac-tion mechanisms. Our main purpose is to develop a medium-or long-term plan for what mix and volume of patients toadmit over time.
3. Characterization of the StochasticCensus Process
Figure 3(a) illustrates our methodological approach. Wemodel the hospital as a network of interacting wards. Theprimary resource modeled is the hospital beds, differenti-ated by ward. The model uses the detailed temporal resourcerequirements via a data-driven network patient flow modelto inform elective admission decisions while accounting forthe resource requirements of the emergency patients. Weshow that it is possible to determine the volume and mixof elective patients that will generate a stable workload andminimize blockages and cancelations while maintaining orincreasing patient throughput.
Dow
nloa
ded
from
info
rms.
org
by [
140.
182.
75.2
30]
on 0
8 O
ctob
er 2
016,
at 0
7:15
. Fo
r pe
rson
al u
se o
nly,
all
righ
ts r
eser
ved.

Helm and Van Oyen: Elective Hospital Admissions Optimization1268 Operations Research 62(6), pp. 1265–1282, © 2014 INFORMS
Figure 3. (Color online) Models of patient flow through a network of hospital wards.
Emergencydepartment
Med
Discharge
Scheduledelectives
Hospital wardsOperating
rooms
Emergencyarrivals
ICU Ortho
Surg
……
Feedback
A3 C20 CCU ICU
12
34
50
10
20
30
40
50
Days after admission
Individual care path for cardiology patients
Ward
War
d oc
cupa
ncy
prob
abili
ties
(%)
(b) Cardiology patient flow path(a) Conceptual patient flow model
This section develops offered-load models of hospitalcensus that will incorporate corrections for cases where apatient is denied admission to a full hospital (type 2 block-ing) or where they are placed “off-ward” because the pre-ferred ward is full (type 1 blocking). As a foundation, wefirst characterize the patient trajectories for each patienttype. Although many different definitions of patient typesmay be used, we consider patient type to be the patient’sadmitting service (e.g., cardiac, gastrointestinal, neurol-ogy, etc.), because this fits with typical hospital schedulingstructures. We generate a probabilistic flow model of theresources (beds) used by a patient of a given type over theirentire stay in the hospital. Figure 3(b) (corresponding alsoto Table 2) shows the expected load (which is also a proba-bility) a cardiology patient places on hospital wards over thecourse of their treatment, where the y dimension indicatesdays after admission.
Using these trajectories we can characterize both the elec-tive census process and the emergency census process tomodel the total census levels in each ward for a given elec-tive admission schedule by day of week. In §4, these censusprocesses are linked to elective admission decision variablesin an optimization model to determine the optimal mix and
Table 2. Patient Temporal Resource Needs (PATTERN) matrix of the percent of patients thatrequire a bed on days following admission for a cardiology patient for (a) the congestioncontaminated path and (b) the estimated true demand path.
(a) (b)
Time (days) Time (days)
Ward 0 1 2 3 4 Ward 0 1 2 3 4
A3 4506% 3708% 2103% 1901% 1700% A3 4508% 3800% 2106% 1904% 1703%C2O 602% 001% 000% 000% 000% C2O 602% 001% 000% 000% 000%CCU 701% 305% 204% 103% 100% CCU 704% 306% 205% 105% 103%ICU 001% 001% 001% 001% 001% ICU 001% 001% 002% 001% 001%
volume of patients over time subject to system performanceconstraints, including bed block.
The remainder of this section proceeds as follows. In§3.1 we discuss the design of the proposed elective admis-sion scheduling system as well as modeling assumptions.Section 3.2 introduces our stochastic model regarding howpatients move through the network of hospital wards overthe course of their treatment and presents a method forextracting a patient’s preferred ward from the data whenpatients are placed off-ward. Section 3.3 combines thestochastic model of patient flow from §3.2 with a Pois-son arrival stream to create a stochastic model of hospitaland ward workload. Section 3.4 extends this analysis to abroader class of arrival streams, that includes determinis-tic arrival streams, to model the more controlled arrival ofelective patients. Finally, combining the elective and emer-gency workload models yields a model for the total wardand hospital census, which is validated for accuracy usinghistorical data from four different hospitals in §3.5.
3.1. System Design and Assumptions
The decision variables (the number of patients of eachtype to admit on each day of the admission cycle) provide
Dow
nloa
ded
from
info
rms.
org
by [
140.
182.
75.2
30]
on 0
8 O
ctob
er 2
016,
at 0
7:15
. Fo
r pe
rson
al u
se o
nly,
all
righ
ts r
eser
ved.

Helm and Van Oyen: Elective Hospital Admissions OptimizationOperations Research 62(6), pp. 1265–1282, © 2014 INFORMS 1269
admission targets (number of slots) for each service, similarto the way that allocating surgical block time manages ORcase mix. These slots will be filled by the various admis-sions personnel until the maximum number of patients ofthat type for a given day is reached. Patients that cannot bescheduled on a given day will be scheduled into empty slotson subsequent days. This mechanism coordinates a previ-ously decentralized admissions scheduling process.
In high demand hospitals, like the four that we studyin this paper, elective inpatient services have substantialwaiting lists and thus it is reasonable to assume that theseplanned slots could be filled every week. A managementchallenge lies in changing the culture to stabilize the numberof admissions from week to week. The operational mech-anism of assigning admission maximums by day of week,if followed, will inherently reduce the fluctuation in admis-sions over time.
By using a deterministic arrival stream model, we are cap-turing the results if the plan is followed accurately and theadmission plan is filled each week. It is important to notethat, as this is a strategic planning model, the elective deci-sion variables represent the planned admissions and neither(1) an uncontrolled arrival of requests for elective admis-sions or procedures, nor (2) how the admission slots dynam-ically get filled. The dynamic management of the admis-sions system is left to the control portion of HASC (seefor example Hancock and Walter 1983, Helm et al. 2011).Instead, we allocate slots that set an optimal mix and volumeof patient admissions and allow admissions personnel theflexibility of filling those slots with any patient that matchesthe criteria for the slot (much like OR block scheduling).Using our modeling framework it is also possible to capturedeviations from the plan (see §3.4.3) modeled using variousnondeterministic arrival streams.
In our admission plan design, we model a repeating ad-mission cycle (e.g., a week) and, when the system goesbeyond the cycle length, the admission plan is repeatedexactly as before. It should be noted that the modelingframework is general and can work in a variety of con-texts including situations with seasonality and scenariosthat are not cyclic. Although noncyclic systems and sys-tems with seasonality can be modeled as well, a weeklycyclo-stationary model matches the natural weekly cycle ofalmost all hospitals (e.g., planned clinic times, OR time,research time).
In traditional queueing network models, customers thatare blocked stop receiving service while they wait for aserver at the next station to free up. In contrast, whenpatients are blocked from their preferred ward, they continueto receive service while residing off-ward with only a smallincrease (∼ 005 days) in LOS. The infinite capacity offeredload model we develop captures this phenomenon of receiv-ing service continuously while in the hospital. In §4 wefurther superimpose capacity constraints on the offered loadmodel to capture the volume of off-service patients and the
rate at which patients are blocked from entering the hos-pital altogether (e.g., ambulance diversion). This techniquehas been used successfully in other applications (e.g., themodified offered load approach of Massey and Whitt 1994bhas been used extensively). The workload from patients thatare blocked from the hospital entirely is removed from theworkload estimates. Thus we only capture patients that arein the hospital and once in the hospital, the patient continuesto be “served” until they leave. This approach models truepatient flow dynamics far better than traditional queueingnetwork blocking models or loss models.
Our model uses one day as the time step (though any timestep can work), because we anticipate our elective admis-sions system being used most often at a daily granularityto give flexibility and decision-making power to admissionspersonnel, increasing the likelihood of acceptance of ourcoordinated strategic plan.
3.2. Development of the PATTERN StochasticLocation Process Model
To understand the effects of scheduling decisions and emer-gency arrivals on census levels across the network of hos-pital wards, consider as a foundational model the resource(bed) requirements of a single patient over the course oftheir treatment, which we call Patient Temporal ResourceNeeds (PATTERN). To describe the flow of patients throughhospital wards, we develop a stochastic location processmodel in the spirit of Massey and Whitt (1993, 1994a).Some applications and extensions of this approach includeLeung et al. (1994) and Liu and Whitt (2011). Let 7 bethe set of wards and $ be the set of patient types. The statespace for the location functions can be defined as S=7∪8ã∗1ã∗9, where state u represents a patient being in ward u,state ã∗ represents the state where the patient has left thehospital (i.e., discharged), and ã∗ represents the state wherethe patient has not yet arrived at the hospital. Patients movethrough the state space according to the S-valued stochas-tic location process 8Ls1 k4t5: s ∈�1 k ∈$9, where k is thepatient type, s is the arrival time, and t > s is the timeof interest. For notational convenience we let S = S0 ∪8ã∗1ã∗9, so that S0 represents the locations within the hos-pital. Thus Ls1 k4t5 denotes the location of a patient at time tgiven that the patient was admitted at time s.
Remark 1. Bed capacity is not explicitly represented in thisstochastic location process; however, the location process isconstructed from data that reflects actual flows observing thebed capacity constraints (even at the ward level). For hos-pitals with significant capacity constraints we view the dataas congestion contaminated, and Theorem 1 will provide atool to estimate the ideal flows, free of off-ward placementor rejection from the hospital (types 1 and 2 blocking).
Remark 2. The fact that Ls1 k4t5 can depend on s enablesthe modeling of the key hospital feature that the length ofstay and care path can depend on the time of admission.
Dow
nloa
ded
from
info
rms.
org
by [
140.
182.
75.2
30]
on 0
8 O
ctob
er 2
016,
at 0
7:15
. Fo
r pe
rson
al u
se o
nly,
all
righ
ts r
eser
ved.

Helm and Van Oyen: Elective Hospital Admissions Optimization1270 Operations Research 62(6), pp. 1265–1282, © 2014 INFORMS
Figure 4. (Color online) Illustration of Ls1 k4t5 for threesample care paths.
321
�*
�*
s1 s2 s3 t
Loc
atio
n
Time
To characterize the stochastic location process, let ès bethe set of right-continuous functions with left limits forpatients that first enter the hospital S0 at time s. Thus, ès
represents the set of all possible sample paths of the stochas-tic location process Ls1 k4t5. An element �s ∈ès is a (deter-ministic) mapping �s2 �→S such that �s4t5 represents thelocation of the patient at time t. Figure 4 represents threedifferent sample path functions. The solid line representspath �s1
4t5, a sample path of the process Ls14t5, the dashed
line represents the path �s24t5, a sample path of the pro-
cess Ls24t5, and the dotted line represents the path �s3
4t5, asample path of the process Ls3
4t5. Path �s24t5, for example,
represents a patient who arrives at time s2 at ward 1, trans-fers to ward 3 for a brief stay, and then returns to ward 1before being discharged slightly before time t. Note that alocation function � ∈ès is a right-continuous step functionthat takes values in S0 over a continuous interval 6s1 Ts5 forsome finite Ts and that �4t5 = ã∗ for t < s and �4t5 = ã∗
for t ¾ Ts .We let the entire function space è be the collection of all
ès . For any subset â ⊆è, let the associated probability mea-sure, Ps4â5, represent the probability of realizing one of thelocation functions in â , assigning 0 measure to any locationfunctions in â that did not begin at time s (the time of thepatient’s arrival). Thus Ps4ès5= 1 and Ps4èt5= 0 for t 6= s.Ps4 · 5 characterizes the dynamics of the stochastic locationprocess, Ls1 k4t5. For our model, this measure is used to findthe probability that a patient is in ward u at time t, given thatthey arrived at the hospital at time s. To do so, we definea set of location functions and then the measure on that setas follows. The measure of the set of location functions thatindicate that the patient is in ward u at time t is the proba-bility of the patient being in ward u at time t. This set canbe written as
ât1 u = {�s ∈ès2 s ¶ t and �s4t5= u
}1 (1)
which captures the set of all location functions that placea patient in ward u at time t. Of course to be in the hos-pital at time t, the patient must have arrived before time t.Moreover, we require that the patient not remain in thehospital forever (consistent with Massey and Whitt 1993).As mentioned, the specific measure of this set is defined bythe dynamics of the stochastic location process Ls1 k4t5. Weavoid the semi-Markov process because the solution to suchprocesses for general distributions and general transition
functions is often intractable, requiring further approxima-tions. Rather, we define for each patient type, k, a specificstochastic location model with probability measure Ps1 k as
Ps1 k4ât1 u5 = pk1us 4t − s51 (2)
Ps1 k4ât1ã∗5= pk1ã∗s 4t − s5= 1 − ∑
u∈7pk1us 4t − s51 (3)
where pk1us 4t5 is the probability that a patient of type k who
arrives at time s is in ward u, t time periods after theirarrival.
For each patient type, we calculate the proportion of thetotal population present in each ward (or discharged) foreach discrete time step (see for example Table 2). It is oftenthe case that some of the historical hospital data capturesthe hospital’s reaction to congestion (e.g., “off-ward” place-ment) rather that the patients’ ideal flows. The simple solu-tion is to take patient data only from periods when the hospi-tal is not congested so that blocking and off-ward placementis minimal. Even high demand hospitals have some peri-ods of low congestion; however, this approach requires alonger period of data. In general, we propose the followingapproach to correct for data contamination.
Congestion impacts two aspects of patient flow post-admission: length of stay and ward placement. Under stan-dard procedures, no patients are forced out of the hospitalby blockage once they have been admitted. Off-ward ser-vicing during the entire hospital stay only increases LOS byaround half a day (see Anderson et al. 1988), so this per-turbation is not significant at the strategic planning level weare investigating. Thus, off-ward placement is the conges-tion effect we correct for to extract true patient flows fromcongestion-contaminated hospital data.
We model both observed flows and true flows, distin-guished notationally by adding a hat “ ˆ ” on top of theparameter to associate it with the true quantity. The fourhospitals we worked with used overflow wards and over-flow/blocking routing policies to manage congestion. There-fore, the set of wards, S0, can be partitioned into specializedwards, � ⊆ S0, and overflow wards � = S0\�. Let ai rep-resent the arrival rate to ward i and pi1 j be the probabilitythat a patient who completes service in ward i transitionsnext to ward j . Let �i represent the blocking probability inward i.
To discover the true flows, we relate the traffic equationsof the true flows in the underlying flow system to the flowmodel observed in the hospital data. Each patient type hasits own arrival rates and transfer probabilities, but for thesake of exposition, we initially suppress the dependency ofthese parameters on patient type. The system of equationsbelow can be easily extended to include arbitrarily manypatient types:
ai = ai41 − �i5 for i ∈ �1 (4)
pi1 j = pi1 j41 − �j5 for i1 j ∈ �1 (5)∑k∈�
pi1 k =∑j∈�
pi1 j �j for i ∈ �0 (6)
Dow
nloa
ded
from
info
rms.
org
by [
140.
182.
75.2
30]
on 0
8 O
ctob
er 2
016,
at 0
7:15
. Fo
r pe
rson
al u
se o
nly,
all
righ
ts r
eser
ved.

Helm and Van Oyen: Elective Hospital Admissions OptimizationOperations Research 62(6), pp. 1265–1282, © 2014 INFORMS 1271
In Equation (5), the observed transfer probability fromi to j is the true transfer probability multiplied by theproportion of time the patient is able to enter the ward(i.e., unblocked). Equation (4) follows similar logic. Equa-tion (6) means that the total probability of transitioninginto the overflow ward is the sum of all the between-wardtransitions that were blocked. Equations (4)–(6) representa nonlinear system of equations with n variables and nunknowns after patient types are included. Let P = 6pi1 j 7be the observed ward transition matrix and let P � be theits submatrix that represents the transitions between special-ized hospital wards, i.e., 8pi1 j 2 i1 j ∈ �9. Let P� =∑
i∈� Pi,where Pi is the ith column vector. In words, P� repre-sents the probability of transitioning from a specializedward into any of the overflow wards, i.e., 8
∑j∈� pi1 j : i ∈ �9.
By transforming the nonlinear system into an equivalentlinear system, we show that the traffic equations have aunique solution obtained by matrix inversion (proved inthe online appendix (available as supplemental material athttp://dx.doi.org/10.1287/opre.2014.1317)).
Theorem 1. Given P � has full rank, the traffic equationsgiven by Equations (4)–(6) have a unique solution given by
� = 4P �5−1P�1 �i =�i
1 +�i
1
ai =ai
1 − �i
1 pi1 j = pi1 j
1 − �j
0(7)
If the transition probability matrix, P � , does not have fullrank (i.e., if any rows of the matrix are linearly dependent)then we can break the matrix into submatrices of full rankby extracting rows that cause linear dependence and thenapplying Theorem 1 to each cluster separately.
To validate our method, we developed a simulation modelof admissions, blocking, and off-ward placement to gen-erate congestion contaminated census process realizationsfrom one year’s worth of data. This enabled us to comparethe results from our decontamination method with a knowntrue demand distribution. We simulated three ward hospi-tals because three wards are considered sufficient to capturethe rich network structure of interest, and this structure isoften used in the patient flow literature. We designed a testsuite of 1,000 cases with the hospital parameters generatedrandomly. We used the following parameterizations. PatientLOS for each patient type was log-normally distributed withmean (in days) and variance parameters randomly chosenfrom a uniform(2,8). The ward sizes were chosen froma uniform(8,60) distribution. Transfer probabilities wereuniform(0,1) for each pair of wards. Random arrival rateswere generated also according to a uniform, but with atten-tion to creating a stable queueing system. Using the sim-ulation, we generated congestion-contaminated “observed”data and then used Theorem 1 to estimate the underlyingflow parameters and compared our estimate with the trueparameters used to design the simulation.
The primary quantity needed to estimate a patient’s truecare pathway is the transfer probability, which had a small0.1% average absolute error across the test suite. The block-ing probability and arrival rate estimates, also had smallerrors 1.0% average absolute error and 1.5% average abso-lute percent error, respectively. As three ward structuresare taken to be representative in the patient flow litera-ture, we expect the results to be similar for other systems.The high level of accuracy demonstrated with our largetest suite supports the claim that our method is capable ofidentifying true care needs from congested historical data,enabling contamination-free parameterization of the loca-tion processes.
Once the true system dynamics have been calculated,Theorem 1 can be used in a preprocessing step (prior tocalculating patient path probabilities) to adjust the patientpathways for each individual patient type to reflect eachpatient’s true demand by removing congestion contamina-tion. We begin by noting that the hospital’s raw data accu-rately represents each patient’s desired ward (true demand)except when a patient enters an overflow ward as an off-unitpatient. This is where Theorem 1 is needed to correct forthe congestion that forced the patient into overflow wardsby capturing which ward the patient was trying to enter(their preferred ward for that segment of treatment) whenthey were forced into the overflow ward because of lack ofcapacity. To estimate the patient’s preferred ward in such asituation, we replace the line in the raw data that has one inthe overflow ward and zero in all other wards (e.g., row 2of “congestion contaminated data” in Figure 5) with a setof probabilities across all specialized wards: �4ward u isthe patient’s preferred ward5 for each u ∈ � (e.g., row 2 of“preferred ward transformation” in Figure 5).
If a patient moves to the overflow ward as a result of atransfer from ward i, then �4ward u is the patient’s pre-ferred ward � the patient was blocked5= pi1 u�u/
∑j∈� pi1 j �j ,
where pi1 j is the true probability of transferring from ward i
to ward j and �u is the blocking probability in ward u, bothobtained from Theorem 1. If, instead, the patient beginstheir stay in the overflow ward, the probability that thepatient’s preferred ward is u is given by au�u/
∑j∈� aj �j ,
where aj is the true arrival rate to ward j obtained fromTheorem 1. Thus to calculate the patient’s true demand forservice, the workload is shifted from the observed load inthe overflow ward to the specialized ward(s) that representthe patient’s preferred ward as shown in Figure 5. Doing thisfor each patient, we can transform the hospital’s congestion-contaminated raw data into congestion free data that canbe used to more accurately compute the location functionprobabilities.
An example of a fully parameterized location process forcardiology patients is shown in Table 2, illustrating beforeand after the transformation to extract the true demand overfive days. Entry 4j1 t5 of the matrix represents the proba-bility that the patient will require a bed in ward j , t timeperiods (e.g., days) after admission. In this table, ward A3
Dow
nloa
ded
from
info
rms.
org
by [
140.
182.
75.2
30]
on 0
8 O
ctob
er 2
016,
at 0
7:15
. Fo
r pe
rson
al u
se o
nly,
all
righ
ts r
eser
ved.

Helm and Van Oyen: Elective Hospital Admissions Optimization1272 Operations Research 62(6), pp. 1265–1282, © 2014 INFORMS
Figure 5. Transformation of congested data into true demand data for an individual patient who stayed in ward 4 on day 2of their hospital stay and then was transferred to an overflow unit on day 3 because the preferred ward that theywanted to transfer to was full.
Congestion contaminated data
Ward 1 W2 W3 W4 Ovrflw
Day 2 0 0 0 1 0Day 3 0 0 0 0 1Day 4 0 0 0 0 1
Preferred ward transformation
Ward 1 W2 W3 W4 Overflow
Day 2 0 0 0 1 0
Day 3 p4�1�1
/ ∑j∈�
p4� j �j p4�2�2
/ ∑j∈�
p4� j �j p4�3�3
/ ∑j∈�
p4� j �j 0 0
Day 4 p4�1�1
/ ∑j∈�
p4� j �j p4�2�2
/ ∑j∈�
p4� j �j p4�3�3
/ ∑j∈�
p4� j �j 0 0
is a cardiology ward, CCU is the critical care unit, ICU isthe intensive care unit, and C2O is a ward for short staypatients (usually less than two days). Note that the proba-bilities need not sum to 1 because implicitly the remainingprobability mass not assigned to a ward is the probability ofthe patient not requiring a hospital ward bed at time t.
Remark 3. Through testing, the optimization model pre-sented in §4 was shown to be robust to the modifica-tions to the location process resulting from correctingfor congestion-contaminated paths. The difference betweenthe optimization results using congestion contaminatedlocation functions versus the transformed “true demand”location functions was small. Over several different sce-narios, the relative percent difference in objective function(blocking probability) was very small—between 3% and5% in experiments run, or likewise a difference in expectedblockages per week of 0.05 to 0.1—and the final scheduleswere very similar. To explain how this can occur, considerthat the math model optimizes system level metrics (hospitallevel blockage, or total elective throughput) subject to con-straints on off-ward census, which is the model componentimpacted by congestion contamination. If those constraintsare not very tight, they will not have much impact. Fur-thermore, in most cases there are many possible solutionsthat achieve a similar objective value, so in many instancesa change in the off-ward constraint brought about by cor-recting for congestion contamination will not have a largeimpact on the objective if another solution with similar per-formance can be achieved by shifting some of the electiveworkload. Logically, sufficiently high levels of data contam-ination will eventually have a strong impact on the optimalsolution after correcting for data contamination.
3.3. PATTERN Poisson-Arrival-Location Model(PALM) of Emergency Census
We begin by modeling the demand for services with eachward modeled as a cluster of infinite server queues. Thereis one queue for each emergency patient type, with its ownnonhomogeneous arrival rate, its own service distribution,and its own routing probabilities, denoted by Massey andWhitt (1993) as 4Mt/Gt/�5N /Gt . It has been shown thatthe nonstationary Poisson process is a good model for emer-
gency patient arrivals (see Harrison et al. 2005), and weallow for general, nonstationary service time distributionsas well as nonstationary routing probabilities that may alsodepend on the length of stay in a given ward. Our interestlies in the number of patients demanding a bed in each ward.Letting there be �7� = M wards and n emergency patienttypes, the network of M · n queues has Qu4t5 = Q1
u4t5 +Q2
u4t5 + · · · + Qnu4t5 emergency patients placing a service
load on ward u at time t, where Qku4t5 is the demand of type
k patients for ward u. Let Q4t5=∑u∈7
∑nk=1 Q
ku4t5 denote
the total emergency patient load at time t. These two quanti-ties are sufficient for our later analysis, in which we overlaycapacities on the demand model to calculate blockages andoff-ward census.
To specify the PATTERN PALM model for the emer-gency census process, we rely on the Poisson randommeasure approach proposed by Massey and Whitt (1993).In PATTERN PALM, patients arrive according to a nonho-mogeneous Poisson process and then flow through the hos-pital according to our PATTERN stochastic location processLs1 k4t5 described in §3.2. Details of the standard Poissonrandom measure and its extension to a doubly stochasticPoisson process can be found in the online appendix EC.1,which also provides elaboration on this section. We defineour PATTERN PALM random measure in terms of thecomposition of the standard Poisson random measure M,and the PATTERN intensity measure, �. In this sectionwe refer to M, the set of measures � on �+, and N =8� ∈M: �4t5 ∈�+9, the set of measures � ∈ M that yieldinteger values.
Here we provide an alternative definition of the inten-sity of the Poisson random measure for the PALM modelto enable the extension of the arrival-location modelingapproach to deterministic controlled arrivals in §3.4. Tospecify the location random measure, we define a mappingfrom the probability space 4è1B1�5 into the measure space4M1B4M55, with B4 · 5 as the Borel sigma algebra. Let theprobability that a patient of type k arriving at time s is inward u at time t be defined as
�k4�s ∈ès2 �s4t5= u5≡ Ps1 k4� ∈è2 �4t5= u5
={
0 if t < s
pk1us 4t − s5 if t ¾ s0
(8)
Dow
nloa
ded
from
info
rms.
org
by [
140.
182.
75.2
30]
on 0
8 O
ctob
er 2
016,
at 0
7:15
. Fo
r pe
rson
al u
se o
nly,
all
righ
ts r
eser
ved.
Helm and Van Oyen: Elective Hospital Admissions OptimizationOperations Research 62(6), pp. 1265–1282, © 2014 INFORMS 1273
The random location measure of the stochastic process,Ls1 k4t5, for the subset of wards J⊆S is then specified by
åk1 s4t1J1�5={
1 if �4t5 ∈J1 � ∈ès
0 otherwise.(9)
Now we can specify the random intensity measure, Nk,for patients of type k by combining the nonhomogeneousPoisson arrival process having nonnegative deterministicintegrable external-arrival-rate function �k4t5 ∈�+ with thelocation random measure from Equations (8) and (9). Thearrival rate function, �k4t5, drives the number of type kemergency patient arrivals. Once a patient has arrived attime s, the patient then flows through the wards accordingto the PATTERN stochastic location process, Ls1 k4t5 withdynamics driven by the probability measure Ps1 k4 · 5.
The rate of flow into the group of wards J at time t oftype k arrivals entering the hospital at time s follows bymultiplying the nonstationary arrival rate by the stochasticlocation random measure: �k4s5åk1 s4t1J5. Random mea-sure Nk gives the random arrival-transition intensity of typek arrivals to wards J at time t for patients that entered thehospital over the interval 4a1 b7:
Nk44a1 b71 t1J5=∫ b
a�k4s5åk1 s4t1J5ds0 (10)
Intuitively, this can be related to Poisson splitting of anonhomogenous Poisson process. The external arrival inten-sity drives the number of arrivals over a period of time;however, each arrival will be in a particular location depend-ing on the location stochastic process Ls1 k4t5. Thereforethe external arrival intensity is distributed over time acrossthe wards (or “departed”). Because Nk is a random inten-sity, M � Nk is a random measure that represents a dou-bly stochastic Poisson process. For our purposes, the meanarrival-transition intensity in combination with the Poissonrandom measure is sufficiently precise and computation-ally efficient. The mean (deterministic) transition intensitymeasure, �k, and its properties are defined in the followinglemma (proved in the online appendix EC.2):
Lemma 1. For the deterministic average arrival intensitymeasure, �k, the following hold:
(i) �k44a1 b71 t1J5≡ E6Nk44a1 b71 t1J57=∫ b
a�k4s5
·∑u∈J pk1us 4t − s5ds,
(ii) �k is a measure on �×�×S.
We combine the mean arrival-transition intensity mea-sure with the standard Poisson random measure to obtainthe PATTERN Poisson random measure for type k patients,Mk = M ��k. Let Bi = 4ai1 bi7× ti ×Ji represent the eventthat patients arrive at the hospital on interval 6ai1 bi5, andthose patients are in the set of wards Ji ⊆S0 at some futuretime, ti. Then Mk can be shown to have a product formPoisson distribution with rate �i:
P(Mk4B15=m11Mk4B25=m21 0 0 0 1Mk4Bn5=mn
)
=n∏
i=1
e−�i�mii
mi!(11)
�i ≡ E6Mk4Bi57=�k
(4ai1 bi71 ti1Ji
)
=∫ bi
ai
�k4s5∑u∈Ji
pk1us 4ti − s5ds0 (12)
Equation (12) follows from Lemma 1. We now quantifythe distribution on the number of emergency patients in thecyclo-stationary system (mentioned in §3.1) in steady state,where the arrival pattern is repeated on a weekly basis. Ifwe let �k be the maximum length of stay for a patient oftype k (in our case study of §4.4, maxk �k = 215) then wehave the following result, which is proved in the onlineappendix EC.2.
Theorem 2. The number of emergency patients in ward u,denoted by Qu4t5 for u ∈ 811 0 0 0 1 n9, are independent Pois-son random variables for each time t ∈�+ with finite meangiven by
mu4t5=n∑
k=1
∫ t
t−�k
�k4s5pk1us 4t − s5ds0 (13)
3.4. PATTERN DeterministicControlled-Arrival-Location Model (d-CALM)of Elective Census
The approach for the elective census model representsan extension of the PALM methodology to processeswith deterministic arrivals, which we term the determin-istic controlled-arrival-location model (d-CALM). In thisapproach, arrivals occur at specific times (possibly inbatches), rather than according to a Poisson distribution.Once a patient of type k has arrived at time s, they flowthrough the hospital according to their PATTERN stochasticlocation process Ls1 k as in §3.2. This makes explicit our con-dition that each patient type has a unique location processdetermined by their characteristics at the time of admission.
3.4.1. Defining the Elective Census Stochastic Process.Combining the PATTERN model for individual patientswith the elective admission schedule, ä, it is possible tomodel the total elective census in the hospital over time torepresent either historical or future behavior. We first presentthe formal analysis, then illustrate it with an example. Ourapproach is to formulate a point process as in §3.3. Forpatients of type k, let 44tk111äk1 tk11
51 4tk121äk1 tk1251 0 0 05 rep-
resent the sequence of deterministic arrivals with tk1 i beingthe time of arrival of the ith batch of patients of type k andäk1 tk1 i
being the number of type k patients scheduled fortime tk1 i. Let ì=è� so that
�k = {�k1 4tk115111�k1 4tk115121 0 0 0 1�k1 4tk1151äk1 tk11
1�k1 4tk125111
�k1 4tk125121 0 0 0 1�k1 4tk1251äk1 tk121 0 0 0
} ∈ì
Dow
nloa
ded
from
info
rms.
org
by [
140.
182.
75.2
30]
on 0
8 O
ctob
er 2
016,
at 0
7:15
. Fo
r pe
rson
al u
se o
nly,
all
righ
ts r
eser
ved.

Helm and Van Oyen: Elective Hospital Admissions Optimization1274 Operations Research 62(6), pp. 1265–1282, © 2014 INFORMS
represents the set of location functions for the scheduledarrivals. Under the infinite capacity model, we can define thed-CALM probability measure for patients of type k beingin ward u as
�k
(8� ∈è�2 �k1 4tk1n51 n
4t5= u9)
={
0 if t < tk1n1
pk1u4tk1n5
4t − tk1n5 if t ¾ tk1n0(14)
where pk1u4tk1n5
4t − tk1n5 is as before in Equation (3). Thenwe can define the d-CALM point process, for a realizationvector � as
Nk1u1ä4t1�5=
∑s∈8tk1 i 2 tk1 i<t9
∑äk1 s
n=1 åk1 s4t1 u1�k1 s1n5
if tk11 < t1
0 if tk11 > t1
(15)
where åk1 s4 · 5 is the patient type k random measure definedfor the stochastic location process in Equations (8) and(9). It can be seen that this process describing the elec-tive/scheduled workloads across the network of wards canbe written instead as
Nk1u1ä4t5= ∑s∈8tk1 i 2 tk1 i<t9
äk1 s∑j=1
18Ljs1 k4t5= u91 (16)
where Nk1u1ä4t5 is the number of elective patients of type kin ward u at time t under schedule ä. We will work withthis more convenient form to analyze the d-CALM process,which is equivalent to the point process defined by Equa-tions (14) and (15). The ward level census can be calculatedby summing over patient types. Now we also include thesystem design assumption of a cyclically repeating electiveadmission schedule. We present the case where the hospitalis concerned with daily measures of admissions and censusas an example.
Using Equation (16) the census in ward u, C tu1d1
, can becalculated on week t on a given day d1 of the admissioncycle. If we take the length of the cycle to be one week forexample, the census in ward u on a given day d1 can becalculated for a t week horizon (C t
u1d1from Equation (17))
or an infinite horizon (C�u1d1
from Equation (18)),
C tu1d1
=7∑
d2=1
∑k∈$
äk1d2∑j=0
t∑n=0
1{Lj1 nd2+7n1k4d1 + 7t5= u
}1 (17)
C�u1d1
= limt→�
C tu1d1
1 (18)
where Lj1 ns1 k4 · 5 represents the 4j1 n5th i.i.d instance of the
location process Ls1 k4 · 5, one process for each admittedpatient, j , on a given week, n, and 18 · 9 is the indicatorfunction. In Equations (17) and (18), the first sum refers
to the day of the week that the patient was admitted. Thesecond sum refers to the diagnosis of the patient, and thethird sum represents the number of patients of that diagnosisthat are to be scheduled on day d2 of the admission cycle.The final sum over n iterates through weeks (or throughrepeating cycles). Total hospital census is found by addingup all wards.
These equations are best understood through a sim-ple example. Consider a plan that admits two cardiologypatients (patient type = CAR) every Monday. What is theload that this plan places on the cardiology ward (ward c) onTuesdays? Let 18Lj1 n
s1CAR4t5= c9 represent whether the 4j1 n5indexed cardiology patient (i.e., jth patient admitted onweek n) is in the cardiology ward c on day t given they wereadmitted on day s. On the first Monday, the system admitstwo cardiology patients (call them patient 4j = 11 n= 05 and4j = 21 n = 05). This leads to a census for Tuesday of thefirst week (n= 0) of 18L110
11CAR425= c9+ 18L21011CAR425= c9.
Note that 18L11011CAR425 = c9 and 18L210
11CAR425 = c9 are i.i.d.because they represent two different patients. In the sec-ond week we admit two more cardiology patients (call thempatient 4j = 11 n= 15 and 4j = 2, n= 15). Since the firsttwo cardiology patients admitted previously may still be inthe hospital (and thus on day 8 of their length of stay) thecensus for the Tuesday of the second week (n= 1) is
18L11011CAR495= c9+ 18L210
11CAR495= c9
+ 18L11181CAR495= c9+ 18L211
81CAR495= c90
If we let the system run for t weeks, then the census on theTuesday of week t is given by
t∑n=0
18L11 n7n+11CAR47t + 25= c9+ 18L21 n
7n+11CAR47t + 25= c90
This shows how we construct the census profile for Equa-tions (17) and (18). In this paper we are primarily interestedin the steady state behavior of the system, and thus relymostly on the infinite horizon formulation of Equation (18)in the analysis that follows.
3.4.2. Moments of the PATTERN d-CALM ElectiveCensus Process. An important feature of the d-CALMmodel is that the first and second moments of the electivecensus process can be calculated analytically, which facili-tates the elective admissions optimization. Taking the cyclelength to be one week, for example, the census mean forward u on a given day d1 can be calculated from Equa-tions (17) and (18) by the monotone convergence theorem as
�d11u4ä5=E
[ 7∑d2=1
∑k∈$
äk1d2∑j=0
limt→�
t∑n=0
1{Lj1nd2+7n1k4d1 +7t5=u
}]
=7∑
d2=1
∑k∈$
äk1d2
�∑n=0
pk1ud2−7n4d1 −d2 +7n50 (19)
Dow
nloa
ded
from
info
rms.
org
by [
140.
182.
75.2
30]
on 0
8 O
ctob
er 2
016,
at 0
7:15
. Fo
r pe
rson
al u
se o
nly,
all
righ
ts r
eser
ved.

Helm and Van Oyen: Elective Hospital Admissions OptimizationOperations Research 62(6), pp. 1265–1282, © 2014 INFORMS 1275
The equality follows from the fact that 18X = xk9 followsa Bernoulli distribution and thus E618X = xk97 = pk. Themean census level in the hospital is
∑u∈7�d11 u
4ä5.We compute the variance of the elective census pro-
cess for (1) the variance in ward census and (2) the vari-ance in total hospital census (with proof in the onlineappendix EC.2).
Lemma 2. The covariance at day t of the cyclo-stationarylocation processes for two patients of types k1 and k2 arriv-ing at times s1 and s2 being in ward u1 and u2 that wereadmitted as patient j1 and j2 of week n1 and n2 is
(i) Cov418Lj11 n1s11 k1
4t5= u19118Lj21 n2s21 k2
4t5= u295= 01for all 4j11 n11 k11 s15 6= 4j21 n21 k21 s25,
(ii) Cov418Lj1 ns1 k4t5= u19118Lj1 n
s1 k4t5= u295
= −pk1u1s 4t − s5pk1u2
s 4t − s5 for u1 6= u2.
Theorem 3. Letting d4n5 = d1 − d2 + 7n, the variance ofthe cyclo-stationary ward and total census processes onday d1 ∈ 81121 0 0 0 179 considering an infinite horizon andadmission plan ä is
(i) �2d11 u
4ä5=∑7d2=1
∑k∈$äk1d2
∑�n=0 p
k1ud2−7n4d4n55
·(1 −pk1ud2−7n4d4n55
),
(ii) �2d14ä5=∑
u∈7 �2d11 u
4ä5−∑7d2=1
∑k∈$äk1d2
·∑�n=0
∑u1 6=u2
pk1u1d2−7n4d4n55p
k1u2d2−7n4d4n55.
We see that �2d14ä5 can be written as a linear function
of the admission plan (decision) ä, and thus included inan integer programming framework for determining optimalschedules. Since, from Theorem 3, the variance is still linearin terms of our decision variables äk1d, the model remainssolvable by standard MIP solution approaches.
3.4.3. CALM with Deviations from the PlannedAdmission Schedule. Although the purpose of this paperis to develop an optimal strategic admission plan and pre-dict its benefits if followed correctly, we can also capturethe effect of deviations from the plan by letting the decisionvariable (admission target) be the mean rate of a generalstochastic arrival process. The variability around the meanrepresents deviation from the plan. The following theoremsshow that the mean of the CALM model can be calcu-lated linearly for any arrival process and that the varianceof the CALM model can be calculated linearly for a certainclass of arrival processes (with proofs given in the onlineappendix EC.2).
Theorem 4. Let Xk1d be the random number admissions oftype k and day d having mean Ɛ6Xk1d7 = äk1d. The meanworkload in ward u on day d1 is given by
�d11 u4ä5=
7∑d2=1
∑k∈$
äk1d2·
�∑n=0
pk1ud2−7n4d1 −d2 + 7n50 (20)
Theorem 5. If Var6Xk1d7 = f 4äk1d5, where f is a linearfunction, then the variance of the workload in ward u onday d1 is also linear in äk1d and is given by
4i5 �2d11u
4ä5=7∑
d2=1
∑k∈$
[äk1d2
�∑n=0
pk1ud2−7n4d4n55
·41−pk1ud2−7n4d4n555+f 4äk1d5
·( �∑
n=0
pk1ud2−7n4d4n55
)2]1
4ii5 �2d14ä5=∑
u∈7�2d11u
4ä5−7∑
d2=1
∑k∈$
äk1d2
∑u1 6=u2
�∑n=0
pk1u1d2−7n
·4d4n55pk1u2d2−7n4d4n55+
7∑d2=1
∑k∈$
f 4äk1d25
· ∑u1 6=u2
[ �∑n=0
pk1u1d2−7n4d4n55
][ �∑n=0
pk1u2d2−7n4d4n55
]0
Theorem 4 shows that the mean workload can be cal-culated linearly in the admission plan, ä regardless of thearrival distribution. Theorem 5 asserts that, if the variance ofthe arrival distribution is a linear function of the mean, thenthe variance may also be calculated linearly in ä. A numberof distributions that would be good for modeling deviationfrom the admission plan also have the property that the vari-ance is a linear function of the mean including uniform,Poisson, and normals of the form N4äk1d1 f 4äk1d55.
3.5. Validating the Hospital Census Model
The total census process (for wards and for the hospital)is approximated by summing the emergency and electivecensus processes (§3.3 and 3.4). In this section, we showthat this approximation closely matches the actual censusprocess for four hospitals from four countries and three con-tinents. For each hospital, we divided the data equally into atraining set and a test set. The training set (consisting of thefirst half of the data, in terms of time) was used to parame-terize the location process models and estimate future emer-gency arrival rates. Our model then generated emergencycensus estimates for the test set (the second half of thedata) using the PATTERN PALM model parameterized bythe location processes and emergency arrival rate estimatesfrom the training data. The d-CALM census model wasbuilt using location processes parameterized by the trainingdata and a weekly cyclo-stationary, deterministic controlledarrival (admission) process. The deterministic arrival rate ofeach type on any day was based on the mean arrival rates forelective admission by day of week in the test data. This wasdone to emulate the idea that the strategic plan was followedon average, though in the test data there were deviationsfrom the “plan” from week to week.
It is important to note that, despite the fact that we built acyclo-stationary model with deterministic planned elective
Dow
nloa
ded
from
info
rms.
org
by [
140.
182.
75.2
30]
on 0
8 O
ctob
er 2
016,
at 0
7:15
. Fo
r pe
rson
al u
se o
nly,
all
righ
ts r
eser
ved.
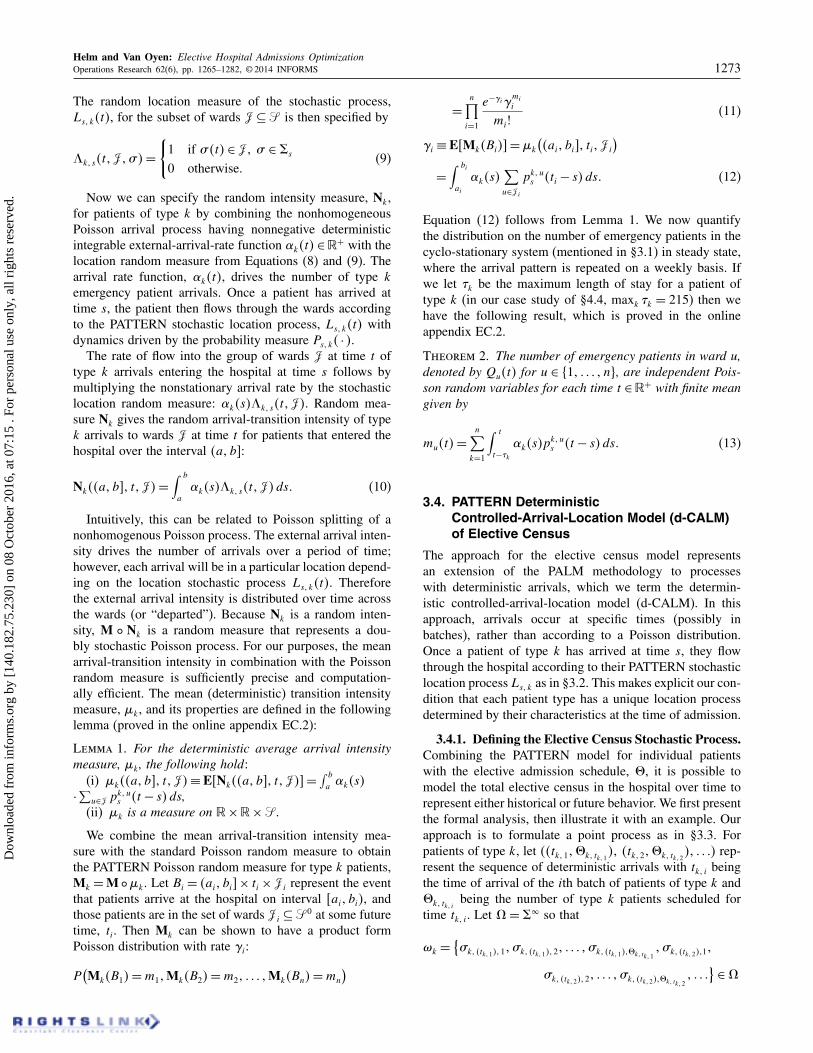
Helm and Van Oyen: Elective Hospital Admissions Optimization1276 Operations Research 62(6), pp. 1265–1282, © 2014 INFORMS
Table 3. Accuracy of the hospital level occupancy model across four hospitals on three different continents as measuredby the percent error in the mean (Err) and the percent error in the 95% quantile (95% Q Err).
Hospital 1 (%) Hospital 2 (%) Hospital 3 (%) Hospital 4 (%)All
DOW avg. Err 95% Q Err Err 95% Q Err Err 95% Q Err Err 95% Q Err
Sunday 100 001 100 −308 −206 100 204 208 302Monday −200 −001 −005 −108 −002 −401 −402 −006 −303Tuesday 003 −008 −001 −100 102 100 205 −100 −206Wednesday −107 −105 101 −007 008 −502 −509 −208 −209Thursday 003 −101 208 101 106 203 106 −108 −408Friday 104 −102 109 105 201 505 205 103 −009Saturday 206 −106 −002 −104 −006 509 704 307 307MAPE 200 009 101 106 103 306 308 200 300
Note. The mean percent error across hospitals is the first column and the mean absolute percent error (MAPE) across days of the week isgiven in the last row in bold.
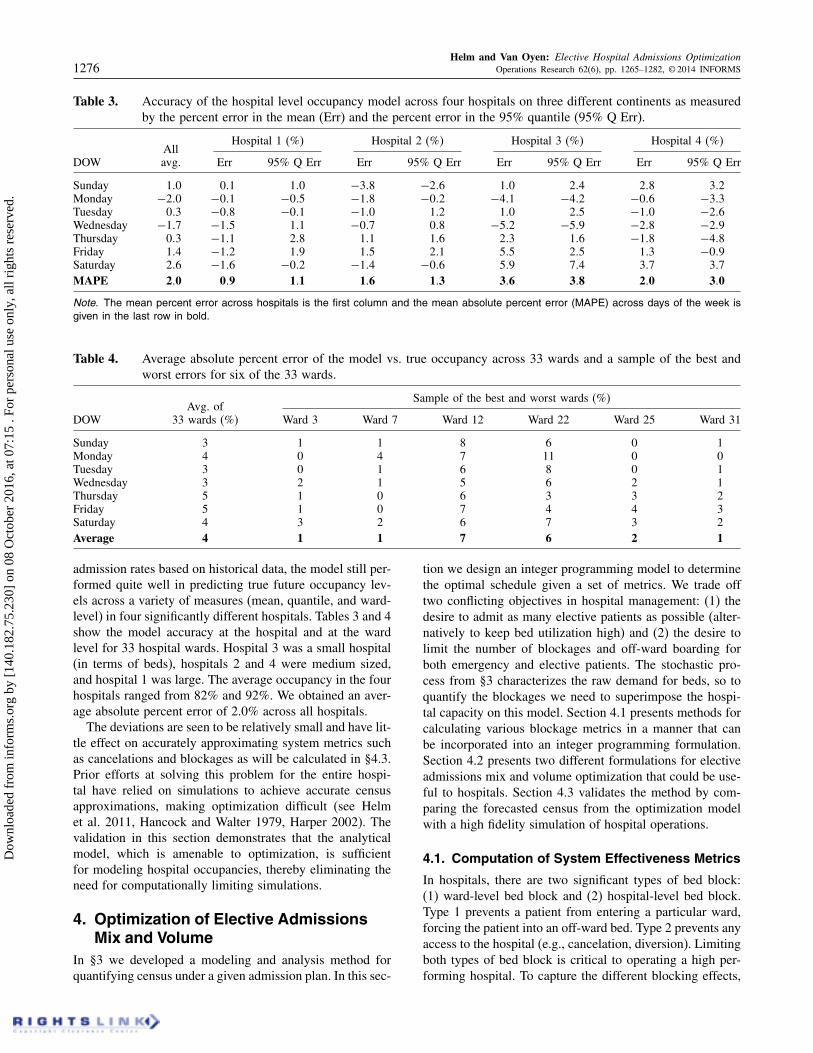
Table 4. Average absolute percent error of the model vs. true occupancy across 33 wards and a sample of the best andworst errors for six of the 33 wards.
Sample of the best and worst wards (%)Avg. of
DOW 33 wards (%) Ward 3 Ward 7 Ward 12 Ward 22 Ward 25 Ward 31
Sunday 3 1 1 8 6 0 1Monday 4 0 4 7 11 0 0Tuesday 3 0 1 6 8 0 1Wednesday 3 2 1 5 6 2 1Thursday 5 1 0 6 3 3 2Friday 5 1 0 7 4 4 3Saturday 4 3 2 6 7 3 2Average 4 1 1 7 6 2 1
admission rates based on historical data, the model still per-formed quite well in predicting true future occupancy lev-els across a variety of measures (mean, quantile, and ward-level) in four significantly different hospitals. Tables 3 and 4show the model accuracy at the hospital and at the wardlevel for 33 hospital wards. Hospital 3 was a small hospital(in terms of beds), hospitals 2 and 4 were medium sized,and hospital 1 was large. The average occupancy in the fourhospitals ranged from 82% and 92%. We obtained an aver-age absolute percent error of 2.0% across all hospitals.
The deviations are seen to be relatively small and have lit-tle effect on accurately approximating system metrics suchas cancelations and blockages as will be calculated in §4.3.Prior efforts at solving this problem for the entire hospi-tal have relied on simulations to achieve accurate censusapproximations, making optimization difficult (see Helmet al. 2011, Hancock and Walter 1979, Harper 2002). Thevalidation in this section demonstrates that the analyticalmodel, which is amenable to optimization, is sufficientfor modeling hospital occupancies, thereby eliminating theneed for computationally limiting simulations.
4. Optimization of Elective AdmissionsMix and Volume
In §3 we developed a modeling and analysis method forquantifying census under a given admission plan. In this sec-
tion we design an integer programming model to determinethe optimal schedule given a set of metrics. We trade offtwo conflicting objectives in hospital management: (1) thedesire to admit as many elective patients as possible (alter-natively to keep bed utilization high) and (2) the desire tolimit the number of blockages and off-ward boarding forboth emergency and elective patients. The stochastic pro-cess from §3 characterizes the raw demand for beds, so toquantify the blockages we need to superimpose the hospi-tal capacity on this model. Section 4.1 presents methods forcalculating various blockage metrics in a manner that canbe incorporated into an integer programming formulation.Section 4.2 presents two different formulations for electiveadmissions mix and volume optimization that could be use-ful to hospitals. Section 4.3 validates the method by com-paring the forecasted census from the optimization modelwith a high fidelity simulation of hospital operations.
4.1. Computation of System Effectiveness Metrics
In hospitals, there are two significant types of bed block:(1) ward-level bed block and (2) hospital-level bed block.Type 1 prevents a patient from entering a particular ward,forcing the patient into an off-ward bed. Type 2 prevents anyaccess to the hospital (e.g., cancelation, diversion). Limitingboth types of bed block is critical to operating a high per-forming hospital. To capture the different blocking effects,
Dow
nloa
ded
from
info
rms.
org
by [
140.
182.
75.2
30]
on 0
8 O
ctob
er 2
016,
at 0
7:15
. Fo
r pe
rson
al u
se o
nly,
all
righ
ts r
eser
ved.

Helm and Van Oyen: Elective Hospital Admissions OptimizationOperations Research 62(6), pp. 1265–1282, © 2014 INFORMS 1277
Figure 6. (Color online) Illustration of approximations for (a) expected off-ward census and (b) hospital level blockingprobability.
(b) Reduced capacity rlang approximation(a) Expected blockage approximation forwards
P(Y2 = � – E[X(Θ)2] + 2)ˆ ˆP(Y2 = � – E[X(Θ)2] + 1)ˆ ˆ
P(Y2 = � – E[X(Θ)2])ˆ ˆ
E[X(Θ)3]ˆ
E[X(Θ)2]ˆ
E[X(Θ)4]ˆ E[X(Θ)5]ˆ E[X(Θ)6]ˆ
P(Y2 = 1)ˆ
Elective patients
Emegency patients
BlockagesCapacity: B
Y2ˆ
Emegency patients
Elective patients
Erlangloss
model
True capacity:B beds
Modified capacity:B – �2, u(Θ) beds
�2, u(Θ)�3, u(Θ) �4, u(Θ) �5, u(Θ) �6, u(Θ)
Monday Tuesday Wednesday Thursday Friday Monday Tuesday Wednesday Thursday Friday
we develop two linearizing approximations to capture type1 (ward-level) and type 2 (hospital-level) blocking; illus-trated in Figure 6. Both approaches begin by calculating themean elective census by day of week (using Theorem 4),indicated by the solid bar (which we justify below). Thenumber of beds remaining (i.e., capacity minus mean elec-tive demand) is referred to as the reserved capacity (foremergency patients).
Expected Blockages2 Ward-Level. For type 1 blocking,shown in Figure 6(a), we start with the mean census, givenby Theorem 4, and add the emergency patients, indicatedby the individual bars on top of the solid bar, calculat-ing the probability of each quantity of emergency patientspresent using Theorem 2. Blockages are tallied when thenumber of emergency patients plus the mean number ofelective patients exceeds the ward capacity, Bu for ward u.This enables, for each ward, the expected amount by whichdemand will exceed capacity and therefore trigger off-wardservicing. This captures the dynamics in which patients arenot “lost” and service continues even for blocked patients,which is a better representation of reality than a loss modelor a traditional blocking model. This approximation is pre-sented mathematically in Equations (27) and (28) of §4.2.
Reduced Capacity Erlang Approximation2 Hospital Level.Demand from patients blocked from entering the hospital islost. To capture this phenomenon we propose an approxima-tion based on the Erlang loss model that we call the reducedcapacity Erlang approximation, illustrated in Figure 6(b).Blocking is calculated using the Erlang loss formula on asystem that has an offered load of m14t5, the emergencyoffered load, and number of servers B−m24t5, where m24t5is the elective offered load:
�4s −m24t51m14t55= m14t5s−m24t5/4s −m24t55!∑s−m24t5k=0 m14t5
k/k!
= �4CEm4t5= s −m24t55
�4CEm4t5¶ s −m24t550 (21)
This approximation can be linearized in the decision vari-able, ä, the elective admission schedule. In §4.2, Equa-tions (23)–(25) serve to linearly calculate to arbitrary
precision �4CEm4t5 ¶ s − m24t55. To linearize the block-ing probability constraint—limiting the blocking probabilityto a value less than �—simply multiply both sides of theinequality by the Erlang denominator:
�4s −m24t51m14t55¶ �
⇔ �(CEm4t5= s −m24t5
)¶ ��
(CEm4t5¶ s −m24t5
)0
Since �4CEm4t5¶ s−m24t55 can be calculated linearly, theErlang loss blocking constraint can be linearized. This con-straint is represented by Equations (23)–(25) of §4.2.
Since the controlled cyclo-stationary system will opti-mize a deterministic number of elective admissions by dayof week, the majority of the census variability will nowcome from the emergency patients, which we capture withthe emergency census distribution. Hence, these approxi-mations capture much of the stochastic dynamics that con-tribute to blocking. This likely explains the good accuracyof these approximations using real data that are exhibitedin §4.3.
4.2. Mixed-Integer Programming Formulation
We begin this section with notation and then proceed toa formulation of the elective admission mix and volumeoptimization model. The cycle length we consider is days11 0 0 0 17 to match a typical weekly schedule.
Sets$ set of elective patient diagnosis types,7 set of hospital wards.
ParametersBu ward u capacity in terms of beds,� limit on the blocking probability for arriving
patients,�u percent of total cancelations that are attributed to
ward u,�u limit on the average number of off-ward patients
allowed for ward u,pk1us 4d5 probability that an elective patient of type k admit-
ted on day s is in ward u, d days after admission,
Dow
nloa
ded
from
info
rms.
org
by [
140.
182.
75.2
30]
on 0
8 O
ctob
er 2
016,
at 0
7:15
. Fo
r pe
rson
al u
se o
nly,
all
righ
ts r
eser
ved.

Helm and Van Oyen: Elective Hospital Admissions Optimization1278 Operations Research 62(6), pp. 1265–1282, © 2014 INFORMS
puz1d probability there are z emergency patients in
ward u on day d from the PATTERN PALM model,pz1d probability there are z emergency patients in the
hospital on day d from the PATTERN PALMmodel,
�k1d current elective admission volume of type kpatients on day d,
�k1d maximum number of elective admissions of type kallowed on day d,
R reward vector where Rk is the reward for admittingpatient of type k.
Decision variablesäk1d number of type k ∈$ patients scheduled on day d,�1z1d indicator of whether z emergency patients in the hos-
pital on day d would exceed capacity,�2z1d indicator of whether z emergency patients in the hos-
pital on day d would exceed capacity minus one,�uz1d number of ward u off-ward patients on day d if there
are z emergency patients in ward u.It is important to note here that the probabilities pk1u
s 4d5,puz1d, and pz1d are all calculated offline per the analysis in
§§3.3 and 3.4 and then become data inputs to the two mixed-integer programs that follow.
4.2.1. Maximum Elective Admissions Formulation.First we present a formulation that maximizes the weightedthroughput of elective admissions subject to constraints onbed blockage; 1 denotes a column vector of all ones andM is a large number. For the sake of generality we includethe “reward” row vector, R, providing a relative value ofadmitting a patient of type k. Our validation sets R to be arow of all 1’s (every patient type has the same value) andthen manipulates the constraints if management’s goal is toincrease the volume of one particular service:
maxä1�1 �
R ·ä ·1 (22)
s.t. M�1z1d1
¾z−∑u∈7
(Bu−
7∑d2=1
∑k∈$
äk1d2
·�∑n=0
pk1ud2−7n4d1 −d2 +7n5
)
d1 =11000171 z=11210001 (23)
M�2z1d1
¾z−∑u∈7
(Bu−
7∑d2=1
∑k∈$
äk1d2
·�∑n=0
pk1ud2−7n4d1 −d2 +7n5
)+1
d1 =11000171 z=11210001 (24)�∑z=0
pz1d
(�1z1d−�2
z1d
)¶�
(1−
�∑z=0
pz1d�1z1d
)
d=11000171 (25)
�iz+11d¾�i
z1d i=1121 d=11000171 z=11210001 (26)
�uz1d1
¾z+7∑
d2=1
∑k∈$
äk1d2·
�∑n=0
pk1ud2−7n4d1 −d2 +7n5
−Bu−�u
7∑d=1
�∑l=0
pl1d
l∑z=0
�1z1d
∀u∈71 d1 =11000171 z=11210001 (27)�∑z=0
puz1d�
uz1d¶ �u ∀u∈71 d=11000171 (28)
�uz+11d¾ �u
z1d d=11000171 z=11210001 (29)
7∑d=1
äk1d¾7∑
d=1
�k1d ∀k∈$1 (30)
äk1d¶ �k1d ∀k∈$1 d=11000171 (31)
äk1d1�uz1d ∈�+1�1
z1d1�2z1d ∈80119
∀k∈$1 u∈71 z∈�1 d=1121000170 (32)
The objective function, Equation (22), maximizes theweighted throughput of elective patients. Constraints 23–25calculate the reduced capacity Erlang approximationdescribed in §4.1 by setting indicator decision variables:�1z1d = 18z emergency patients exceeds hospital capacity on
day d9 in Equation (23) and �2z1d in Equation (24), which is
the same except that capacity is reduced by 1. Thus
�∑z=0
pz1d�1z1d =�4Emerg Load ¾ Capacity5 and
�∑z=0
pz1d�2z1d =�4Emerg Load ¾ Capacity − 150
That means that the LHS of Equation (25) is precisely�(Emerg Load = Capacity). The RHS is therefore �(EmergLoad ¶ Capacity), completing the Erlang loss B formuladescribed in §4.1. Note that
7∑d2=1
∑k∈$
äk1d2·
�∑n=0
pk1ud2−7n4d1 −d2 + 7n5
is �d11 u4ä5 from the analysis of the CALM model in
§3.4.2 (Theorem 4) and pn1d is the Poisson probabilitiesfrom Theorem 2 of §3.3. Constraints 27–28 mathemat-ically capture the expected off-ward census approxima-tion detailed in §4.1. In constraint 27, note that the term�u
∑7d=1
∑�l=0 pl1 d
∑lz=0 �
1z1d is subtracted from �d11 u
4ä5,which accounts for the fact that, if patients are blocked fromthe hospital, they will not contribute to ward demand andoff-ward census. The parameter �u refers to the historicaltrend and/or hospital protocols for what types of patients getcanceled when a cancelation decision must be made. Notethat, although we use infinite sums to represent expectationsand blocking probabilities, truncating these to finite sums isnecessary. One approach is to truncate based on the product
Dow
nloa
ded
from
info
rms.
org
by [
140.
182.
75.2
30]
on 0
8 O
ctob
er 2
016,
at 0
7:15
. Fo
r pe
rson
al u
se o
nly,
all
righ
ts r
eser
ved.

Helm and Van Oyen: Elective Hospital Admissions OptimizationOperations Research 62(6), pp. 1265–1282, © 2014 INFORMS 1279
of the overage and the Poisson probabilities (which decayquickly two standard deviations above the mean) to limitthe expected overage error. The same truncation scheme isused for both the z index (Equations (23), (24), (27)) andthe n index (Equations (23)–(29)) since the two are linkedthrough the � and � helper variables.
Constraints 26 and 29 are cuts that were added to themodel to increase solution speed by greatly reducing thenumber of combinations that must be considered by branchand bound. The meaning of Equation (26) (Equation (29))is straightforward: if an n patient emergency load exceedscapacity (exceeds capacity by a certain amount) then ann+ 1 patient emergency load will also exceed capacity(exceed by at least as much). Without this constraint, amodel with three wards and three patient types failed tosolve in under 24 hours, whereas solving in under 30 sec-onds with the constraint.
The final two constraints, Equations (30) and (31), repre-sent the reality that the model should not change the electiveadmission schedule in ways incommensurate with historicalhospital practice. Specifically Equation (30) ensures that,under the improved plan, no service’s planned volume isreduced from their historical levels (a feature easily con-trolled if a specialty OR service needs to target a differentload). Equation (31) allows the model to enforce capacityconstraints beyond hospital beds. For example, limiting theamount of operating room time, or enforcing the typicalpractice to admit few or no elective patients on the week-ends (e.g., äk1Sunday ¶ 0 ∀k).
4.2.2. Minimum Blockages Formulation. Anotheruseful formulation is to keep the weekly volume of electiveadmissions fixed and attempt to minimize the number ofblockages. This model reshuffles the mix of elective admis-sions across the days of the week to eliminate unnecessaryblockages caused by an unstable, unbalanced schedule. Themain difference in this formulation is that the objective func-tion becomes the expected number of blockages:
minä1�1 �
7∑d=1
�∑l=0
pl1d
l∑z=0
�1z1d0 (33)
We no longer need the blocking constraints defined byEquations (23), (25), and (26) would only apply to �1
z1d,since �2
z1d is no longer needed as a decision variable.Another possible objective that our framework is capable
of capturing is minimizing the day-to-day variability of bed
Table 5. Simulation output vs. stochastic model output for characteristic hospital measures.
Sunday Monday Tuesday Wednesday Thursday Friday Saturday Total
Simple census 7100 8508 8508 8507 8500 8809 7409 N/AApproximate census 7302 8701 8505 8601 8503 8804 7505 N/ADifferent census (%) 301 106 −004 004 004 −006 008 N/ASim blockages 0000 0037 0038 0035 0027 0066 0000 2003Approximate blockages 0000 0034 0028 0034 0027 0067 0000 109Different blockages 000 0003 001 0001 000 0001 000 0013
Figure 7. Simulation output vs. stochastic model outputfor characteristic hospital measures.
census. For example, it would be possible to minimize thegap between the largest and smallest daily census withinthe MIP.
4.3. Validating the Hospital CensusOptimization Model
As in §3.5, it is important to quantify the accuracy of thehospital census and blockage approximations for the opti-mal elective schedule. Because there is no historical recordof hospital census and blockages for the optimal schedule,we compare the census approximation with a high-fidelitysimulation model that has already been validated againsthistorical hospital data (see Helm et al. 2011, 2010, 2009).
A year’s worth of historical data from a medium-sized,nonteaching partner hospital was used to calibrate both theoptimization and simulation models for a core subset ofnine hospital wards (out of 22 total), including medicine,surgical, and ICU/CCU wards. This reduced the amount ofdata analysis and cleaning without degrading the value ofthe study.
Figure 7 and Table 5 confirm that the stochastic cen-sus model is a good approximation of actual census levelsand blockages. The small bias toward higher census levelscan be explained by the manner in which the simula-tion treats cancelations and blockages. In the simulation,the demand from cancelations and blockages is consideredlost (an approximation of reality), whereas the censusapproximation models the overall demand for beds without
Dow
nloa
ded
from
info
rms.
org
by [
140.
182.
75.2
30]
on 0
8 O
ctob
er 2
016,
at 0
7:15
. Fo
r pe
rson
al u
se o
nly,
all
righ
ts r
eser
ved.

Helm and Van Oyen: Elective Hospital Admissions Optimization1280 Operations Research 62(6), pp. 1265–1282, © 2014 INFORMS
loss. Although blockages are calculated, the blockedpatients are not removed from the demand calculations,which yields the depression of census in the simulation ver-sus the analytical model. The reality is likely somewhere inbetween, as some demand is lost and some is rescheduled.Regardless, the estimated values are very close; averageweekly blockages only differ by 0.13 patients in absolutevalue and the census differs on average by only 1%. Becausethe stochastic census model is an accurate approximation,a detailed (and slow) simulation is no longer needed toexpress the trade-offs between census and blockages todesign effective admission schedules.
4.4. Case Study, Proof of Concept, and ImprovingManagement Practice
To demonstrate the effectiveness and potential uses of ourapproach to elective admissions scheduling, we validateour method for the partner hospital of §4.3 by compar-ing our optimized schedules with the current schedule forovernight patients. In 2008, 14,827 patients stayed at leastone night, of which 7,016 were emergency patients andthe remaining 7,811 were scheduled patients. Patients trans-ferred within the hospital 20,462 times for an average of 1.4transfers per patient, which underscores the importance ofmodeling ward network effects. The nine wards we modelcomprise about 60% of the total patient volume with similarcharacteristics to the total patient population.
One of our primary goals when developing our newmodeling methodology was to address patient blockage(see §4.2.2), both elective cancelations and emergencypatient bed block, without reducing the number of patientsserved. The wards modeled admitted 90 elective inpatientsper week on average. The minimum blockage formulationof §4.2.2 was employed, constraining the weekly electivevolume to equal 90 and also constraining the volumes oneach admitting service to match the current level so thatthe mix remains constant. The optimization generated anoptimal schedule matching these criteria, which we thensimulated (for completeness) to compare with the currentschedule. The result was a 32% reduction in average can-celations per week, shown as the data point at the end of
Figure 8. (Color online) Controlling census and occupancy variability in hospitals and obtaining trade-off insights withour methodology.
(a) Occupancy results with current and optimized schedules
65707580859095
100105110
Sun Mon Tue Wed Thu Fri Sat
Ave
rage
occ
upan
cy (
%)
Smooth censusCurrent schedule
Maximum occupancy
2.72.93.13.33.5
Elective admissions vs. blockages
Currentschedule Improving
1.51.71.92.12.32.5
82 84 86 88 90 92 94 96 98
Wee
kly
bloc
kage
s
Weekly elective admissions
(b) Pareto curve insight into blockage vs. throughput
the down arrow in Figure 8(b). This reduction results fromreducing the midweek occupancy and smoothing the cen-sus as seen in Figure 8(a), which compares the original andoptimal census curves.
Some hospitals with growth potential will want toincrease the volume of patients served while maintainingthe same level of access. To achieve this, the maximumadmissions formulation of §4.2.1 is employed, constrain-ing the blockages to be less than or equal to the current(3.29 per week) and maximizing the number of admissions.This included Constraint 30 to ensure that each service isgiven at least as many elective admissions as in the currentschedule. The data point at the end of the right arrow in Fig-ure 8(b) shows an additional 310 elective admissions peryear (six per week) with slightly better access (3.27 block-ages per week).
Remark 4. Because of Little’s Law (WIP = Throughput ∗Cycle Time) and Constraint (30) that maintains (or in-creases) the historical average number of patients scheduledper unit time, the average delay to obtain an admission forscheduled patients will not increase.
Improving Management Practice. These prescriptivemodels are useful in exploring the boundaries of hospitalefficiency, but hospitals may prefer a balance between vol-ume and blockage, which our method can also provide. ThePareto curve in Figure 8(b) presents the trade-off betweenelective admission volume and blockages. Notice that thecurrent schedule is above the Pareto curve so it can beimproved by increasing admissions, decreasing blockages,or both.
To generate the Pareto curve, we use the extreme pointsas boundaries and employ the minimum blockage formu-lation by iterating the weekly number of elective admis-sions between 90 and 96 and determining the schedule withthe fewest blockages at each admission level. The com-putational speed with which the analytical model gener-ates this curve represents an advance in decision supportthat enables hospital administrators to understand the keytrade-offs involved in scheduling their admissions and givesthem the freedom to choose their desired operating point.
Dow
nloa
ded
from
info
rms.
org
by [
140.
182.
75.2
30]
on 0
8 O
ctob
er 2
016,
at 0
7:15
. Fo
r pe
rson
al u
se o
nly,
all
righ
ts r
eser
ved.

Helm and Van Oyen: Elective Hospital Admissions OptimizationOperations Research 62(6), pp. 1265–1282, © 2014 INFORMS 1281
Our optimization models were able to generate the operat-ing curve automatically in a matter of minutes, with eachpoint taking about 30 seconds.
The key implication is a capability (which we believe isboth highly important and not currently possible) to makestrategic admission policies at the hospital level regardingthe trade-off between throughput and access. This trade-offis the key to cost, quality, and access, and the Pareto curveprovides hospital managers the ability to make informeddecisions that affect this trade-off.
Implementing the Strategic Admission Plan. As men-tioned in §3.1, the output of the optimization is a set of deci-sion rules that guide the maximum number of admissions ofeach type of patient that can be admitted on a given day ofthe admission cycle. To avoid being too restrictive (and riskincreased barriers to acceptance) an implementation shouldallow the admissions personnel to fill the slots with what-ever patients they would like to schedule as long as theydo not exceed the admission numbers by patient type. Justas with most other appointment systems, when all the slotsfill up on a given day the patient must be scheduled for adifferent day with slots available.
It is also important to note that our model can go farbeyond what has been presented in the case study. Forexample, the model can be used to design unique sched-ules for each season—many hospitals have a low seasonand a high season in terms of patient demand—by solv-ing one optimization for each season modeled. Another wayto incorporate projected changes in demand (e.g., hiringmore surgeons) is to extend the cycle length (which can beadjusted to any desired cycle length). Demand forecasts foremergency patients can also be incorporated by modifyingthe arrival rates over an admission cycle that matches thedemand forecast horizon.
5. Conclusions and Future WorkWe have developed new models for a longstanding prob-lem in hospital operations. This methodology can efficientlygenerate optimal schedules to meet high-level hospital cri-teria while modeling the entire hospital as a coordinatedsystem. The results have significant potential to inform hos-pital decision makers as to how to use admission schedulingas a tool to create a healthcare delivery system that is lesscostly while providing better access, quality, and service topatients.
Rather than mandating specific implementations of elec-tive procedure scheduling, our approach provides decisionsupport on case mix and volume by patient type by dayof week, mitigating barriers to adoption. Additionally, thediscipline and predictability obtained by embracing thissystem of smoothed census will streamline hospital proce-dures, stabilize the operating environment for hospital per-sonnel, more efficiently utilize fixed hospital resources, andyield significant cost savings. For example, census vari-ability reduction enables, among other things, cost savingsin nurse staffing while better facilitating proper nurse topatient ratios.
The HASC problem has been approached in many ways;however, previous approaches have not been able to gen-erate optimal schedules for the entire hospital, includingward network effects. The simulation approaches capturethe critical general network effects, but they lack a clearschedule optimization method. The scheduling optimizationmodels, on the other hand, have not included the generalnetwork effects, such as ward transfers and off-ward cen-sus, that are critical to accurately modeling the true censusload on hospital wards. Our modeling approach has bridgedthis gap by accurately capturing the census and blockagedynamics analytically, eliminating the need for simulationand enabling the use of MIP methods. To do so we formu-lated a PATTERN PALM “arrival-location-model” to showthat the emergency demand for beds by ward can be charac-terized as independent Poisson random variables. Secondly,we extended the PALM approach to a new d-CALM forelective admissions and analyzed its properties.
Through the validation process of the hospital censusmodel in §3.5 and the analysis of optimization results, wehave generated a number of managerial insights in additionto the methodological contributions. The results of our anal-ysis and case study show that (1) smooth census levels doin fact improve blocking and throughput performance, and(2) elective admission scheduling can be used to smoothcensus while constraining the amount of planned off-wardplacement across the network of hospital resources. Thus,from a managerial perspective, the goal should be to designadmission plans that drive toward smooth census levels evenin the absence of an optimization model. Further, our val-idation indicated that a cyclo-stationary (weekly) modelwith a deterministic elective admissions schedule can be afairly accurate model of actual hospital flows even whentightly controlled elective admissions processes are not inplace. Although hospital blocking and off-ward placementare complicating realities that contaminate historical data,we showed that one can often use a system of linear equa-tions to parameterize a corrected flow model from historicaldata. Our results provide strong evidence that model-basedanalysis using historical data can predict and smooth censusby day of week (or cycles of arbitrary lengths).
Methodologically, the novel analytical models developedare much more tractable and powerful than prior mod-els, allowing the generation of trade-off curves for hospi-tal blocking versus throughput. This curve represents aneffective decision-making tool for hospital administrators,because it enables flexibility and choice rather than a fixedsolution. This approach is likely to increase acceptanceby administrators, enabling them to make important deci-sions based on deeper managerial insights and quantita-tive analysis.
Supplemental Material
Supplemental material to this paper is available at http://dx.doi.org/10.1287/opre.2014.1317.
Dow
nloa
ded
from
info
rms.
org
by [
140.
182.
75.2
30]
on 0
8 O
ctob
er 2
016,
at 0
7:15
. Fo
r pe
rson
al u
se o
nly,
all
righ
ts r
eser
ved.
Helm and Van Oyen: Elective Hospital Admissions Optimization1282 Operations Research 62(6), pp. 1265–1282, © 2014 INFORMS
Acknowledgments
The authors wish to thank the reviewers, the area editor, and thedepartment editor for helpful comments that greatly improved thetechnical elements of this paper. This work was supported in partby the National Science Foundation [Grant CMMI-1068638].
ReferencesAdan I, Bekkers J, Dellaert N, Vissers J, Yu X (2009) Patient mix optimisa-
tion and stochastic resource requirements: A case study in cardiotho-racic surgery planning. Health Care Management Sci. 12(2):129–141.
Aiken LH, Clarke SP, Sloane DM, Sochalski J, Silber JH (2002) Hos-pital nurse staffing and patient mortality, nurse burnout, and jobdissatisfaction. JAMA 288(16):1987–1993.
Anderson P, Meara J, Brodhurst S, Attwood S, Timbrell M, GathererA (1988) Use of hospital beds: A cohort study of admissions to aprovincial teaching hospital. BMJ 297(6653):910–912.
Bekker R, Koeleman PM (2011) Scheduling admissions and reducing vari-ability in bed demand. Health Care Management Sci. 14(3):237–249.
Brownson K, Dowd SB (1997) Floating: A nurse’s nightmare? The HealthCare Management 15(3):10–15.
Chow VS, Puterman ML, Salehirad N, Huang W, Atkins D (2011) Reduc-ing surgical ward congestion through improved surgical schedulingand uncapacitated simulation. Production Oper. Management 20(3):418–430.
Connors MM (1970) A stochastic elective admissions scheduling algo-rithm. Health Serv. Res. 5(4):308–319.
Derlet RW, Richards JR, Kravitz RL (2001) Frequent overcrowding in U.S.emergency departments. Acad. Emergency Medicine 8(2):151–155.
Fatovich DM, Nagree Y, Sprivulis P (2005) Access block causes emer-gency department overcrowding and ambulance diversion in Perth,Western Australia. British Medical J. 22(5):351–354.
Forster AJ, Stiell I, G. Wells, Lee AJ, Van Walraven C (2003) The effectof hospital occupancy on emergency department length of stay andpatient disposition. Acad. Emergency Medicine 10(2):127–133.
Gallivan S, Utley M (2005) Modelling admissions booking of elec-tive in-patients into a treatment centre. IMA J. Management Math.16(3):305–315.
Gallivan S, Utley M, Treasure T, Valencia O (2002) Booked inpatientadmissions and hospital capacity: Mathematical modelling study.British Medical J. 324(7332):280–282.
Griffith JR, Hancock WM, Munson FC (1978) Cost Control in Hospitals(Lippincott Williams & Wilkins, Philadelphia).
Hancock WM, Walter PF (1979) The use of computer simulation todevelop hospital systems. SIGSIM Simul. Dig. 10(4):28–32.
Hancock WM, Walter PF (1983) The “ASCS”: Inpatient Admis-sion Scheduling and Control System (Health Administration Press,Ann Arbor, MI).
Harper PR (2002) A framework for operational modelling of hospitalresources. Health Care Management Sci. 5(3):165–173.
Harrison GW, Shafer A, Mackay M (2005) Modelling variability in hos-pital bed occupancy. Health Care Management Sci. 8(4):325–334.
Helm JE, AhmadBeygi S, Van Oyen MP (2009) The flexible patient flowsimulation framework. Proc. 2009 IIE IERC Conf.
Helm JE, AhmadBeygi S, Van Oyen MP (2011) Design and analysis ofhospital admission control for operational effectiveness. ProductionOper. Management 20(3):359–374.
Helm JE, Lapp M, See BD (2010) Characterizing an effective hopsitaladmission scheduling and control management system: A geneticalgorithm approach. Proc. 42nd Winter Sim. Conf (IEEE, Piscataway,NJ), 2387–2398.
Hoot NR, Aronsky D (2008) Systematic review of emergency departmentcrowding: causes, effects, and solutions. Ann. Emergency Medicine55(2):126–136.
Jun JB, Jacobson SH, Swisher JR (1999) Application of discrete-eventsimulation in health care clinics: A survey. J. Oper. Res. Soc. 50(2):109–123.
Leung KK, Massey WA, Whitt W (1994) Traffic models for wirelesscommunication networks. Selected Areas Comm., IEEE J. 12(8):1353–1364.
Liu Y, Whitt W (2011) A network of time-varying many-server fluidqueues with customer abandonment. Oper. Res. 59(4):835–846.
Massey WA, Whitt W (1993) Networks of infinite-server queues withnonstationary Poisson input. Queueing Syst. 13(1):183–250.
Massey WA, Whitt W (1994a) A stochastic model to capture spaceand time dynamics in wireless communication systems. ProbabilityEngrg. Informational Sci. 8(4):541–569.
Massey WA, Whitt W (1994b) An analysis of the modified offered-loadapproximation for the nonstationary erlang loss model. Ann. Appl.Probability 4(4):1145–1160.
McManus ML, Long MC, Cooper A, Mandell J, Berwick DM, PaganoM, Litvak E (2003) Variability in surgical caseload and access tointensive care services. Anesthesiology 98(6):1491–1496.
Mirel LB, Carper K (2013) Expenses for hospital inpatient stays, 2010.AHRQ, Statist. Brief 401. http://meps.ahrq.gov/mepsweb/data_files/publications/st401/stat401.shtml.
Needleman J, Buerhaus P, Mattke S, Stewart M, Zelevinsky K (2002)Nurse-staffing levels and the quality of care in hospitals. New Eng-land J. Medicine 346(22):1715–1722.
Proudlove NC, Gordon K, Boaden R (2003) Can good bed managementsolve the overcrowding in accident and emergency departments?British Medical J. 20(2):149–155.
Richardson DB (2006) Increase in patient mortality at 10 days associ-ated with emergency department overcrowding. Medicine J. Australia184(5):213–216.
Sprivulis PC, Da Silva J, Jacobs IG, et al. (2006) The associationbetween hospital overcrowding and mortality among patients admit-ted via Western Australian emergency departments. Med. J. Australia184:208–212.
Jonathan E. Helm is an assistant professor of operations anddecision technologies at the Kelley School of Business, IndianaUniversity. His research interests include capacity managementin healthcare networks, patient flow modeling and optimization,patient monitoring for chronic disease, and distribution of med-ical aid in developing countries. Recently, he has been study-ing mechanisms to reduce the impact of hospital readmissionsat both the operational and policy levels. His awards and honorsinclude an invitation to give a Showcase Presentation at the 2014POMS CHOM Mini Conference, he was finalist (2nd place) in the2013 INFORMS Data Mining Best Student Paper Competition,he received first prize in the 2012 INFORMS “Doing Good withGood OR,” and he received first prize in 2011 and he was thefinalist in 2012 for the POMS CHOM best paper competition.
Mark Van Oyen is a professor of industrial and operationsengineering (IOE) at the University of Michigan, which he joinedin 2005. His research includes the analysis, design, control,and management of operational systems, with emphasis on per-formance, flexibility, and controlled queueing network models.Healthcare operations research and medical decision making arekey application areas. His awards with student advisees includefirst prize in the 2012 MSOM Student Paper Competition, the2012 INFORMS “Doing Good with Good OR” first prize, andtwo finalist papers with MSOM. He also coauthored papers thatwon the 2010 Pierskalla Award, second prize in the 2013 POMSCHOM best paper competition, and first and second prize win-ning papers in the 2011 POMS CHOM competition. He was theIOE Department Faculty of the Year for 2008–2009, an ALCOAManufacturing Systems Faculty Fellow, and the 2003 Researcherof the Year at Loyola University Chicago’s School of Business.
Dow
nloa
ded
from
info
rms.
org
by [
140.
182.
75.2
30]
on 0
8 O
ctob
er 2
016,
at 0
7:15
. Fo
r pe
rson
al u
se o
nly,
all
righ
ts r
eser
ved.