design and innovation quotient report india 2018 · design led innovation, closer to home, indian...
TRANSCRIPT

Design and innovation quotient report India 2018
February 2019
KPMG.com/in

Table ofcontents
Foreword ..... 01
07
25
03
15
37
55
11
31
49
05
19
43
57
About the Design quotient survey .....
Design quotient maturity model .....
How can assessing the design quotient help organisations?.....
Executive summary .....
09Key findings of the survey .....
Demographic survey of the respondents .....
Building block 1: Values .....
Building block 2: Behaviour .....
Building block 4: Processes .....
Building block 3: Climate .....
Building block 5: Resources .....
Building block 6: Success .....
Conclusion .....
Appendix – Methodology .....
1
2
3
4
5
6
7
8
9
10
11
12
13
14
15
© 2019 KPMG, an Indian Registered Partnership and a member firm of the KPMG network of independent member firms affiliated with KPMG International Cooperative (“KPMG International”), a Swiss entity. All rights reserved© 2019 KPMG, an Indian Registered Partnership and a member firm of the KPMG network of independent member firms affiliated with KPMG International Cooperative (“KPMG International”), a Swiss entity. All rights reserved.

ForewordDesign is everywhere. From manifesting itself in beautifully-designed everyday products, thoughtfully-designed services, delightful experiences, to strategically-designed complex business processes, design touches lives in more ways than one.
Traditionally, design’s role has been limited to the aesthetic presentation of products. This meant that design was confined to a department tasked to make an already
developed idea, more appealing to customers.
Today, design assumes a more important role in helping businesses drive results and stay ahead of the competition. Design’s ability to be human centered and help meet customers’ needs and desires better, has put it at the front and centre of an organisation’s strategy. It is an expression that manifests itself not only in aesthetics but also in the functional and emotional elements of a product, service or experience.
Design is helping organisations achieve their aim to guide all departments to focus more effectively on customers, even those that are not close to customers. Leveraging design, businesses are able to empathise, experiment and co-create with the customers to craft compelling and differentiated experiences, products and services. Many organisations are also driving design as strategy through their boardroom agenda.
Prasanth ShanthakumaranPartner Digital Consulting
© 2019 KPMG, an Indian Registered Partnership and a member firm of the KPMG network of independent member firms affiliated with KPMG International Cooperative (“KPMG International”), a Swiss entity. All rights reserved© 2019 KPMG, an Indian Registered Partnership and a member firm of the KPMG network of independent member firms affiliated with KPMG International Cooperative (“KPMG International”), a Swiss entity. All rights reserved.
In essence, design is fast becoming a common language to solve complex business challenges. However, the journey to a design-led transformation is gradual and the shift begins with a change to a customer-centric mindset. Then the organisation will feel the need for a common language in the form of a process. Embracing and follow through on the process brings a collective mindset change. A transformed organisational mindset
adopts design as a way of life and builds culture.
Organisations that make this shift to understand customers better will be better positioned to excel in today’s dynamic and complex environment. While the foreign multinational firms have taken a note and been quick to adopt as well as drive design led innovation, closer to home, Indian organisations are recently discovering design and are yet to realise its full potential.
KPMG in India’s Design Thinking practice is engaged in making efforts to evangelise design led thinking and support organisations in their design journey.
The first edition of this annual study is our sincere effort to provide you with a picture of design maturity in the Indian landscape. This report aims to introduce what we believe to be the six key building blocks of design and innovation capability and examine the level of
maturity of organisations in India across those key dimensions.
We hope you find contents of this report insightful and this first edition will help evolve the conversation of design in India. We would welcome the opportunity to discuss how you can best leverage these insights to build design capabilities and a customer-centric business.
02 01D
esig
n a
nd
inn
ovat
ion
qu
oti
ent
rep
ort
Ind
ia 2
018
About the Design quotient surveyKPMG in India presents its first edition of design quotient survey. This initiative kicks off this year with an objective to assess the maturity of the design mindset, skillsets and impact across organisations in India and their performance on the six key building blocks of a design-driven culture. This year’s survey received a good response from participants across industries. Over 160 responses received
had a good mix of industries, geographies, business models, and organisation size.
The design quotient is a measure of how design driven an organisation is. The primary purpose of design quotient is to help organisations evaluate their current maturity of design capability, understand the key drivers of this capability and progress towards building a design-driven organisation.
In this report, you will find overall design quotient of India Inc., key industries and key themes/observations reported under executive summary section. In the remainder of the report, we introduce and examine performance of each of the six building blocks by industries, organisation type, size, region etc. highlighting interesting trends and opportunities.
04 03
© 2019 KPMG, an Indian Registered Partnership and a member firm of the KPMG network of independent member firms affiliated with KPMG International Cooperative (“KPMG International”), a Swiss entity. All rights reserved© 2019 KPMG, an Indian Registered Partnership and a member firm of the KPMG network of independent member firms affiliated with KPMG International Cooperative (“KPMG International”), a Swiss entity. All rights reserved.
Des
ign
an
d in
nov
atio
n q
uo
tien
t re
po
rt In
dia
201
8

06 05
Design quotient maturity model
Journey from framework to level of maturity
Design Quotient Level of Maturity
A weighted measure of
performance on DQF on a
scale of 5
Design as CultureDesign is institutionalised and becomes part of organisations DNA
Design as StrategyDesign is among core tenets of organisation strategy, helps drive growth
Design as processDesign is seen as an integral part of execution and being customer centric
Design as AestheticsLimited understanding, application only limited to Aesthetics
No Design Low/no understanding of Design, primarily seen as Designer’s responsibility
1
2
3
4
5
© 2019 KPMG, an Indian Registered Partnership and a member firm of the KPMG network of independent member firms affiliated with KPMG International Cooperative (“KPMG International”), a Swiss entity. All rights reserved© 2019 KPMG, an Indian Registered Partnership and a member firm of the KPMG network of independent member firms affiliated with KPMG International Cooperative (“KPMG International”), a Swiss entity. All rights reserved.
Des
ign
an
d in
nov
atio
n q
uo
tien
t re
po
rt In
dia
201
8
We believe values, behaviour, climate, process, resources and success are six key building blocks of a design-led culture. Values, behaviour and climate are foundational to bringing cultural transformation, process and resources building blocks enable delivery of exceptional customer experience and success building block defines the impact of design. Empathy for customers lies at the heart of design framework and helps answer what a customer centric culture looks like.
The design quotient maturity model comprises of six building blocks broken down into 20 factors (level 2) which are further broken down to 57 elements (level 3 is not included in
scope of this study). This report leverages 20 factors mapped to six building blocks to compute the design quotient. The design quotient represents the current state of maturity of design capability.
Right ‘values’ form the foundation for an organisation looking to drive design led culture. These values guide the ‘behaviour’ at an individual, team and organisational level. To allow practice of these values in an organisation, a conducive ‘climate’ is desired. Establishing a ‘process’ provides a map on how to practice design thinking and making ‘resources’ available help in execution of that process. In the end, how we measure ‘success’ guides the shift in the perception and thus the culture.
Assessing an organisation against the design quotient framework gives us the design quotient, a measure that places the organisations into one of the five levels of design maturity.

08 07
Learning where one lies on the level of design maturity will help organisations understand how far or close they are to their desired state and to their peers. The assessment will also provide insights into the current degree of strength of six building blocks of design and innovation. Basis these insights, necessary calibration and corrective action can be planned to strengthen these pillars and inch closer to a design driven future state.
Being design driven is not just about creating great products or services, it is a crucial business advantage that ensures success in the market. Organisations are embracing design to imbibe innovation as a culture, bring customer centricity and drive business growth. Design quotient assessment is the first step in taking the journey to become design driven.
In this report, overall design maturity of India Inc., key industries, organisation sizes and types have been reported under Executive summary section. In the subsequent sections, performance of each of the six building blocks have been analysed and presented by various demographic factors.
All the scores reported throughout the report are on a scale of 5.0.
How to read this report?
How can assessing the design quotient help organisations?
© 2019 KPMG, an Indian Registered Partnership and a member firm of the KPMG network of independent member firms affiliated with KPMG International Cooperative (“KPMG International”), a Swiss entity. All rights reserved© 2019 KPMG, an Indian Registered Partnership and a member firm of the KPMG network of independent member firms affiliated with KPMG International Cooperative (“KPMG International”), a Swiss entity. All rights reserved.
Des
ign
an
d in
nov
atio
n q
uo
tien
t re
po
rt In
dia
201
8

Organisations with smaller employee strength
have exhibited higher scores on all building blocks of design showcasing their embodiment of spirit of design approach but have revealed little/no access to resources such as talent, tools, technology to execute the design process.
Indian corporations and MNCs,
Key findings 10 09
Industrial manufacturing and Media and entertainment
Mid-level management personnel
Organisations from southern Indian states
Education and Financial services
Organisations having design or innovation department/CoE
industries have emerged as top performers across most building blocks of design. This can be attributed to historical emphasis on design by the former and a creative culture of the latter.
have emerged as the group reporting lower scores on all building blocks of design suggesting high burden of operational work, upward as well as downward delegation affecting their ability to contribute creatively and pursue design opportunities leaving them feeling less energised, engaged and enabled to succeed.
have outscored their peers from the north and west region on all the building blocks of design which could be attributed to presence of technology firms and start-ups in the region, possible cultural undertones of openness to experimentation and a conducive climate for innovative ideas to thrive.have emerged as bottom performers on all building
blocks presenting a significant opportunity for overhaul and disruption of industries marked by complex regulatory environments.
reported consistently high scores on all building blocks of design compared to organisations that did not have a design or innovation team. This reflects that focus on design or innovation enables organisations to establish right values, drive right behaviours, provide right climate and resources to succeed in becoming truly customer centric.
have surprisingly displayed higher design scores on most of the building blocks of design compared to foreign MNCs which is contrary to popular belief. This could perhaps be indicative of changing culture and values of the Indian organisational landscape in an attempt to reinvent themselves or indicative of sentiment among respondents that Indian companies rely heavily on frugal Innovation.
© 2019 KPMG, an Indian Registered Partnership and a member firm of the KPMG network of independent member firms affiliated with KPMG International Cooperative (“KPMG International”), a Swiss entity. All rights reserved© 2019 KPMG, an Indian Registered Partnership and a member firm of the KPMG network of independent member firms affiliated with KPMG International Cooperative (“KPMG International”), a Swiss entity. All rights reserved.
Des
ign
an
d in
nov
atio
n q
uo
tien
t re
po
rt In
dia
201
8

12 11
In its second appearance, design and design thinking has generated significant interest and traction among organisations in India. It is fascinating to see that a fairly large percentage of organisations report having or investing in a design and innovation department or a Centre of Excellence (CoE)
and also state design and innovation capabilities as critical for their customers.
India Inc. appears to have progressed fairly well along the design maturity scale where it is beginning to view ‘Design as process’ (Level 3 on Maturity scale), an approach to deliver
better solutions and experiences to customers. The foundational building blocks for a design-led culture i.e. values, behaviour and climate seem to be present, however a focus on investing in resources and tools for execution is needed.
Overview by industry type
Most industries are reportedly at varying degrees of adopting Design as an approach (level 3) on the maturity scale.
Industrial manufacturing takes the lead with its high overall design quotient score. This could be attributed to the practice of industrial design process and high people engagement. An opportunity lies in taking design beyond R&D and
focusing on the end to end customer experience and not just the product.
Media and entertainment comes close second, this can be attributed to the creative culture and environment. An opportunity exists to arm people with a structured methodology to design experiences that deliver emotional value.
The relatively lower score observed in financial
services (2.97) can be attributed to the complex regulatory and process-driven environment. The industry could benefit from enabling people with structured methodology to design enriching experiences for customers. Education (3.06) too, is in dire need of growth mindset and could benefit from a mindset nudge at senior level.
Executive Summary
Design quotient India 2018
Behavior
Resources
Values
3.56
3.46
3.38
3.513.27
3.1
Process
Success
Climate
Design quotient 3.41Top areas of strength:
Top areas to improve:
Factors
EntrepreneurialRespondents reported having Design or Innovation Department/Center of Excellence within their organisations
Respondents believe for their customers ‘Design and Innovation’ is critical part of partnering with their organisations
64%
60%Simplicity
Creativity
People
Learning
Systems
Energize
Projects
Explore
Enterprise
Score
3.58 / 5
3.16 / 5
3.52 / 5
3.05 / 5
3.57 / 5
3.09 / 5
3.67 / 5
3.16 / 5
3.74 / 5
3.21 / 5
Factors Score
on a scale of 5.0
Design quotient industry-wise (India) 2018
Source: KPMG in India’s Design Quotient Survey 2018
Design as Culture
Design as Strategy
Design as process
Design as Aesthetics
No Design
Industrial Manufacturing 3.77
Media and Entertainment 3.66
Technology 3.43
Consumer Markets 3.39
Services 3.34
Education 3.06
Financial Services 2.97 ResourcesValues
ClimateValues
ResourcesProcess
ResourcesValues
ResourcesProcess
ResourcesBehavior
Top areas of strength
Top areas to improve
ClimateSuccess
% Respondents believe their customers view Design and Innovation as critical
Industrial Manufacturing
Media and Entertainment
Technology
Consumer Markets
Services
Education
Financial Services
80%
60%
75%
58%
54%
44%
41%
© 2019 KPMG, an Indian Registered Partnership and a member firm of the KPMG network of independent member firms affiliated with KPMG International Cooperative (“KPMG International”), a Swiss entity. All rights reserved© 2019 KPMG, an Indian Registered Partnership and a member firm of the KPMG network of independent member firms affiliated with KPMG International Cooperative (“KPMG International”), a Swiss entity. All rights reserved.
Level of Maturity
Design as Culture
Design as Strategy
Design as process:
Design is seen as an integral part of execution and being customer centric. It is not just a means for achieving aesthetics but also to achieve functional and emotional relevance.
Design as Aesthetics
No Design 1
2
3
4
5
Des
ign
an
d in
nov
atio
n q
uo
tien
t re
po
rt In
dia
201
8

14 13
Overview by organisation type
All organisation types seem to be at a comparable level of design maturity on the scale.
With an above average people engagement and maturity, Indian corporations should look to speed up the pace of design
adoption and promote design to a more strategic role. Perhaps this relatively better score is reflective of their ambition to reinvent themselves to compete. While this may be contrary to popular belief, it should be explored further.
Foreign MNCs place relatively lower possibly reflecting the nature of work that is outsourced to Indian entities. There is an opportunity for them to enable their employees with a design approach and showcase to their global counterparts their ability to
design and deliver an end-to-end experience.
Also interesting to note that access to resources to enable implementation of design in organisations presents top area of opportunity across the board.
Overview by organisation size (employee strength)
Organisations comprising low employee strength recorded better a design quotient compared to higher strength organisations. Such scores can be
attributed to the nimble and agile nature of smaller organisations enabling them to adopt innovative approaches. Across the board, resources present
a significant area of opportunity to drive design within the firm.
Design quotient by organisation type (India) 2018
Design quotient organisation employee strength (India) 2018
Source: KPMG in India’s Design Quotient Survey 2018
Design as Culture
Design as Strategy
Design as process
Design as Aesthetics
No Design
Indian corporation 3.56
Indian multinational corporation
3.41
Small medium enterprise 3.38
Foreign multinational corporations
3.32 ResourcesProcess
Values Resources
ResourcesValues
Top areas of strength
Top areas to improve
ResourcesBehavior
% Respondents believe their customers view Design and Innovation as critical
Indian corporations
Indian MNCs
Foreign MNCs
Small medium enterprise
66%
62%
65%
57% Source: KPMG in India’s Design Quotient Survey 2018
Design as Culture
Design as Strategy
Design as process
Design as Aesthetics
No Design
Greater than 5000 3.34
500 to 50003.38
1 to 500 3.44 ResourcesValues
ResourcesValues
Top areas of strength
Top areas to improve
ResourcesValues
© 2019 KPMG, an Indian Registered Partnership and a member firm of the KPMG network of independent member firms affiliated with KPMG International Cooperative (“KPMG International”), a Swiss entity. All rights reserved© 2019 KPMG, an Indian Registered Partnership and a member firm of the KPMG network of independent member firms affiliated with KPMG International Cooperative (“KPMG International”), a Swiss entity. All rights reserved.
Des
ign
an
d in
nov
atio
n q
uo
tien
t re
po
rt In
dia
201
8

16 15
The study had a mix of participation from various industries, types of organisations, size, geographic regions and levels in organisations.
Respondent organisations by industry
Respondents by type of organisation
Respondents’ profile – Who took the survey? Over 160+ companies
participated in this year’s survey
Over 50 per cent of respondents belong to Foreign and India multinational
Technology, services and financial service
represented the top three sectors in the dataset
45 per cent of respondents based out of western Indian states while there is equal representation from
north and southern region
Fairly sizeable representation from different organisational levels i.e. execution, middle management and senior management
Indian Corporations
Not for Profit
Small and Medium
Enterprises (SME)
Government Establishments
Public Sector Enterprises
Indian Multinational Corporations
Start-upsForeign Multinational Corporations
35% 5% 22% 4% 14% 4% 12% 4%
Consumer Markets
7%
M&E
7%
Others
7%
Education
9%
Industrial Manufacturing, transport and
logistics
10%
Financial services
11%
Services
14%
Technology
21%
ENR
4%
Building & Construction
4%
Healthcare
4%
Telecom
3%
© 2019 KPMG, an Indian Registered Partnership and a member firm of the KPMG network of independent member firms affiliated with KPMG International Cooperative (“KPMG International”), a Swiss entity. All rights reserved© 2019 KPMG, an Indian Registered Partnership and a member firm of the KPMG network of independent member firms affiliated with KPMG International Cooperative (“KPMG International”), a Swiss entity. All rights reserved.
Des
ign
an
d in
nov
atio
n q
uo
tien
t re
po
rt In
dia
201
8

18 17
Respondent organisations by revenue in INR (M=million)
Respondent organisations by location
Respondents by level in their organisations
0 - 5M 5 - 50M 50 - 250M 250 - 500M 500M+
52%
12%10%10%15%
West
North
South
26%
45%
28%
Execution level Middle level management Senior leadership
20% 44% 37%
© 2019 KPMG, an Indian Registered Partnership and a member firm of the KPMG network of independent member firms affiliated with KPMG International Cooperative (“KPMG International”), a Swiss entity. All rights reserved© 2019 KPMG, an Indian Registered Partnership and a member firm of the KPMG network of independent member firms affiliated with KPMG International Cooperative (“KPMG International”), a Swiss entity. All rights reserved.
Des
ign
an
d in
nov
atio
n q
uo
tien
t re
po
rt In
dia
201
8

20 19
Building block 1: ValuesBusiness leaders today consider values fundamental to success of individuals, teams, organisations and society. A highly-developed value system is like a compass, it points us in the right direction and guides our behaviour and decisions. It is what defines us.
Keeping this in mind, we believe values should bear the highest importance in the design maturity model since every other aspect stems from a sound value system.
This building block is composed of three key factors i.e. entrepreneurial, creativity and learning.
Results by industry
We ranked the design score of values building block for different industries and found industrial manufacturing and media and entertainment industry score the highest while services and education score relatively lowest.
Design has been the backbone of industrial manufacturing firms since the beginning of industrial design in the 60’s.
It combined aesthetics, functionality (engineering and science) and emotional aspects of design. Hence, it comes as no surprise that the industry scores highest on all three core design values. Media and entertainment scores well on creativity and learning but, surprisingly, low on entrepreneurial value. This may be indicative of
challenges of regulatory ambiguity and market sensitivity around digital content, hampering firms from exploring new and bolder avenues. Services, on the other hand, scored low indicating highly rigid, process driven environment. Education too, seems to be grappling with the challenge of encouraging creative thinking, exploring disruptive learning avenues and in dire need of entrepreneurial mindset to help in the overhaul of this industry.
Organisations with lower employee strength scored higher overall and on all three core values compared to other organisations, suggesting that being entrepreneurial, creative and learning from failure is an integral part of their
growth strategy. This is in contrast to organisations with higher employee strength who scored low on all core design values suggesting process and structure taking precedence over being entrepreneurial.
Indian corporations score highest while foreign multinational corporations relatively lowest. This is quite an interesting and unanticipated result. This trend may be indicative of sentiment among respondents that Indian companies rely heavily on frugal innovation as a way to circumvent adherence to rigid processes and structure. There is also
a possibility that due the larger young workforce the Indian companies are now better equipped and more open to reinvent themselves and compete globally. Additionally, foreign MNC’s data points could be from back offices operations in India where the practice of three key values are likely to be absent. This trend needs to be explored further.
Results by employee size
Scores by employee size
Scores by organisation type
Results by organisation type
EntrepreneurialGreater than
5000 Creativity
Learning
3.48
3.45
3.373.43
Entrepreneurial
501 - 5000 Creativity
Learning
3.68
3.61
3.613.63
Entrepreneurial
1 - 500 Creativity
Learning
3.67
3.57
3.863.70
Source: KPMG in India’s Design Quotient Survey 2018
Source: KPMG in India’s Design Quotient Survey 2018
Valu
es S
core
3.933.86 3.80
4.00
3.483.65
3.493.41 3.47
3.473.533.45
Entrepreneurial Creativity Learning
Indian multinational corporationsForeign multinational corporations
Indian corporationsSmall and medium enterprises
© 2019 KPMG, an Indian Registered Partnership and a member firm of the KPMG network of independent member firms affiliated with KPMG International Cooperative (“KPMG International”), a Swiss entity. All rights reserved© 2019 KPMG, an Indian Registered Partnership and a member firm of the KPMG network of independent member firms affiliated with KPMG International Cooperative (“KPMG International”), a Swiss entity. All rights reserved.
Des
ign
an
d in
nov
atio
n q
uo
tien
t re
po
rt In
dia
201
8

22 21
Organisations from southern Indian states exhibit highest overall score compared to organisations in the north and west region. It is fascinating to
note that organisations from Southern region have indicated they practice all three key design values to a great or very great extent, especially learning through
experimentation and failure. This could potentially be reflective of the presence of technology organisations/start-ups and possible cultural undertones that
make the environment more open to creative ideas and opportunities.
Senior leadership exhibits the highest score overall and on all the three core values. This aligns well with the insight that nature of work at the leadership level is strategic and requires
practice of three key design values. However, execution level personnel perform better than mid-level on creativity and learning design values, suggesting a high burden of operational
work on the mid-level affecting their ability to contribute creatively and pursue new learning opportunities.
Results by personnel levelsResults by region
Respondents say these factors are present in their organisation ‘To a great or very great extent’
North
3.42 / 5
West
3.54/5
South
3.76/5
Entrepreneurial Creativity Learning Entrepreneurial Creativity Learning Entrepreneurial Creativity Learning
66%64% 61%66%
47%
52%
71%
50% 52%
Source: KPMG in India’s Design Quotient Survey 2018
Scores by personnel level
Source: KPMG in India’s Design Quotient Survey 2018
Entrepreneurial
Creativity
Learning
3.23
3.69
3.69
Entrepreneurial
Creativity
Learning
3.49
3.22
3.27
Entrepreneurial
Creativity
Learning
3.96
3.79
3.85
3.54Execution level
3.33Middle level management
3.87Senior leadership
© 2019 KPMG, an Indian Registered Partnership and a member firm of the KPMG network of independent member firms affiliated with KPMG International Cooperative (“KPMG International”), a Swiss entity. All rights reserved© 2019 KPMG, an Indian Registered Partnership and a member firm of the KPMG network of independent member firms affiliated with KPMG International Cooperative (“KPMG International”), a Swiss entity. All rights reserved.
Des
ign
an
d in
nov
atio
n q
uo
tien
t re
po
rt In
dia
201
8

24 23
Organisations having design or innovation department or center of excellence, expectedly, perform better on all three key design values compared to those
who don’t. This validates that the three identified values in our maturity model are seen as key to driving a design-led culture.
Experimentation
One of the most important measures of entrepreneurial, creative and learning culture is how encouraging the culture is to experiments. Trying new things and openness to failure sets the right tone for design values to thrive. Organisations should start with small, low risk experiments to gradually push their appetite.
Design your values
A design culture doesn’t demand that the culture be redefined from scratch, it is built on the strong foundation of an organisation’s own values. Understanding what values will drive design behaviour in your unique business context and bringing employees in to define those clear sets of priorities, is the first step.
Results by organisations with a Design and Innovation CoE/Department
Recommendations
Organisations with Design and Innovation Department
Yes No
3. 72 3.27
Design CoE Entrepreneurial Creativity Learning
Yes 3.79 3.64 3.73
No 3.20 3.31 3.29
Source: KPMG in India’s Design Quotient Survey 2018
© 2019 KPMG, an Indian Registered Partnership and a member firm of the KPMG network of independent member firms affiliated with KPMG International Cooperative (“KPMG International”), a Swiss entity. All rights reserved© 2019 KPMG, an Indian Registered Partnership and a member firm of the KPMG network of independent member firms affiliated with KPMG International Cooperative (“KPMG International”), a Swiss entity. All rights reserved.
Des
ign
an
d in
nov
atio
n q
uo
tien
t re
po
rt In
dia
201
8

26 25
Building block 2: BehaviourA well-defined value system drives behaviour from top to bottom in an organisation. The responsibility of exhibiting right behaviour starts with the leaders, at the apex, which sets the tone for others in the organisation. Leaders have a noble responsibility to energize people with a promising vision for the future, inspire change, engage to coach and enable people to achieve momentous milestones.
Employees emulate their leaders, which in turn plays a vital role in creating the culture in an organisation.
Behaviour, thus, is the second most significant building block in design maturity model. It comprises of three key factors i.e. energize, engage and enable which are behavioural traits/characteristics of a design-led organisation.
Results by industry
Industrial manufacturing and media and entertainment industry score the highest on ‘behaviour’ while the financial services and education sector score relatively lowest.
The scores for behaviour are in line with the trend noticed in the first building block, Values. This validates that an organisation with a strong value system exhibits the right behaviour.
Industrial manufacturing, scores highest on all design behaviours, suggesting sincere practice of design values while media and entertainment, though, has a high overall score on behaviour, exhibits relatively lower score on energize and engage. This suggests an outcome focused environment where leaders
may prefer to spend less time on energizing and coaching but are adept in using influence to enable employees navigate organisational obstacles to achieve success.
On the other hand, financial services and education score lowest among all industries. Interestingly, financial services demonstrate low scores on both engage and enable, which may be attributed to lack of time available for coaching and a heavily-regulated environment impacting how well leaders are able to enable employees achieve success in their design efforts. Low performance of education sector further strengthens the case for an overhaul and disruption.
Organisations with lower employee strength perform well overall, compared to others. However, it is interesting to note that, while smaller organisations are doing better to enable employees overcome organisational obstacles, mid-sized organisations are doing better to energize and engage. This could
be because, in smaller organisations absence of structure and rigid processes present fewer obstacles to achieving goals and its only when an organisation moves out of small to a mid-sized phase, a more conscious effort to take formal steps to coach employees tend to emerge.
Indian multinational corporations outscore foreign multinational corporations on the behaviour building block.
This is interestingly contrary to popular belief and presents an opportunity to explore further.
Results by employee size Results by organisation type
Scores by employee size
EnergiseGreater than
5000 Engage
Enable
3.60
3.28
3.403.43
Energise
501 - 5000 Engage
Enable
3.82
3.50
3.433.58
Energise
1 - 500 Engage
Enable
3.69
3.48
3.623.60
Source: KPMG in India’s Design Quotient Survey 2018
Scores by organisation type
Source: KPMG in India’s Design Quotient Survey 2018
Beh
avio
ur s
core
3.673.83
3.473.27
3.69
3.353.333.41 3.313.53
3.653.59
Energise Engage Enable
Indian multinational corporationsForeign multinational corporations
Indian corporationsSmall and medium enterprises
© 2019 KPMG, an Indian Registered Partnership and a member firm of the KPMG network of independent member firms affiliated with KPMG International Cooperative (“KPMG International”), a Swiss entity. All rights reserved© 2019 KPMG, an Indian Registered Partnership and a member firm of the KPMG network of independent member firms affiliated with KPMG International Cooperative (“KPMG International”), a Swiss entity. All rights reserved.
Des
ign
an
d in
nov
atio
n q
uo
tien
t re
po
rt In
dia
201
8

28 27
In line with the observations of the first building block, values, organisations in the southern region outscore other organisations on
behaviour. North region particularly reported low score on the practice of engage, indicating leaders need to devote time to
coach, provide support in both successes as well as failures.
Senior leaders expectedly perform well across all three design behaviours i.e. feels energized, engaged and enabled to succeed while mid-level management scores lowest. It is important to note that execution level displays stronger scores compared to mid-level management,
as also observed in first building block, values. This further strengthens the case that mid-level may be heavily occupied with operational tasks, downward and upward delegation feeling less energized, engaged and enabled to succeed.
Results by personnel levelResults by region
Respondents say these factors are present in their organisation ‘To a great or very great extent’
North
3.17/5
West
3.50/5
South
3.87/5
Energise Engage Enable Energise Engage Enable Energise Engage Enable
42%
66%66%
28%
51%
71%
42%
51%63%
Source: KPMG in India’s Design Quotient Survey 2018
Scores by personnel level
Source: KPMG in India’s Design Quotient Survey 2018
Energise
Engage
Enable
3.54
3.38
3.65
Energise
Engage
Enable
3.44
3.14
3.24
Energise
Engage
Enable
3.78
3.27
3.53
3.53Execution level
3.27Middle level management
3.78Senior leadership
© 2019 KPMG, an Indian Registered Partnership and a member firm of the KPMG network of independent member firms affiliated with KPMG International Cooperative (“KPMG International”), a Swiss entity. All rights reserved© 2019 KPMG, an Indian Registered Partnership and a member firm of the KPMG network of independent member firms affiliated with KPMG International Cooperative (“KPMG International”), a Swiss entity. All rights reserved.
Des
ign
an
d in
nov
atio
n q
uo
tien
t re
po
rt In
dia
201
8
30 29
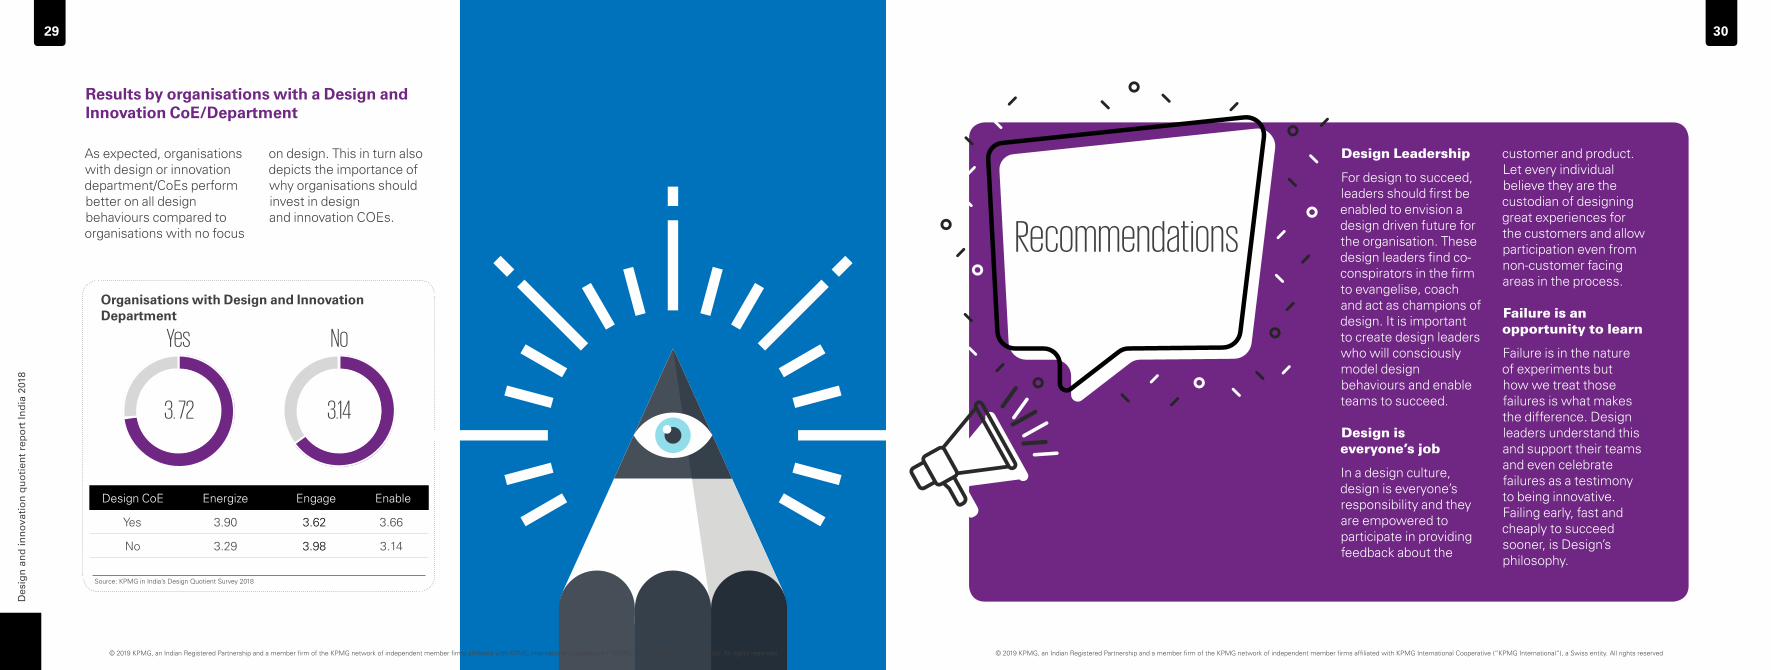
As expected, organisations with design or innovation department/CoEs perform better on all design behaviours compared to organisations with no focus
on design. This in turn also depicts the importance of why organisations should invest in design and innovation COEs.
Results by organisations with a Design and Innovation CoE/Department
Design Leadership
For design to succeed, leaders should first be enabled to envision a design driven future for the organisation. These design leaders find co-conspirators in the firm to evangelise, coach and act as champions of design. It is important to create design leaders who will consciously model design behaviours and enable teams to succeed.
Design is everyone’s job
In a design culture, design is everyone’s responsibility and they are empowered to participate in providing feedback about the
customer and product. Let every individual believe they are the custodian of designing great experiences for the customers and allow participation even from non-customer facing areas in the process.
Failure is an opportunity to learn
Failure is in the nature of experiments but how we treat those failures is what makes the difference. Design leaders understand this and support their teams and even celebrate failures as a testimony to being innovative. Failing early, fast and cheaply to succeed sooner, is Design’s philosophy.
Recommendations
Organisations with Design and Innovation Department
Yes No
3. 72 3.14
Design CoE Energize Engage Enable
Yes 3.90 3.62 3.66
No 3.29 3.98 3.14
Source: KPMG in India’s Design Quotient Survey 2018
© 2019 KPMG, an Indian Registered Partnership and a member firm of the KPMG network of independent member firms affiliated with KPMG International Cooperative (“KPMG International”), a Swiss entity. All rights reserved© 2019 KPMG, an Indian Registered Partnership and a member firm of the KPMG network of independent member firms affiliated with KPMG International Cooperative (“KPMG International”), a Swiss entity. All rights reserved.
Des
ign
an
d in
nov
atio
n q
uo
tien
t re
po
rt In
dia
201
8

32 31
Building block 3: ClimateAn organisation’s values when practiced becomes behaviour. However, for the behaviours to sustain and evolve, the organisation creates a climate that can nurture and guide employees’ experience in an organisation. Consciously creating the right climate requires embracing design values such as hunger to explore new opportunities, appetite for exploring ambiguity, autonomy, experimentation etc. along
with reinforcement of the right design behaviour.
A design-led organisation seeks a climate that promotes faster decision making, low bureaucracy, accountability, trust, openness and thrives on teamwork and community. The third building block, climate, is third most significant building block of KPMG’s design maturity model. It comprises of three key factors i.e. simplicity, security and collaboration.
Results by industry
Media and entertainment and consumer markets industry score the highest on ‘climate’ while financial services and education sector score relatively lowest.
Media and entertainment continues to be top performer on the third building block as well while consumer products is a new entrant in the top performing category.
While both industries show strong scores on overall climate and simplicity factor but both perform relatively poorly on collaboration.
On the other hand, financial services and education continue to be among the bottom performers. Perhaps, financial services being a heavily-regulated
industry, has complex internal structures and processes that make the internal environment bureaucratic and delays decision making while high work pressure impacts employee’s attitude towards new ideas and collaboration. The education sector, too, is governed by rigid policies and regulatory control making the environment complex. To add to that, possible overburden, makes it difficult for academicians to contribute new ideas and engage in team work.
Consistent with the earlier observations, organisations with a lower employee strength continue to perform better on all three key climatic factors. Quite naturally, as the organisation size grows, processes, policies and structure take precedence often making the internal
environment complex and more bureaucratic. Smaller organisations have wider job roles which perhaps makes it easier to collaborate compared to larger organisations where strictly-defined job roles and functional silos could hamper the ability to work well as a team.
True to their earlier performance on two building blocks, Indian corporations outscore foreign MNCs in overall climate score. This presents a departure from the conventional wisdom. Simplicity of climate could perhaps be due to the various creative or ad hoc ways in which
policies and processes are circumvented compared to foreign MNCs where processes are more rigid. SMEs score highest on security indicating a culture of openness while foreign MNCs score high on collaboration suggesting a conscious investment in tools to promote teamwork within the firm.
Results by employee size Results by organisation type
Scores by employee size
SimplicityGreater than
5000 Security
Collaboration
3.05
3.42
3.473.32
Simplicity
501 - 5000 Security
Collaboration
3.04
3.40
3.323.25
Simplicity
1 - 500 Security
Collaboration
3.38
3.68
3.633.56
Source: KPMG in India’s Design Quotient Survey 2018
Scores by organisation type
Source: KPMG in India’s Design Quotient Survey 2018
Clim
ate
scor
e 3.383.16
3.773.46
3.483.503.543.56 3.28
3.813.19
2.98
Simplicity Security Collaboration
Indian multinational corporationsForeign multinational corporations
Indian corporationsSmall and medium enterprises
© 2019 KPMG, an Indian Registered Partnership and a member firm of the KPMG network of independent member firms affiliated with KPMG International Cooperative (“KPMG International”), a Swiss entity. All rights reserved© 2019 KPMG, an Indian Registered Partnership and a member firm of the KPMG network of independent member firms affiliated with KPMG International Cooperative (“KPMG International”), a Swiss entity. All rights reserved.
Des
ign
an
d in
nov
atio
n q
uo
tien
t re
po
rt In
dia
201
8

34 33
In line with earlier performance, organisations from the southern region score high on climate compared to other regions. They particularly score high on collaboration, this can
be because of technology companies and startups investing in collaboration tools. Organisations from the North report challenges with the practice of collaboration while
organisations from the West report challenges with complex internal environment, this may be attributed to the fact that the western region has been considered as the
industrial hub since quite some time and the organisations are grappling with a challenge of legacy systems and processes which increases the complexity.
Personnel at the senior leadership level report high scores indicating that they perceive climate to be simplistic, secure and ripe for collaboration. However, personnel at the mid-level management report all
three factors of climate low compared to execution level. This ties with insights from earlier building blocks where the burden of operational tasks and lack of time may be affecting their experience.
Results by personnel levelResults by region
Respondents say these factors are present in their organisation ‘To a great or very great extent’
North
3.22/5
West
3.39/5
South
3.50/5
Simplicity Security Collaboration Simplicity Security Collaboration Simplicity Security Collaboration
44% 41%
52%50%
56%
39%39%
69%
57%
Source: KPMG in India’s Design Quotient Survey 2018
Scores by personnel level
Source: KPMG in India’s Design Quotient Survey 2018
Simplicity
Security
Collaboration
3.20
3.44
3.48
Simplicity
Security
Collaboration
2.88
3.33
3.25
Simplicity
Security
Collaboration
3.49
3.77
3.79
3.37Execution level
3.15Middle level management
3.68Senior leadership
© 2019 KPMG, an Indian Registered Partnership and a member firm of the KPMG network of independent member firms affiliated with KPMG International Cooperative (“KPMG International”), a Swiss entity. All rights reserved© 2019 KPMG, an Indian Registered Partnership and a member firm of the KPMG network of independent member firms affiliated with KPMG International Cooperative (“KPMG International”), a Swiss entity. All rights reserved.
Des
ign
an
d in
nov
atio
n q
uo
tien
t re
po
rt In
dia
201
8

36 35
Organisations having design or innovation department/CoE report higher scores on Climate and its factors
validating that the three key climactic factors identified are key for design-led organisations.
Results by organisations with a Design and Innovation CoE/Department
Collaboration
Design is ambitious, it aims to solve wicked problems and create great user experiences. To do that, it relies heavily on design teams that are diverse and multidisciplinary. Organisations should look at collaboration not just through team composition but also though the lens of tools and physical environment that enables collaboration.
Security
When employees are able to freely voice their opinions, share unconventional ideas
and challenge status quo, it creates a conducive climate to execute design projects.
Community
To evangelise design in the organisation, building a community of practitioners that speaks a common language about design and hav a shared understanding of how to practice design helps.
Recommendations
Organisations with Design and Innovation Department
Yes No
3. 46 3.25
Design CoE Simplicity Security Collaboration
Yes 3.17 3.63 3.58
No 3.14 3.27 3.34
Source: KPMG in India’s Design Quotient Survey 2018
© 2019 KPMG, an Indian Registered Partnership and a member firm of the KPMG network of independent member firms affiliated with KPMG International Cooperative (“KPMG International”), a Swiss entity. All rights reserved© 2019 KPMG, an Indian Registered Partnership and a member firm of the KPMG network of independent member firms affiliated with KPMG International Cooperative (“KPMG International”), a Swiss entity. All rights reserved.
Des
ign
an
d in
nov
atio
n q
uo
tien
t re
po
rt In
dia
201
8

38 37
Building block 4: ProcessOnce the foundation of an organisation with strong values, behaviour and climate is laid, a methodology or philosophy that guides day to day actions is needed. A well-defined set of processes remove ambiguity and gives a clear method for execution of goals and objectives.
A design-led organisation places foremost importance on its customers and their needs. Regardless of the methodology an organisation embraces, a design-led firm will ensure
four key characteristics are present i.e. empathy for customers, ideation to consider radical solutions, rapid prototyping to test before committing to an idea and storytelling that establishes a connection with the customers.
Fourth building block of design maturity model, process, aims to capture how organisations leverages design practices to engage better with the customer. Process is composed of four factors i.e. explore, ideate, create and evolve.
Results by industry
Industrial manufacturing and technology score the highest on design ‘process’ while financial services and education score relatively lowest.
Industrial manufacturing continues its streak to be a top performer on the fourth building block while technology is a new entrant in the top performing category.
Industrial manufacturing, however, displays mediocre performance on create and evolve of the design process suggesting the need to improve the practice of rapid prototyping and speed up go-to-market cycle. Technology organisations have been known for their ability to keep pace with changing customer needs, embrace radical ideas, live in beta state and stay agile.
Financial services and education continue to perform relatively poorly on practicing design process. Perhaps, the focus is on maintaining a large customer base by big banks as opposed to ‘stepping into customer shoes’ which nimble fintech companies rely on to disrupt, has some impact. Presence of legacy systems demanding a large portion of employee time on managing operational tasks in non-customer facing departments also poses an impediment in implementing the design process across large organisations.
Consistent with earlier observations, organisations with lower employee strength display relatively better performance on adoption and practice of design process. In general,
smaller organisations are nimble and agile as a result, test new ideas frequently, rapidly prototype, use short iteration cycles and take quick action.
Indian corporations and Indian multinational corporations outscore foreign MNCs in overall process score, consistent with earlier findings.
Results by employee size Results by organisation type
Scores by employee size
IdeateGreater than
5000 Create
Evolve
3.28
Explore 3.74
Explore 3.64
3.39
3.333.43
Ideate
501 - 5000 Create
Evolve
3.28
3.16
3.483.39
Explore 3.80
Ideate
1 - 500 Create
Evolve
3.35
3.35
3.653.54
Source: KPMG in India’s Design Quotient Survey 2018
Scores by organisation type
Source: KPMG in India’s Design Quotient Survey 2018
Proc
ess
scor
e
3.853.88 3.54
3.153.773.44 3.403.38
3.383.39 3.413.20 3.37
3.133.69
3.74
Explore Ideate Create Evolve
Indian multinational corporationsForeign multinational corporations
Indian corporationsSmall and medium enterprises
© 2019 KPMG, an Indian Registered Partnership and a member firm of the KPMG network of independent member firms affiliated with KPMG International Cooperative (“KPMG International”), a Swiss entity. All rights reserved© 2019 KPMG, an Indian Registered Partnership and a member firm of the KPMG network of independent member firms affiliated with KPMG International Cooperative (“KPMG International”), a Swiss entity. All rights reserved.
Des
ign
an
d in
nov
atio
n q
uo
tien
t re
po
rt In
dia
201
8

40 39
Organisations from the southern region continue to display high understanding and practice of design
process compared to other regions. This can be attributed to the high process orientation of the
technology companies and their concentration in the southern part of India.
Personnel at senior leadership demonstrate better understanding and adoption of design process, understandably so, as their objective is to drive
customer centeredness, a key attribute of the design process. Interestingly, mid-level personnel report challenges in generating a vast and diverse pool
of ideas, this may be attributed to the presence of operational work load at this level.
Results by personnel levelResults by region
Respondents say these factors are present in their organisation ‘To a great or very great extent’
North
3.38/5
West
3.39/5
South
3.68/5
Explore Ideate Create Create CreateEvolve Explore Ideate Evolve Explore Ideate Evolve
56%
41%
68%
48%
53%
38% 39%
78%
56%
47%
54%
63%
Source: KPMG in India’s Design Quotient Survey 2018
Scores by personnel level
Source: KPMG in India’s Design Quotient Survey 2018
Ideate
Explore
Create
Evolve
3.52
3.88
3.60
3.52
Ideate
Explore
Create
Evolve
2.98
3.52
3.10
3.25
Ideate
Explore
Create
Evolve
3.53
3.91
3.44
3.72
3.63Execution level
3.21Middle level management
3.65Senior leadership
© 2019 KPMG, an Indian Registered Partnership and a member firm of the KPMG network of independent member firms affiliated with KPMG International Cooperative (“KPMG International”), a Swiss entity. All rights reserved© 2019 KPMG, an Indian Registered Partnership and a member firm of the KPMG network of independent member firms affiliated with KPMG International Cooperative (“KPMG International”), a Swiss entity. All rights reserved.
Des
ign
an
d in
nov
atio
n q
uo
tien
t re
po
rt In
dia
201
8

42 41
Organisations having a design or innovation CoE/department report higher scores on practice of design process, as expected. It is interesting to note that organisations
without design/innovation CoEs appear to struggle specifically in the create phase i.e. ability to rapidly prototype, iterate based on customer feedback and knowing when to stop.
Results by organisations with a Design and Innovation CoE/Department
Empathy for Customer
Developing a deeper understanding of the hidden and unmet needs of the user requires observation, engagement with the user and immersion in the challenges. Empathy has become a critical 21st century skill for the workforce and is at the centre of a design-driven culture.
Rapid Prototype
Organisations are learning to live in beta, where they regularly use low fidelity prototypes to engage with users and
get feedback before committing resources to launch a solution. It is a faster way for teams to validate and test their ideas investing limited time, money and effort.
Co-creation
Design is a participatory process. Bringing in customers at the ideation and create stage helps secure buy-ins early.
Recommendations
Organisations with Design and Innovation Department
Yes No
3. 63 3.16
Design CoE Explore Ideate Create Evolve
Yes 3.91 3.45 3.62 3.53
No 3.43 3.05 2.82 3.36
Source: KPMG in India’s Design Quotient Survey 2018
© 2019 KPMG, an Indian Registered Partnership and a member firm of the KPMG network of independent member firms affiliated with KPMG International Cooperative (“KPMG International”), a Swiss entity. All rights reserved© 2019 KPMG, an Indian Registered Partnership and a member firm of the KPMG network of independent member firms affiliated with KPMG International Cooperative (“KPMG International”), a Swiss entity. All rights reserved.
Des
ign
an
d in
nov
atio
n q
uo
tien
t re
po
rt In
dia
201
8

44 43
Building block 5: ResourcesThe transformation of a business-as-usual culture to one driven by design involves, first, a shift in the approach. To enable this change, resources are made available to expose people to design thinking as a new approach. Access to design experts, internal talent and committed leaders help succeed in design efforts. Access to the right tools and systems makes it easier to practice the new approach.
Allocation of time, finances and space to pursue new opportunities helps people experiment.
The fifth building block of design maturity model, Resources, aims to capture how well organisations make resources available to enable the practice and adoption of design thinking. The resources building block is composed of three factors i.e. people, systems and projects.
Results by industry
Media and entertainment and industrial manufacturing score the highest on design
‘resources’ while financial services and education score relatively lowest.
Both industries at the top have consistently performed well on other building blocks of design and hence, it comes as no surprise, that both have invested in allocating and deploying resources to make the practice and adoption of design thinking easier within the organisation.
Lack of understanding and practice of design process across financial services and education, can be attributed to the absence of resources such as design experts, systems and dedicated projects that help evangelise design thinking.
While smaller organisations embody principles and spirit of design thinking well, as seen by their performance on all four building blocks of design, they appear to lack in providing the right resources to implement and practice this approach.
This could be attributed to constraints of time, money and technology that smaller organisations have to face in comparison to larger organisations who invest well in tools, technology and talent.
In line with the observations noted previously, Indian corporations report relatively higher scores on the resources building block compared to other organisation types. This interesting insight needs to be explored further.
However, some of this can also be attributed to the dependency of Indian centers on their global parent companies for resources.
Results by employee size Results by organisation type
Scores by employee size
PeopleGreater than
5000 Systems
Projects
3.11
3.20
3.203.17
People
501 - 5000 Systems
Projects
3.08
3.29
3.083.15
People
1 - 500 Systems
Projects
2.95
2.78
3.142.95
Source: KPMG in India’s Design Quotient Survey 2018
Scores by organisation type
Source: KPMG in India’s Design Quotient Survey 2018
Res
ourc
es s
core
3.503.04 3.08 3.422.96
3.133.183.21 3.202.73
3.203.05
People Systems Projects
Indian multinational corporationsForeign multinational corporations
Indian corporationsSmall and medium enterprises
© 2019 KPMG, an Indian Registered Partnership and a member firm of the KPMG network of independent member firms affiliated with KPMG International Cooperative (“KPMG International”), a Swiss entity. All rights reserved© 2019 KPMG, an Indian Registered Partnership and a member firm of the KPMG network of independent member firms affiliated with KPMG International Cooperative (“KPMG International”), a Swiss entity. All rights reserved.
Des
ign
an
d in
nov
atio
n q
uo
tien
t re
po
rt In
dia
201
8
46 45
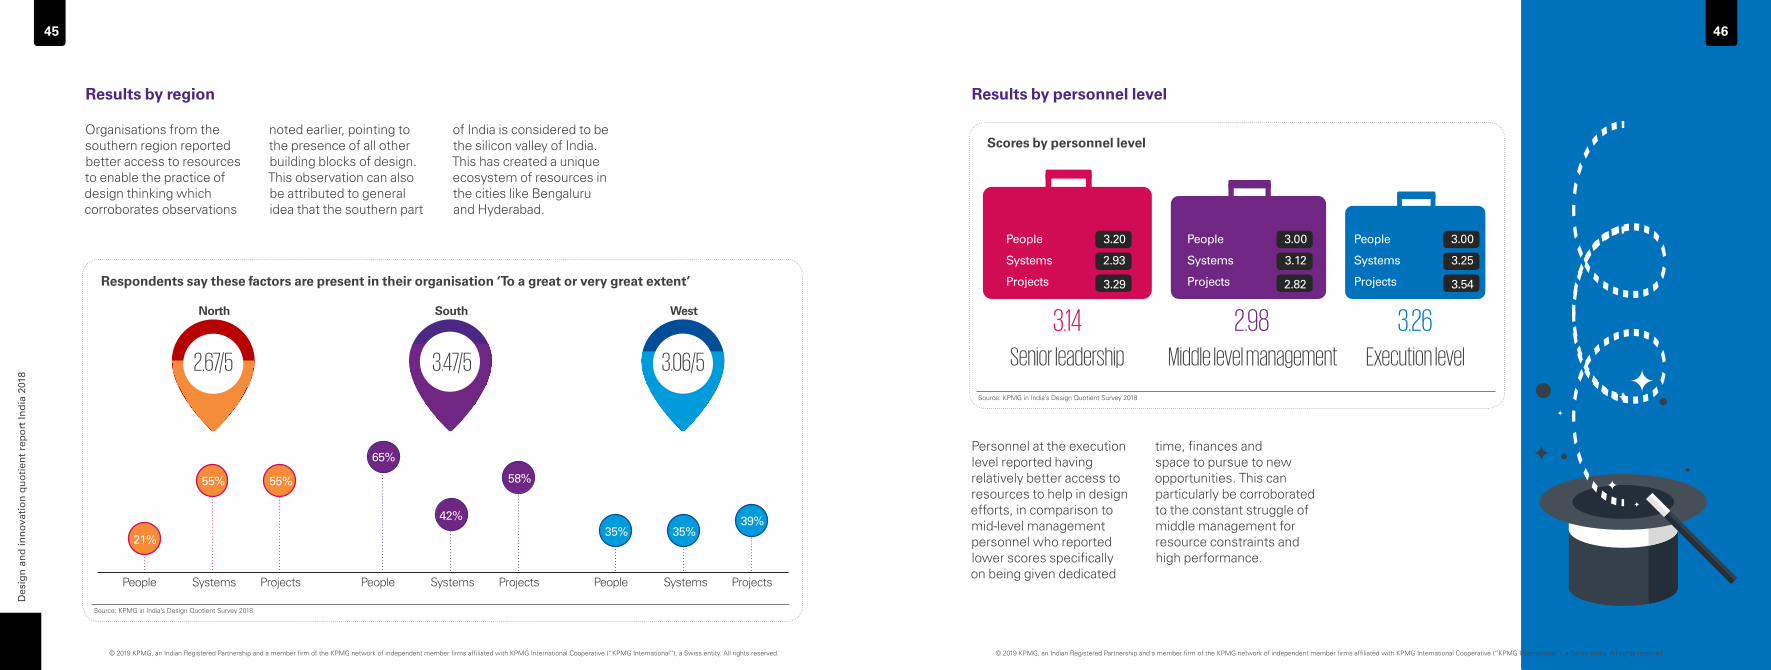
Organisations from the southern region reported better access to resources to enable the practice of design thinking which corroborates observations
noted earlier, pointing to the presence of all other building blocks of design. This observation can also be attributed to general idea that the southern part
of India is considered to be the silicon valley of India. This has created a unique ecosystem of resources in the cities like Bengaluru and Hyderabad.
Personnel at the execution level reported having relatively better access to resources to help in design efforts, in comparison to mid-level management personnel who reported lower scores specifically on being given dedicated
time, finances and space to pursue to new opportunities. This can particularly be corroborated to the constant struggle of middle management for resource constraints and high performance.
Results by personnel levelResults by region
Respondents say these factors are present in their organisation ‘To a great or very great extent’
North
2.67/5
West
3.06/5
South
3.47/5
People Systems Projects People Systems Projects People Systems Projects
21%35%
58%55%
35%
65%
55%
39%42%
Source: KPMG in India’s Design Quotient Survey 2018
Scores by personnel level
Source: KPMG in India’s Design Quotient Survey 2018
People
Systems
Projects
3.00
3.25
3.54
People
Systems
Projects
3.00
3.12
2.82
People
Systems
Projects
3.20
2.93
3.29
3.26Execution level
2.98Middle level management
3.14Senior leadership
© 2019 KPMG, an Indian Registered Partnership and a member firm of the KPMG network of independent member firms affiliated with KPMG International Cooperative (“KPMG International”), a Swiss entity. All rights reserved© 2019 KPMG, an Indian Registered Partnership and a member firm of the KPMG network of independent member firms affiliated with KPMG International Cooperative (“KPMG International”), a Swiss entity. All rights reserved.
Des
ign
an
d in
nov
atio
n q
uo
tien
t re
po
rt In
dia
201
8

48 47
Organisations having a design or innovation CoE/department have better access to resources to
help deploy design thinking compared to organisations that do not have a design or innovation department.
Results by organisations with a Design and Innovation CoE/Department
Invest in people
If the ultimate goal is to drive customer centricity, it should start with employee centricity. The values that employees are expected to demonstrate to customers are the same values they must see imbibed throughout the organisation. Middle layers across organisations present a huge opportunity to be empowered by providing learning avenues and entrepreneurial opportunities.
Invest in Tools
With the right tools, teams are empowered and equipped to execute design to the best of their ability. But first, people must be oriented on the power of design and trained to become practitioners.
Recommendations
Organisations with Design and Innovation Department
Yes No
3.35 2.67
Design CoE People Systems Projects
Yes 3.41 3.30 3.34
No 2.44 2.72 2.84
Source: KPMG in India’s Design Quotient Survey 2018
© 2019 KPMG, an Indian Registered Partnership and a member firm of the KPMG network of independent member firms affiliated with KPMG International Cooperative (“KPMG International”), a Swiss entity. All rights reserved© 2019 KPMG, an Indian Registered Partnership and a member firm of the KPMG network of independent member firms affiliated with KPMG International Cooperative (“KPMG International”), a Swiss entity. All rights reserved.
Des
ign
an
d in
nov
atio
n q
uo
tien
t re
po
rt In
dia
201
8

50 49
Building block 6: SuccessAn organisation on a path to transformation led by design, must measure the outcomes and value created during this journey. Design thinking changes hard outcomes to begin with, that are easily measured in terms of business key performance indicators (KPIs). Going deeper, it changes how we see things and our interactions with customers. And at its deepest level, it
changes people’s mindsets. Measuring the outcomes along this transformation journey is key evidence to adopt design as a philosophy of how an organisation conducts itself.
Sixth, and final, building block of design maturity model, success, measures the changes design has brought in the organisation at the enterprise, individual and external level.
Results by industry
Industrial manufacturing and media and entertainment maintain their spot among the top performers while financial services and education stay among the bottom performers.
Aligned with the observations noted across all five building blocks, Top performing industries exhibit high performance on all five building blocks which translates in to achieving success in terms of enterprise growth, individual competency growth and external growth.
Education and financial services, present significant improvement opportunity to strengthen the measurement system across all three factors
of the success building block and thus become more customer centric to compete in the market.
While the overall design score for success is comparable across different organisations, it is interesting to note that smaller organisations report better success at the individual level reflecting growth in employee’s
competencies and larger organisations report better success at enterprise level suggesting their investment in a disciplined approach to design, resources and leverage it to drive long term strategy.
Indian corporations report higher scores, especially on enterprise success, corroborating observations made on other building
blocks, which could be reflective of organisations efforts to reinvent themselves to enhance enterprise level capabilities.
Results by employee size Results by organisation type
Scores by employee size
EnterpriseGreater than
5000 Individual
External
3.31
3.16
3.313.26
Enterprise
501 - 5000 Individual
External
3.17
3.33
3.333.28
Enterprise
1 - 500 Individual
External
3.08
3.43
3.303.27
Scores by organisation type
Source: KPMG in India’s Design Quotient Survey 2018
Succ
ess
scor
e
3.833.21
3.583.25
3.423.27 3.273.25 3.09
3.403.273.16
Enterprise Individual External
Indian multinational corporationsForeign multinational corporations
Indian corporationsSmall and medium enterprises
© 2019 KPMG, an Indian Registered Partnership and a member firm of the KPMG network of independent member firms affiliated with KPMG International Cooperative (“KPMG International”), a Swiss entity. All rights reserved© 2019 KPMG, an Indian Registered Partnership and a member firm of the KPMG network of independent member firms affiliated with KPMG International Cooperative (“KPMG International”), a Swiss entity. All rights reserved.
Des
ign
an
d in
nov
atio
n q
uo
tien
t re
po
rt In
dia
201
8

52 51
Southern organisations have reported great performance on all six building blocks of design and this embrace of design as an approach
and culture has translated into development of new capabilities at enterprise and individual level helping them succeed externally.
Mid-level personnel, expectedly report experiencing low/no growth especially at individual level competencies presenting
a significant opportunity to help this layer through design intervention. Interestingly, senior leadership also indicate
opportunity to build competency at individual level.
Results by personnel levelResults by region
Respondents say these factors are present in their organisation ‘To a great or very great extent’
North
2.99/5
West
3.17/5
South
3.69/5
Enterprise Individual External Enterprise Individual External Enterprise Individual External
28% 35%
61%
41% 43%
61%
38% 39%
58%
Source: KPMG in India’s Design Quotient Survey 2018
Scores by personnel level
Source: KPMG in India’s Design Quotient Survey 2018
Enterprise
Individual
External
3.13
3.38
3.29
Enterprise
Individual
External
3.00
2.90
3.08
Enterprise
Individual
External
3.54
2.66
3.61
3.26Execution level
2.99Middle level management
3.6Senior leadership
© 2019 KPMG, an Indian Registered Partnership and a member firm of the KPMG network of independent member firms affiliated with KPMG International Cooperative (“KPMG International”), a Swiss entity. All rights reserved© 2019 KPMG, an Indian Registered Partnership and a member firm of the KPMG network of independent member firms affiliated with KPMG International Cooperative (“KPMG International”), a Swiss entity. All rights reserved.
Des
ign
an
d in
nov
atio
n q
uo
tien
t re
po
rt In
dia
201
8

54 53
Organisations with design department/CoE report experiencing success in terms of growth in capability
at enterprise, growth in competencies at individual level and growth in market indicators at external level.
Results by organisations with a Design and Innovation CoE/Department
Right Metrics
Design ensures that we align business goals with human-centered goals so the business KPIs are not just tied to growth. Measuring outcomes such as experimentation, prototyping, new ideas, and insights helps us reframe how we measure success.
Recommendations
Organisations with Design and Innovation Department
Yes No
3. 5 2.87
Design CoE Enterprise Individual External
Yes 3.47 3.48 3.56
No 2.77 2.95 2.88
Source: KPMG in India’s Design Quotient Survey 2018
© 2019 KPMG, an Indian Registered Partnership and a member firm of the KPMG network of independent member firms affiliated with KPMG International Cooperative (“KPMG International”), a Swiss entity. All rights reserved© 2019 KPMG, an Indian Registered Partnership and a member firm of the KPMG network of independent member firms affiliated with KPMG International Cooperative (“KPMG International”), a Swiss entity. All rights reserved.
Des
ign
an
d in
nov
atio
n q
uo
tien
t re
po
rt In
dia
201
8
© 2018 KPMG, an Indian Registered Partnership and a member firm of the KPMG network of independent member firms affiliated with KPMG International Cooperative (“KPMG International”), a Swiss entity. All rights reserved© 2018 KPMG, an Indian Registered Partnership and a member firm of the KPMG network of independent member firms affiliated with KPMG International Cooperative (“KPMG International”), a Swiss entity. All rights reserved.
56 55
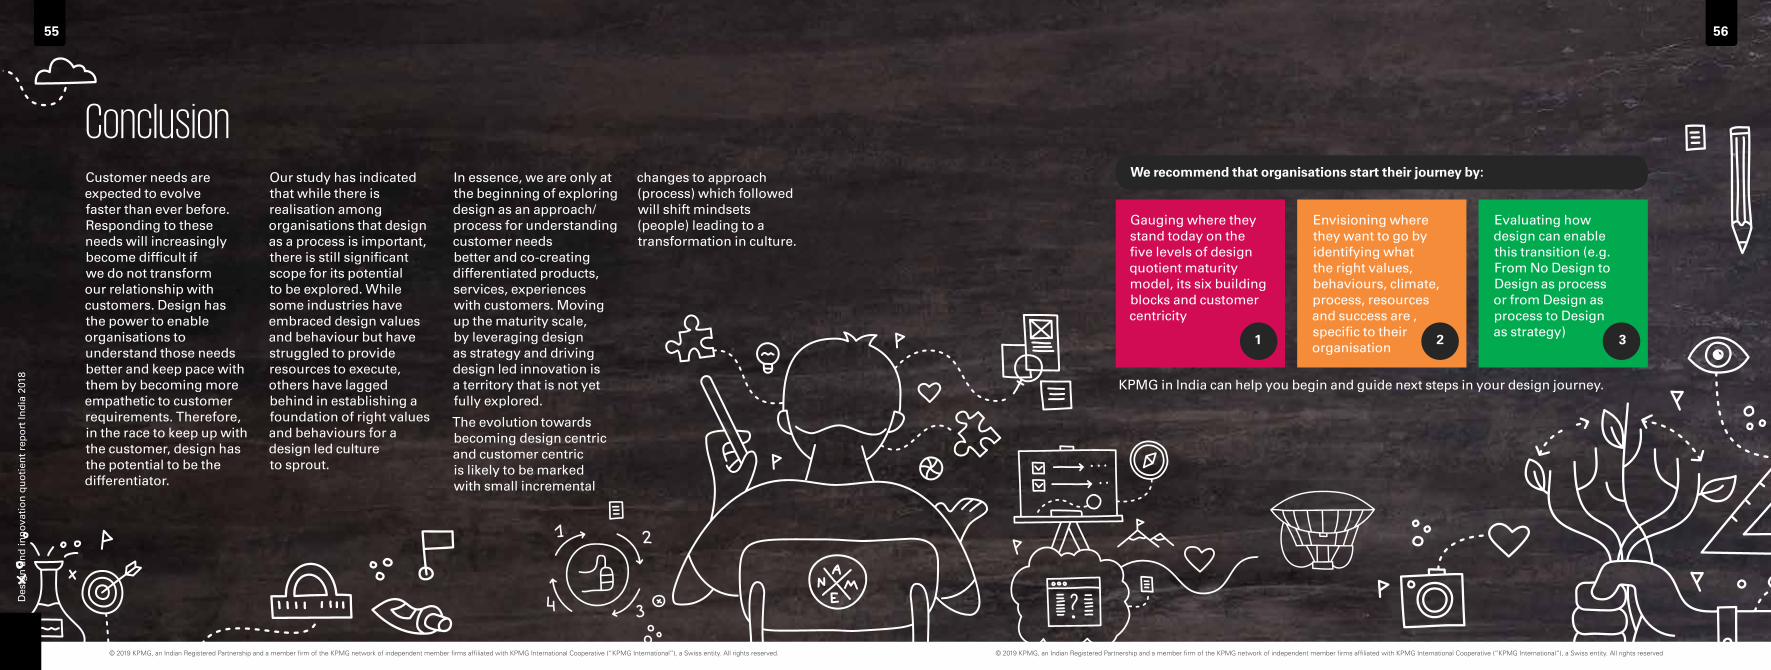
ConclusionCustomer needs are expected to evolve faster than ever before. Responding to these needs will increasingly become difficult if we do not transform our relationship with customers. Design has the power to enable organisations to understand those needs better and keep pace with them by becoming more empathetic to customer requirements. Therefore, in the race to keep up with the customer, design has the potential to be the differentiator.
Our study has indicated that while there is realisation among organisations that design as a process is important, there is still significant scope for its potential to be explored. While some industries have embraced design values and behaviour but have struggled to provide resources to execute, others have lagged behind in establishing a foundation of right values and behaviours for a design led culture to sprout.
In essence, we are only at the beginning of exploring design as an approach/process for understanding customer needs better and co-creating differentiated products, services, experiences with customers. Moving up the maturity scale, by leveraging design as strategy and driving design led innovation is a territory that is not yet fully explored.
The evolution towards becoming design centric and customer centric is likely to be marked with small incremental
changes to approach (process) which followed will shift mindsets (people) leading to a transformation in culture.
We recommend that organisations start their journey by:
KPMG in India can help you begin and guide next steps in your design journey.
Envisioning where they want to go by identifying what the right values, behaviours, climate, process, resources and success are , specific to their organisation
Gauging where they stand today on the five levels of design quotient maturity model, its six building blocks and customer centricity
Evaluating how design can enable this transition (e.g. From No Design to Design as process or from Design as process to Design as strategy)
1 2 3
© 2019 KPMG, an Indian Registered Partnership and a member firm of the KPMG network of independent member firms affiliated with KPMG International Cooperative (“KPMG International”), a Swiss entity. All rights reserved© 2019 KPMG, an Indian Registered Partnership and a member firm of the KPMG network of independent member firms affiliated with KPMG International Cooperative (“KPMG International”), a Swiss entity. All rights reserved.
Des
ign
an
d in
nov
atio
n q
uo
tien
t re
po
rt In
dia
201
8

58 57
AppendixMethodology
The survey consisted of 19 questions framed around 20 factors of six building blocks of design quotient maturity model. Participants rated each of the 20 questions (factors) on a five point Likert.
Design scores by Industry
Design scores at factor level was aggregated and then weighted at building block level to arrive at overall design quotient.
Rating Scale
Not at all To a small extent
To a moderate extent
To a great extent
To a very great extent
1 2 3 4 5
Industry Value Behaviour Climate Process Resources Success
Technology 3.52 3.40 3.49 3.64 3.16 3.36
Services 3.43 3.38 3.46 3.51 3.08 3.16
Education 3.31 3.22 2.78 3.13 2.94 3.00
Financial Services 3.46 3.31 3.03 2.93 2.55 2.52
Industrial Manufacturing 4.00 4.27 3.52 3.69 3.41 3.74
Media and Entertainment 3.67 3.63 3.63 3.63 3.67 3.74
Consumer Markets 3.63 3.56 3.58 3.22 2.95 3.37
© 2019 KPMG, an Indian Registered Partnership and a member firm of the KPMG network of independent member firms affiliated with KPMG International Cooperative (“KPMG International”), a Swiss entity. All rights reserved© 2019 KPMG, an Indian Registered Partnership and a member firm of the KPMG network of independent member firms affiliated with KPMG International Cooperative (“KPMG International”), a Swiss entity. All rights reserved.
Des
ign
an
d in
nov
atio
n q
uo
tien
t re
po
rt In
dia
201
8

Acknowledgement
60 59
© 2019 KPMG, an Indian Registered Partnership and a member firm of the KPMG network of independent member firms affiliated with KPMG International Cooperative (“KPMG International”), a Swiss entity. All rights reserved© 2019 KPMG, an Indian Registered Partnership and a member firm of the KPMG network of independent member firms affiliated with KPMG International Cooperative (“KPMG International”), a Swiss entity. All rights reserved.
For content, Digital Consulting, Design Thinking team
Ramesh Krishnamurthy
Ajay Aggarwal
Supriya Rana
For Compliance and Design team
Nisha Fernandes
Shveta Pednekar
Des
ign
an
d in
nov
atio
n q
uo
tien
t re
po
rt In
dia
201
8

Nilaya VarmaPartner and Leader Markets EnablementT: +91 124 669 1000E: [email protected]
Prasanth ShanthakumaranPartner Digital ConsultingT: +91 80 3065 4407E: [email protected]
Ramesh KrishnamurthyDirector Digital ConsultingT: +91 80 3065 4625E: [email protected]
Follow us on: kpmg.com/in/socialmedia
KPMG in India contacts:
The information contained herein is of a general nature and is not intended to address the circumstances of any particular individual or entity. Although we endeavour to provide accurate and timely information, there can be no guarantee that such information is accurate as of the date it is received or that it will continue to be accurate in the future. No one should act on such information without appropriate professional advice after a thorough examination of the particular situation.
© 2019 KPMG, an Indian Registered Partnership and a member firm of the KPMG network of independent member firms affiliated with KPMG International Cooperative (“KPMG International”), a Swiss entity. All rights reserved.
The KPMG name and logo are registered trademarks or trademarks of KPMG International.
This document is meant for e-communication only. (062_THL0219_SP)