design and implementation of an algorithmic trading system
TRANSCRIPT

Design and implementation of an algorithmic trading system for the Sifox application
Mário André Ferreira Pinto Dissertação de Mestrado apresentada à Faculdade de Ciências da Universidade do Porto em Ciência de Computadores
2014
D
esign and implem
entation of an algorithm trading
system for the Sifox application
Mário A
ndré Ferreira Pinto
MS
c
FCUP 2014
2.º CICLO

Design and implementation of an algorithmic trading system for the Sifox application
Mário André Ferreira Pinto Mestrado Integrado de Engenharia de Redes e Sistemas Informáticos Departamento de Ciência de Computadores 2014 Orientador Daniel Lima Eusébio, BSc., Finantech Coorientador Inês de Castro Dutra, Prof. Doutor, FCUP

Acknowledgments
I would like tho thank my supervisor Daniel Eusébio and his team at Finantech. The knowledge andexperience they shared will accompany me through my professional life, and was an important partof my entry on the financial world. I also would like to thank the support of my supervisor at theDepartment of Computer Science, Prof. Inês Dutra, for the reassurance, the kind words and thehelpful advice in developing this document.
I am grateful to BPI Investment Banking Manager Pedro Costa for his availability and time onproviding a insight on the most common trading algorithms and trader priorities.
A special thanks to my parents for all the support and patience. Thank you for providing all themeans that allowed me to follow my own path.
I would like to thank my friends from the Faculty of Science of Oporto University, for the importantsupport provided. The gaming nights, the jokes and laughs, helped me to keep going forward. Amongthem, I would like to emphasize my thanks to Mafalda, Daniel, Cristiano, Ramalho, Pedro, Luís,Carlos and Miguel.
Finally, a special thanks to my lunch buddies, José, Nuno and Carla. Their companionship and advicewas very important.
i

Abstract
The financial markets thrive on information, as its existence makes them increasingly more efficient.As new information technology was developed, the exchanges quickly adopted them, eager to takeadvantage of the opportunities provided. The new technology allowed for faster communication,greater accessibility to the markets and the new infrastructure helped decreasing the cost of doingbusiness. Today, a trader with a large number of accounts to manage, has his time stretched thin, asthe information available for analysis is abundant, if not overwhelming. The new properties of theelectronic exchange, mainly on the order book, allows the use of algorithms that can be useful forautomating some trading processes. This automation can improve the trader time management andefficiency.
In this thesis we provide algorithmic functionality to the Sifox trading application. We analyzed therequirements and issues of three market-impact algorithms (TWAP, VWAP and POV) and designeda prototype which we integrated in the Sifox application. During the development, for the VWAPalgorithm, we tested several models for volume prediction, obtaining best results for a exponentiallyweighted mean average of eleven days for the Google stock. We further develop our prototypeincluding these findings.
ii

Resumo
Os mercados financeiros prosperam com a existência de informação, ficando mais eficientes. À medidaque novas tecnologias de informação foram desenvolvidas, a Bolsa apressou-se a adoptá-las, tendoem conta as novas oportunidades fornecidas. Esta nova tecnologia permitiu uma maior velocidade decomunicação, facilidade de acesso aos mercados e, com a nova infraestrutura, ajudou a reduzir ocusto de fazer negócio. Hoje em dia, um trader, com um grande número de clientes, tem dificuldadeem gerir o tempo disponível, pois a informação necessária para análise é abundante ou até mesmoavassaladora. As novas propriedades do mercado digital, nomeadamente as relativas ao livro deordens, permitem o uso de algoritmos que são uteis para automatizar certas tarefas no processo denegociação. Esta automatização pode melhorar a capacidade de gestão e a eficiência de um trader.
Nesta tese fornecemos à plataforma de negociação Sifox, a capacidade de utilizar algoritmos.Analisámos os requisitos e as dificuldades de três algoritmos (TWAP, VWAP e POV), cuja função é aredução do impacto no mercado , e projectámos um protótipo que integrámos na aplicação Sifox.Durante o desenvolvimento, testámos para o algoritmo VWAP vários modelos de previsão de volume.Os melhores resultados obtidos foram com uma média exponencial pesada de onze dias para as acçõesda Google. Desenvolvemos o prototipo acrescentando estes resultados.exacarbate
iii

Contents
Abstract ii
Resumo iii
List of Tables vi
List of Figures viii
1 Introduction 1
2 Investment Banking 4
2.1 Equities . . . . . . . . . . . . . . . . . . . . . . . . . . . . . . . . . . . . . . . . . 4
2.2 Financial markets . . . . . . . . . . . . . . . . . . . . . . . . . . . . . . . . . . . . 5
2.3 Limit Order Book and Order Types . . . . . . . . . . . . . . . . . . . . . . . . . . . 7
3 Algorithmic Trading 10
3.1 Definition . . . . . . . . . . . . . . . . . . . . . . . . . . . . . . . . . . . . . . . . 10
3.2 Architecture . . . . . . . . . . . . . . . . . . . . . . . . . . . . . . . . . . . . . . . 10
3.3 Trading Algorithms . . . . . . . . . . . . . . . . . . . . . . . . . . . . . . . . . . . 12
3.4 TWAP . . . . . . . . . . . . . . . . . . . . . . . . . . . . . . . . . . . . . . . . . . 14
3.5 VWAP . . . . . . . . . . . . . . . . . . . . . . . . . . . . . . . . . . . . . . . . . . 15
3.6 Participation Rate . . . . . . . . . . . . . . . . . . . . . . . . . . . . . . . . . . . 17
iv

CONTENTS v
3.7 Order placement strategy and Execution Probability . . . . . . . . . . . . . . . . . . 19
3.8 Evaluation . . . . . . . . . . . . . . . . . . . . . . . . . . . . . . . . . . . . . . . . 23
4 Prototype Development 25
4.1 Architecture Overview . . . . . . . . . . . . . . . . . . . . . . . . . . . . . . . . . . 26
4.2 Algorithms . . . . . . . . . . . . . . . . . . . . . . . . . . . . . . . . . . . . . . . . 28
4.2.1 TWAP . . . . . . . . . . . . . . . . . . . . . . . . . . . . . . . . . . . . . . 29
4.2.2 Participation Rate . . . . . . . . . . . . . . . . . . . . . . . . . . . . . . . . 31
4.2.3 VWAP . . . . . . . . . . . . . . . . . . . . . . . . . . . . . . . . . . . . . . 32
4.3 Volume Profile Model Construction . . . . . . . . . . . . . . . . . . . . . . . . . . . 32
4.3.1 Data-set . . . . . . . . . . . . . . . . . . . . . . . . . . . . . . . . . . . . . 33
4.3.2 Tick Size . . . . . . . . . . . . . . . . . . . . . . . . . . . . . . . . . . . . . 34
4.3.3 Evaluation Method . . . . . . . . . . . . . . . . . . . . . . . . . . . . . . . 35
4.3.4 Models . . . . . . . . . . . . . . . . . . . . . . . . . . . . . . . . . . . . . . 35
4.3.5 Results . . . . . . . . . . . . . . . . . . . . . . . . . . . . . . . . . . . . . . 38
4.3.6 Integration . . . . . . . . . . . . . . . . . . . . . . . . . . . . . . . . . . . . 38
5 Conclusion 42
5.1 Critical Discussion . . . . . . . . . . . . . . . . . . . . . . . . . . . . . . . . . . . . 42
5.2 Future Work . . . . . . . . . . . . . . . . . . . . . . . . . . . . . . . . . . . . . . . 43
Bibliography 46
A Appendix 47
A.1 Acronyms . . . . . . . . . . . . . . . . . . . . . . . . . . . . . . . . . . . . . . . . 47
A.2 Alpha calculation for EWMA . . . . . . . . . . . . . . . . . . . . . . . . . . . . . . 48
A.3 Priority Queue Implementation . . . . . . . . . . . . . . . . . . . . . . . . . . . . . 48
A.4 Predicting the future using Time Series analysis . . . . . . . . . . . . . . . . . . . . 50

List of Tables
4.1 Sample of volume profile construction from the data obtained via Google API. a) Dataas received by the google API. b) Volume agregattion by Date, each tick has a size of15 minutes, except the first and last ones. First and last tick correspond to close andopen bid. c) Conversion to volume percentage. . . . . . . . . . . . . . . . . . . . . 34
4.2 Chi-Squared evaluation results applied to the three mean methods for volume profilecalculation. The best result is presented in bold and bellongs to EWMA with 11 days. 38
A.1 Alpha value calculation. Results of the alpha value calculation process applied to 22and 11 trading day data. The best values are shown in boldl. a) alpha range between0 and 1. b) Calculations for α ±∆ with alpha being the best obtained value and∆ = 0.1 . c) Calculations for α±∆ with ∆ = 0.01. . . . . . . . . . . . . . . . . . . 49
vi

List of Figures
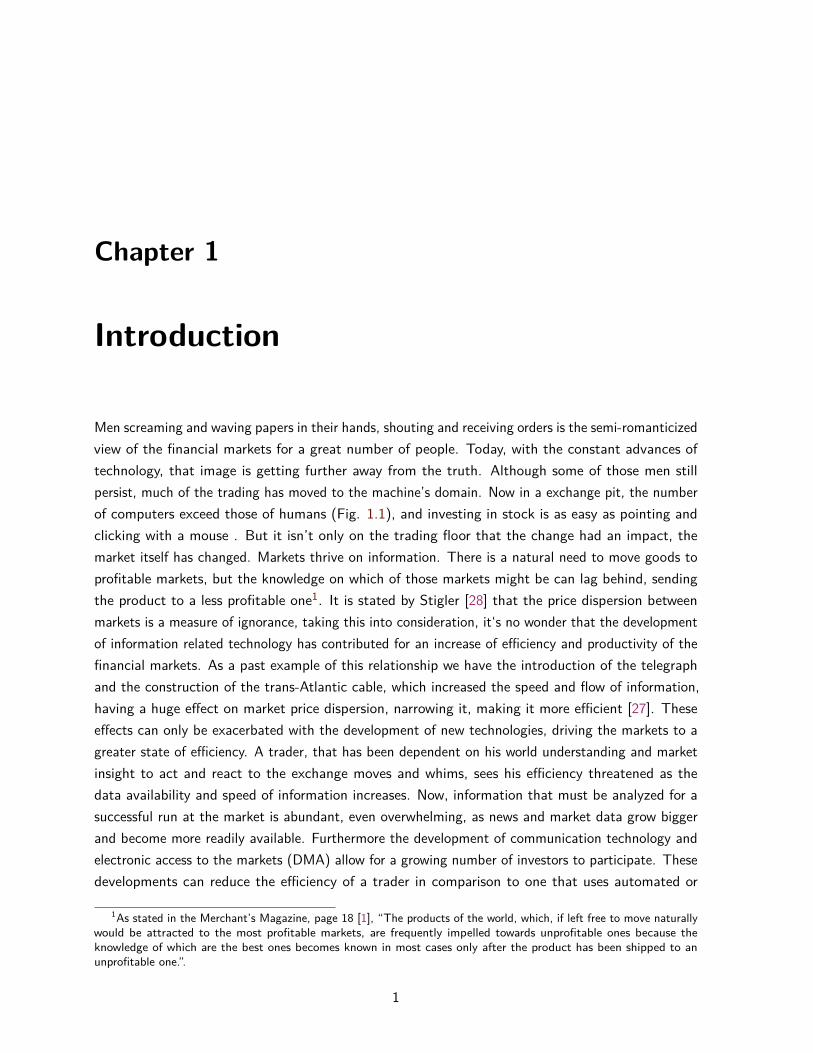
1.1 Photography of the New York Stock Exchange in 1959 (left) and 2005 (right). . . . 2
2.1 Structure of the financial markets as defined by [4]. The three main markets arethe Money Market (short-term money loans) the Foreign Exchange Market (tradingof foreign coin) and the Capital Market (long-term and mid-term trade of financialinstruments). . . . . . . . . . . . . . . . . . . . . . . . . . . . . . . . . . . . . . . . 6
3.1 Algorithmic trading system components and their relations. The algorithms describedhere belong to the Trade Execution component. . . . . . . . . . . . . . . . . . . . . 11
4.1 Algorithm Module placement alternatives on the Finantech solution. The dotted blueline represents the path taken when the module is in the server side. The green fullline represents the module placement on the Client side directly on the SifoxDealapplication. . . . . . . . . . . . . . . . . . . . . . . . . . . . . . . . . . . . . . . . 26
4.2 UML diagram of the Algorithm Module implementation in the SifoxDeal application,focusing on the AlgorithmManager and Algorithm classes. . . . . . . . . . . . . . . 27
4.3 Screenshot displaying the Algorithm Log system. . . . . . . . . . . . . . . . . . . . 29
4.4 The GUI of the TWAP algorithm for order placement. . . . . . . . . . . . . . . . . . 29
4.5 The GUI of the POV algorithm for order placement. . . . . . . . . . . . . . . . . . . 31
4.6 The GUI of the VWAP algorithm for order placement. . . . . . . . . . . . . . . . . . 32
vii

LIST OF FIGURES viii
4.7 Intraday percentage of volume variation and the associated cumulative error from fiveconsecutive days (19 to 25 February, GOOG stock). a) Intraday percentage of volumevariation between five consecutive days in different time scales. The first and last tickare respectively the open and close. b) Cumulative error per tick size. The first andlast tick are respectively the open and close. The error is calculated as the absolutedifference between the points of all five consecutive days. . . . . . . . . . . . . . . . 36
4.8 Description of the volume profile implementation. 1 - At the end of the trading period,intraday data is compiled and retrieved; 2 - The information is fed into the model andthe volume profile is created and stored in the database; 3 - When an order is set forexecution, the profile is retrieved; 4- Calculations are made to fit the profile in thecurrent order time-span; . . . . . . . . . . . . . . . . . . . . . . . . . . . . . . . . . 39
4.9 Entity-Relationship model for the volume profile database and related components. 40
Chapter 1
Introduction
Men screaming and waving papers in their hands, shouting and receiving orders is the semi-romanticizedview of the financial markets for a great number of people. Today, with the constant advances oftechnology, that image is getting further away from the truth. Although some of those men stillpersist, much of the trading has moved to the machine’s domain. Now in a exchange pit, the numberof computers exceed those of humans (Fig. 1.1), and investing in stock is as easy as pointing andclicking with a mouse . But it isn’t only on the trading floor that the change had an impact, themarket itself has changed. Markets thrive on information. There is a natural need to move goods toprofitable markets, but the knowledge on which of those markets might be can lag behind, sendingthe product to a less profitable one1. It is stated by Stigler [28] that the price dispersion betweenmarkets is a measure of ignorance, taking this into consideration, it‘s no wonder that the developmentof information related technology has contributed for an increase of efficiency and productivity of thefinancial markets. As a past example of this relationship we have the introduction of the telegraphand the construction of the trans-Atlantic cable, which increased the speed and flow of information,having a huge effect on market price dispersion, narrowing it, making it more efficient [27]. Theseeffects can only be exacerbated with the development of new technologies, driving the markets to agreater state of efficiency. A trader, that has been dependent on his world understanding and marketinsight to act and react to the exchange moves and whims, sees his efficiency threatened as thedata availability and speed of information increases. Now, information that must be analyzed for asuccessful run at the market is abundant, even overwhelming, as news and market data grow biggerand become more readily available. Furthermore the development of communication technology andelectronic access to the markets (DMA) allow for a growing number of investors to participate. Thesedevelopments can reduce the efficiency of a trader in comparison to one that uses automated or
1As stated in the Merchant’s Magazine, page 18 [1], “The products of the world, which, if left free to move naturallywould be attracted to the most profitable markets, are frequently impelled towards unprofitable ones because theknowledge of which are the best ones becomes known in most cases only after the product has been shipped to anunprofitable one.”.
1

CHAPTER 1. INTRODUCTION 2
Figure 1.1: Photography of the New York Stock Exchange in 1959 (left) and 2005 (right).
semi-automated methods. The ability to create automation in some stages of the trading processgreatly improves the reaction time of a trader, by processing and incorporating the information asit arrives and managing a growing number of accounts. This can increase the trader efficiency andprofit margin. In the new electronic market, algorithmic trading is an essential tool for the trader andis widely used. In 2014 first quarter, algorithmic trading was responsible for 17 to 25% of the totalmarket volume per month [25].
Finantech is a software development company producing solutions for the Portuguese financialmarkets [8]. Its products aim to fulfill the needs of financial institutions in all their market operations.Their main solution, the Sifox platform offers an integrated and wide array of services, ranging fromthe front and back-office to compliance and risk management services, facilitating the communication,management and execution of market operations. As at the time of this writing, the algorithmcomponent they offer is restricted only to the interface, being the execution outsourced to onlinebrokers. The lack of that particular service has an impact on the company. The use of third partyservices entails the loss of some control regarding the development process, as any alteration to theirinterface must be followed and implemented as quickly as possible. But more important than thatloss of control is the issue of marketability. One thing is to market the application as having supportto algorithmic trading via a third party interface (which is important), other is declaring the productimplements algorithmic trading, bringing all the client needs to one place, the Sifox application. It‘sof strategic importance to Finantech the addition of algorithmic trading to its product portfolio. Thisaddition will add value to its solution and help to further compete on the market.
Our objective in this internship consists in obtaining understanding of how the market operatesand to develop a functioning prototype of an algorithmic trading platform into the Sifox solution,taking into account its already created infrastructure. We study the basics of financial market and,

CHAPTER 1. INTRODUCTION 3
through the analysis of our client needs and most wanted features we implement the most commonlyused trading algorithms, allowing some space for customization.
In order to work with a system closely related to the financial market it is very important tounderstand its inner workings and vocabulary. This knowledge is not only essential for making informeddecisions about the algorithms, but also to ease the communication of information in the companyenvironment. In the second chapter we will briefly explain the inner workings of the financial market,getting into detail on information regarding order placement and order book management. In theproceeding chapter we will define algorithmic trading, describing its general architecture, the algorithmtheories and evaluation methods. In section 4 we describe the technologies used to implement andintegrate the algorithms in the system as well as details regarding the implementation of each differentalgorithm. We finally present some results for benchmark use for the presented algorithms, concludingwith a critical consideration about this report and a description of future work.

Chapter 2
Investment Banking
2.1 Equities
A company that finds itself in need for capital, for whatever reason, has at its service a number ofways to fulfill that need. The money can be raised by going into debt, borrowing it from an entity(usually a bank) or by issuing bonds (debt issued by the company). The contraction of debt is notwithout cost. In debt financing with the money borrowed comes associated an interest rate that mustbe paid, raising the total amount of capital due in the short term and conditioning the refinancingof the institution. An alternative to entering in debt is to get funded by selling a part of the fixedassets of the company by issuing stocks, this is referred to as equity financing[3]. An equity (ormore commonly known as stock or share) represents ownership and, the number of stocks one has,represents the percentage owned of the enterprise. The bigger the number of socks, more investmentand consequently, more stake on the company. The equity term not only comprises the commonstock, it can be also used to refer to the possibility of future acquisition of stock, like, for example,the case of options, warrants and stock convertible bonds.
A stockholder that invests his capital in the fixed assets by buying shares is given a limitedpartnership on the company. The limited participation is important, because it entails limited liability.In a limited liability partnership the shareholder is only responsible for the amount of money heinvested. If there is the need for a liquidation because, for example a bankruptcy, the investor does nothave to turn in personal property in order to cover the debts. The only capital lost is the investmentmoney, that can be fully or partially regained if, after all the creditors have been paid, some assetsremain. To own part of a company also grants some rights. Although the stockholder doesn’t havedirect control over the company’s policies or strategies he can exert control via his voting right at thegeneral meetings. This influence is limited to the election of board members and is restricted by thenumber of stock possessed. A minority shareholder has voting rights, but his participation is very
4

CHAPTER 2. INVESTMENT BANKING 5
small compared to a major one. A shareholder is considered major if he owns more than 50% of thestocks, has more than one representative in the board of directors, or is he himself the director of thecompany. Other important consequence of owning part of a company through investment are thereturns obtained. An investor will usually invest in a company he believes will bring him benefits, bygenerating future profits. There would be no point in investment and stocks if there were no possiblereturns on the investment made. A company is expected to provide returns for the investments madeand the most direct representation of those returns is the dividends. The dividends are part of theprofit attributed to the shareholders in proportion to the capital invested in the institution and itsregulation is subject of company policy. A company is not obliged to pay dividends for various reasons,either because they need money for liquidity issues or growth strategies, nevertheless some kind ofcompensation is expected to be delivered to the investors, as well as an increase in dividends enoughto cover the inflation over time. Because of these requirements, the dividends can also be seen as thecost of getting funded in a public offering. Comparatively with debt financing the potential cost in thelong-term is greater, because of the increase in dividends amount over time, but this is easily offsetby the various advantages provided, like the permanence of the capital, the low-risk of not beingexposed to refinancing and the flexibility of deciding when and how to pay dividends. Companies mayopt to give compensations to their shareholders in the form of their stock, by influencing its behaviorand price. This can be an alternative to distribute dividends. The correct application of the profitmoney outside of dividends and management decisions can affect stock price and its market behavior,granting shareholders the option of obtaining returns on their investment by selling their shares toothers, in the secondary market.
2.2 Financial markets
The financial market is the place where the trading of securities and commodities occur. It comprisesa set of different markets, (as described in figure 2.1) each specialized in some instrument and withdifferent defined rules. Generally, when we refer to the exchange or market, we are talking about thesection of the capital market that handles equities, where the trading of stocks occur. This market isadditionally divided in two sections: (1) the primary and, (2) secondary markets [4] . The primarymarket is where the issuing company goes to sell itself and get the investment cash, the investorstrade money for shares and a promise of future returns1. After a stock is issued in the primary marketis usually also available in the secondary market, the place where we will operate. In the secondarymarket shareholders trade with others having no interaction with the issuing company. This marketis of extreme importance for the issuing company as the shares represented here reflect the healthof the enterprise and its desirability to investors. A liquid secondary market with good conditionswill allow investors to cash in their investment instantly and hopefully obtain returns, this adds to
1if it’s the first initial equity issuing the process is called an IPO, that is, and initial public offering.

CHAPTER 2. INVESTMENT BANKING 6
Figure 2.1: Structure of the financial markets as defined by [4]. The three main markets are theMoney Market (short-term money loans) the Foreign Exchange Market (trading of foreign coin) andthe Capital Market (long-term and mid-term trade of financial instruments).
the value of the investment, as the possibility to obtain great returns with ease will attract morepartners. When we imagine the stock market, we are essentially envisioning the secondary market.These markets, present all around the world, are operated, managed and owned by private financialentities whose technology and services provide access and interaction with the exchanges. The mostimportant financial services providers are the ICE group2, owner of the NYSE EURONEXT3, and theNASDAQ OMX group4. These companies manage the most important markets and provide access tointermediaries whose objective is to facilitate the meeting of buyers and sellers, the brokers.
The advancement of technology has changed the way trades take place in the market and howinformation is obtained. New technologies were quickly adopted and currently the most importantexchanges operate almost entirely electronically, allowing us to access the market and place orders viaonline platforms[6]. The trades used to be processed by personnel on the trading floor, using thepublic outcry method, have moved to data centers, and most of the trades are now electronicallymatched5. It is important to understand the trading process and how the orders are matched in orderto have insight on which strategies will work and their consequences.
2https://www.theice.com3https://nyse.nyx.com4http://www.nasdaqomx.com/5NYSE EURONEXT offers a Hybrid system for equities allowing public outcry, while NASDAQ is electronic only.

CHAPTER 2. INVESTMENT BANKING 7
2.3 Limit Order Book and Order Types
Usually, in secondary markets, trades are based on an auctioning system and at its heart there isa limit order book, used to keep record of unfulfilled trades [12]. When the orders first arrive inthe exchange, they are processed in a first-arrived-first-served (FIFO) fashion. Trades whose priceimmediately matches one existent on the book are processed, and the transaction information isdisseminated through the exchange, while those with no matching price stay on the book. Theunexecuted orders that constitute the limit order book will be either buy orders or sell orders. A buyorder, or commonly referred to as a bid, consist of a price and a quantity one is willing to pay forshares of a certain company. A sell request, or ask order, is similar to a buy order, but represents thedesire to offload stock. These orders exist in the book ordered by a specific set of rules, that willdictate the priority of transaction for these orders. At the moment of the arrival, the orders will besorted by arrival price (price priority). On the top of the book there will be the orders with the bestprice. The best price is relative to the order type (buy or sell) and means the most competitive. Amost competitive bid (buy request) is one with the highest price, a best ask is one with the lowestsell price. After price priority they will be ordered by arrival time. Having not been matched the twodifferent request orders are separated by a gap, the difference between the best Ask and Bid, calledthe spread. In order for a transaction to happen, the spread must be beaten (the gap crossed) by theside who wants to make the trade. The orders contained in the book are not static and can be subjectto constant and quick change. The owner of a order is able to cancel or edit it, but doing so willincur on priority penalty, as in practice the change is nothing more as the canceling and submittingof a new order. Although market orders are essentially restricted to those two sides (ask and bid), the market execution conditions and validity parameters can be tweaked granting them differentfunctionalities. The use of different order types depends heavily on the broker being used and theirsupport on the exchange6. In order to have a good execution and achieve the desired result, it isessential for anyone that operates on the markets to have knowledge of the methods that will allowthem to execute the chosen strategy.
The execution conditions available on most markets are the following:
• Limit Orders - An order with an imposed price limit. The order will stay visible on the limitorder book until it is executed at the price limit or better. This type of order guarantees theprice but does not guarantee execution, because the market can move away from the targetedprice and never return.
• Market Orders - An order without price limit targeted at the best Bid/Ask price of the moment.This type of order suffers from the possibility of slippage, that is, the price targeted might notbe the price sold. If our order is slower than another, we will possibly miss the Bid/Ask price
6A difference can be seen between orders supported by the same group (ICE) in different equities markets, likeEuronext [5] and NYSE [18].

CHAPTER 2. INVESTMENT BANKING 8
and get the order matched on the next available price. This slip of the target price can makeone incur in great losses. As such, a Market Order does not guarantee the price and in highliquidity markets always guarantees fulfillment.
• Stop Orders - A Buy/Sell Market Order, triggered by a security reaching a certain price. Whenthe selected trading equity reaches a prearranged price hit, a market order is sent. Usually thistype of order is used by traders as a best practice, to stop losses by selling when a price dropstoo low7. In the first phase execution is not guaranteed, but when price triggers, it behaves likea Market Order with all its properties.
There is also the possibility for the creation of execution conditions that are variations of the above,or even the same, but because of their objective, they can get different denominations (like theStop-Loss Orders). One that is quite used is the Limited Market Order (plus or minus one) thisorder is nothing more than a Limit Order with the price set to the current best bid/ask, having thepossibility of being one tick above or bellow.
Other property of the order relative to the market is the validity. As the name suggests, validity isthe span of time the order is considered as valid and is available for execution. The order validitywhich the Sifox application supports are the following8:
• Day Validity (DAY) - Order remains in the book until the end of the trading day.
• Fill and Kill / Immediate Or Cancel validity (FAK / IOC) - An order is sent, gets fulfilled asmuch as it can, then it is canceled.
• Fill or Kill (FOK) - The order is sent to the market to be fulfilled, if it cannot be fulfilled in itsentirety, the order is canceled.
• Good Till Canceled (GTC) - Order stays in the book until fulfillment or a cancel order is issued(in EURONEXT up to a period of one year is supported).
The validity is combined with the order type, a side (buy/sell), a price (or no price, in case of amarket order), a quantity and is sent to a specific market for matching and execution.
The execution and validity properties and how the book is organized, influence our order fulfillmentand its execution costs, it will decide if our order will be executed, walk the book or simply stay visible
7It is interesting to notice that while using a stop order to prevent losses (stop-loss) is considered to be a best tradingpractice (simply by obeying the rule of trading with limits), it can be responsible for major capital loss. A sudden fastmarket variation or a minor crash, can activate the price limit, and because the orders are placed autocratically and ofthe Market Orders type, the potential for slippage will be huge. Furthermore the Stop-Loss can exacerbate the impactof those fall even further, by causing a chain reaction and lower the price even more[24].
8Some of these validity types are defined by EURONEXT at https://europeanequities.nyx.com/pt-pt/trading/order-validity using other denominations, for consistency with the system we will be using the Sifox Deal applicationnomenclature but will indicate the Euronext name.

CHAPTER 2. INVESTMENT BANKING 9
to all. The limit order book and its functioning is of pivotal importance to several strategies, its innerworking is incorporated in most of the order placement strategies.

Chapter 3
Algorithmic Trading
3.1 Definition
The term is difficult to define, due to its confusion or interchangeable use with several other relatedterms. Generally, and the definition we adopt, algorithmic trading is the use of a computer programto create automation in one, or several, steps of the trading process. The definition given is verybroad and usually the algorithms can be sub-categorized, depending on the technology used, objectiveor where in the traders pipeline the automation occurs. On the general definition of algorithmictrading we include the following sub-categories:
• Systematic Trading (ST) - Systems that use trading strategies based on a set of pre-definedrules received as Human input.
• High-frequency Trading (HTF) - The term is usually used in systems characterized with fastexecution speed (in the order of milliseconds) and holding stock for a short time-span. Usuallyan HFT algorithm proceeds without the intervention of a Human.
It is important to note that the use of the Direct Market Access (DMA) or other online platforms,supplied by a lot of brokers, is not considered Algorithmic Trading. DMA is only a platform forelectronic trading, allowing a more direct access to the markets, every decision and trade operationstill has to be made by the trader.
3.2 Architecture
An algorithmic trading system can have several well defined components, each in charge of a specificaspect of the trading process [22]. The components are the data, pre-trade analysis, trading signal
10

CHAPTER 3. ALGORITHMIC TRADING 11
Figure 3.1: Algorithmic trading system components and their relations. The algorithms describedhere belong to the Trade Execution component.
generation, trade execution and post-trade analysis (Figure 3.1).
The Data component interacts with all the other components and is the basis of the system. Itsfunction is to gather and clean information retrieved from market or non-market sources. This is animportant component, not only because it is used by every section of the system, but also becauseof the relationship between the performance of the system and the quality of the data. Due to theimportance and dependency of the system on this component, all data obtained must be cleanedin order to treat wrong, incomplete and meaningless data that, if left untouched, can create noisecapable of impairing the strategy used. In our algorithms the most common data source will be themarket data, current and historical. However, there are systems that can use other non-related marketdata in order to produce market evaluations, like news, tweets and data obtained by mining socialmedia sites.1
In pre-trade analysis, financial and derivative data (like news, or social media) are used in order topredict trends. These predictions will inform us what type of portfolio to build in order to trade andon which side of the trade we should be (buy or sell). Some of the techniques used to get a marketprediction include fundamental analysis, technical analysis and quantitative analysis. Our system doesnot use pre-trade analysis due to its function being mainly execution support. The decision of whatstock to trade and which algorithm to use comes from the trader and has no input from the systemwe are building.
1Usually the type of data obtained via social media can be used as a trend indicator [23]. The use of this informationraises growing concerns, as hacked accounts can disseminate false news with serious market repercutions. The blameusualy falls on the HFT that with its full automation and speed, lacking human constant supervision, judges bad dataand acts accordingly [16].

CHAPTER 3. ALGORITHMIC TRADING 12
The trading signal generation component will place a value and a quantity on our chosen portfolio.This component usually uses information obtained in the pre-trade and apply other technical analysistechniques using relevant market data in order to obtain the expected goal, be it maximizing profits,minimizing trade costs or even developing an entry and exit strategy, as well as risk management.This component can be easily confused with the pre-trade analysis and the trade execution. Its maindifference from the pre-trade analysis is that the decisions made can evolve to possible trades, itgives more concrete information that can be part of a strategy, and not just a recommendation onthe selection of the portfolio. It diverges from trade execution by not actually executing or givingexecution details for the trade, like a schedule.
The Trade execution layer will make decisions regarding the actual placement of orders in themarket, that is, its execution strategy. Having received a quantity and a time frame, the componentmust read market conditions and create orders that fulfill a stated objective. Even if that requiresdividing the orders, will never go against the previous component decisions. Trading venues, schedules,order types and order quantities are several options this component must decide.
Finally, in post-trade analysis, new information, obtained from the algorithm interaction withthe market, is incorporated as new data in the application. This feedback will allow for strategiescorrections and application control.
Giving the proposed architecture, and per our definition of a trading algorithm, the system musthave at least two components, being the Data one of them. The algorithms we implement belongto the trade execution component, their main objective is to guarantee an efficient placement ofthe order. Our Data component is obtained through the Sifox application and data retrieved fromspecialized finance sites, like Google and Yahoo finance, in order to obtain historical values. We donot offer decision support tools, all the other components are the responsibility of the trader. It ishe/she that will decide on what stock to trade, the venue, the signal, the quantity and the possibleprice limits to be used in the trading day.
3.3 Trading Algorithms
Currently all the major companies in investment banking offer algorithmic services packages to theirclients. These packages usually consist of trade execution algorithms, that aim to facilitate trading andminimize trading costs for the client. The selection of the correct algorithm to fit a certain objectiveand market conditions is of extreme importance for a trader. The algorithms can be categorizedaccording to their function[13] in the following manner:
• Impact-Driven - Minimize the impact of the trade on the market. Orders with big quantitiescan have a negative impact on the market, as its required quantity can be larger than the

CHAPTER 3. ALGORITHMIC TRADING 13
number of orders offered at a certain price level, causing the order to “walk on book” and befulfilled at increasingly worst market prices. In order to obtain a better trade for big blocks,this must be taken into account, and dispersion of quantity along the trading day should occur.
• Cost-Driven - The objective of cost driven algorithms is to reduce the general cost of trading.They must take into consideration all factors that can influence the cost. Similar to theimpact-driven algorithms, they must take into consideration market impact, but not to thepoint of avoiding it in its totality. If an impact to the market must be made to achieve a costeffective trade, they will proceed to act on it.
• Opportunistic - These algorithms want to obtain liquidity and trade in the best possible way,finding opportunities and taking them, disregarding market impact and trading cost to achievetheir goal.
The characterization of the algorithms by their functions seems closely related to the mechanics theyuse to achieve their objectives. The following categories, proposed by Yang et al. [30], further dividethe algorithms, helping to the understanding of their purpose based on their internal mechanics:
• Schedule-Driven - These algorithms follow a well known schedule, having no or very littlevariation. The use of a schedule allows for a predictable division of order quantity to befulfilled in small intervals (from one hour to 5 minutes). In general, thanks to their schedule,these algorithms are the most passive and therefore are used to reduce market impact of largeorders. Although they are regarded as passive algorithms, the sub-orders themselves can varyin aggressiveness. Depending on the trader objective and the risk one is willing to take, theactual placement of the orders can be different. For example, using market orders for aggressivestrategies and limit orders when willing to take the risk. This mechanic is one that relates tothe objective of impact-driven algorithms.
• Evaluative - A middle ground between schedule-driven and opportunistic. The Evaluativealgorithms combine the two approaches. They try to obtain the best possible trade whilereducing as much as possible the impact they have on the market. They can use historical dataand quantitative analysis to figure out a schedule and incorporate real-time data in order toobtain the best cost. Balancing these two factors they try to achieve the best cost, the sameobjective as a cost-driven algorithm.
• Opportunistic - Dynamic aggressive algorithms that constantly react to market change trying toobtain the upper hand. These are usually the liquidity seeking algorithms, they take advantageof the market evolutions at real time. It has the same name as the previous categorization.
In a meeting we attended with Pedro Costa, BPI Investment Banking Manager, it came to ourunderstanding that only a small set of algorithms is procured by their clients. The most commonly
CHAPTER 3. ALGORITHMIC TRADING 14
used algorithms are the impact-driven ones. We believe that this preference happens not only becausethey are specifically requested by clients who do not have sufficient knowledge to use more casespecific algorithms, but also because they allow a trader to better manage orders with big quantities.This allows the traders to focus on orders that they deem more important, automating those lesscritical that otherwise would require constant monitoring. The most common used algorithms, andthe one we will be focusing are:
• Participation Rate / POV (Participation Over Volume)
• TWAP (Time-Weighted Average Price)
• VWAP (Volume-Weighted Average Price)
In order to obtain information of how the algorithms perform, and what parameters they take, we readseveral documents of algorithm implementation of the competition, available online. This informationis, as expected, very superficial. The publications must disclose the strategy for the interest of theclients but at the same time, their inner workings have to be kept secret because of the competition.Still, these documents provided much needed insight in the principle of the algorithms, pointing outfeatures that they should have and serving as a guideline to the trader concerns and what he/she wasexpecting.
We will now describe the algorithms one by one. Unless otherwise noted, all examples will bemade as if we were selling securities. Usually buying and selling are symmetric when taking intoaccount the algorithm strategy, they are not symmetric however in terms of order placement. Inorder placement the conditions of the market vary according to the side (buy or sell) we are on, sopredictions and analysis believing the sides possess symmetry, can be wrong.
3.4 TWAP
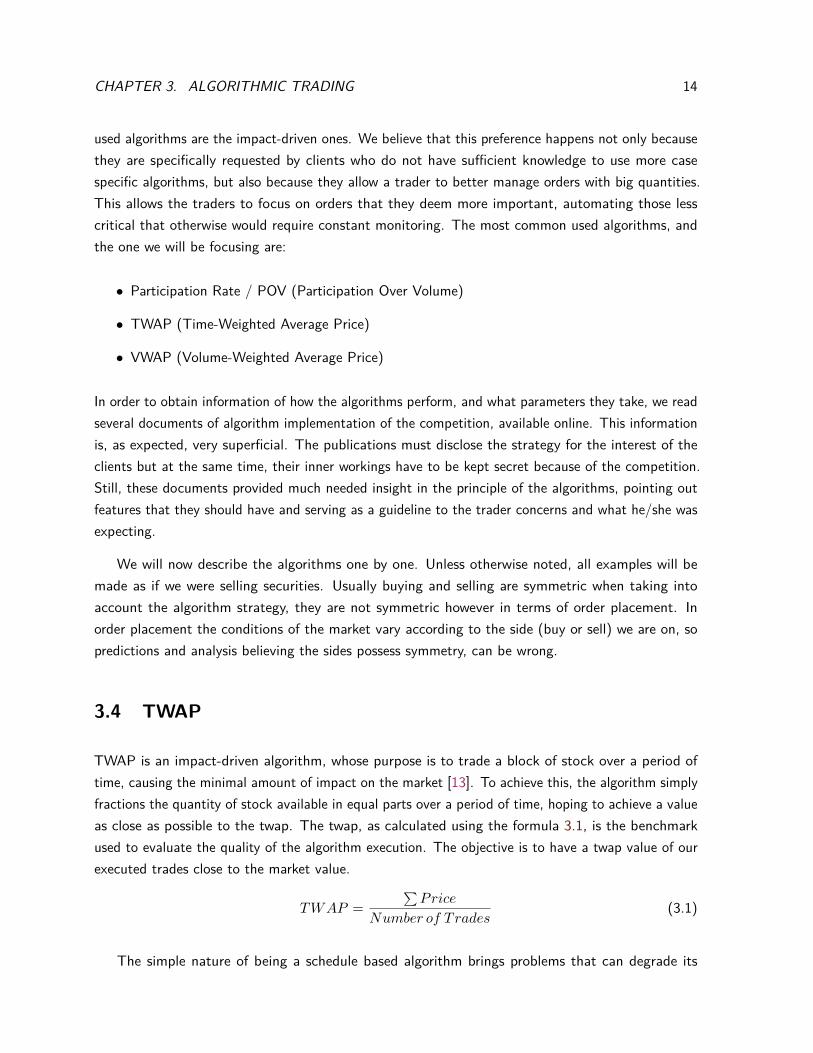
TWAP is an impact-driven algorithm, whose purpose is to trade a block of stock over a period oftime, causing the minimal amount of impact on the market [13]. To achieve this, the algorithm simplyfractions the quantity of stock available in equal parts over a period of time, hoping to achieve a valueas close as possible to the twap. The twap, as calculated using the formula 3.1, is the benchmarkused to evaluate the quality of the algorithm execution. The objective is to have a twap value of ourexecuted trades close to the market value.
TWAP =∑Price
Number of Trades(3.1)
The simple nature of being a schedule based algorithm brings problems that can degrade its

CHAPTER 3. ALGORITHMIC TRADING 15
execution, depending of market conditions. It can suffer from serious signaling risk, by givinginformation of its operation. If we place orders of the same quantity at the same time interval wecan fall prey of competitors that might be looking for patterns indicating the usage of this typeof algorithms. This is a dangerous behavior, as an observer with that information can cause anunfavorable market movement, given that he now has information regarding our intentions and thatgives him the upper hand in negotiating. Because of this risk there exists the need to mask our ordersby not sending them at regular time intervals and with the same quantity. These alterations mustnot change in any way the algorithm behavior or disrupt its purpose. The actual order placement isalso an important factor that must be taken into consideration. Just sending the order at market orlimited price might not achieve the best price or targeted execution, by selecting a favorable orderexecution strategy we can improve the results and overall algorithm performance.
The schedule is generated by dispersing a given quantity per time, that does not however guaranteeus the total execution of the order. The guarantee of execution is dependent on the strategy used.There is also the possibility of using order execution parameters that will interfere with the certaintyof execution. If the parent order has a limiting price, the algorithm cannot override it, causing thenon fulfillment of orders if the market trends away from us. We could use some kind of catch uplogic, where we would accumulate the unexecuted volume and dispatch it at our earliest conveniencein the next scheduled time. Using these kinds of strategies would go against the main theory behindthe algorithm, as market impact would rise with increased quantity to be traded, causing a poorperformance.
The parameters the algorithm needs are the quantity to trade and the price limit. The time-spanof execution and other implementation parameters are optional.
3.5 VWAP
The VWAP algorithm, like TWAP, is also an impact-driven algorithm, thus making use of a schedule.Its use is to automate the trading of blocks equities in a passive manner, in order to have the minimumpossible impact on the market [13]. In order to achieve the result, it will slice the order in quantitiesthat are proportionally similar to the volume being made by the market. At the time-span definedby the algorithm, if the current stock volume being traded correspond to a percentage of the finaltotal market volume, we want to mimic that percentage taking into account our own quantity. Thisalgorithm strategy, as indicated by its name, is based on the vwap benchmark. This benchmarkis widely used due to the fact of being considered unbiased in relation to other indicators thatemploy non-representative points (for example the twap). The VWAP achieves this by taking intoconsideration the weight a transaction has. A trade with a higher volume has more impact on themarket volume, and therefore contributed more. The use of transaction weigh mitigates the effect

CHAPTER 3. ALGORITHMIC TRADING 16
that some prices, like closing time prices, have on the evaluation of the true trade value [2]. Theformula is given by summing the multiplication of the traded shares volume (V ) at their respectiveprice (P ), over a particular time (j) and then divide them by the total number of traded shares(∑
j Vj) to get the weighted mean (formula 3.2).
VWAP =∑
j(Vj × Pj)∑j Vj
(3.2)
Any interval of time can be taken into account, but usually it is calculated from start to finish ofthe trading day. If we consider the VWAP the closest value to the fair price of a share, we can definethe market impact cost of a transaction by comparing it to the trade we made. A trader top priority,while using this strategy, is to minimize the market impact so he will be considered successful if thetrades he participates on that day give a market impact of exactly zero.2
Market ImpactCost = V olumeWeightedAveragePrice−Buy Price (3.3)
Market ImpactCost = −V olumeWeightedAveragePrice+ Sell Price (3.4)
Looking at the formula previously described (3.3 and 3.4) in order to achieve the desired costof zero market impact, in the best case, our prices must be equal to the VWAP or at least as closeas possible. To get the closest possible value we would need to participate in each available tradeexactly in proportion of our order relative to the final market value and at the same price value.This is not possible, because we do not know what is our order size relative to the final volume but,more importantly, we cannot know when will trades happen and their characteristics. Instead of thisapproach, it is shown by Kissel et al. [14], that the best strategy is, instead of considering all trades,to divide the trade period in slices and use the volume and average execution price of that period(formula 3.5).
VWAPj =∑
VjP̄j (3.5)
Assuming we can obtain the same average price of each slice, to approximate the value is to findthe slices that minimize the difference between the VWAP benchmark and our average executionprice. The solution is to participate in proportion with the orders in each slice. In order to do that wemust find beforehand which percentage of the final volume each slice will have so we can divide the
2If a trader is truly concerned about market impact he will want the trades to be inline with the vwap benchmark. Inpractice hovever that might not be true, as a positive market impact means also that the trades where better thanaverage.

CHAPTER 3. ALGORITHMIC TRADING 17
order quantity and proceed with the schedule.
As expected, the final volume is only known at the end of the trading period, which is a problem.By the time we know for certain the value of the final traded volume, all trades in which we wantedto participate will be over and we have missed our opportunity. We can try to predict the final volumeof that day, but by doing so, we would incur on errors. The prediction of just one value, that is quitevolatile among trading days, would not give us any reliable information on how the trade volumeprogresses along the day. Instead we will believe that the volume follows a pattern in relation toits final volume and its variation is of no consequence. For example, it is known that the volumeof certain equities is not random but follows a pattern achieving peaks at the open and close time.There is also the possibility that, in some markets, the volume at the time of the opening hours ofother exchanges can induce on volume variation. By observing this effects using historical intradaydata we can create a volume profile of the stock which the algorithm will use to create the schedule.
3.6 Participation Rate
Also known as Participation Over Volume (POV), the participation algorithm aims to fulfill a percentageof the market traded volume [13]. POV is an impact-driven algorithm, its purpose is to reduce marketimpact by trading inline with the volume. The algorithm monitors the quantity of all the tradesexecuted, since the order submission start date, and calculates how many stock it has to trade in orderto keep close to a chosen target percentage of that volume. This may categorize the algorithm as anevaluative one, taking into consideration that it reacts to the market, but it is really schedule-driven,the schedule is dynamic and only known at the time a trade is executed but is predictable. In itssimpler form and assuming that the market is liquid enough to support it, this algorithm guaranteescomplete execution. In practice though that will not be the case, thanks to the restrictions we mustenforce to ensure a safe execution.
In order to participate a volume according to the target value, we cannot just place an ordercontaining the percentage needed for volume completion. If we reacted to a trade that just occurredwith an order quantity of exactly the needed to obtain the participation target number we would fail,because in the next instant the total volume has changed by an amount equal to our order placement.To avoid that situation, we need to offset our quantity placed according to the impact we will have onthe market. In case we fail to do so, the algorithm will be always a step behind, and a cycle can form,never achieving stabilization. We must participate in the desired quantity as defined by formula 3.6.
Quantity = V olume ∗ Participation Target1− Participation Target (3.6)
As with TWAP the POV algorithm is subjected to signaling risk, having the risk a particularly

CHAPTER 3. ALGORITHMIC TRADING 18
stronger impact [17] causing the algorithm to be easily manipulated. Every time a trade occurs if thealgorithm rushes to place an order a pattern can arise. A competitor could easily use this information,and our performance could drop. Other issue that could hinder our performance is the competitionbetween algorithms of the same type. If we had two or more of the same algorithms running, theywould compete with eachother, tying to fill their order volume as fast as possible. In this case onceone completes a trade, the other has to issue more orders, because the market volume has changed.If the order book has enough orders and the order prices are not limited, the performance of bothalgorithms would decrease quickly. To prevent these actions we must regulate the order placement,trading more periodically with the volume by adding a deviation to the target percentage. By allowingthe algorithm to incur in taking the percentage with error, we can either get ahead or behind thetarget value, and plan the placement of our order. This would also allow an increase in options forour algorithm by creating a parameter regarding the aggressiveness of execution, that would definehow closely we would track the target values. Having this margin for execution we could even proposethe placement of orders outside of the schedule in order to do opportunistic trades. Of course if themarket is liquid enough this behavior might not be necessary, we will not have problems in signaling aHuman competitor if a huge amount of different trades are happening in the market, but still, we canfall prey to proprietary algorithms.
Apart from measures against the signaling risk we will also need safeguards to guarantee theperformance does not degrade to an unsuportable state, incurring in possible big losses. Volumespikes can degrade our execution and should be taken into account. A large spike will degrade theprices on the order book by taking away liquidity and may force the drop of orders on the book to anunfavorable state. Tracking the volume closely would exacerbate the problem, because after the spikewe would go to the market and force execution, getting the worst deal. This can be solved by nottracking closely the value, ignoring the volume spike or by placing a limit price on our orders. Withthis measure we would gain better execution but at the expense of order completion and dependingon the trader objective, this could be desirable or not.
The price limit is a parameter of the algorithm and can be used to counter volume spikes, bylimiting our entrance in bad trades, but can also create those spikes and force a possible non-completionof the algorithm. If we place a price limit and the security market value drops under it, the algorithmcannot place orders that go against that value. If we continue monitoring the volume while the priceis against the limit, after the recovery the algorithm will find itself with a lot of ground to coverand will be overly aggressive in order to maintain the target value. This spike can be prevented ifthe trades made bellow the limit value are ignored, not being counted for the final total volume.An alternative is to use future prediction and start compensating pre trade, fulfilling more quantitythan that needed to achieve the target percentage, when we know the price will go under our limitvalue, or even use a smoother catch up logic. The catch up logic has the same issues the TWAP hadregarding market impact, but we can support it if market conditions regarding liquidity allows for an

CHAPTER 3. ALGORITHMIC TRADING 19
increase of small volume traded without severe market impact.
3.7 Order placement strategy and Execution Probability
An aspect that must be taken into account by all algorithms is the placement strategy. The schedulewill dictate how the algorithm should divide its orders to achieve its objective, the placement strategyis responsible for the actual placement of the order on the market. It assigns a price and decideswhich order type it should have. This strategy is of paramount importance to our module because itwill have direct influence on how well the algorithm performs on the short term, aiming to minimizethe transaction cost. The cost we are willing to pay, the transaction cost, is directly related to ourability to execute our order in the required time-frame. When we want a guaranteed transaction, weare sure that will be completed in an arbitrary time-frame, we have to pay an increasing price. Byputting our order with a more desirable price we will incur in a loss, but because of the properties ofthe limit order book, our order will be closer to the top of the queue (if it is a sell order, loweringthe price will make it more desirable for the buy). If the market trends in the opposite directionwe will have to change our order so it can follow it. By doing so we are trading the execution forprofit, as our order will have to be cancelled and submitted at a new worse price. By going long(holding our stock and placing it at a more favorable price) we are trading guarantee of executionfor price. This is exacerbated if the time we have to dispatch the order is limited and small. If wehave some information that will benefit us, or a tight schedule to follow, being able to comply withthe time constraint is important, we will not only want to guarantee execution but also do it in theallotted time period. This reduces our option for waiting for a better situation, meaning we will haveto manage the execution risk that can impact the execution cost. A more desirable order for themarket, one that has the most competitive price, will have priority on the book and be more quicklyexecuted. In an unpredictable market, changing the position on the order book might not be enough,the price can trend in an opposite direction, leaving us behind. We may add to the cost in order toguarantee immediate execution. The extra cost we must pay is the spread. By paying to go overthe spread we will directly consume an order at the current worst possible price, because we had toactively press forward and make the transaction. We can pay this cost by submitting a market order.This cost however can be bigger if we allow for slippage to occur. If our order arrives later thanother concurrent orders, we might fail the price we thought it would be achieved at the moment ofsubmission, and instead get a worse (or better) one. In short, its a dilemma, a trader must juggle theexecution timing and price, paying more for fulfillment or waiting and possibly achieve a better price.
The algorithms will have to manage these options at the order placement moment and theywill base their decision depending on the objective (guaranteed execution or best price) definedby the parameters submitted by the user. Please note that order placement strategy is not to bemistaken for the algorithm strategy. The strategy of the algorithms answers the questions before the

CHAPTER 3. ALGORITHMIC TRADING 20
order placement “How much quantity should my orders have?” and “What time should I place it?”.Questions such as “How much should the order be priced, in order to guarantee the best relationbetween price and execution time?” is part of the order placement strategy. The placement strategycan be based on the notion of probability of execution.
The Execution Probability indicates the likelihood of an order placed at time t with price p beexecuted in the t+ 1 instant. The analysis of the trader objective is an important consideration tohave, as it influences the strategy to be used. Harris [11] defines three stylized trading problems,focusing on small volumes ( due to market impact problems ), that represent the diferent traderobjectives. The small volume restriction is on importance to us, as the algorithm scheduling handlesthat particular problem by negating the quantity impact on the market. We can consider that ordersubmissions do not affect the market. The three trading problems are the following:
• Liquidity Traders (LT) - These traders need to fulfill an order before a deadline is reached. Theywill try to obtain the best possible price but their priority is guarantee the order is executed.Usually they start working the market in a passive fashion, but as the deadline approaches theytake a more aggressive stance.
• Informed Trader (IT) - An Informed Trader has private information about price changes andbelieve that that information will soon be available to everyone. They have time constraints,as they need to react quickly, in order to profit from their information. Unlike the LiquidityTraders they are not obliged to trade before the deadline and will only trade if it is profitable.
• Value-Motivated Traders (VT) - A Value-Motivated Trader is always receiving private informationof security values. Usually they are continually estimating the value of the securities they follow,and need immediate execution if they believe an abrupt price change will happen, otherwisethey will place limit orders and try profiting from pricing errors. Unlike Informed Traders, theyhave continuous price information and are not constrained by a deadline.
The order placement strategy that will be used on the algorithms have all the qualities to be relatedto the first type, it is a problem regarding the Liquidity Traders. After having a schedule, our primaryobjective is to dispatch the orders with the best available price in the most swift manner, until thegiven due date, as a liquidity trader would require. Furthermore, the algorithm is somewhat obligedto trade, preventing it to belong to the other types, due to the promise of execution that it offers tothe trader. If a trade is not made, the quantity of unfulfilled orders can accumulate, damaging thedefined schedule and the intended objective of reduced market impact.
In the literature there are several strategies that use some specific market indicators ( such asvolume, book imbalance, book depth) in order to get insight on order placement. Yingsaeree [31]further divides these strategies in static or dynamic types. The Dynamic type possesses the abilityof monitoring the placed orders and changes them as it pleases (taking into account the properties

CHAPTER 3. ALGORITHMIC TRADING 21
of the limit order book). The Static types only allow one shot orders, having no ability to changethem. Simply because our order book can use dynamic order strategies, this does not mean that thestatic types should be neglected as information contained in them can be useful, furthermore, theimplementation of dynamic orders may prove a challenge taking into account the infrastructure ofthe SifoxDeal application and the available data. The small time-span for order execution, obtainedfrom the schedule of the algorithms may also cause the unavailability of dynamic order. Dynamicallyaltering orders requires time, for the editing of orders, communication and analysis of factors, timethat in a tight schedule will not be available. Also, once the order changes, it goes back to thebottom of the queue for the same price range further limiting the execution time. As such the staticoption can be the only option for some order placement.
Handa and Schwartz [10] investigate the use of market and limit orders as a strategy. Theyconclude that using limit orders is detrimental if the market only reacts to information and there isno market imbalance. An uninformed trader will loose by placing limit orders (when competing withinformed traders). However, if there is enough market orders causing market imbalance, moving theprice to reach the limit order value, there will be a gain. In case of order non-execution the followingtwo options are given: not execute or execute at the end of trading period at closing price. Thesecond option will result in an additional cost, the cost of exchanging a limit order into a market order.They conclude that patient traders, those that are willing to wait are the ones that will benefit themost from the placement of limit orders and that there is not a big turnover difference between usingmarket or limit orders. We can use this information by only placing limit orders when the markethas enough market orders, reflected on volatility and number of trades, to catch our limit orders inour allotted time interval. It is also of our interest as we predicted, to not execute the orders at theend of the closing period to force their execution, for the non-execution cost produces worst resultsthan the limit orders. This however indicates that simply using a market order could be enough.From our observations this would not be the case or sufficient. For example in the VWAP algorithmwe must guarantee the mean price, or better, in order for the execution to be more successful. Byusing more information we might be able to hit a sweet spot with the limit order, achieving the bestcost/execution tradeoff.
Nevnvaka et al. [19] combine market orders with limit orders to obtain a better execution,somewhat contradicting Handa and Schwartz [10] findings. They propose using a risk-return curvebased on historical data capable of finding the efficient pricing frontier. The return graph will indicatehow far to place an order in order to achieve the least execution price. The risk profile (being the riskof non-execution, mid-spread volatility and volume volatility combined by defined it as the standarddeviation of returns) , indicates the risk of non-execution, the more we hide on the book the higherthe risk. Combining these two profiles we get a curve that relates risk and the return. With it wecan choose a strategy by picking price improvement or risk. In this case the risk (non-execution) is amore important factor due to the type of problem we are trying to solve (Liquidity Trader). Some

CHAPTER 3. ALGORITHMIC TRADING 22
considerations need to be taken into account regarding some variables in this process, that can becontrolled in order to achieve better performance of this model. It is indicated that special care mustbe given to Order Size, Time of the Day, Time Window and Market Conditions. Big order sizes forcethe orders to be more aggressive in order to complete. This will not be an issue with the algorithmssince the schedule they do is exactly for the restriction of big orders. The time window available fororder completion changes considerably this approach [19]. A small time window means less time forthe market to hit our limit order, while a large one gives more time for that to happen. Taking intoaccount market properties and with a small time window we might be more successful if the order isplaced directly on the market. Time of day can influence the order speed due to the variations ofvolume and should be considered if the trading period is long. The trading volume, and volatilityare the most important factors of the market conditions, and our model data should be constructedwith these values in mind. Concluding the article the authors point out that this approach can be ageneralization and the optimal strategy can change over time, where we must reevaluate the pricingstrategy. It is proposed the creation of a function that using the described elements will produce ourlimit distance. We can use the ideas on this article to create a risk-return and use this to express theprobability of execution, attributing an option to our placement strategy that will enable the traderto change the risk parameters for the placement strategy.
There is the idea that if the book permits order adjustment, its use will make for better results. Byaltering a limit order we can place it in a more favorable position, hence beating the price of a staticlimit order. Furthermore, in the current electronic market, there is the potential of more informationbeing available that can allow for a better execution [20]. Before the only available information wasthe best bid / ask, and the price of the executed trades, now with eletronic trading, we have accessto more details of the book, capable of seeing the outstanding limit orders and their parameters,in any depth. The incorporation of these new variables allied with dynamic order adjustment canimprove performance on the algorithms. Wang and Zang [29] propose a dynamic focus strategy (DF),adjusting the volume of market orders by monitoring one of two parameters, the inventory unexecutedvolume or the order book imbalance. For quantitative analysis they propose a formula based on asigmoid function that reacts to those parameters taking into account the remaining time. They claimthat the method can also be applied to limit orders in order to achieve better performance. Takinginto account that order book imbalance offers very little performance improvement [20] and is seen asa future trading cost predictor, the inventory DF strategy is best suited for the algorithms described.
In our work we incorporated some of these ideas when developing the order placement strategythat will be common to all algorithms. In our opinion, the order placement is the most relevant partin the trading system, as this is the one that will define the losses and profits, therefore it is the partthat should receive more attention and be allocated more resourses. If we manage to find a methodthat reduces transaction cost, independent of the algorithm used, the overall performance can greatlyincrease and we can also provide more options for a trader. To demonstrate further the importance of

CHAPTER 3. ALGORITHMIC TRADING 23
the order execution we reefer to the documentation provided by companies that provide algorithmicsolutions. In their documentation, the description of the algorithm is guarded. The trader knowswhat type of algorithm is (the scheduling principle is usually common knowledge) and to what extentthe option they input alter the execution, but the actual order strategy is never shown or even hinted.Usually their order placement strategy is marketed as a new and better special system and is followedby graphical plots of execution performance as proof of their worth. This is the core and one of thebest kept secrets of the trade execution section of algorithmic trading (Fig. 3.1).
3.8 Evaluation
It is not in the scope of this report to compare the algorithms among themselves. It is not usefulto know if one algorithm provides better results than other, for some market conditions, but we dorequire to know , among the variations of our implementation, which one obtains better performance.This introduces the problem of defining what is the best algorithm and how do we proceed to comparetheir variations. Usually we evaluate an algorithm by determining the amount of resources, in termsof time and space, required for its execution. It this case however we are less interested on performingcomplexity analysis and more focused on measuring the quality of the solution. It is easy to make themistake of thinking that different algorithms try to achieve different objectives, that their schedulesare created in a specific form and that they try to solve slightly different kinds of problems. A traderthat uses the POV algorithm might be looking to end the day with a percentage of the volume,but the theory behind the algorithm operation is not concerned to obtaining that percentage as itsultimate goal. The algorithm uses the percentage as a means to an end, because it theorizes thatby following the schedule provided it will achieve better results on its trades, by reducing marketimpact. In reality the algorithms share the same ultimate price driven objective: profit [26]. Theyuse different tactics specific to different market situations to try to consistently achieve good returnswhile minimizing the risk. In this case the profits obtained are the result of two components of thealgorithm, the schedule calculation and the order placement strategy.
In trading, each day is different from the previous one and the decisions are made as the ordersarrive on the market. This makes testing the algorithms a dificult problem, as they can be seenas belonging to the online algorithms class. By definition an online algorithm is an algorithm thatreceives a sequence data as discrete pieces and has no prior knowledge of the contents of the nextpiece. Decisions must be made as new information is received and this constitutes a problem if anoptimization is to be made, due to the lack of details about the future. These types of algorithmscontrast with the offline algorithm variety, which have access to the whole information in one go,allowing them to make better decisions. In algorithmic trading, although some information regardingfuture patterns can be obtained, the data received in order to make decisions is provenient from themarket intraday movements, which are known to be unpredictable to a certain degree. One of the

CHAPTER 3. ALGORITHMIC TRADING 24
ways to analyze online algorithms is by means of competitive analysis. By comparing the algorithm toan optimal offline counterpart (the same algorithm with access to the full data and knowledge of it)we can obtain a measure of the quality between the optimal, offline solution, and the online solution.Since we use a quantitative metric based on the returns obtained, we do not need to do a comparisonwith the optimal solution, to determine which variation performs best. However, doing a comparisonagainst an optimal solution can give us a basis point to compare how well the algorithms perform ingeneral.
Ideally, we would test our algorithms in the real live market, but that is risky and unwise. Theadvantage of doing such a test would be the unpredictability and our impact on the market would befelt and considered for evaluation, the disadvantage would be the possible loss of capital. So in orderto test the algorithms we must use historical data, which will be suboptimal as the market impactthat we will induce will not be accountable.

Chapter 4
Prototype Development
In this section we describe the development and implementation of the prototype for the algorithmtrading, integrated with the Sifox Deal application. Taking into account the infrastructure availableand the request for an immediate functional prototype in order to showcase the solution to thecompany clients, priority was given to produce visible results instead of the deployment of the solutionin its most logical and ultimately final place. This decision is reflected in the direct integration of theprototype with the Sifox Deal solution. The service that should be server based was developed on theclient side having therefore access to the required infrastructure needed for a quick development andtest of the application. In the future this component is to be migrated into a server, leaving in theterminals application only the means to interact with it (Figure 4.1).
The implementation of the prototype on the terminal side entails some problems that must betaken in consideration and reflects the future need to migrate the application. The machine wherethe application is running is not controlled by us. Not having that control entails not knowing whattype of machine is running our code or what programs exist there. This can potentially cause a loss ofperformance, which will impact time sensitive operations, like following a schedule, or quick responsesto market events. The complete delegation of the entire module execution to the client can create arisk of the schedule non-completion, either because the system has been turned off or simply crashed.The application only executes when the system is up and running. Regarding system crashes, thisapproach could potentially improve the system overall stability. By increasing the number of breakingpoints and moving the issue from the server to the clients, in case of failure the only affected wouldbe the terminals with problems, and not all the available clients. While this could be true, we believethat it would not affect significantly the application, due to the way the other system components areorganized in the Sifox application suit. Furthermore, focusing on only one point makes the companytake special attention to it, supplying more resources to its maintenance and development, thereforeminimizing the risk of a failure. One other issue that arises with this configuration is speed - notreally a factor on the types of algorithms presented if not exceedingly slow - and the maintenance of
25

CHAPTER 4. PROTOTYPE DEVELOPMENT 26
Figure 4.1: Algorithm Module placement alternatives on the Finantech solution. The dotted blue linerepresents the path taken when the module is in the server side. The green full line represents themodule placement on the Client side directly on the SifoxDeal application.
repeated information across multiple clients. All these problems surpass the downsides of having amore centered service, therefore in the future we recommend the port of the application. Other thansome small details on the architecture and technology features, that we mention along this report, noparticular step was taken in order to prepare for the realization of the port or architecture change.
The SifoxDeal application was developed with the .NET framework1 (version 4.0) using the nativeWPF (Windows Presentation Foundation) for its GUI display and interaction. For the IDE we usedthe Visual Studio 2010 with the support of TFS (Team Foundation Server) for versioning control,creating a branch of the current SifoxDeal application.
4.1 Architecture Overview
The SifoxDeal application follows a modified model-view-controler software pattern. Using itsarchitecture as a reference we created a package to house our implementation in the required sections,the main module sections and the GUI, as described in figure 4.2.
We use the Singleton pattern design to create the following main components with the describedfunctionality:
• AlgorithmManager - Class responsible for the management of the algorithm Instances. It1http://www.microsoft.com/net

CHAPTER 4. PROTOTYPE DEVELOPMENT 27
Figu
re4.2:
UMLdiagram
oftheAlgorithm
Mod
uleim
plem
entatio
nin
theSifoxD
eala
pplication,
focusin
gon
theAlgorithm
Manager
and
Algorithm
classes.

CHAPTER 4. PROTOTYPE DEVELOPMENT 28
provides the point of interaction with the algorithms and manages their schedules (start andstop times) and state.
• AlgorithmLogManager - Manages the Log system of the application.
• Gypsy2 - This component is responsible for the prediction models and provides informationrequired to the algorithms. It can also provide required information for the client.
Due to the way SifoxDeal was designed, these components have well defined interfaces for communi-cating with the rest of the application components.
The submission of orders was integrated in the application by substituting the care orders menu.A care order is simply an order to be managed by a trader and can interchangeably be traded by anormal order, when submitting to the algorithm box. We use the ID from the care order to identifythe algorithm, piggybacking on the text field of the care to pass the information to our algorithm.Understandably we were unable to obtain access to the main database responsible to store theinformation of the care order. The API connecting the application to the database was not ready toreceive requests to store and retrieve algorithm related information, so we used the text field.
In order to monitor the progress of execution of the orders, a log system was created and addedto the Sifox application (Figure 4.3). This Logger not only receives the messages from the algorithmmanager regarding the algorithms, but also monitors them, checking if they are running, pooling thealgorithm every 20 seconds for its state.
4.2 Algorithms
We will now describe the details of the implementation of each particular algorithm in the describedsystem. Each of them has the same core capabilities with the interaction with the system, implementedby their parent Algorithm class.
The parent abstract class Algorithm has all the components necessary for their interaction with theother system components and creates the template for their functioning. It manages the reception ofmarket data, handles the interaction with the AlgorithmManager, creates the log events and sanitizesthe care order properties, converting them to the required type while verifying them (for exampleconverting the order quantity from string to int). The abstract methods that it implements work as atemplate for the classes that inherit it. These methods are concerned with the algorithm executionmechanic (load , reload, finish, stop and execute) , particular parameters validation and its logic (buyor sell).
2The Gypsy is given because of the ability of predicting the fate seen in the romanticized gypsy of novels and films.
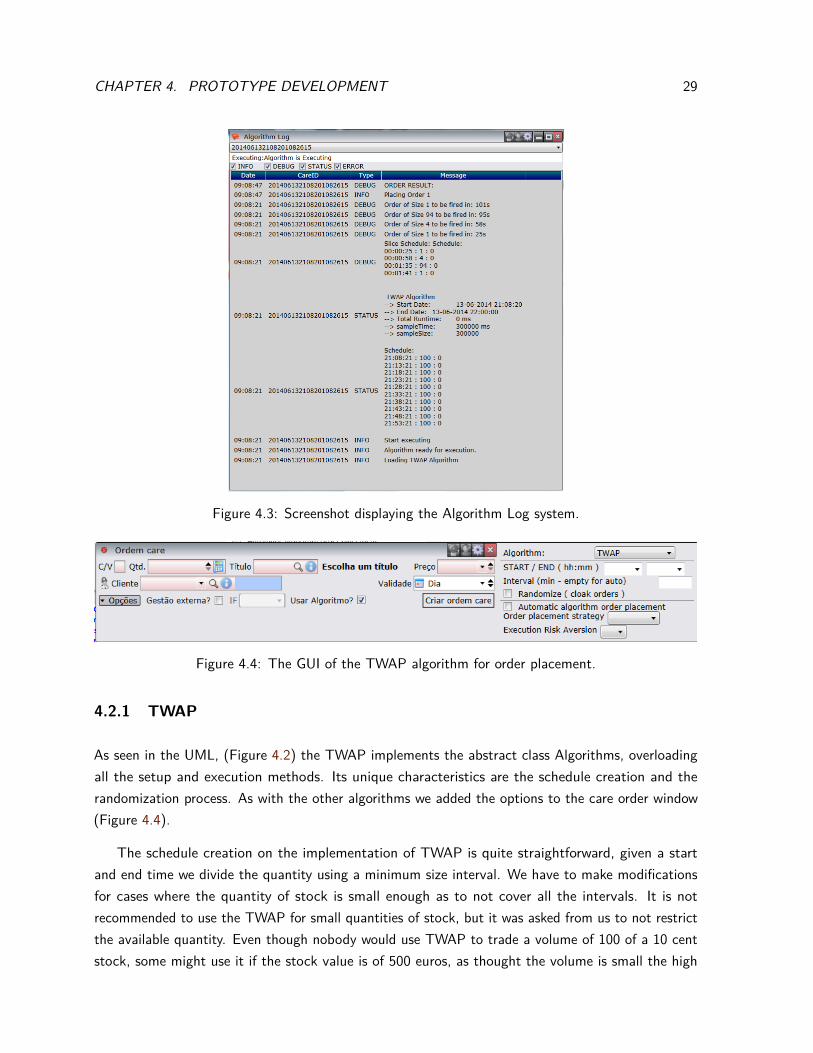
CHAPTER 4. PROTOTYPE DEVELOPMENT 29
Figure 4.3: Screenshot displaying the Algorithm Log system.
Figure 4.4: The GUI of the TWAP algorithm for order placement.
4.2.1 TWAP
As seen in the UML, (Figure 4.2) the TWAP implements the abstract class Algorithms, overloadingall the setup and execution methods. Its unique characteristics are the schedule creation and therandomization process. As with the other algorithms we added the options to the care order window(Figure 4.4).
The schedule creation on the implementation of TWAP is quite straightforward, given a startand end time we divide the quantity using a minimum size interval. We have to make modificationsfor cases where the quantity of stock is small enough as to not cover all the intervals. It is notrecommended to use the TWAP for small quantities of stock, but it was asked from us to not restrictthe available quantity. Even though nobody would use TWAP to trade a volume of 100 of a 10 centstock, some might use it if the stock value is of 500 euros, as thought the volume is small the high

CHAPTER 4. PROTOTYPE DEVELOPMENT 30
price of the stock increases its impact. In order to accommodate small quantities we automaticallystretched the interval window. On the limit, with a quantity of one, there would only exist one intervalwith the size of the total time-span. We also offer the option for the user to define size of interval,this is to allow the client to place orders using the time-span he/she wants. We propose this useonly in the testing phase, as we believe that if the client wants to put a quantity in a chosen intervalhe/she can simply use the systematic trading methods, selecting the periods and the time, creatinghis own schedule.
In order to avoid the signaling risk referred in section 3.4, we provide an option for randomizingorders created by the schedule. As with some other options we provide, the use of randomization onthe algorithm is optional. It came to our attention that some traders would have a personal ideaof how the algorithm should work. Some would like to indicate the period of time the order shouldbe placed and see it happen exactly by the clock, for example every half an hour, even though thebehavior would most likely cause a degradation of performance of the algorithm (due to signaling risk,as described in the respective section). This resulted on a dilemma, we can restrict the algorithmoperations in order to preserve performance or, we can give a wide array of options to the client. Onone hand, restricting options to preserve performance will reduce the possibility of failure caused bythe client, saving us the hassle of having to deal with those cases when things go wrong. On theother hand, the lack of control may not be attractive to the client and, even if some options are notcommonly used, their existence may be an asset to comfort for the prospective trader. Being this aprototype work we chose to allow the client to do as he wishes and specify the randomization as anoptional parameter. This allows us to test the algorithm on both hypotheses of execution, and seewhich one performs better.
Given a quantity and a time interval, the TWAP algorithm creates a schedule for the time-span.Between each order on that schedule, the randomization will occur. We take the time-span betweeneach order submission and divide it in smaller time intervals (slices). Each slice is created taking intoaccount some parameters (minimum and maximum interval length) in order to guarantee that thetotal number of stock sent is maintained. Using a defined minimum and maximum slice limit size, wefirst divide the time-span by the maximum slice size, obtaining the maximum limit number of slices.With this we guarantee that when randomizing the slices sizes the values do not get outside thetime-span limit. We then generate the random slices with a min to max range in an equal number tothe limit number of slices obtained before. Next, we fill the slots with a number of stock rangingfrom a minimum chosen value to a maximum never going above the quantity limit, redistributing theremaining in order to force that all the attributed stock is in the slices schedule. The restriction onthe number of stock must be better controlled depending on how the payment is made relative tomarket operations. Usually the market collects as a per-volume disregarding the number of orders. Incase of collection per-order we have to be more careful in dividing the orders to obtain the minimumprice possible. After the placement of the quantity in each slot, it is likely there will exist a certain
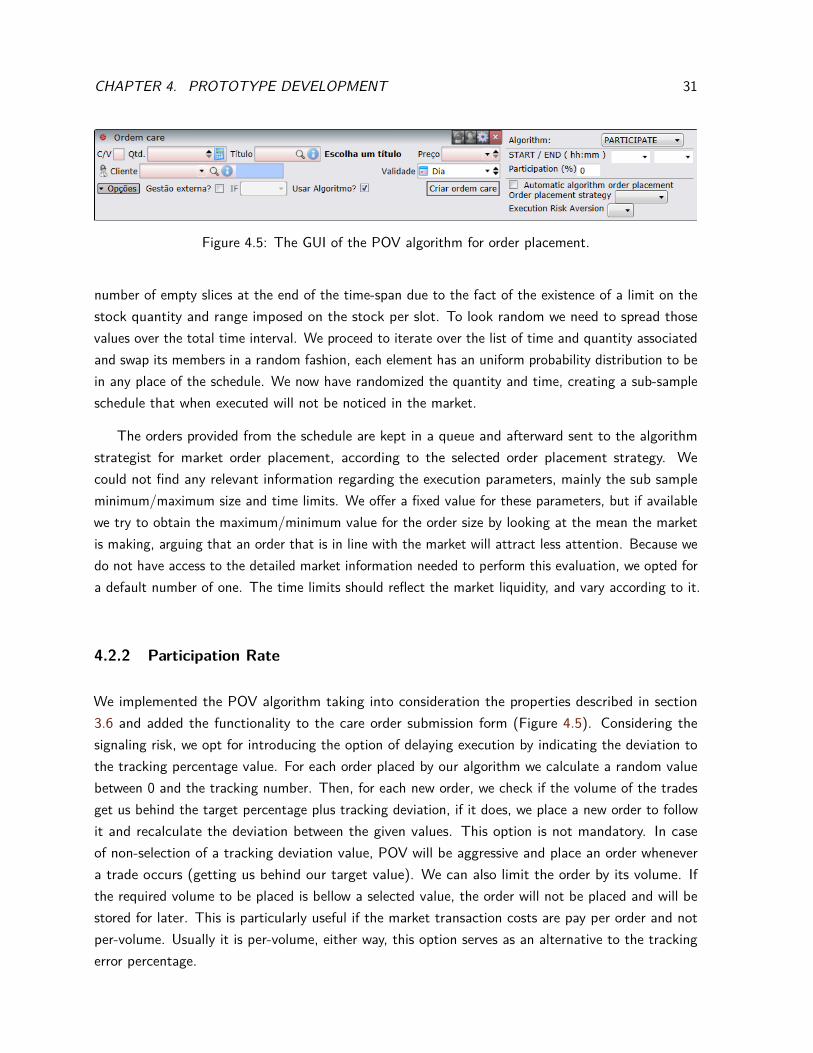
CHAPTER 4. PROTOTYPE DEVELOPMENT 31
Figure 4.5: The GUI of the POV algorithm for order placement.
number of empty slices at the end of the time-span due to the fact of the existence of a limit on thestock quantity and range imposed on the stock per slot. To look random we need to spread thosevalues over the total time interval. We proceed to iterate over the list of time and quantity associatedand swap its members in a random fashion, each element has an uniform probability distribution to bein any place of the schedule. We now have randomized the quantity and time, creating a sub-sampleschedule that when executed will not be noticed in the market.
The orders provided from the schedule are kept in a queue and afterward sent to the algorithmstrategist for market order placement, according to the selected order placement strategy. Wecould not find any relevant information regarding the execution parameters, mainly the sub sampleminimum/maximum size and time limits. We offer a fixed value for these parameters, but if availablewe try to obtain the maximum/minimum value for the order size by looking at the mean the marketis making, arguing that an order that is in line with the market will attract less attention. Because wedo not have access to the detailed market information needed to perform this evaluation, we opted fora default number of one. The time limits should reflect the market liquidity, and vary according to it.
4.2.2 Participation Rate
We implemented the POV algorithm taking into consideration the properties described in section3.6 and added the functionality to the care order submission form (Figure 4.5). Considering thesignaling risk, we opt for introducing the option of delaying execution by indicating the deviation tothe tracking percentage value. For each order placed by our algorithm we calculate a random valuebetween 0 and the tracking number. Then, for each new order, we check if the volume of the tradesget us behind the target percentage plus tracking deviation, if it does, we place a new order to followit and recalculate the deviation between the given values. This option is not mandatory. In caseof non-selection of a tracking deviation value, POV will be aggressive and place an order whenevera trade occurs (getting us behind our target value). We can also limit the order by its volume. Ifthe required volume to be placed is bellow a selected value, the order will not be placed and will bestored for later. This is particularly useful if the market transaction costs are pay per order and notper-volume. Usually it is per-volume, either way, this option serves as an alternative to the trackingerror percentage.

CHAPTER 4. PROTOTYPE DEVELOPMENT 32
Figure 4.6: The GUI of the VWAP algorithm for order placement.
The Market information is received by this class, via the Sifox existing interface IMarketDataOb-server (Fig. 4.2), and it is used to keep track of the executed trades volume. Due to data feedlimitations we must keep track of this ourselves, opposite to receiving that information directly fromthe feed, in order to filter the desired trades. This control allows us to monitor the prices of theexecuted trades and only add the volume of those whose price conforms with our order characteristics.This way we opt for the option of ignoring the volumes that fall below our execution price, eliminatingthe need for the algorithm to worry about the trades lost, that could possibly come up again asa volume spike. Although we also talked about detecting spikes in prices due to normal marketmovements, we do not achieve that, transferring the responsibility to the existence of a limit on thecare order price, inserted by the trader.
4.2.3 VWAP
The VWAP algorithm as the previous ones, implements the abstract class Algorithm class and wasadded to the care order submission form (Figure 4.6). The VWAP requires the construction of avolume profile to function (discussed in section 3.5).The profile is loaded and the schedule is createdat the moment of the algorithm execution. As previous algorithms the scheduled next order waitsexecution and when time arrives, the strategist executes it taking into account the order placementstrategy selected.
The Volume Profile is the cornerstone of this algorithm, the schedule generation is dependent onits existence. Section 4.3 provides the details of the construction of the profile, how it is implementedand its use.
4.3 Volume Profile Model Construction
In order for the VWAP to create a schedule it must be supplied a volume profile (as described in 3.5),constructed by using historical data. There are several known facts about volume profiles that reflecttheir stability [14]:
• Usage of more than 30 days of data offers no statistical improvement to the profile shape. The

CHAPTER 4. PROTOTYPE DEVELOPMENT 33
more liquid or stable a stock is the less data-points we will need. This is not applicable toilliquid stock.
• An old data-set is not detrimental to the estimate of the profile curve, given that the tradestructure is stable and the traders operate the same way now as they did in the data-set timeperiod.
This provided stability indicates some limits that the data used to calculate the profile will have: up toa point having the best data won’t work to improve the accuracy of the profile, and the performancewill depend on the model used. The ability of producing quality profiles is dependent on the stockused. A stable stock, or one which has gradual trends, will obtain better results on the predictedvolume [13]. This means that for some equities the algorithms that use volume prediction will not bethe best. There is also the issue of seasonal one day trends, caused by events like Christmas andearnings reports. These anomalous days may cause a spike variation on the volume that may bedifficult to handle by some volume profile models.
4.3.1 Data-set
The historical data used comprises the intraday trades for the Google stock (GOOG) on the NASDAQexchange from 19 February to 7 March of 2014 and 20 March to 15 April of 2014 on a total of 32trading days. The files where obtained using the now deprecated Google finance API3. They are CSVfiles with a custom header and data consisting of the intraday trades accumulated in the minuteinterval having each the respective values for the open, close, high, low and volume. We verified thatthe data-set needed to be cleaned, mainly because of missing intraday ticks. Analyzing the data,we found that the number of consecutive jumps were no bigger than two (2% of all the gaps wereof size two), of all days 22 had gaps (69% of the total days) averaging 6 gaps per file in a totalnumber of 138 gaps in a total of 12480 ticks (1% of the total ticks) . This missing data can havetwo provenances, simply in that minute there where no trades made (improbable since the stock isknown to be liquid) or there was an error registering the trades. Either way, the missing points wereabsorbed into the time-frame chosen periods, not having a big impact on the overall data, as the tickvolume can be negligible for a considerable large trading period. A script developed in Python4 isused to clean and transform the data, exporting it as a CSV file. The data obtained is organizedas a file per day and each file has listed the time period, aggregated from the intra-day, with thecorresponding total volume (Table 4.1 ).
In order to test the described methods without the overhead of having to implementing themon the system, we used the R 5 software with the default pre-installed packages. By using R script
3Deprecated in June 3 2011, but not shutdown[7].4https://www.python.org/5http://www.r-project.org/

CHAPTER 4. PROTOTYPE DEVELOPMENT 34
Date Close High Low Open Volumea1392820200 1204.11 1205.6 1204.11 1205.3 37744
1 1206.135 1206.57 1203.15 1204.715 247942 1205.16 1205.39 1204.241 1204.28 95653 204.67 1206.42 1204.44 1205.18 10328
...387 1204.4 1204.86 1204.35 1204.86 3524388 1204.89 1204.99 1204.01 1204.39 5114389 1204.832 1205.15 1204.76 1204.96 6256390 1204.11 1205.08 1203.23 1204.85 138213
(a)
Tick (15 min) Volume0 377441 960322 718013 53115
...24 8476325 11403226 10399227 141545
(b)
Tick (15 min) Volume (%)0 0.02561 0.06532 0.04883 0.0361
...24 0.057625 0.077526 0.070727 0.0963
(c)
Table 4.1: Sample of volume profile construction from the data obtained via Google API. a) Dataas received by the google API. b) Volume agregattion by Date, each tick has a size of 15 minutes,except the first and last ones. First and last tick correspond to close and open bid. c) Conversion tovolume percentage.
capabilities we transform processed data and produce the results which we analyze.
4.3.2 Tick Size
We must now take into consideration the minimum time slice allowed for the volume profile, thelength of time we will base our prediction. If we could predict the volume within a one minute tick,our results would be great, not only we would approximate the volume on a smaller scale and moreclosely to what is happening but also, we can offer a time scale to the minute allowing an orderplacement to be done in any time without loss of precision. This, however, is extremely difficult andin practice will perform terrible comparatively with the increase of the tick size. With a sample takenof five consecutive days, we took their volume profile and calculated the cumulative error per tick size(Figure 4.7) and, as expected, the more we increase the tick size the lower the error. At the limit, atick size of the whole day, will correspond with an error of 0. This is in line with the intuition that

CHAPTER 4. PROTOTYPE DEVELOPMENT 35
predicting a volume over a longer period of time is better than doing it in every minute. A good errorreduction can be achieved at intervals of 15 minutes, while maintaining flexibility for the choice oftime periods.
4.3.3 Evaluation Method
As described in section 3.5 the VWAP performance is dependent on how the profile tracks the currentday volume, assuming the average price is achieved. Having this information in mind, the best volumeprofile will be the one whose deviation from the current day volume is as close as possible to zero.This difference can be measured by calculating the absolute deviation between zero and the differenceof the profile with the current evaluated day trade as an absolute value, described by the followingformula:
Di = (| (pi − ti) |) (4.1)
where i is the period considered. Alternatively we can check how similar is the testing profile graphto the volume profile using a chi-squared test (Pearson’s chi-squared test formula 4.2) to evaluatethe goodness of fit between them. Being the observed values the test profile and the expected thepre-calculated volume profile we can apply the following formula:
X2 =n∑
i=1
(Oi − Ei)2
Ei(4.2)
This value will reflect the absolute deviation, the lower the result of X2 the closer is our modelcreated volume profile to the current volume.
4.3.4 Models
Having the historical data and a method of evaluation we just need a model that will allow us tocreate the profile. Usually the calculation of the profile is made by applying an average over historicaldata [13, 14]. We apply the following models to the data-set:
• Simple Average (SA) - By using an average along the data-set period for the trading days n,we calculate for each trading day i and each period j of that trading day:
uj = 1n
n∑i=1
vij
Vi(4.3)
where Vi is the total volume of that day. The result will be a vector uj containing the percentage

CHAPTER 4. PROTOTYPE DEVELOPMENT 36
(a)
(b)
Figure 4.7: Intraday percentage of volume variation and the associated cumulative error from fiveconsecutive days (19 to 25 February, GOOG stock). a) Intraday percentage of volume variationbetween five consecutive days in different time scales. The first and last tick are respectively the openand close. b) Cumulative error per tick size. The first and last tick are respectively the open and close.The error is calculated as the absolute difference between the points of all five consecutive days.

CHAPTER 4. PROTOTYPE DEVELOPMENT 37
values for each interval of the chosen length. The data used will be set in a fixed time frame.Overtime, because of seasonal trends and variations, the performance of this profile will degradeforcing the value to be recalculated in order to catch up to the recent trends. In terms ofstorage space this means we will have to maintain the historical values of stock for at least thetime-frame used on calculating the SA and the profile itself.
• Simple Moving Average (SMA) - With a moving average we will do a rolling average as thetime-frame moves. Using a selected time period (n), as time passes, we will add the new day,dropping the oldest day. This will allow us to follow the trend of the data variation.
SMAn+1 = SMAn −v0n
+ vn+1n
(4.4)
In order to calculate the SMA we must have in storage all the days the profile contains, in orderto allow swapping it out for the new values.
• Exponential Weight Moving Average (EWMA) - EWMA applies a weight to the moving averageby stating that the closer the historical day is to the present day the more importance (weight)it will have when calculating the volume profile. This is achieved by using formula 4.5. Selectingthe value of the α parameter will control the importance of the more recent values on thecalculation. An α with value of one, will place extreme importance on the present values, whilea value of zero will only use the past measures for the calculation. This allows us to follow atrend on the volume profile changes over time, placing importance in past or present values aswe see fit.
xk = αxk + (1− α)xk−1 (4.5)
The alpha value can be correlated with the stock variation and its choice will depend on theequity used. For a stable liquid stock a high value of alpha should be chosen, because thetrend will move slowly in each day. For an equity with quick variations and high volatility thatcreates subsequent trends, a lower value should be used. The value we use for alpha is 0.165(the result was obtained as described in annex A.2). One of the other advantages of EWMAcomes from the way of how it is calculated. There is no need to store all historical data toupdate the value (as opposed to the other two methods), we only need the previous calculatedprofile and the most recent previous day.
In order to test these methods, we divide our data-set in two parts, data that we use to construct themodel and data for testing. In case of SMA and EWMA the test data will also be contained in themodel, because of methods specifications. Using a time-span of one month (averaging 22 tradingdays), half a month (11 trading days) and five days we check which of the methods produce the bestevaluation metric.

CHAPTER 4. PROTOTYPE DEVELOPMENT 38
Model Chi-Squared (X2) Standard Deviation (σ) Variance(σ2)SA5 0.2539663 0.1794603 0.03220601SA11 0.2509637 0.2084890 0.04346765SA22 0.2565831 0.1850758 0.03425305SMA5 0.2308193 0.1696247 0.02877254SMA11 0.2257696 0.2028504 0.04114827SMA22 0.2254268 0.1893183 0.03584141EWMA5 0.2235382 0.1673634 0.02801052EWMA11 0.2131483 0.1794608 0.03220616EWMA22 0.2149000 0.1767366 0.03123581
Table 4.2: Chi-Squared evaluation results applied to the three mean methods for volume profilecalculation. The best result is presented in bold and bellongs to EWMA with 11 days.
4.3.5 Results
The results obtained (table 4.2) show that, for the GOOG stock, the best model used is the EWMA.As expected, the SA method has performance degradation over time and even taking a month ofdata the results are not better than five days. Recalculating the SA in order to improve performancewill transform it in a SMA with a time lag. The two best results are close to each other, but althoughthe EWMA 22 has a worse result than its 11 days counterpart, its standard deviation is lower, beingpossible to produce better results on the long run (as it happens also with the SMA). Because ofthe constraints we have on space and data availability, we implemented the eleven day option of theEWMA algorithm that gave us the best results. This will allow us to store less data and calculate theneeded value along the day, while incurring in only a small loss of accuracy.
4.3.6 Integration
The calculation of the volume profile is a key component of the system for the correct functioning ofthe VWAP algorithm and possesses some properties that will dictate how we implement it. Takinginto account the model chosen in the previous subsection, the EWMA 11 , we will have to applyconstraints that will guide some of the development decisions. After creation, the model must beupdated every day using the previous day information. We could use a lazy-evaluation logic and startbuilding the profile when it is needed, assuming we have the data to do so. This approach would bedetrimental to our application performance, mostly regarding the quality of service offered. Althoughthe calculations are not computationally expensive to run on the client side, to do so would introducea delay, causing problems in case of a tight schedule time for execution (in terms of seconds). A moreimportant impact would be felt in the QoS, as the previously calculation of the profile can add usefulinformation to the client at the moment of execution. For example, allowing the system to issue awarning in case of failure or insufficient data, not having the user to discover the error at the moment

CHAPTER 4. PROTOTYPE DEVELOPMENT 39
Figure 4.8: Description of the volume profile implementation. 1 - At the end of the trading period,intraday data is compiled and retrieved; 2 - The information is fed into the model and the volumeprofile is created and stored in the database; 3 - When an order is set for execution, the profile isretrieved; 4- Calculations are made to fit the profile in the current order time-span;
when he is counting for the feature to work, lot leaving time to plan accordingly. It is also possiblefor some stocks to not be used everyday with algorithms that require volume profile calculation. Thenext day, after a gap of this type, the update would fail, because previous updates were not madeand we will have to store more past information to handle this issue, invalidating the advantages ofusing the EWMA 11 model.
Considering the previous constraints and the server architecture described in subsection 4.1, weimplemented the solution that follows the path described in Figure 4.8. The model used (EWMA 11)consists of several simple calculations that are possible to execute by using of a relational databasescript6 as such we do not see a problem of allowing it to do so. Usually the working hours of theinvestment banking are limited for a set period of time. In our case, the venues of investment chosenare the European, North-African and American thus for a period of time the database will have noworkload, as all venues will be closed. Instead of adding more complexity to the algorithm enginewe opt for the separation of the volume profile data creation from the rest of the application logic.This way we do not need to add new machine infrastructure to execute the maintenance, we use thebuilt-in capabilities of the database to create the volume profile to be used for the next day, whilemaintaining relevant information, like the validity of the profile. Although we specify in the schemesand architecture a database detached from the rest of the system, this might not be ideal. Wemaintained the two separate because of our inability to use and access the proprietary SQL databasepresent in the Sifox Solution. In the future these two parts can be combined and resources conserved.If proved necessary though, this service can be detached and maintained as a middle-tier cache servicebetween the data tier and the logic tier.
Due to the fact that the period of execution is of 15 minutes, we restrict the time available forthe schedule in fixed periods of the same size. This control is advantageous since it allows us notto worry if the time periods of the volume profile fit the selected algorithm execution time-span,saving us the need to add complexity by performing more operations on the data. Furthermore these
6Assuming the script the database uses possesses similar capabilities to the mysql aggregator functions (SUM) andarithmetic operations.

CHAPTER 4. PROTOTYPE DEVELOPMENT 40
Figure 4.9: Entity-Relationship model for the volume profile database and related components.
operations would have to be executed at run time, adding to the problems described above. Wealso stop orders from entering the intervals at the middle. Making the periods static, we can simplypostpone orders to the next available interval. But that would induce the trader in possible error,because we would not know how exactly his orders were being dispached. We find that by forcing theindication of the available time, we provide more information and do not trick the trader.
For the prototype we used a SQLite database7 to achieve the described functionality. Usingit allow us to focus on the prototype creation instead of worrying excessively with infrastructure.SQLite has small code footprint, is self-contained and requires zero-configuration, while maintainingall the most important features we need from a relational database. This properties make it an idealcandidate to ship with the client of the application (as our prototype development structure suggests).
We create an entity-relationship model based on our problem specifications (Fig. 4.9) and applyit to the database. Because some equities exist in multiple exchanges with the same tickers they aredependent on the Exchange. The OpenTime and CloseTime are used to determine the time of equitytrading according to the exchange, however the equities are further subdivided in groups that cantrade in a special schedule inside or outside that of the Exchange. We do not take into considerationthose cases, but for further development they must be taken into consideration.
7http://www.sqlite.org/
CHAPTER 4. PROTOTYPE DEVELOPMENT 41
We had difficulty in obtaining intraday data with minute resolution (1 to 15 minutes) and had noaccess to the Sifox SQL database so, for testing purposes, we included the intraday data and filledit using the the Google API data (as described in section 4.3.1). We then write queries that canprocess the data and create the volume profile and code them in our Sifox Application. These queriescan also be run outside the application for creating and maintaining the volume profile. Finally ourapplication just needs to call for the profile using an internal API to access to the the database8. Wefirst check if the data field on the equity is in order, the time must be from the previous day and itspresence (not null) indicates the presence of the profile on the database. Not finding it, it throws anerror, stopping the algorithm from executing. The application receives the complete volume profileand adapts it to fit the required time-span chosen at the algorithm creation.
There is also the possibility of adding a cache system to the profile. Because of the tick size thetime for order submission is limited to sections of time, making the choice of schedule limited in size.We can reduce the burden of calculating the schedule on the database by using a cache for thosevalues, decreasing our execution time. In our case we decided not to deploy it, because we believethat the performance gain from its use on this case would be minimal and the extra infrastructurewould prove unnecessary. This would not be the case if we had the calculation on the server side,in that case the saving could be greater, provided that there were enough people using the systemand placing a number of order constantly. In that case, extra infrastructure should be created as acache-only memory.
8In previous versions this was done using the file system for storing the information as a file.

Chapter 5
Conclusion
We studied the financial market in order to obtain a better understanding of the problems assossiatedwith algorithmic trading. We then describe the general architecture of trading algorithms anddetail the most commonly used, impact-driven algorithms. We study some possible model for orderplacement execution, and explain a method for evaluating the performance of the algorithms. Finallywe implement the algorithms and integrate them on the Sifox application, developing and testing amodel for the VWAP, volume profile model construction.
5.1 Critical Discussion
We focused on the creation of the prototype and its implementation directly on the SifoxDealapplication. We did not account for the state the application was at. The lack of documentationregarding the SifoxDeal application became a time hindrance, and conforming to the currentimplementation proved to be a greater challenge. We discovered also that the heart of the system wasnot on the schedule generation as we were first led to believe, but on the order placement strategy,though this became apparent latter on. Regarding the execution strategy we lacked the data necessaryto apply the models and test them. The SifoxDeal testing environment, if receiving market data,would provide for a quick simulator, capable of testing the strategies in real time.
The data we have for test, analysis and model construction proved to be insufficient. The companyhad no access to any reliable data feed in situ. The data feed available to the application is providedby the client that buys the solution and unlucky for us, the company satellite feed was disrupted midJanuary due to a storm, preventing us the use to it. A closer look to the topics discussed in thisinternship report should be studied in more detail and tested with quality data.
42

CHAPTER 5. CONCLUSION 43
5.2 Future Work
We started this internship with the objective of creating a prototype system for automatic tradeexecution and, after we started investigating the problem, we discovered the many aspects that caninfluence the performance of the algorithm and its execution. Performance, measured by the returns,is the most important objective of these algorithms and they come from the correct use of strategiesat the correct time. In our opinion the order placement strategy is the core of a system of this type.Having a strong, reliable and consistent strategy system would allow an overall improvement onall algorithms, substantially raising the profile of the Sifox Solution to the market. More resourcesshould be spent at developing the order placement strategy and maintain a continuous investmentand monitoring, due not only to equities dynamic changes (more generally market conditions changes)but also to the application of new rules by the exchanges. With the use of real time and historicalquality market data, the use of dynamic models capable of harnessing the extra information would beenough to provide that increment and the option of developing models to function on higher steps ofthe architecture chain (section 3.2).
We learned that traders (and clients) like to have absolute control over the strategy they employ,efforts should be made to create a system that would allow for systematic trading. By empoweringthe trader with the means to create their own market strategy, while attributing to the Sifox algorithmcomponent the proper order execution, great value could be added to the solution. This only increasesour awareness to the importance of providing a robust order execution strategy. There is also the needto provide a report on the algorithm functioning. All the trades must be registered and informationon why the decision to place an certain order were made. This is of extreme importance because ofauditing, to justify the algorithm behavior to the client (as so he does not think it was a softwarefault, but a sequence of decisions made on the available facts), and to debug and develop better andmore precise algorithms.
Finally the application should be ported to the server infrastructure in order to get better supportand robustness. This will allow it to directly tap to all the resources available, improving performance,and truly achieve a complete product.

Bibliography
[1] The Atlantic Telegraph. Merchants’ Magazine & Commercial Review, pages 1–19, 1865.
[2] Stephen A Berkowitz, Dennis E Logue, and Eugene A Noser. The Total Cost of Transactions onthe NYSE. The Journal of Finance, XLIII(1), 1988.
[3] Brian Coyle. Debt & Equity Markets: Equity Finance. Financial World Publishing, 2002.
[4] Brian Coyle. Debt & Equity Markets: Overview of the Markets. Financial World Publishing,2002.
[5] NYSE EURONEXT. EURONEXT Order Types. https://www.euronext.com/trading/order-types.Accessed on March 2014.
[6] NYSE EURONEXT. NYSE EURONEXT - Technology Timeline.http://www.nyse.com/about/history/timeline_technology.html. Accessed on March 2014.
[7] Adam Feldman. Spring cleaning for some of our APIs, 2011.http://googlecode.blogspot.pt/2011/05/spring-cleaning-for-some-of-our-apis.html. Accessed onApril 2014.
[8] Finantech. Finantech Webpage, 2014. http://www.finantech.pt/. Accessed on March 2014.
[9] Sami Franssila, Charles Leiserson, Ronald Rivest, and Clifford Stein. Introduction to Algorithms.The MIT Press, Cambridge, Massachusetts, third edition, November 2009.
[10] Puneet Handa and Robert Schwartz. Limit Order Trading. Journal of Finance, 51(5):1835–1861,1996.
[11] Lawrence Harris. Optimal Dynamic Order Submission Strategies In Some Stylized TradingProblems. Financial markets, institutions & instruments, 7, 1998.
[12] Joel Hasbrouck. Empirical Market Microstructure: The Institutions, Economics, and Econometricsof Securities Trading. page Chapter 2. Oxford University Press, 2006.
[13] Barry Johnson. Algorithmic Trading & DMA: An introduction to direct access trading strategies.4Myeloma Press, London, first edition, 2010.
44

BIBLIOGRAPHY 45
[14] Robert Kissel and Morton Glantz. Optimal Trading Strategies: Quantitative Approaches forManaging Market Impact and Trading Risk. Amacom, 2003.
[15] Andrew W Lo and A Craig Mackinlay. A Non-Random Walk Down Wall Street. PrincetonUniversty Press, 1999.
[16] Christopher Matthews. How Does One Fake Tweet Cause a Stock Market Crash?, 2013.http://business.time.com/2013/04/24/how-does-one-fake-tweet-cause-a-stock-market-crash/ .Accessed on June 2014.
[17] Tom Middleton. Understanding how algorithms work. Where does time slicing and smart orderrouting end and randomising your orders through complex algorithms begin? Algorithmic trading,a buy-side handbook., pages 21–27, 2005.
[18] NASDAQ. NASDAQ REFERENCE GUIDE - Order Types and Routing Strategies. 2014.
[19] Y. Nevmyvaka, M. Kearns, a. Papandreou, and K. Sycara. Electronic Trading in Order-DrivenMarkets: Efficient Execution. Seventh IEEE International Conference on E-Commerce Technology(CEC’05), pages 190–197.
[20] Yuriy Nevmyvaka, Yi Feng, and Michael Kearns. Reinforcement learning for optimized tradeexecution. Proceedings of the 23rd international conference on Machine learning - ICML ’06,pages 673–680, 2006.
[21] NIST/SEMANTECH. e-Handbook of Statistical Methods. 2014.http://www.itl.nist.gov/div898/handbook/. Accessed on March 2014.
[22] Giuseppe Nuti, Mahnoosh Mirghaemi, and Philip Treleaven. Algorithmic Trading. IEEECOMPUTER, 44(11):61–69, 2011.
[23] Brian O’Connell. Can Tweets And Facebook Posts Predict Stock Behavior?,2014. http://www.investopedia.com/articles/markets/031814/can-tweets-and-facebook-posts-predict-stock-behavior-and-rt-if-you-think-so.asp. Accessed on June 2014.
[24] Carol L. Osler. Stop-loss orders and price cascades in currency markets. Journal of InternationalMoney and Finance, 24(2):219–241, March 2005.
[25] Sneha Padiyath. High-tech algo trades pick up, 2014. http://www.business-standard.com/article/markets/high-tech-algo-trades-pick-up-114061001132_1.html. Accessedon June 2014.
[26] Robert Pardo. The Evaluation and and Optimization of Trading Strategies. WILEY, secondedition, 2008.

BIBLIOGRAPHY 46
[27] William L. Silber and Kenneth D. Garbade. Technology, communication and the performance offinancial markets: 1840-1975. The Journal of Finance, XXXIII(3):819–833, 1978.
[28] George J. Stigler. The Economics of Information. The journal of political economy, LXIX(3):213– 225, 1961.
[29] Jiaqi Wang and Chengqi Zhang. Dynamic Focus Strategies for Electronic Trade Execution inLimit Order Markets. 2006.
[30] Jian Yang and Brett Jiu. Algorithm Selection: A Quantitative Approach. Institutional InvestorJournals, 1:26–34, 2006.
[31] Chaiyakorn Yingsaeree. Algorithmic Trading : Model of Execution Probability and OrderPlacement Strategy. PhD thesis, University College of London, 2012.

Appendix A
Appendix
A.1 Acronyms
API Application Programing Interface
CSV Comma Separated Value
EWMA Exponentially Weighed Moving Average
FAK Fill And Kill
FOK Fill Or Kill
GTC Good Til Canceled
ICE Intercontinental Exchange
IDE Integrated Development Environment
IOC Immediate Or Cancel
ICE Intercontinental Exchange
IPO Initial Public Offering
MSE Mean Squared Error
NASDAQ OMX National Association of Securi-ties Dealer Automated Quotation Options-mäklarna Exchange
NYSE New York Stock Exchange
POV Percentage Over Volume
QoS Quality of Service
SA Simple Average
SMA Simple Moving Average
SSE Sum of the Square Error
TWAP Time Weighed Average Price
VWAP Volume Weighed Average Price
WPF Windows Presentation Foundation
47

APPENDIX A. APPENDIX 48
A.2 Alpha calculation for EWMA
As described in section 4.3, the value of alpha on the EWMA formula is related to the characteristicsof the equity used. In order to proceed with our implementation of the VWAP algorithm we didn’tfocus on discovering which parameters influence this value but instead used a trial-and-error approach.Using the data-set for the model calculation as our sample (in order of not to data-fit to the rest ofour sample) we try to find an alpha value that will have the lowest MSE (mean squared error)[21]. Inorder to achieve this purpose we will progressively test the values of alpha, beginning in the range of1 to 0 with 0.1 increments, and select one with the lowest SSE (sum of the square error), then wewill test for α±∆ increasing the resolution to the required decimal places1. MSE is the sum of thesquare error (SSE) mean, we calculate this value from our data-set (D) by iteratively calculate theEWMA of the previous values and compare them with the current .
SSE =D∑
i=2(yi − ewma(yi−1, α))2 (A.1)
MSE = SSE
#D (A.2)
We apply the method to the time-frame comprising 22 and 11 days to calculate the value of alphato up 3 decimal places (table A.1). We obtain for 22 days an alpha value of 0.148 and for 11 days0.183 we opted to use the mean of this two values 0.165, as both days will be used to calculate thevolume profile and a close enough value of alpha capable of fitting both of them is essential. TheGOOG stock is know to have a stable traded volume, so a lower value of alpha is consistent with thedescription.
A.3 Priority Queue Implementation
In order to add time constraints to the algorithms we implement a priority queue. A priority queue[9] will maintain a set of elements ordered by a key, in this particular problem the key is a datetime object. We will associate to the key the corresponding algorithm instance. When getting thestart time, we start the algorithm execution, the equivalent is made for the stop queue. We use apriority queue because of the need to alter and add values with a priority fashion. We will be usinga minimum binary heap. A binary heap is a data structure that can be represented as a tree thatsatisfies the following properties:
• The tree is completely filled in all levels except the last, which can be partially filled.
1Alternatively we if the calculation is not computationally expensive, search all the range of values.

APPENDIX A. APPENDIX 49
Alpha MSE (22 days) MSE (11 days)0 0.0005323462 0.00062080160.1 0.0003987647 0.00052499540.2 0.0003968432 0.00051187190.3 0.0004144375 0.00052435550.4 0.0004378793 0.00054620360.5 0.0004648764 0.00057298430.6 0.0004957227 0.00060419320.7 0.0005316607 0.00064082960.8 0.0005744062 0.00068449270.9 0.0006260465 0.00073706411 0.0006891653 0.0008007120
(a)
Alpha MSE (22 days) MSE (11 days)0.10 0.0003987647 0.00052499540.11 0.0003964730 0.00052149240.12 0.0003948892 0.00051863540.13 0.0003938878 0.00051635140.14 0.0003933691 0.00051457620.15 0.0003932533 0.00051325330.16 0.0003934760 0.00051233280.17 0.0003939852 0.00051177090.18 0.0003947383 0.00051152890.19 0.0003957006 0.00051157260.20 0.0003968432 0.0005118719
Alpha MSE (22 days) MSE (11 days)0.20 0.0003968432 0.00051187190.21 0.0003981424 0.00051240020.22 0.0003995781 0.00051313410.23 0.0004011338 0.00051405280.24 0.0004027954 0.00051513790.25 0.0004045511 0.00051637320.26 0.0004063908 0.00051774440.27 0.0004083061 0.00051923870.28 0.0004102895 0.00052084510.29 0.0004123351 0.00052255360.30 0.0004144375 0.0005243555
(b)
Alpha MSE (22 days)0.140 0.00039336910.141 0.00039334060.142 0.00039331600.143 0.00039329530.144 0.00039327830.145 0.00039326520.146 0.00039325570.147 0.00039324980.148 0.00039324750.149 0.00039324870.150 0.0003932533
Alpha MSE (22 days)0.150 0.00039325330.151 0.00039326130.152 0.00039327260.153 0.00039328710.154 0.00039330490.155 0.00039332580.156 0.00039334990.157 0.00039337690.158 0.00039340700.159 0.00039344010.160 0.0003934760
Alpha MSE (11 days)0.170 0.00051177090.171 0.00051173290.172 0.00051169810.173 0.00051166630.174 0.00051163770.175 0.00051161210.176 0.00051158960.177 0.00051157000.178 0.00051155340.179 0.00051153970.180 0.0005115289
Alpha MSE (11 days)0.180 0.00051152890.181 0.00051152090.182 0.00051151580.183 0.00051151340.184 0.00051151380.185 0.00051151700.186 0.00051152280.187 0.00051153130.188 0.00051154250.189 0.00051155620.190 0.0005115726
(c)
Table A.1: Alpha value calculation. Results of the alpha value calculation process applied to 22and 11 trading day data. The best values are shown in boldl. a) alpha range between 0 and 1. b)Calculations for α±∆ with alpha being the best obtained value and ∆ = 0.1 . c) Calculations forα±∆ with ∆ = 0.01.
APPENDIX A. APPENDIX 50
• The nodes must follow a heap property. In case of a minimum heap a node is parent to another,that implies that the fist one is ordered in respect to the other, being the first key lower orequal then the child. The up-most root is the global minimum.
A.4 Predicting the future using Time Series analysis
In order to apply our order placement strategy we need to have information of how the market willbehave in the next instant. The more accurate our prediction is, better will be the performance of ourmodel, provided that the model assumptions are correct. At the extreme, when given a market state,if we know exactly the next state we can act in order to maximize our price, that is, minimize ourtrading cost, and we would be millionaires for certain. Sadly, in our case, we are not able to forecastthe market reaction with an accuracy of 100%, but a small glimpse is better than going in completelyblind. For analysis methods to work and be useful we first must ask if it is possible to predict themarket future.
Two hypothesis oppose the notion that the market follow predictable patterns, the Random WalkHypothesis and Efficient-Information Market. The former states that the market prices change in arandom walk pattern and therefore cannot be predicted, this notion is consistent with the latter. Thelatter states that the market is efficient and thus price changes reflects all the available information.If there are no inefficiencies there is no way to beat the market therefore making the use of ourpredictions void, the information we learned in the prediction is already reflected on the price and soit is of no use to us. The Random Walk Hypothesis has been refuted, there is the general consensusthat the market has some patterns and follows trends, and its prediction is possible to some extent[15].The Efficient-Information Market hypothesis on the other hand has seamed difficult to prove, ordisprove and some argue that the market can never be efficient, for example, traders that act onnoise information and others that need liquidity will cause inefficiencies in the market. Although weignore the effect of the efficient market in our prediction perspective it is interesting to notice how ithas been influenced by the evolving information technology. In fact, a study from [15] observed thatrecent market data was closer to the Random Walk hypothesis than the older. In our opinion, thisis the effect of the information technology in the market. As it previously had happened with thetrans-Atlantic cable the new information technology increases the market efficiency, the disparity ofprices is reduced the cost of doing businessmen goes down but still, in the present time, there areinefficiencies that still prevail.
In order to do the forecast we will apply time series analysis. A time series is an ordered sequenceof values sampled at spaced time intervals. By using analysis tools on this time ordered data, a modelcan be created with the ability of predicting trends.