design and development of instrumentation systems to...
TRANSCRIPT
CHAPTER TWO
Estimation of Dry Rubber Content in Natural
Rubber Latex by FTIR Spectroscopy and TGA
Techniques
In this chapter we present the work done on the estimation of DRe in
rubber latex using two analytical techniques viz. Fourier Transform Infrared
Spectroscopy (FTIR) and Thermo Gravimetric Analysis (TGA) techniques.
Details of the experimental methods and the results obtained are presented in
the following sections
2.1: Fourier Transform Infrared Spectroscopy
2.1.1: Introduction
In the mid-infrared (MlR) range, the region in which FTIR typically
operates, all organic compounds interact with infrared radiation, yielding
compound specific absorption characteristics whose intensity follows the
Beer's law'. The MlR range extending from wave number 4000 crn' to 400
cm-1 provide direct information concerning the specific constituents in the
sample, as well as their characteristic molecular structure/ and chemical
composition" .. In the region of wave numbers between 4,000 crn' and 1,500
cm', in general, there is absorption by various stretching modes of functional
33

groups of molecules, and the region below 1,500 crn' is significant for
deformation, bending, and ring vibrations and is frequently referred to as the
fingerprint region of the spectrum'.
Fourier transform infrared (FT-IR) spectroscopy can effectively provide
chemical information about the structure and composition of biological
materials at the molecular level, expanding the applications of vibrational
spectroscopy?". This noninvasive, convenient, and rapid technique has been
applied to the study of various types of healthy and malignant tissues and is a
powerful tool in investigating the biochemistry of cancer 1015 The technique
also has promising potential for detecting cancer at an early stage. FTIR
spectroscopy has been successfully used to diagnose multiple kinds of
carcinoma, such as stomach, colon, liver, esophagus, lung, gall bladder,
breast, and parotid gland ' 6.2e
Originally introduced by Naumann and co-workers'P'", FTIR
spectroscopy is a fast technique for classification and identification of
mrcroorcanrsms":". Moreover, it is a valuable tool for rapid screening of
environmental isolates". FTIR is a very cost-efficient technique which allows a
rapid and simple identification of micro-orqanisms'" in several situations.
2,1.2: Principle ofthe method
In a FTIR instrument, the monochromator and the slits in a conventional
instrument are replaced by an interferometer, usually of Michelson type. In the
interferometer (Fig. 2.1), a beam of IR radiation is divided into two by means
of a beam splitter A path difference between the beams is introduced
34
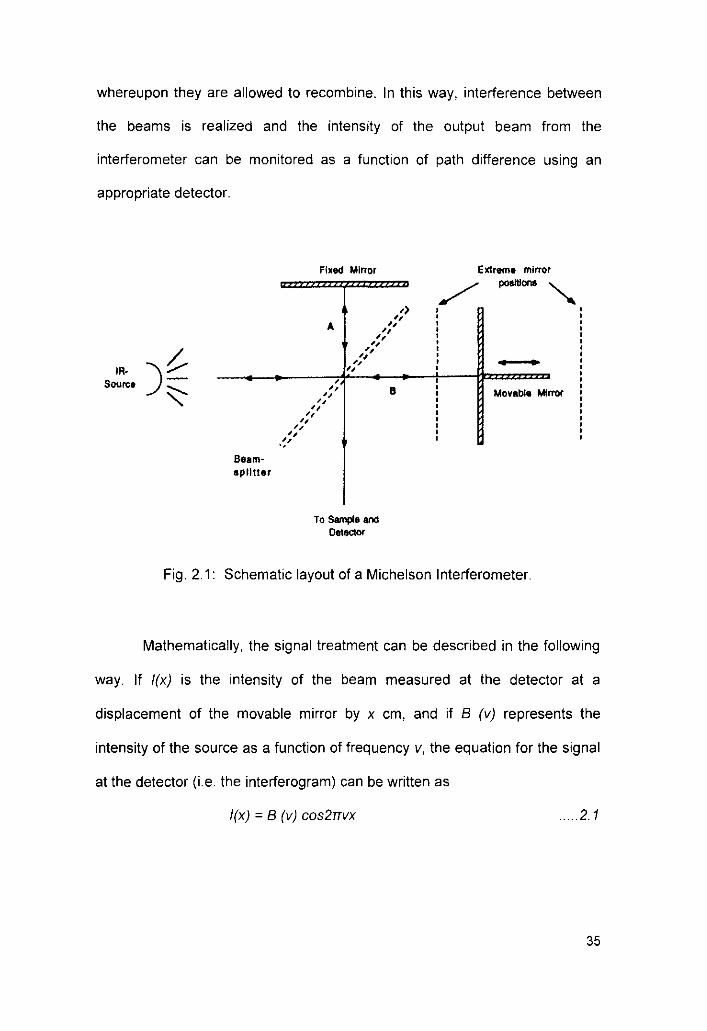
whereupon they are allowed to recombine. In this way, interference between
the beams is realized and the intensity of the output beam from the
interferometer can be monitored as a function of path difference using an
appropriate detector.
Fixed Mirror
IR$OUrte
Beamsplitter
A
,""""""""""
,)"""""""""
B
extreme mirror
/ pooltlono "...
• •Movable Mirror
To SampleendDetector
Fig. 2.1: Schematic layout of a Michelson Interferometer.
Mathematically, the signal treatment can be described in the following
way. If /(x) is the intensity of the beam measured at the detector at a
displacement of the movable mirror by x cm, and if B (v) represents the
intensity of the source as a function of frequency v, the equation for the signal
at the detector (i.e. the interferogram) can be written as
I(x) = B (v) COS2TTVX .....2.1
35

For a dichromatic source (with frequencies v, and V2), the signal at the
detector is the sum of two cosine waves given by
I(x) = B (v,) COS2TTV,X + B (v) COS2TTV2X .... 2.2
For a polychromatic source, as in a real instrument, the detector output, which
is the interferogram, is related to the spectrum by
+00
[(x) ~ 1 rr i B (v ) cos 2rrvxdv2 -00
The spectrum is related to the interferogram by the following relation,
+00
B (v ) = [(x) icos 2rrvxdx
.... 2.3
.... 2.4
Equations 2.3 and 2.4 relate an interferogram signal to an infrared single
beam spectrum through Fourier transformation
2.1.3: Experimental procedure
The analysis of latex samples have been carried out using a Thermo
Nicolet Make Avatar 370 FTIR Spectrometer. The quality and reproducibility
of the results are ensured through automatic system and accessory
recognition. The heart of the instrument is an Enhanced Synchronization
Protocol (ESP) technology which brings integration and intelligence in every
measurement. Despite its compact size, the instrument offers a full size
sample compartment which holds a wide range of accessories required for
sample analysis. The system accessory modules of the system provide an
unprecedented level of communication with the Nicolet system. Unique
36
features of the spectrophotometer include permanent alignment of optics for
better performance, rugged and enclosed design for optics, automatic
recognition for optics and diagnostic checks to ensure optimal performance
and check for human errors. Other features of the instrument include quick
equilibrium time when an accessory is changed, multimedia tutorials help to
use maximum potential, spectral quality checks and suggest improvements for
quality FTIR results. The system is loaded with Val Q spectrometer validation
package based on the ASTM Standard for FTIR to verify systems
performance in compliance with ISO and GLP criteria. The system hardware
consists of a base plate, diamond tuned, pinned in place mirrors, pinned and
pre aligned Ever Glo Source for easy replacement, interferometer with drive
and DSP control, reference He- Ne laser and DTGS detector for signal
detection etc. Entire function of the spectrophotometer is controlled using the
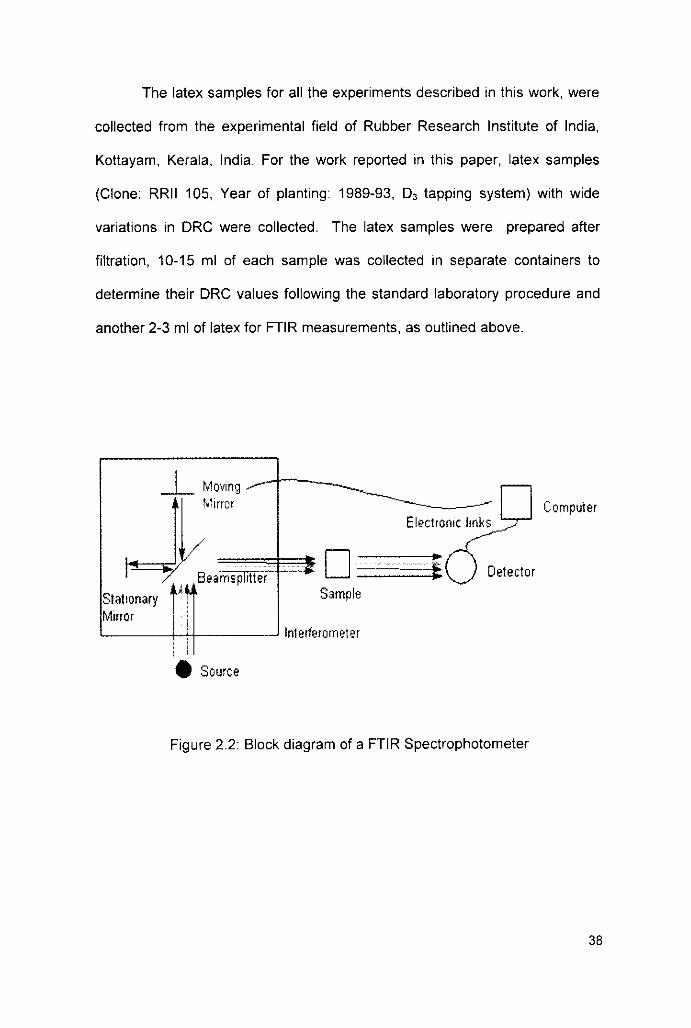
OMMC software loaded in a stand alone computer. The block diagram of the
FTIR instrumentation system is shown in Figure 2.2 and a photograph of the
FTIR spectrophotometer is shown in Fig 2.3.
The FTIR spectrum of the latex samples from 2500 crn' to 500 cm-' is
obtained using Attenuated total reflectance (ATR) technique in the
transmission mode. Latex sample of volume 2-3 ml spread over a ZnSe
crystal is allowed to homogeneously distribute the sample over the crystal.
The ATR assembly is loaded in to the instrument and the background
spectrum is recorded. The spectrum is reordered for several latex samples.
37
The latex samples for all the experiments described in this work, were
collected from the experimental field of Rubber Research Institute of India,
Kotlayam, Kerala, India. For the work reported in this paper, latex samples
(Clone: RRII 105, Year of planting: 1989-93, 0 3 tapping system) with wide
variations in ORC were collected. The latex samples were prepared after
filtration, 10-15 ml of each sample was collected in separate containers to
determine their ORC values following the standard laboratory procedure and
another 2-3 ml of latex for FTIR measurements, as outlined above.
J-.- MovingJ Mi<m'
V 0• Beamsplitter
Stationary,
Sample
MirrorInlerterometer
I
--------------Electronic links
Detector
Computer
• Source
Figure 2.2: Block diagram of a FTIR Spectrophotometer
38

Figure 2.3: Photograph of FTIR Spectrophotometer
2.1.4: Results and Discussion
Figure 2.4 shows the FTIR absorption spectrum of one sample of
natural rubber latex. We can notice a distinct absorption around 835 ern:' .
which can be interpreted as due to the absorption by solid rubber (isoprene)
molecules. The absorption at 1375 ern" is due the carbohydrate molecules
present in the latex. Such spectra have been recorded for a number of
different latex samples. The IR absorption spectra for two representative
samples between 1DaDem" and 650 cm" are shown in Figures 2.5 and 2.6.
39
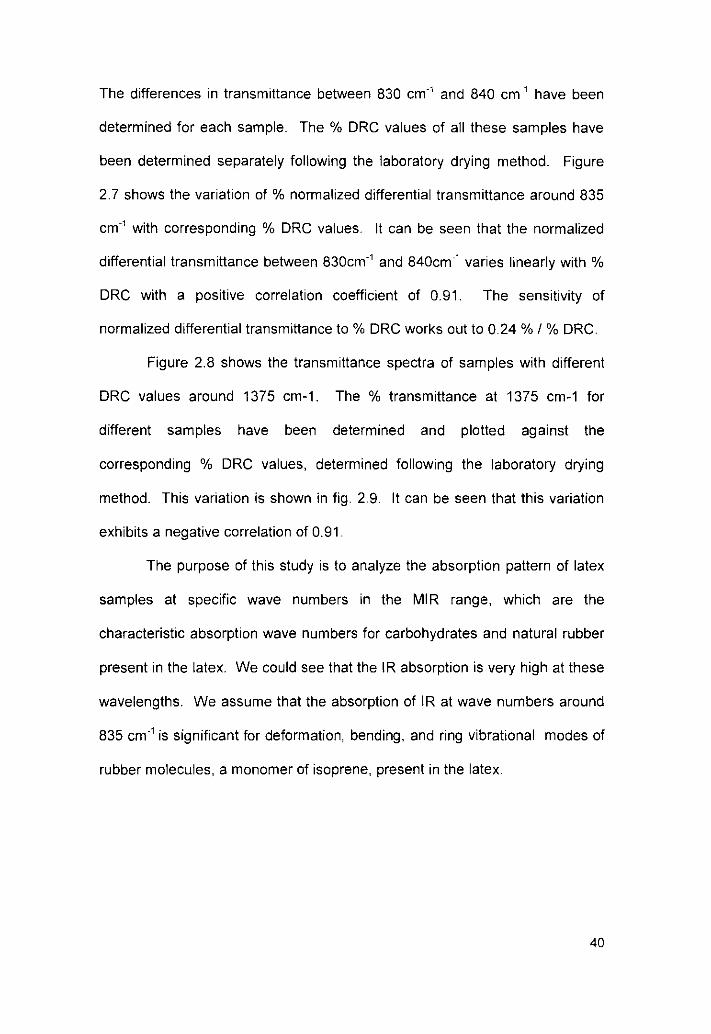
The differences in transmittance between 830 ern" and 840 cm ' have been
determined for each sample. The % ORC values of all these samples have
been determined separately following the laboratory drying method. Figure
2.7 shows the variation of % normalized differential transmittance around 835
cm:' with corresponding % ORC values. It can be seen that the normalized
differential transmittance between 830cm-1 and 840cm-1 varies linearly with %
ORC with a positive correlation coefficient of 0.91. The sensitivity of
normalized differential transmittance to % ORC works out to 0.24 % / % ORC.
Figure 2.8 shows the transmittance spectra of samples with different
ORC values around 1375 cm-1. The % transmittance at 1375 cm-1 for
different samples have been determined and plotted against the
corresponding % ORC values, determined following the laboratory drying
method. This variation is shown in fig. 2.9. It can be seen that this variation
exhibits a negative correlation of 0.91.
The purpose of this study is to analyze the absorption pattern of latex
samples at specific wave numbers in the MIR range, which are the
characteristic absorption wave numbers for carbohydrates and natural rubber
present in the latex. We could see that the IR absorption is very high at these
wavelengths. We assume that the absorption of IR at wave numbers around
835 cm' is significant for deformation, bending, and ring vibrational modes of
rubber molecules, a monomer of isoprene, present in the latex.
40

Figure 2.4: FTIR absorption spectrum of one sample of natural rubber latex.
100 -\
80
~
;$?0~
Cl) 60oc 'IfroEEtn
40cro~
II-I
20 ~
500100015002000250030003500o+----r----r-,--,----.--,-----,-,----.-----,---r-r---r--,
4000
Wave nuni:ler an"1
41
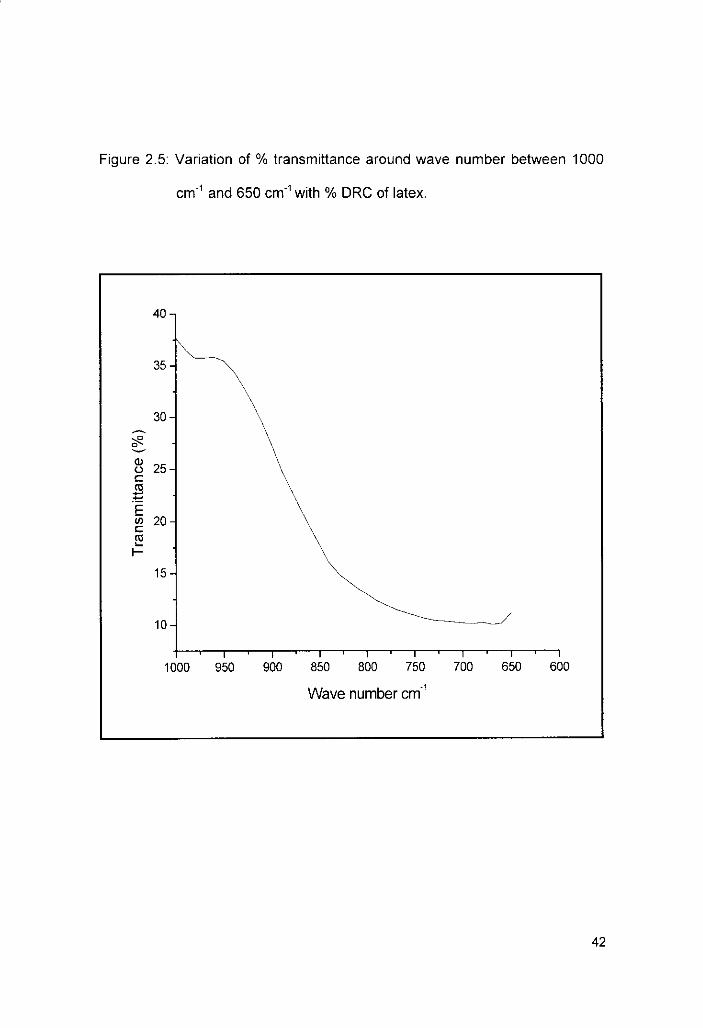
Figure 2.5: Variation of % transmittance around wave number between 1000
crn' and 650 ern" with % ORe of latex.
40
35
30~
;oR0~
Q)25o
c:<Il-""EIII 20c:<Il~
t-
15
10
1000 950 900 850 800 750 700 650 600
Wave number ern"
42
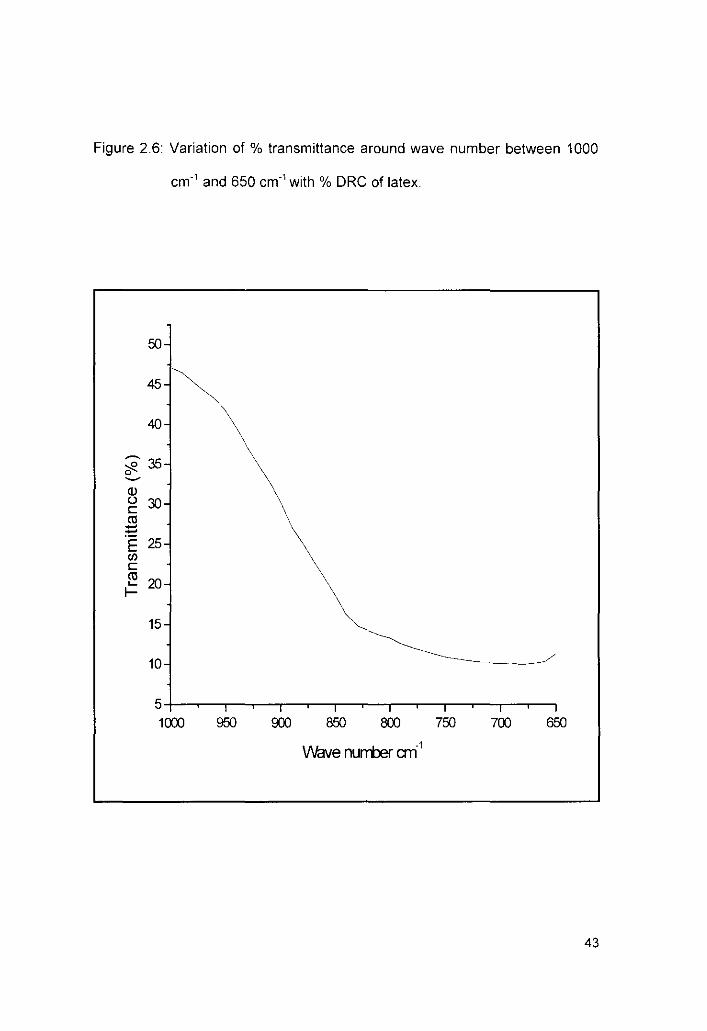
Figure 2.6: Variation of % transmittance around wave number between 1000
cm' and 650 crn' with % DRe of latex
50
45
40
~350~
(J)o 30cell-~E 25encell
20...I-
15
10
51000 950 000 850 800 750 700 650
\lllcNe nuni:ler cm'
43

Figure 2.7: Variation of %normalized differential transmittance around wave
number 835 ern" with % DRC of latex.
~27
~ !0~
d! R2 =0.910 26c
~(lJ......E 25 !(f)c(lJI-
I-ro 24+:cl-
d!:;: 23(5"Cd!(f) 22
"iiiEI-
0 21z25 30 35 40 45
Dry Rubber Content (%)
44
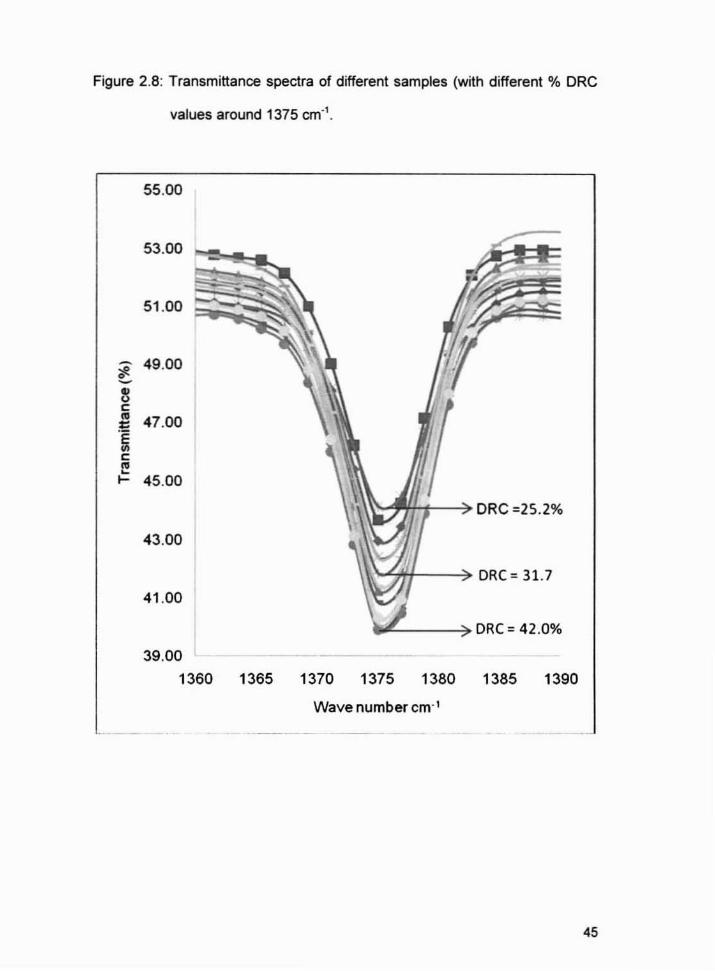
Figure 2.8: Transmittance spectra of different samples (with different % ORe
values around 1375 cm" .
55.00
53.00
51.00
49 .00If.-8eJ:! 47.00.~
c:l!.... 45 .00
43 .00
41 .00
,W,"",,'fht--7 ORe =25.2%
11,".-<,\'1-- --;;. ORC =31.7
...,'--- - .;> ORC=42 .0%
39 .00 ~ --
1360 1365 1370 1375 1380
Wave numbercm"
1385 1390
45

Figure 2.9: Variation of % transmittance at wave number 1375 cm" with %
ORe of latex.
~ RI =0.918:.?0
"'" 43IV0cI'll 42....'.:Ef/I
~l: 41ro'-f-
f ~,t40
3920 25 30 35 40 45
Dry Rubber Content (%)
46

2.1.5: Conclusions
The analysis of IR spectra of natural rubber latex using FTIR
spectroscopy in the MlR range has established a direct relation between the
normalized differential transmittance at specific wavelengths with the ORC
values of the natural rubber latex following laboratory drying method. It is
found that the IR absorption at specific wavelengths is due the molecular
vibrations of carbohydrates and natural rubber present in natural rubber latex.
Though we have established a direct relation between IR transmittance at
specific wave numbers 835 crn' and 1375 cm' and ORC, we have not
studied the IR absorption of non rubber constituents such as lutoids, proteins,
lipids and inorganic salts. We assume that the effect of these on the
measurements at 835 cm' and 1375 cm-1 is not significant as their
characteristic IR absorptions are at different wave numbers of the IR
spectrum. Further, we have not studied the effect of anticoagulants and
adulterants in latex samples on IR reflectance. We think that the information
provided by the present investigations would be useful for quick quantification
of dry rubber content in natural rubber latex. In this work we have been able
to show that FTIR spectroscopy can be developed in to an accurate technique
for the estimation of the ORC of rubber latex, though it does not overcome
other limitations such as being expensive and requiring skilled personnel for
measurement.
The information collected from the study will be useful in designing a
practical ORC measurement system with suitable IR sources and detectors.
47
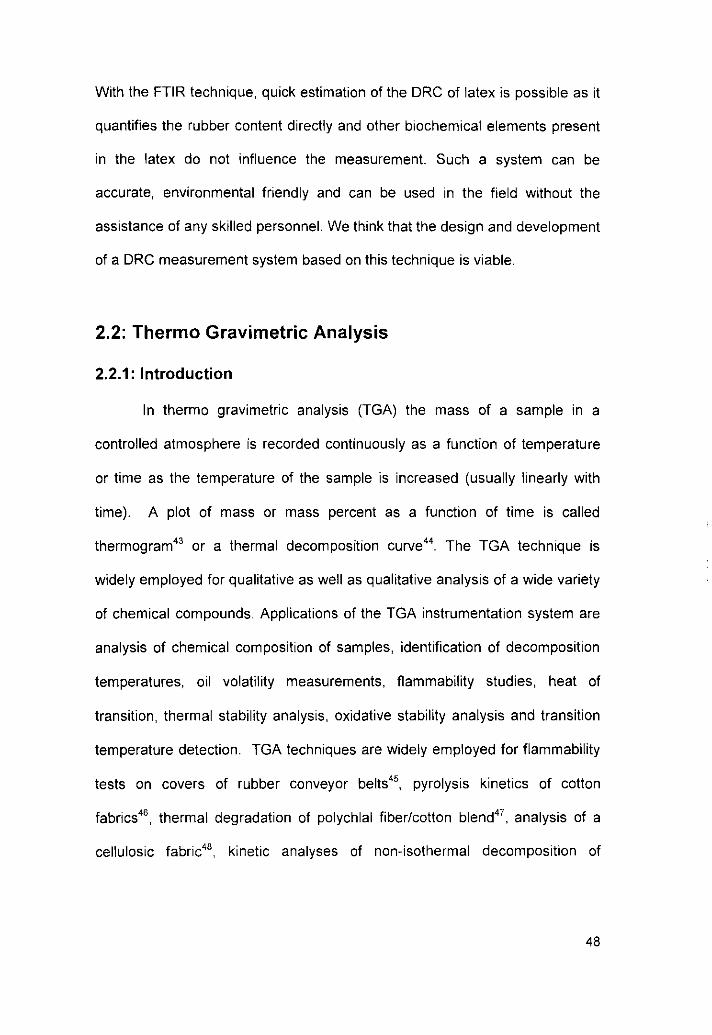
With the FTIR technique, quick estimation of the DRC of latex is possible as it
quantifies the rubber content directly and other biochemical elements present
in the latex do not influence the measurement. Such a system can be
accurate, environmental friendly and can be used in the field without the
assistance of any skilled personnel. We think that the design and development
of a DRC measurement system based on this technique is viable.
2.2: Thermo Gravimetric Analysis
2.2.1: Introduction
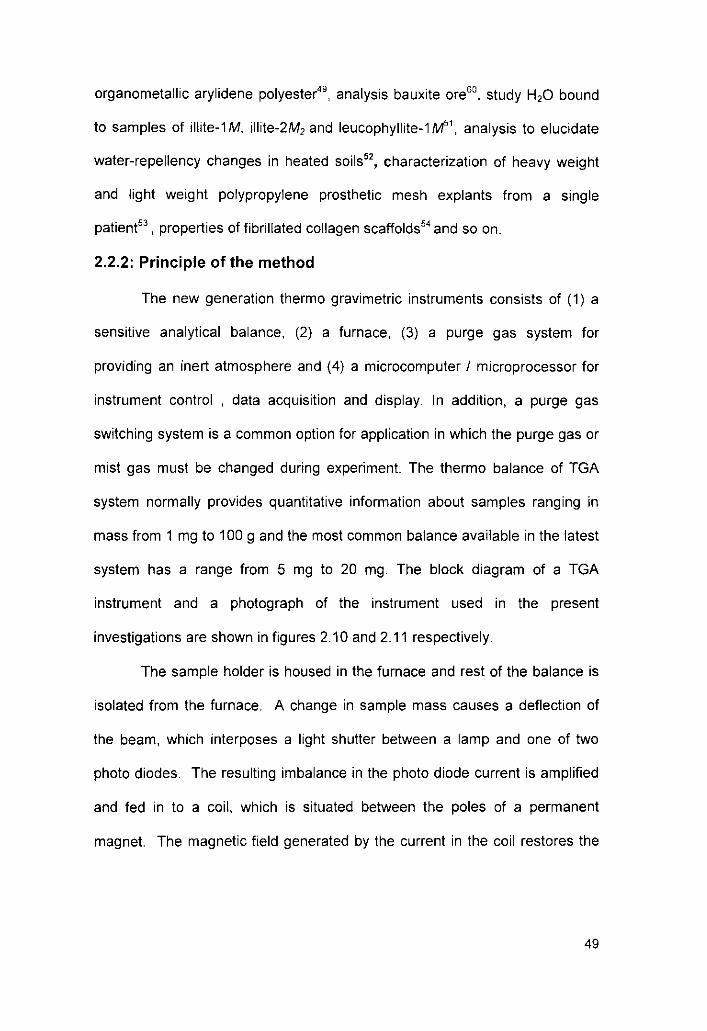
In thermo gravimetric analysis (TGA) the mass of a sample in a
controlled atmosphere is recorded continuously as a function of temperature
or time as the temperature of the sample is increased (usually linearly with
time). A plot of mass or mass percent as a function of time is called
thermoqram" or a thermal decomposition curve". The TGA technique is
widely employed for qualitative as well as qualitative analysis of a wide variety
of chemical compounds. Applications of the TGA instrumentation system are
analysis of chemical composition of samples, identification of decomposition
temperatures, oil volatility measurements, flammability studies, heat of
transition, thermal stability analysis, oxidative stability analysis and transition
temperature detection. TGA techniques are widely employed for flammability
tests on covers of rubber conveyor belts", pyrolysis kinetics of cotton
fabrics", thermal degradation of polychlal fiber/cotton blend", analysis of a
cellulosic fabric'", kinetic analyses of non-isothermal decomposition of
48
organometallic arylidene polyester", analysis bauxite ore", study H,O bound
to samples of illite-1 M, illite-2M, and leucophyllite-1 M''', analysis to elucidate
water-repellency changes in heated soils", characterization of heavy weight
and light weight polypropylene prosthetic mesh explants from a single
patient'" , properties of fibrillated collagen scaffolds'" and so on.
2.2.2: Principle of the method
The new generation thermo gravimetric instruments consists of (1) a
sensitive analytical balance, (2) a furnace, (3) a purge gas system for
providing an inert atmosphere and (4) a microcomputer I microprocessor for
instrument control , data acquisition and display. In addition, a purge gas
switching system is a common option for application in which the purge gas or
mist gas must be changed during experiment. The thermo balance of TGA
system normally provides quantitative information about samples ranging in
mass from 1 mg to 100 g and the most common balance available in the latest
system has a range from 5 mg to 20 mg. The block diagram of a TGA
instrument and a photograph of the instrument used in the present
investigations are shown in figures 2.10 and 2.11 respectively.
The sample holder is housed in the furnace and rest of the balance is
isolated from the furnace. A change in sample mass causes a deflection of
the beam, which interposes a light shutter between a lamp and one of two
photo diodes. The resulting imbalance in the photo diode current is amplified
and fed in to a coil, which is situated between the poles of a permanent
magnet. The magnetic field generated by the current in the coil restores the
49


New generation system employs a dedicated computer for instrument
control and data processing. The furnace of a TGA system operates within a
temperature range typically from ambient to 1500oC. The rate of cooling or
heating of furnaces can be from somewhat greater than zero up to
200°C/minute. Inert gases such as nitrogen or argon can be used in these
furnaces to prevent oxidation of samples.
2.2.3: Experimental procedure
In this work, we have used a Perkin Elmer Diamond TGIDTA to carry
out thermo gravimetric analysis of different sets of latex samples. The
temperature of the instrument is calibrated with ready for use lead or tin pills.
The temperature range of this instrument is from ambient to 1500oC. After the
calibration one aluminum pan is placed on the sample pan of the
microbalance kept in the furnace of the instrument. The weight difference
between sample pan and the reference pan is nullified. Fresh natural rubber
latex samples collected directly from the field are used for the TGA analysis.
Each latex sample of weight 5-10 mg is placed directly in the aluminum pan
after filtration. The sample is heated from 30°C to 170°C at a heating rate of
10°C/minute under standard laboratory conditions. The thermograms of 12
different latex samples collected from 12 different trees have been recorded.
The weight loss in each case is determined and plotted against temperature.
The latex samples for all the experiments described in this work
have been collected from the experimental field of Rubber Research Institute
51
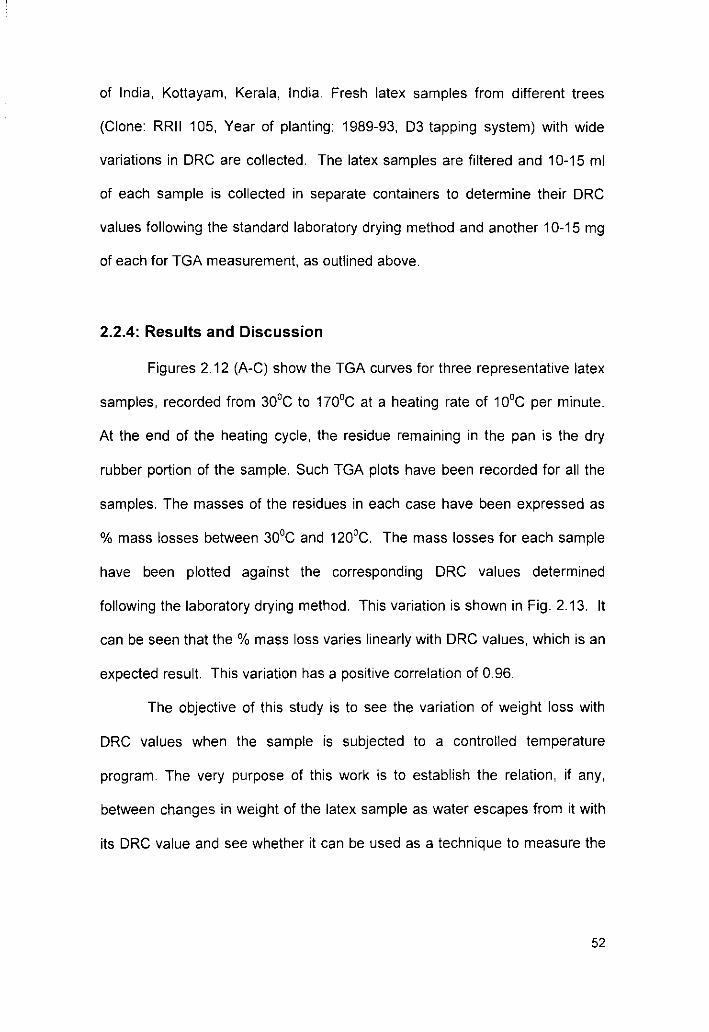
of India, Kottayam, Kerala, India. Fresh latex samples from different trees
(Clone: RRII 105, Year of planting: 1989-93, 03 tapping system) with wide
variations in ORC are collected. The latex samples are filtered and 10-15 ml
of each sample is collected in separate containers to determine their ORC
values following the standard laboratory drying method and another 10-15 mg
of each for TGA measurement, as outlined above.
2.2.4: Results and Discussion
Figures 2.12 (A-C) show the TGA curves for three representative latex
samples, recorded from 30°C to 170°C at a heating rate of 10°C per minute.
At the end of the heating cycle, the residue remaining in the pan is the dry
rubber portion of the sample. Such TGA plots have been recorded for all the
samples. The masses of the residues in each case have been expressed as
% mass losses between 30°C and 120°C. The mass losses for each sample
have been plotted against the corresponding ORC values determined
following the laboratory drying method. This variation is shown in Fig. 2.13. It
can be seen that the % mass loss varies linearly with ORC values, which is an
expected result. This variation has a positive correlation of 0.96.
The objective of this study is to see the variation of weight loss with
ORC values when the sample is subjected to a controlled temperature
program. The very purpose of this work is to establish the relation, if any,
between changes in weight of the latex sample as water escapes from it with
its ORC value and see whether it can be used as a technique to measure the
52

DRC values of unknown samples. We could establish a good correlation
between DRC values and the % weight loss values.
Figure 2.12: Thermograms of three representative samples (A-C)
Fig. 2. 12 (A)
---_::-.~-------------
1031
". -,~ .._.._._-
se
, se
l70•I
eo
so
"------
31,~.
30,81 " so eo
Deltti Y '"(;5,035%
100 120T.n'IpeI'alunt('G) '" ,~ 1110 188:
53
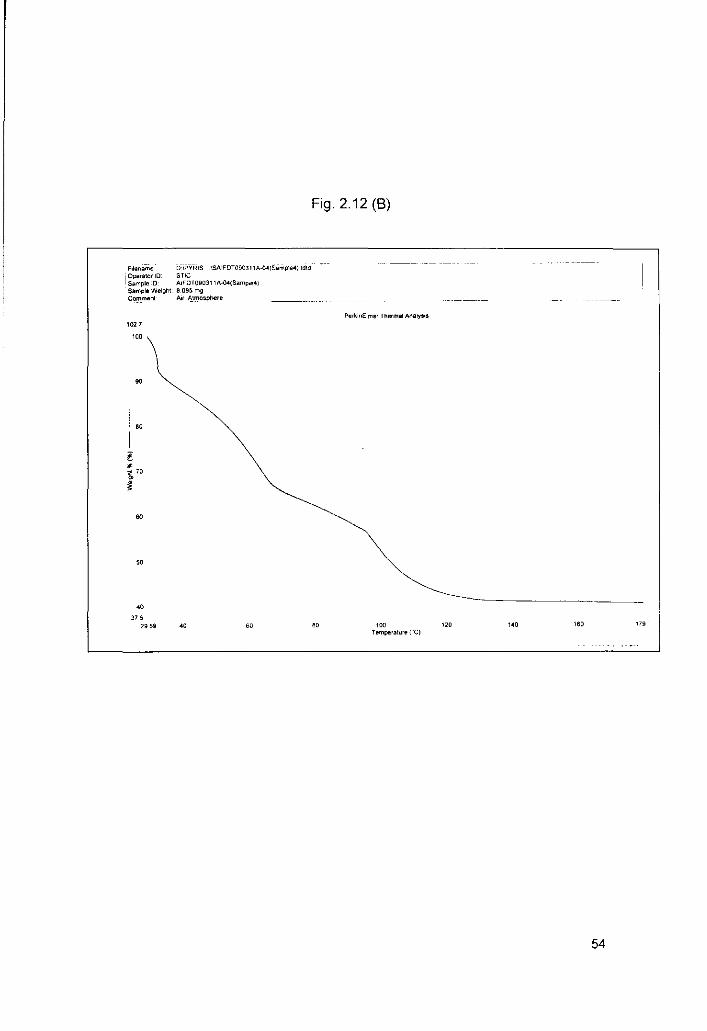
Fig. 2.12 (B)
1027
'00
z•C 70
f
"on29.59
Peo1<inElmer The<malAIIa!yS<S
'00Temperature ("Cl
,," "" ""
54

I ~:"r::;IDSampie IDSample WelghlCom"""'~
1028
'00
"00
es
60
ss
50
es
DIPYR is ISAIFOT090311A~07(Sample 7)!dtdSTICAIFDT090311A-07(Sample7j'J724mg!'-i...!.-Almosphere~ _
Fig. 2.12 (C)
Peri<lnElrner Thermal Analjllljs
38.7327.62 60 60 '00
'rempereture ('C)12' '" '"
55
178.!
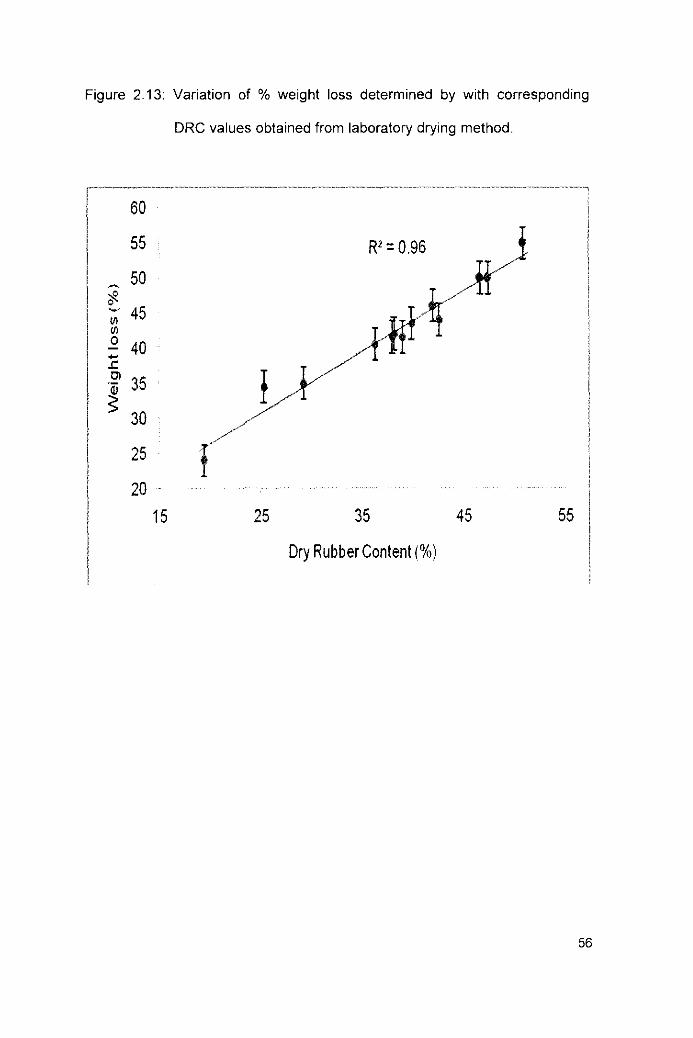
Figure 2.13: Variation of % weight loss determined by with corresponding
ORe values obtained from laboratory drying method.
60
55R'=O.96 Y
~50
~0-- 45IIIIII0 40....
.L:Cl 35
~~ 30
25 r/20
15 25 35 45 55
Dry Rubber Content (%)
56
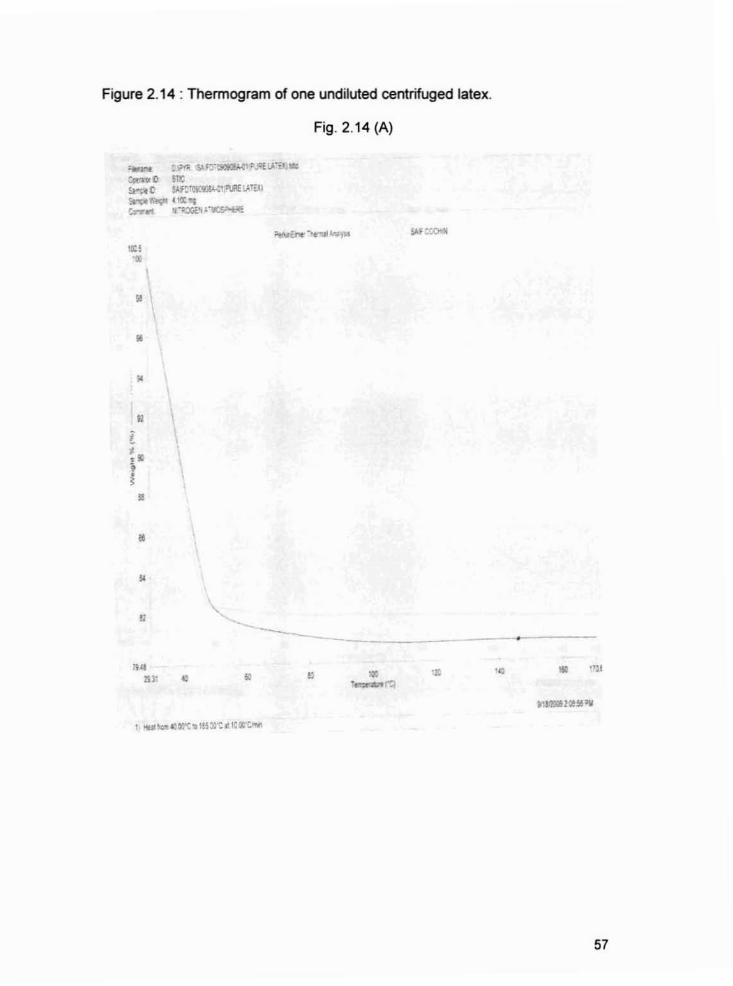
Figure 2.14 : Thermogram of one undiluted centrifuged latex.
Fig, 2,14 (A)
~ &:0'''" '~ r:r~i: .4I£ j"I." ' .
~o SotSr'« t $,lf:~" "I.Il£ \} ...znsn..fiIo;lII 4 !'X '1eror... . '=::G<.~'~
""-e,•
•
•
•i,o.f•
•
•
• .........--- ---_._--••..' • • !l 'X '. * '''j;t
57
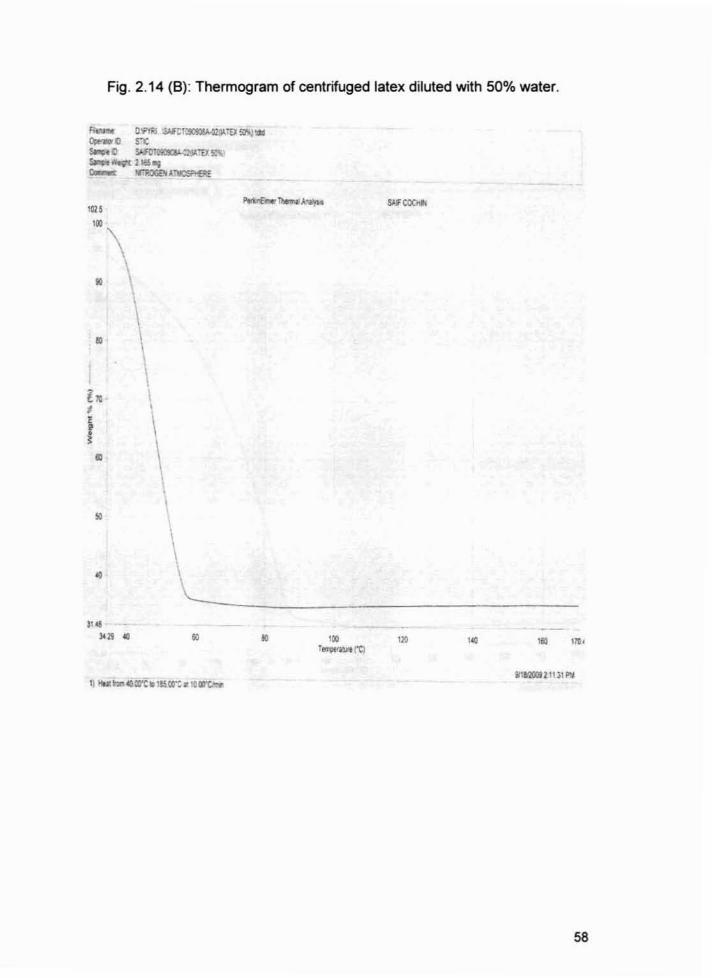
Fig. 2.14 (B): Thermogram of centrifuged latex diluted with 50 % water.
r_ O'I"VRI wtT~:»,:[.I ~._.'"SIooM O So'SmllllCDL:!'II."'D 5C\1s....,.,.,.. 2165 ..r- ~AnIOSPt£fIf
'.,
"
..........-
l --- - - - ----- -
•
•
"
,'... "
\,
\\
• • ,. .. 'N,
58
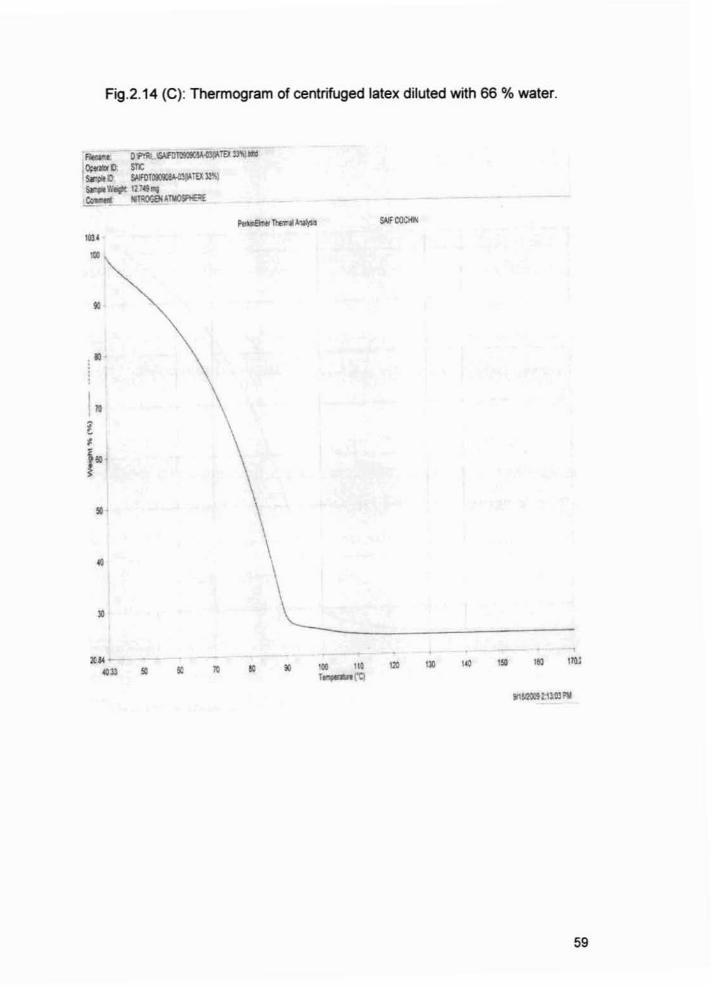
Fig.2.14 (C): Thermogram of centrifuged latex diluted with 66 % water.
~ D~ 6lI'OtJQ(~TDSNIN
I~n STC'sr.jlltO 5,I,iF{I~TDl.."'I
5niI.... \27. .._~ 1mOG9IATlI09'lE"£
.,...s
s ·
•
• L__XII
•• • • • • • .. ,x ,.'"
1
ne
59
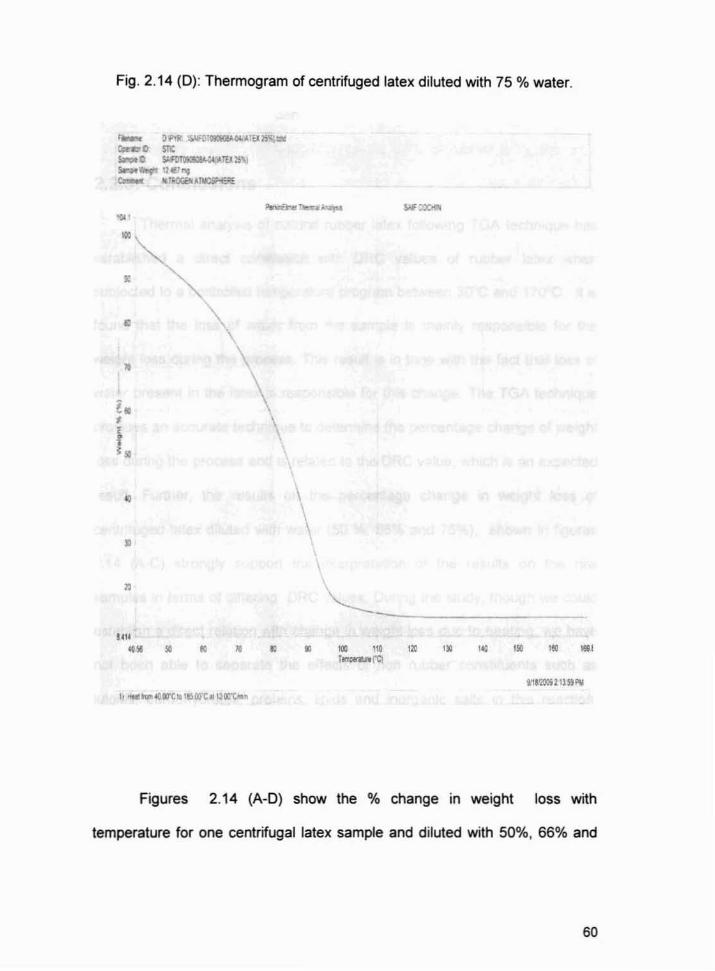
Fig. 2.14 (D): Thermogram of centrifuged latex diluted with 75 % water.
r..... OI''1t "WC1~4Ul~.oS'O;.
Cr!rll:'C sn;s..C ~\l'V2S'>I
s.-.. ""'fI lU!? ""e-. 1I'.OGalA1'MCSl"-I:I'E
..•
•
•l.,i'.
\\
•
•
"
\\\
"--• • • .. "' .. '. '. '. I. ..,
'~ro
"" 7.l)WlSt ~
Figures 2.14 (A-D) show the % change in weight loss with
temperature for one centrifugal latex sample and diluted with 50%. 66% and
60
75% water. A comparison of figures 2.13 and 2.14 show that the weight loss
between 30°C and 120°C is parimarily due to loss of water from the samples.
2.2.5: Conclusions
Thermal analysis of natural rubber latex following TGA technique has
established a direct correlation with DRC values of rubber latex when
subjected to a controlled temperature program between 30°C and 170°C. It is
found that the loss of water from the sample is mainly responsible for the
weight loss during the process. This result is in tune with the fact that loss of
water present in the latex is responsible for this change. The TGA technique
provides an accurate technique to determine the percentage change of weight
loss during the process and is related to the DRC value, which is an expected
result. Further, the results on the percentage change in weight loss of
centrifuged latex diluted with water (50 %, 66% and 75%), shown in figures
2.14 (A-C) strongly support the interpretation of the results on the raw
samples in terms of differing DRC values. During the study, though we could
establish a direct relation with change in weight loss due to heating, we have
not been able to separate the effects of non rubber constituents such as
lutoids, carbohydrates, proteins, lipids and inorganic salts in this reaction.
Moreover, it has not been possible to study the effect of anticoagulants and
adulterants on latex samples in a TGA thermogram. We think that the
information provided by the present investigations would be useful for quick
quantification of dry rubber content in natural rubber latex and to design
61
quality standards for the products manufactured using natural rubber latex. In
this work we have been able to show that Thermo Gravimetric Analysis is an
accurate technique for the estimation of the ORe of rubber latex, though it
does not overcome other limitations such as being expensive and requiring
skilled personnel for measurement.
62
References
1. American Society for Testing and Materials, Philadelphia, PA.
(1997).
2. Etzion, Y., R. Linker, U Cogan, and I. Shmulevich, J. Dairy Sc
(2004) 87:2779-2788.
3. Griffiths, P. R., and J A. de Haseth, Fourier transform infrared
spectrometry. John Wiley & Sons, New York, N.Y (1986).
4. Schmitt, J., and H. Flemming, FTIR-spectroscopy in microbial and
material analysis.lntl. Biodeterior. Biodegr (1998) 41:1-11.
5. Graham J, Leslie S, Antony W, Marinas E., Clin Chem (1999)
45:1077-81.
6. Franck P, Sallerin JL, Schroeder H, Gelot M.A, Nabet P., Clin
Chem (1996) 42:2015-20.
7. Rahman J, Hewlett A, Taylor DR, Xiao SY, Wu JG, Soloway, RD.,
Gastroenterology (2002) 122 (Suppl): A303.
8. Kruse-Jarres, J.D, Janatsch, G., Gless, U., Marbach, R, Heise,
H.M., Clin Chem (1990) 36:401-2.
9. Christopher, V.E., Arnold, MA, Clin Chem (2001) 47:1279-86.
10. Rigas S, Morgello S, Goldman IS, Wong, PT, Proc Natl Acad Sci U
SA (1990) 87:8140-4.
11. Koenig, F., et ai, Urology (1998) 51:342-345.
12. Wang, H.P., Wang, H.C., Huang, Y.J., Sci Total Enviro (1997)
204:283-287.
63
13. Huleihel, M. J,. Biochem Biophys Methods (2002) 50:111-21.
14. Fung Kee Fung, M., et ai, GynecolOnco (1997) 66:10-5.
15. Argov, S., et ai, J Biomed Opt (2002) 7:248-54
16. Wang, J.S., et ai, World J Gastroenterol (2003) 9:1897-1899.
17. Zhao. D.W et al. Gastroenterology. (1996) 110(Suppl): A620.
18. Li, WH. et al, Gastroenterology (1997) 112(Suppl)A604.
19. Wang, J.S., et ai, Chin J Hepatobiliary Surg (2003) 9:657-60.
20. Ren, Y., et ai, Spectrosc Spect Anal (2003) 23:681-684.
21. Yang, L.M., et al,Spectrosc Spect Anal (2003) 23:883-884.
22. Xu, Y.l. et al. Chem J Chin Uni. (2004) 25: 348-50.
23. Wu, J.G., et ai, Biopolymers. (2001) 62:185-92.
24. Wang, F. et al. Spectrosc Spect Anal (2003) 23:498-501.
25. Xu, Yl., et ai, Gastroenterology (2000) 118:A6438.
26. Sun, X.J, et ai, Gastroenterology (2003) 124(Suppl):A420-421.
27. Peng, Q, Xu, Y.l., Li, WH., lhou, XS., Wu, J.G., Spectrosc
Spect Anal (1998) 18:528-31
28. Sun, C.W, et ai, Spectrosc Spect Anal (1996) 16:22-5.
29. Helm, D., Labischinski, H. & Naumann, D., J. Microbial Method.
(1991) 14 127-142
30. Naumann, D., Helm, D. & Schultz, C, Bacterial Diversity and
Systematics, Edited by F. G. Priest, A. Ramos Cormenzana & B. J.
Tindall, New York: Plenum (1994) 67-85.
64

31. Holt, C., Hirst, D., Sutherland, A. & MacDonald, F., Appl Environ
Microbial (1995) 61: 377-378.
32. Goodacre, R., Timmins, E., M., Burton, R., Kaderbhai, N.,
Woodward, A. M., Kell, D. B. & Rooney, P, J. Microbiology (1998)
144: 1157-1170.
33. Kummerle, M., Scherer, S. & Seiler, H., Appl Environ Microbial.
(1998) 64: 2207- 2214.
34. Timmins, E. M., Howell, S. A., Alsberg, B. K., Noble, W. C. &
Goodacre, R., J Clin Microbial (1998) 36:367- 374.
35. Tindall, B. J., Brambilla, E., Steffen, M., Neumann, R., Pukall, R.,
Kroppenstedt, R. M. and Stackebrandt, E., Environ Microbial.
(2000) 2: 310-318.
36. Kirschner, C., et ai, J. Clin. Microbial (2001) 39:1763 -1770.
37. Kumrnerle, M., S. Scherer, and H. Seller, Appl. Environ. Microbial
(1998) 64:2207- 2214.
38. Sockalingum, G D., et ai, Vib. Spec/rose (2002) 28:137-146.
39. Galichet, A., G. D. Sockalingum, A. Belarbi, and M. Manfait, FEMS
Microbial. Let! (2001) 197:179-186.
40. Orsini, F., D. Ami, A. M. Villa, G. Sala, M. G. Belloti, and S. M.
Doglia, J. Microbial Me/hods (2000) 42:17-27.
41. Schmalreck, A. F., P Trankle, E. Vanca, and R. Blaschke
Hellmessen, Mycoses (1998) 41 (Suppl. 1):71-77.
65

42. Timmins, E. M., D. E. Quains, and R Goodacre, Yeast (1998)
14:885-893.
43. Douglas, A Skoog, F. James Hollar and Timothy A, Nieman,
Principles of Instrument Analysis, Harcourt Brace & Company
(1992), 799.
44. Earnest, C.M., Anal Chem (1984) 56:1471A
45. Yuichi Nakagawa, Journal of Fire Sciences. (1990) 8(6): 455-476.
46. Ning Jianguo, Journal of Fire Sciences (1986) 4(5): 355-362
47. Kazuhiko Fukatsu, Journal of Fire Sciences (1990) 8(3): 194-206.
48. Seyed Morteza Mostashari, Journal of Industrial Textiles (1999)
37(1): 31-42.
49. Mohamed M.M. Abd EI-Wahab, High Performance Polymers
(1992) 4(4): 215-224.
50. Paola Castaldi, Margherita Silvetti, Laura Santona, Stefano Enzo
and Pietro Melis, Clays and Clay Minerals (2008) 56(4): 461-469.
51. Victor A Drits and Douglas K. McCarty, Soil Sci Soc Am J (2008)
72:1-10.
52. Pavel Dlapa, Ivan Simkovic, Jr., Clays and Clay Minerals (2006)
54(1): 80-86
53 C.R. Costello, Surgical Innovation (2007) 14(3):168-176
54. Natesan Shanmugasundaram, Clays and Clay Minerals (1997)
45(2) 213-220
66