design and development of information systems for the...
TRANSCRIPT

295
Geo-Information Systems for the Middle EastGeoArabia, Vol. 5, No. 2, 2000Gulf PetroLink, Bahrain
Design and Development of Information Systems for theGeosciences: An Application to the Middle East
Dogan Seber, David Steer, Eric Sandvol, Christine Sandvol,Carrie Brindisi and Muawia Barazangi
Institute for the Study of the Continents and Department of Geological Sciences,Cornell University, Ithaca, New York
ABSTRACT
As our understanding grows of how the Earth functions as a complex system of myriadinterrelated mechanisms, it becomes clear that a revolutionary and novel approach isneeded to study and understand it. In order to take advantage of an ever-growingnumber of observations and large data sets and to employ them efficiently inmultidisciplinary studies aimed at solving earth system science problems, we aredeveloping a comprehensive Solid Earth Information System (SEIS). The complexnature of the solid earth sciences raises serious challenges for geoscientists in theirquest to understand the nature and the dynamic mechanisms at work in the planet.SEIS forms a first step in developing a broader and more comprehensive informationsystem for earth system sciences designed for the needs of the geoscientists of the 21st
century. In a way, SEIS is a step towards the Digital Earth. Application of SEIS to thecomplex tectonics of the Middle East shows that information systems are crucial inmultidisciplinary research studies and open new avenues in research efforts. SEISincludes an Internet module that provides open access to anyone interested.Researchers as well as educators and students can access this knowledge andinformation system at http://atlas.geo.cornell.edu.
INTRODUCTION
Currently, one of the greatest challenges facing earth sciences is related to the assimilation,dissemination, and management of the ever-growing quantity of digital information. The chaoticdistribution of massive geoscience data sets, their uneven documentation, and the lack of easy-to-usetools for data access and analysis are major obstacles for earth scientists and educators alike. Theseobstacles limit both scientific productivity and the quality of education. However, the power of havingat one’s finger tips all available relevant data, information, and knowledge together with data access,modeling, and visualization tools has great potential for improving the quality of scientific researchand education.
In order to solve these challenging problems we must change the way information, data, and knowledgeare preserved, utilized, and disseminated. The earth science community is in need of systems that notonly provide digital data, but as importantly, provide tools that allow users to manipulate, query,select, and cross-reference any part of data sets with efficiency and speed. One of the most promisingsystems for use by earth scientists is the Geographical Information Systems (GIS). GIS is an organizedcollection of hardware, software, and data designed to store, manipulate, analyze, query, and displayinformation for decision-making and accurate analysis of any spatial data. Although GIS systems inthe geosciences have become increasingly widespread in recent years (Walker et al., 1996; Seber et al.,1997), they have the capacity to be exploited much more fully.
One of the misconceptions about GIS is that it is only a map-making tool. In fact, GIS does much morethan simply make maps. It enables a user to analyze, study, search and select databases for a specificpurpose. For example, a person studying the seismotectonics of a region can display all active faultsin a region, select earthquakes within a certain distance from these faults, and calculate the density ofseismic events. Similarly, a user can select a geologic unit and determine its area, its topography, or thenumber of faults within it. These are simple tasks that can be completed in a few seconds. What GIS

296
Seber et al.
provides is a convenient way to expand our abilities to do better research in much less time and tobring interdisciplinary approaches to scientific studies by allowing efficient ways to cross-referencemultiple data sets.
Using GIS software allows storage of the data in a spatially registered structure and permits cross-referencing for heterogeneous, multidisciplinary data sets. It manages data sets as layers of information.Geographic features such as rivers and lakes or geological features like faults, sample locations, andages of rocks are all examples of layers. Each layer is independent from the others, yet all have acommon geographic registration and they can be linked with each other using specific identificationtags. This provides a convenient way of selecting necessary information from the database and makingit ready for further analysis and decision-making.
As a first step in building a comprehensive information system for Earth System Sciences, we areconstructing a Solid Earth Information System (SEIS) for research and educational purposes. SEISincludes large volumes of data sets from surface to sub-crustal levels and their related metadata. SEISalso includes easy-to-use tools to access the data sets and manipulate them in a variety of ways.Furthermore, an Internet module built for SEIS allows users access to the data sets and tools over theInternet using Word Wide Web browsers.
SEIS is a regional scale information system, although the goal is to have a global information system.It currently holds regional data sets from the Middle East, North Africa, and the U.S.A. The mainpurpose of this paper is not to solve a specific problem, but to outline the structure of an effectivegeoscience information system and give several examples of how it can be used to better study andunderstand the complex tectonics of the Middle East region.
BUILDING A GEOSCIENCE INFORMATION SYSTEM
Building a comprehensive information system is time consuming and requires significant financialand labor resources. Collecting appropriate data sets, digitizing analog data, and developingcustomized codes are all challenging tasks and require significant effort. However, the benefits ofhaving a comprehensive information system for research and education greatly outweigh thedifficulties. In constructing a geoscience information system the most important issues that need to beconsidered are the objective, scale, and by whom and for what purpose the information system will beused.
Structurally, an information system will have three main layers.(1) At the base level is a database that contains all relevant data sets in an organized fashion.(2) The middle layer is composed of codes that allow communication with the underlying database
and help to make user-defined searches, selections, and plots.(3) The top layer is the user or an analysis/request mechanism.
Data Layer
The database level forms the foundation of the system. After collecting and properly organizing/reformatting the relevant data, the digital files are placed in this layer to be accessed by users. Inreformatting the available data, there are several technical issues. The main question is how to get thedata into this organized digital system. There are several ways to import existing data into the database.If digital data are available, putting them in this layer requires little time and effort to convert theoriginal format of the data to the database’s own format. When digital data are not available, analogto digital conversion must be performed. If the data of interest are in tabular forms, they can be typedin, or files can be scanned and automatically converted to digital format using text recognition software.If the data are in the form of map sheets, two different techniques are generally used: scanning anddigitizing. Both of these techniques have their advantages and disadvantages.
Scanning provides a fast and efficient way of putting the data into computers. However, scanned filesare large and they are not feature-oriented, that is, no features in the maps can be selected separately.
297
Geo-Information Systems for the Middle East
Digitizing, on the other hand, provides maximum flexibility in feature manipulation, since each objectin a map is digitized separately and assigned various identification labels. However, digitizing takesconsiderable time and it is tedious. The developers must decide between the two techniques accordingto the needs and uses of the data set.
An important aspect of the database layer is the development and use of metadata. Metadata isinformation about the data sets: their resolution, accuracy, original sources, quality, and other necessaryinformation. This information is essential for users of the database to learn about the data sets in thesystem and how they were created. There are already developed standards for metadata, althoughthese standards will certainly be updated as needs arise and more people start using large data setsand start exchanging data among themselves. It is essential for future users that all critical informationabout the history of the data be kept and made accessible to users regardless of its format.
Software Layer
The middle layer in an information system is its lifeline. This layer is composed of software componentsthat form the communication links between a user and the underlying data sets. Writing codes fordata access and manipulation is one of the most time-consuming tasks in system development.However, recent developments in the software industry eliminate some of the major obstacles thatmight be faced in the code development phase. For example, utilizing commercially available databaseand GIS software reduces the software development time considerably.
Having commercial software as the main application source also helps in keeping pace withtechnological advancements as well. As new tools and methods become available they are incorporatedinto existing software by the software vendors and system developers can take advantage of thesenew developments. Yet, regardless of the sophistication level of the software being used, developerswill have to build additional codes for their specific needs. An efficient system can only be achievedby custom designed tools (i.e., codes) specific for each data set. Developers must determine the needsof users and potential uses of each data set that they include in their information system.
User Layer
The user is an integral part of the system, as users actually control how the system will act based onspecific needs. Since the potential number of users of a comprehensive geoscience information systemis large and users’ background levels vary widely, it is important that they be trained and educatedabout the advantages of a GIS. On the other hand, a user need not be a person, it could be a computerprogram or an electronic interface that makes specific requests to the system.
SOLID EARTH INFORMATION SYSTEM (SEIS) AND ITS APPLICATIONTO THE TECTONICS OF THE MIDDLE EAST
Solid Earth Information System (SEIS) is a GIS-based information system with menu-driven datamanipulation, search, and plotting tools designed to be used by earth scientists in research andeducation. SEIS has been designed and developed by the GIS group at Cornell University, Institute forthe Study of the Continents and Department of Geological Sciences. At the present time, SEIS hasvariable-scale data sets; the Middle East, North Africa and the U.S.A. are covered at regional scales(~1:1,000,000) and the rest of the world is covered at smaller scales. Currently, SEIS runs on UNIX andNT platforms and requires ArcInfo® commercial GIS software.
SEIS’s internal data sets are held in four main categories: Geography, Geology, Geophysics, andImagery/Grids. Access to data sets is provided through menu-driven tools that eliminate therequirement of being familiar with the ArcInfo® software. A version of SEIS is also accessible via theInternet at http://atlas.geo.cornell.edu. With a web browser, users can access, analyze, and plot anypart of the data sets interactively for their own purposes. In the following sections, we present theMiddle East component of our ongoing work in developing a SEIS.
298
Seber et al.
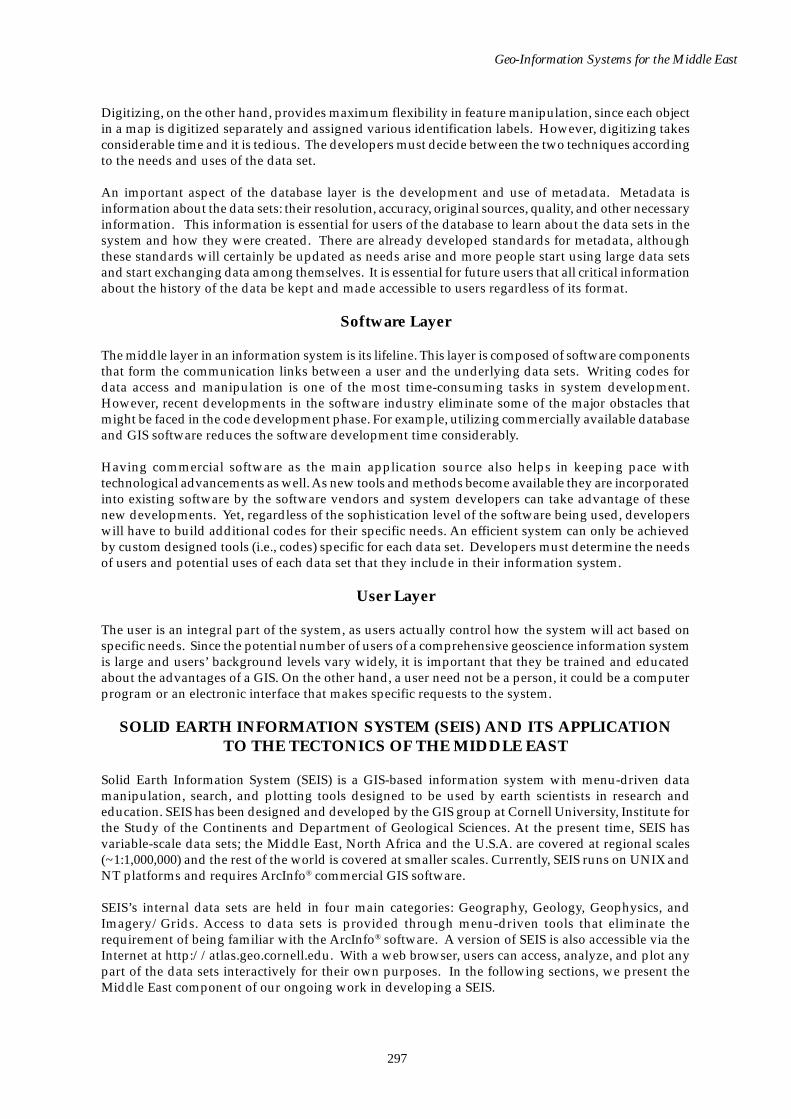
One of the main advantages of having a comprehensive information system is the ability to access andcompare several data sets relative to each other quickly and easily. Tectonically complex regions suchas the Middle East require such comparative studies. The Middle East encompasses all major types ofplate boundary processes, from rifting and mid-ocean ridges in the Red Sea and Gulf of Aden, tosubduction and the subsequent continent-continent collision in the Zagros and Bitlis Suture Zones, tostrike-slip plate motion along the Dead Sea Fault System and the North Anatolian Fault (Figure 1).This is an ideal region in which to test and validate the potential applications of SEIS.
40°N
20°
60°E40°
CASPIANSEA
BLACK SEA
MEDITERRANEAN SEA
ARABIANGULF
GULF OF ADEN
REDSEA
Cyprus Arc
East AnatolianFault
ANATOLIAN BLOCK
North AnatolianFault
TURKISH andIRANIAN
PLATEAUS
Dead SeaFault
BitlisSuture
Zagros Fold Belt
MESOPOTAMIAN FOREDEEP
Owen Fracture Zone
AFRICAN PLATE
ARABIAN PLATE
EURASIANPLATE
EURASIANPLATE
SpreadingCenters
0 500
Km
Plate motion
Strike-slip fault
Thrust fault
OmanObduction
Figure 1: Map showing the simplified tectonic units of the Middle East. Regions with topographicelevation over 1,500 meters in the Iranian and Turkish Plateaus are shaded in brown. Basementoutcrops of the Arabian Shield are shown in gray. The large black arrows represent major platemotion directions.

299
Geo-Information Systems for the Middle East
Data Sets
Plate Boundary Processes and Digital Elevation ModelsThe plate boundary processes affect the overall tectonics of the Middle East and are mainly responsiblefor the structure and kinematics in this region, including the intraplate processes (see Figure 1). In ageneral sense, the dynamic plate boundary processes in the Middle East are manifested in the present-day topography (Figure 2). Higher topography and relief in the region coincide mainly with platecollision zones such as the Zagros. Distinct topographic features are also observed along the Red Seacoast and also along the Dead Sea strike-slip transform fault system.
With an organized data and information system such as SEIS one can look for spatial relationshipamong different data sets. Calculating topographic slopes in mountainous regions is a common GISapplication. The slope map (Figure 3) calculated on a Digital Elevation Model (DEM) of 1,000 meter
40°N
20°
0 500
Km
60°E40°20°
ARABIAN SEAREDSEA
MEDITERRANEAN SEA
BLACK SEA
CASPIANSEA
AFRICA
ARABIA
GULF OF ADEN
Figure 2: Shaded-relief representation of the topography of the Middle East and surrounding regions.This image was created using a 1-km grid size data set with an artificial sun illumination from thenorth. Oceans and land areas below sea level are shown in blue.

300
Seber et al.
(m) resolution shows that high-angle topographic slopes are mainly concentrated along the plateboundaries. Although a 1,000-m resolution is not sufficient for an accurate slope estimation, it gives aregional picture. There are steeper topographic slopes along the Zagros and Bitlis Suture Zones, themargins of the Red Sea, and in the interior of the Turkish and Iranian Plateaus.
In contrast, the interior of Arabia, Turkey, and Iran are relatively flat. The steep slopes along theZagros and the Bitlis sutures are a consequence of the collision process of Arabia with Eurasia. Thehigher slope angles calculated along the Red Sea coast in Arabia are due to rifting and opening of theRed Sea and the evolution of the Red Sea escarpment. Steep slopes are also evident in parts of interiorIran due to island arc volcanism. Similarly, in eastern Turkey away from the Bitlis Suture Zone, thesteep slopes are possibly related to active deformation within the plateau. Steep topographic slopesare also calculated along the North Anatolian right-lateral strike-slip fault zone in northern Turkey.
ARABIAN SEA
ARABIANGULF
GULF OF ADEN
REDSEA
MEDITERRANEAN SEA
CASPIANSEA
EGYPT
SYRIAIRAQ
JORDAN
SAUDIARABIA
IRAN
YEMEN
OMAN
TURKEY40°N
20°
60°E40°
0 500
Km
50°
10°
SlopeAngle
Figure 3: Color-coded slope angles based on data shown in Figure 2. Slope angles less than 10° arenot displayed. Slope angles shown vary from 10° to 50°. Higher slope angles are calculated alongmajor plate boundaries and tectonically active regions.

301
Geo-Information Systems for the Middle East
A comparison of steeper topographic slopes and recent seismicity (Figure 4) in the region indicatesthat steep slope regions (i.e., high relief regions) coincide with active plate margins. This correlationimplies that active tectonism is mainly responsible for the topographic relief in the region. Interpretationof steep slope regions, however, can be challenging, it has been documented that high erosion ratescan also be an influence on topographic relief (e.g., Montgomery, 1994). However, these regions of theMiddle East are relatively arid and erosional effects in these regions are assumed to be insignificant.Steep slopes calculated along the margins of the Arabian Plate also coincide with the seismic activityin the region. This correlation is best observed along the Zagros Suture. In the central Zagros, atopographic embayment disturbs the overall northwest trend of the Zagros chain (Figure 2). Seismicityalso mimics this embayment. One-to-one correlation between the topography and seismicity alongthe Zagros is quite remarkable. In fact, this correlation is observed in most of the Middle East. Theonly significant deviation from this correlation occurs in western Turkey where seismicity is veryhigh, but there is no related topographic feature. This could be explained by the dominant extensionaltectonics in this region.
Geologic and Tectonic MapsTectonic complexity in the Middle East is reflected in the surface geology. In order to make good useof surface geological features in any regional-scale analysis it is necessary to have a digital representation
40°
M < 4
4 < M < 5
5 < M < 6
6 < M
SAUDIARABIA
YEMEN
OMAN
EGYPT
SUDAN
IRAQIRAN
ARABIAN SEA
ARABIAN GULF
BLACK SEA
CASPIANSEA
MEDITERRANEANSEA
TURKEY
0 500
Km
60°E
40°N
20°
REDSEA
Figure 4: Seismicity of the Middle East region based on the ISC catalog for the period 1964 to 1994.

302
Seber et al.
of surface geology at about 1:500,000 to 1:1,000,000 scale. Unfortunately, digitizing geologic maps isamong the most difficult and time-consuming parts of a digital geoscience information system. Severalorganizations have taken the lead in digitizing different scale geologic maps. The United StatesGeological Survey (USGS) has made available several medium-resolution digital geologic maps ofmany parts of the world through its World Energy Project (e.g., Pollastro et al., 1997). Figure 5 showsthe surface geology of the Middle East and surrounding regions obtained from the USGS and from theGeological Survey of Canada (Kirkham, 1995). The higher resolution geology map of eastern Turkeywas digitized at Cornell University. Digitized geologic maps allow a user, for example, to select certainrock units based on age, type or any other item specified in the data set, and display them separately.For example, the Precambrian units in the Red Sea region can be extracted from the data set shown inFigure 5. These selected units can later be used to estimate the total area of Precambrian rocks, or theycan be used to select topography or fault distribution only within these selected regions.
In addition to the geologic map, a new digital tectonic map of the Middle East and North Africa hasbeen compiled at Cornell. The compilation took more than a year and required many data sources tobe collected, digitized, and integrated. The scales of maps used in the compilation range from 1:250,000
Figure 5: Digital geology map of the Middle East region. High-resolution data are from the UnitedStates Geological Survey World Energy Program (Pollastro et al., 1997). Lower resolution data areobtained from the Geological Survey of Canada (Kirkham, 1995). Eastern Turkey data were digitizedat Cornell University.
SAUDIARABIA
YEMEN
OMAN
EGYPT
SUDAN
IRAQ
SYRIA
IRAN
ARABIAN SEA
GULF OF ADEN
BLACK SEA
CASPIANSEA
MEDITERRANEANSEA
TURKEY
0 500
Km
60°E
40°N
20°REDSEA
ARABIANGULF
40°

303
Geo-Information Systems for the Middle East
to 5,000,000. We digitized faults, Neogene and Paleogene volcanics and crystalline basement outcrops.Figure 6 shows our compilation for the Middle East. Each feature in the tectonic map has been assignedall available attribute information such as throw in faults, activity of faults, age of volcanics, and so on.
Earthquakes and Focal MechanismsSeismicity (earthquake hypocentral locations) is one of the largest data sets in SEIS. The whole of theInternational Seismological Centre (ISC) catalog is kept online. It contains global seismic phase readingsand attribute data, such as the depth, magnitude, origin time, number of stations used in location, andso on. The data set currently covers the period from 1964 to 1995 and includes information from morethan 700,000 earthquakes and millions of associated phase readings. We have developed several toolsto access any part of the ISC catalog and select, display, and analyze any event, or select a station andquery its recorded events and their phase readings.
Figure 7 shows a sample plot from this data set. Station SHI (Shiraz) in Iran has been selected and allevents in the database recorded by the station within the distance range of 0°-10° were chosen usingthe data access tools. In addition, great circle paths (the shortest distance between station and
Figure 6: Map showing the tectonics of the Middle East compiled from several sources. Analogmaps were digitized and merged to obtain one uniform tectonic map for the region at an averagescale of 1:1,000,000.
?
?
??
BLACK SEA
CASPIANSEA
MEDITERRANEANSEA
ARABIAN SEA
GULF OF ADEN
REDSEA
Quaternary/NeogeneVolcanics
Paleogene Volcanics
Ophiolites
Faults
40°N
0 500
Km
20°
60°E40°
ARABIANGULF
EGYPT
SUDAN
SAUDIARABIA
OMAN
YEMEN
IRAQIRAN
?

304
Seber et al.
earthquake) have been calculated and plotted. Based on the station location and distance range selected,most of the seismic phase readings are from the Zagros and the Iranian plateau regions. Users can plotthe travel-time data from this data set. Since the distance to epicenter is known and all seismic phasearrival data are kept in the database, users can plot distance versus seismic phase arrival times (Figure8) for the selection. This allows determination of average seismic P and S wave speeds in this regionand since the selection covers most of Iran and the distance is limited to 10°, Figure 8 provides anaverage speed of the uppermost mantle P waves (Pn) beneath Iran. The shear wave (Sn) arrivals inthis region are attenuated and reported arrival times of Sn phases are scattered, making Sn speedestimation difficult. The solid lines on Figure 8 represent the average global Pn and Sn speeds as
Figure 7: Map showing locations of seismic events (mostly earthquakes) for which phase readingsexist from station SHI (Shiraz) in Iran. SEIS allows selection of seismic events based on recordingstations’ codes. In this selection only those events that are within 10 degrees distance of stationSHI are plotted. Calculated great circle paths to each event are plotted as blue lines.
CASPIANSEA
ARABIANGULF
ARABIAN SEA
ARMENIA
IRAN
IRAQ
OMAN
UNITED ARABEMIRATES
SAUDIARABIA
AFGHANISTAN
Shiraz
40°N
0 500
Km
30°
60°E50°
QATAR
BAHRAIN

305
Geo-Information Systems for the Middle East
provided by IASP-91 travel-time tables. These tables are also a part of SEIS and can be used forcomparative studies of regional seismic phase speeds in any part of the world. The users have theoption of limiting their selection further by adding new criteria such as the depth of the event, azimuthalcoverage, and date.
Earthquake focal mechanisms are also an important data set. Several organizations calculate focalmechanisms of major seismic events (Mb>5.5). Harvard University’s Centroid Moment Tensor (CMT)solutions are an example. We have collected all the solutions from the Harvard catalog and includedthem in our database with all available attributes. In addition to geology, fault maps, and seismicity,fault plane solutions provide insights about the kinematics of the region. Since the data sets areregistered and are accessible by way of menu-driven tools, users can plot focal mechanisms of eitherall or selected events in a region. Figure 9 shows Harvard CMT focal mechanism solutions in theMiddle East. The continent-continent collision in Zagros is delineated by predominantly northwest-oriented thrust-type focal mechanism solutions along the Zagros Mountain chain. In contrast, theGulf of Aden and Red Sea regions are dominated by mostly extensional focal mechanism solutions.The North Anatolian Fault Zone is dominated by strike-slip type solutions, and western Turkey isdominated by mostly east-west oriented extensional focal mechanism solutions.
Unfortunately, CMT solutions are available only for major seismic events. To make up for the gap infocal mechanism solutions of lower magnitude events and those that occurred prior to the CMTcatalogue, we have made an exhaustive literature search to determine earthquake focal mechanismsfor the Middle East and North Africa. Our search resulted in finding more than 450 focal mechanismsolutions. These focal mechanism solutions are mainly based on first-motion analysis and waveformmodeling. Figure 10 shows these focal mechanisms for the Middle East. The quality of the focalmechanism solution vary. In order to take into account the quality variations in the data set, we addedspecial items and comments for each of the focal mechanism solutions. Users can easily access all thisinformation and include or exclude certain types of events from their analysis.
Figure 8: Travel-time plot of recorded seismic phase arrivals at station SHI for events shown inFigure 7. This option in SEIS allows a better analysis of regional seismic wave speeds in thisregion. Predicted arrival times based on IASPEI 91 velocity model for Pn and Sn phases are plottedfor comparison with orange and blue lines, respectively.
0
100
200
300
0 2 4 6 8 10Distance (degree)
Tra
vel T
ime
(sec
)
Sn
Pn

306
Seber et al.
Figure 10: Focalmechanismsolutions for eventssmaller thanMb<5.5 as well asfor events pre-dating the CMTcatalog. About 450focal mechanismsolutions wereobtained from anextensive literaturesearch. This dataset is used tocomplement theCMT catalogshown in Figure 9.
Figure 9: Focalmechanismsolutions of largeevents (Mb>5.5) inthe Middle East.The solutions arefrom the HarvardCMT catalog forthe period 1977 to1996.
MEDITERRANEANSEA
REDSEA
ARABIANGULF
ARABIAN SEA
TURKEY
IRAQ IRAN
SAUDIARABIA
OMAN
YEMEN
EGYPT
SUDAN
0 500
Km
40°N
60°E
20°
40°
REDSEA
ARABIANGULF
GULF OF ADEN
ARABIAN SEA
TURKEY
IRAQ IRAN
SAUDIARABIA
OMAN
YEMEN
EGYPT
SUDAN
0 500
Km
50°E
20°
40°
40°N
MEDITERRANEANSEA
BLACK SEA
CASPIANSEA

307
Geo-Information Systems for the Middle East
Active VolcanoesAn important data set in the Middle East is the distribution of Cenozoic volcanoes and volcanic rocks.Cenozoic basaltic rocks are widespread in the region, but a concentration is present in the western andnorthern parts of the Arabian Plate, Turkey, and northwestern and eastern Iran. Historically activevolcanoes in the region show a similar spatial pattern (Figure 11). The Smithsonian Institution activevolcano data set (Figure 11) shows that the majority of historically active volcanoes is located in theRed Sea and Afar Triangle regions as well as in Turkey and northern Arabia. Each volcano in the dataset (Figure 11) includes items such as volcano type, eruption status, and elevation. Users of SEIS canaccess the entire data set or select one or many of the volcanoes by their type, elevation, or any otheritem that is defined in the data set.
Figure 11: Map showing distribution of volcanic activity in the Middle East. Only Neogene/Quaternary and Paleogene volcanic fields are shown. Holocene volcanoes obtained from theSmithsonian Institution are also shown colored based on their age groups. The majority of theNeogene/Quaternary fields are in western Arabia and Turkey, whereas the majority of Paleogenevolcanics are in Iran.
BLACK SEA
CASPIANSEA
MEDITERRANEANSEA
ARABIAN SEA
ARABIANGULF
GULF OF ADEN
REDSEA
AD 1900-1993
AD 1-1900
BC and undated AD
Undated and geothermal
Basalts
Volcanoes
Quaternary/Neogene
Paleogene
0 500
Km
EGYPT
SUDAN
SAUDIARABIA
OMAN
YEMEN
IRAQ
TURKEY
IRAN
40°N
60°E
40°
308
Seber et al.
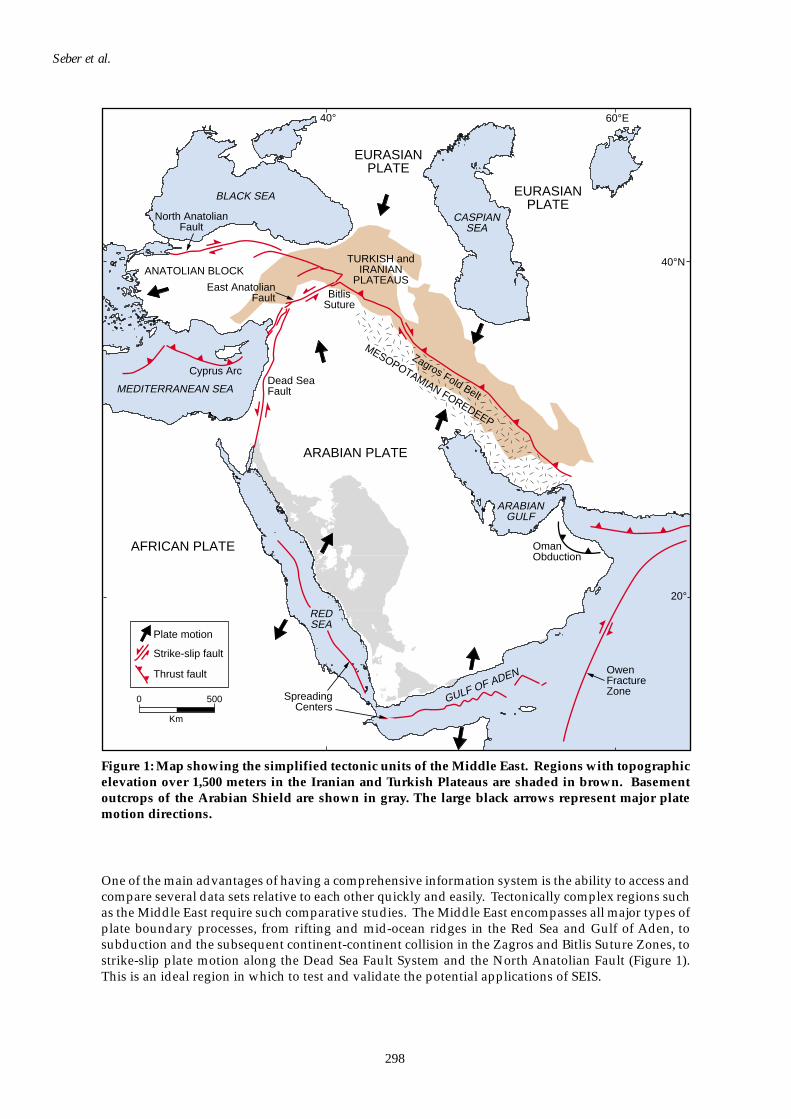
Oil and Gas FieldsThe distribution of oil and gas field in the Middle East region is also an important data set in SEIS.Fast on-line access to all oil and gas fields in the Middle East has important research implications. Wehave taken an initiative to compile all oil and gas fields in the region with their attribute information.These attributes include the name, depth, area, trap-type, and production level. Figure 12 shows theoil and gas fields in the Arabian Gulf region. This figure shows two distinct trends in the spatialdistribution of oil and gas fields in this region. One trend is the same as the Zagros trend, and the otheris a more north-south trend in the southern part of the Gulf. Undoubtedly, these trends are structurallycontrolled. More detailed studies must be performed to draw a clear boundary between the two
Figure 12: Map showing distribution of oil and gas fields in the Arabian Gulf. Red represents thegas fields and green the oil fields. A shaded-relief topography image in the background shows theZagros fold belt. Two major orientations in oil and gas fields are apparent from this image: fieldsin the Zagros fold belt follow the main southeast (Zagros) trend; to the south, however, the trend isnorth-south, indicating that the structure controlling these fields is different from that of the Zagrostrend.
IRAQ IRAN
SAUDIARABIA
UNITEDARAB EMIRATES
OMAN
ARABIANGULF
30°N
0 250
Km
25°
55°E50°45°
BAHRAIN
QATAR

309
Geo-Information Systems for the Middle East
trends and determine the factors that influence this distribution. Note that the majority of the oil fieldsin the Zagros region are located in the topographic embayment region, whereas they follow the trendof the Zagros folding. As the elevation increases along the same trend of the Zagros towards the south(Fars region) the number of oil fields is dramatically reduced.
Satellite ImagerySatellite imagery such as Landsat TM (Thematic Mapper) or SPOT provide valuable information aboutregional surficial features. More advanced satellite imagery such as Synthetic Aperture Radar (SAR)and Landsat 7 provide even more information. SEIS has been designed to take advantage of thesetypes of data as well. Currently, SEIS holds about 120 Landsat TM scenes covering various parts of theMiddle East and North America (Figure 13). In the near future SEIS will include additional scenes tocover the majority of the Middle East.
The imagery is not only used for mapping and geomorphologic analysis. Images are also valuablesources for innovative visualization. Visualization is increasingly important in geoscience research.The availability of powerful, fast computers and software have made what once was a painful task of
Figure 13: Locations of the TM satellite imagery that are held in SEIS. Satellite imagery are used inmany different studies, and they are a significant part of SEIS.
60°E
IRAN
EGYPT
IRAQ
TURKEY
SYRIA
SAUDIARABIA
OMAN
YEMEN
SUDAN
BLACK SEA
MEDITERRANEAN SEA
REDSEA
ARABIANGULF
ARABIAN SEA
GULF OF ADEN
CASPIANSEA
40°
40°N
20°
0 500
Km
1,000

310
Seber et al.
Figu
re 1
4: A
per
spec
tive
view
ob
tain
ed u
sin
gab
out 1
2 T
M s
cen
esd
rap
ed o
ver
the
top
ogra
ph
y of
the
east
ern
Tu
rkey
reg
ion
.T
he
inse
t map
sh
ows
the
app
roxi
mat
elo
cati
on o
f th
e ar
eash
own
.
NO
RTH
AN
ATO
LIA
N F
AU
LT
EA
ST
AN
ATO
LIA
N F
AU
LT
AN
ATO
LIA
NP
LA
TE
AU
LA
KE
VA
N
BL
AC
K S
EA
BIT
LIS
SU
TU
RE
N
TU
RK
EY
ME
DIT
ER
RA
NE
AN
SE
A
Enl
arge
d A
rea
BLA
CK
SE
A
050
0
Km
311
Geo-Information Systems for the Middle East
Figu
re 1
5: L
eft
- m
ap s
how
ing
cru
stal
-sca
le p
rofi
les
avai
lab
le i
n t
he
Mid
dle
Eas
t. I
nte
rpre
tati
ons
of th
ese
pro
file
s h
ave
bee
n d
igit
ized
an
den
tere
d i
nto
SE
IS.
Rig
ht: U
sers
can
sel
ect
any
of t
he
pro
file
s fr
om a
com
pu
ter
scre
en a
nd
dis
pla
y th
e cr
oss-
sect
ion
s.
Two
cros
s-se
ctio
ns
mar
ked
A-A
’ an
d B
-B’
on m
ap a
re s
how
n.
Pro
file
A-A
’ is
bas
ed o
ngr
avit
y m
odel
ing
and
val
ues
sh
own
rep
rese
nt
den
sity
in
form
atio
n i
ng/
cm3 .
Pro
file
B-B
’ is
a ve
loci
ty m
odel
an
d v
alu
es s
how
n r
epre
sen
t P
wav
e sp
eed
s in
km
/s.
200
400
600
800
40200
200
600
1,00
0
60
40
200
6.30
6.30
6.40
8.10
8.30
8.30
6.60
6.60
7.80
8.00
6.10
6.10
6.30
6.60
6.80
6.80
8.10
8.30
8.30
7.30
8.10
Dis
tanc
e (k
m)
Dis
tanc
e (k
m)
Depth (km)
Depth (km)
Sou
thw
est
Nor
thea
st
Sou
thw
est
Nor
thea
st
A
A
B
B’
A’
A’
BB
’
2.40
2.80
2.90
3.30
3.14
2.80
2.90
3.30
2.80
2.37
2.20
Sed
imen
tary
Sec
tion
Cru
stal
Roc
ks
Cru
stal
Roc
ks
Upp
er M
antle
Upp
er M
antle
IRA
N
IRA
QS
YR
IA
SA
UD
IA
RA
BIA
EG
YP
T
SU
DA
NY
EM
EN
OM
AN
TU
RK
EY
40°
60°E
40°N 20
°
01,
000
Km
AR
AB
IAN
GU
LF
AR
AB
IAN
SE
A
RE
DS
EA
ME
DIT
ER
RA
NE
AN
SE
A
CA
SP
IAN
SE
A

312
Seber et al.
creating advanced visualizations now a routine task. Figure 14 shows as an example a perspectiveview in eastern Turkey where the Arabian Plate collides with the Anatolian Block. Twelve mosaicedTM images are draped over the topographic data to obtain this image. The Bitlis Suture and majorfaults as well as the young volcanoes of the region are easily identified from this image.
Additional Sub-surface Data Sets
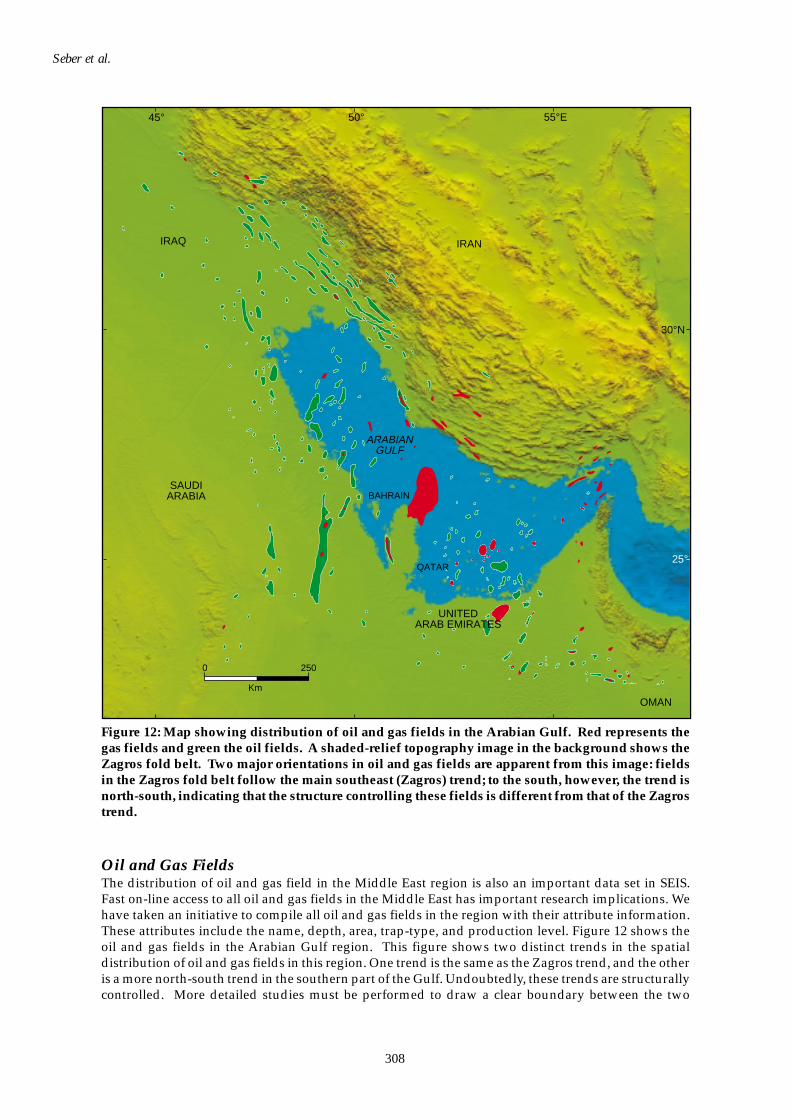
A well-designed geoscience information system must include sub-surface structure in addition tovarious types of data sets as described above. Data sets such as basement depth, Moho depth, depthdistribution of seismicity, seismic wave speeds, attenuation, and so on, are essential information ingeoscience research. SEIS includes such data sets. In order to obtain accurate basement and Mohodepths data for the Middle East, we have collected the locations and interpretations of over 60 crustalscale profiles in the Middle East region (Figure 15). Some of these profiles are interpretations of refraction
Figure 16: Depth-to-metamorphic basement in the Middle East. This map was obtained primarilyusing the profiles shown in Figure 15. Basement-sediment contacts from these profiles were selectedand gridded to obtain this map.
0
3
6
9
12
Mesopotamian Foredeep
Palmyride Trough
RutbahUplift
Km
TURKEY
EGYPT
ETHIOPIA
OMAN
YEMEN
SAUDIARABIA
IRAQ
JORDAN
SYRIA
IRAN
REDSEA
ARABIANGULF
ARABIAN SEA
MEDITERRANEANSEA
CASPIANSEA
GULF OF ADEN
40°N
60°E
20°
40°
0 500 1,000
Km
313
Geo-Information Systems for the Middle East
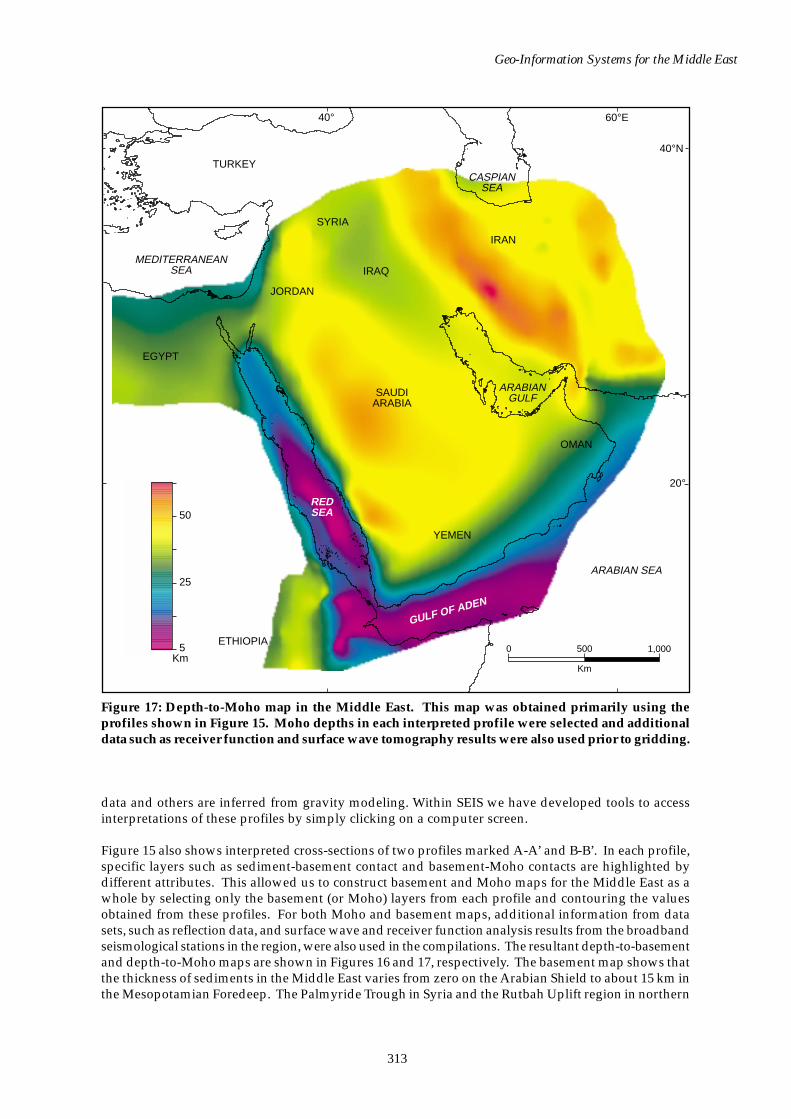
data and others are inferred from gravity modeling. Within SEIS we have developed tools to accessinterpretations of these profiles by simply clicking on a computer screen.
Figure 15 also shows interpreted cross-sections of two profiles marked A-A’ and B-B’. In each profile,specific layers such as sediment-basement contact and basement-Moho contacts are highlighted bydifferent attributes. This allowed us to construct basement and Moho maps for the Middle East as awhole by selecting only the basement (or Moho) layers from each profile and contouring the valuesobtained from these profiles. For both Moho and basement maps, additional information from datasets, such as reflection data, and surface wave and receiver function analysis results from the broadbandseismological stations in the region, were also used in the compilations. The resultant depth-to-basementand depth-to-Moho maps are shown in Figures 16 and 17, respectively. The basement map shows thatthe thickness of sediments in the Middle East varies from zero on the Arabian Shield to about 15 km inthe Mesopotamian Foredeep. The Palmyride Trough in Syria and the Rutbah Uplift region in northern
Figure 17: Depth-to-Moho map in the Middle East. This map was obtained primarily using theprofiles shown in Figure 15. Moho depths in each interpreted profile were selected and additionaldata such as receiver function and surface wave tomography results were also used prior to gridding.
TURKEY
EGYPT
ETHIOPIA
OMAN
YEMEN
SAUDIARABIA
IRAQ
JORDAN
SYRIA
IRAN
REDSEA
ARABIANGULF
ARABIAN SEA
MEDITERRANEANSEA
CASPIANSEA
GULF OF ADEN
40°N
60°E
20°
40°
0 500 1,000
KmKm
5
25
50

314
Seber et al.
Arabia are other regions with thick sedimentary cover. Triassic rifting in the Palmyrides is thought tobe responsible for this deep basin (Best et al., 1993). The estimated thickness of sediments along thePalmyrides fold and thrust belt reach about 12 km in the southwestern part (Seber et al., 1993). TheRutbah sediments are separated from the Palmyrides Trough by a narrow ridge. The estimated thicknessof sediments in the Rutbah region is more than 8 km.
Similarly, the Moho depth map in the Arabian Peninsula shows that the Moho varies from about 5 kmdeep in the southern Red Sea region to about 55 km in the central Zagros Mountains. Depth-to-Mohovariations in Arabia are relatively constant with an average depth of about 40 to 45 km whereas Mohodepths in Iraq and Egypt are shallower. One of the significant changes in Moho depth occurs acrossthe Oman Line. A change of about 10 km in depth-to-Moho from the Zagros to Makran region isinferred from gravity interpretations (Dehghani, 1981). The Oman Line also marks a region where thestrike of faults change, topography shows a lineament, and seismicity is terminated abruptly, allindicating that the Oman Line is a structure of lithospheric scale.
The shallowest on-land Moho in the Middle East region is in the Afar Triangle region. At this localitythe estimated Moho depth is about 8 km (Sandvol et al., 1998). A simple geometrical relationship on
Figure 18: Topography of the southern Red Sea and Afar regions. The escarpments on each sides ofthe Red Sea mark approximate rifting locations. The hatched zone indicates possible amount ofopening due to Red Sea spreading center. Holocene volcanoes are plotted as solid triangles. TheAfar Triangle, with a very thin crust (see Figure 17), is assumed to be underlain by newly formedoceanic-type crust.
AFRICA
ARABIA
AFAR TRIANGLE
REDSEA
GULF OF ADEN
20°N
0 500
Km
50°E
10°
40°

315
Geo-Information Systems for the Middle East
both sides of the Red Sea suggests that the Afar Triangle has filled the gap that was opened by therifting of the southern Red Sea. The topographic escarpments on each side of the rift mark theapproximate location of the initial rifting. The shaded area in Figure 18 can then be considered aregion of recent opening along the Red Sea rift. The least constrained Moho depth in our compilationis in the southeastern corner of Arabia where information is very limited.
To take advantage of these new Moho and basement maps and to give SEIS users a tool to makecrustal-scale sections between two arbitrary points, we have developed a Profile Maker tool. Thisinteractive tool allows users to extract profiles from any of the gridded data sets in SEIS. Users simplyselect layers such as topography, basement, and Moho, mark the two endpoints of the profile, andextract a crustal-scale profile between the two points. Figure 19 shows such a crustal-scale cross-section. SEIS allows users to create ASCII files of these extracted cross-sections. Later, they can beused in other modeling programs such as gravity modeling or seismic modeling to better understandthe sub-surface structure in the region. In addition to crustal sectioning, the Profile Maker tool in SEISallows the projection of earthquake hypocenters within a user-specified distance from the profile ontothe cross-section. This allows more a comprehensive view of the seismicity in any region.
Other sub-surface data sets in SEIS are seismic Pn speed variations in the Turkish and Iranian Plateaus,seismic Lg wave attenuation, and hypocenter distribution of seismic events.
Figure 19: Map and a cross-sectionshowing the results of the Profile Makertools available in SEIS. The Profile Makertool is used to extract a cross-sectionbetween two arbitrary points from anygridded data set. In this cross-section, aneast-west profile in northern Arabia isselected and seismicity from the ISCdatabase is projected onto this plane. Thistool allows studying cross-sectionalstructures in any region where data sets areavailable. The dashed lines on the maprepresent area where earthquakes areprojected on the cross-section.
0
50
0 400 800 1,200Distance (Km)
Dep
th (
Km
)
Sedimentary Rocks
Basement
MOHO
Mantle
Dead Sea Fault
ZagrosMountains
Mesopotamian Foredeep
40°N
20°N
60°E40°E
MEDITERRANEANSEA
ARABIANGULF
GULF OF ADEN
REDSEA
0 500
Km
EGYPT
SAUDIARABIA
OMAN
YEMEN
SUDAN
IRANIRAQ
SYRIA
TURKEY

316
Seber et al.
Tectonic Applications
As discussed in the building of a GIS system, data sets can be used as individual entities or moreeffectively they can be used in a multidisciplinary analysis of a region. For example, by utilizing someof the data sets one can look at the tectonics of the Zagros Mountains (Figure 20) and Anatolia (Figure 21).
Zagros MountainsTopographic data viewed as a shaded relief image provide an easy way to visualize the entire mountainchain, with its fold axes, fore-arc basins, and volcanic arc. Overlaying seismicity data on top of thetopographic map indicates that only the frontal margins of the Zagros fold belt are seismically active.The southeast trend of seismicity along the Zagros Mountain belt makes a bend in the topographicembayment area and trends east-west for about 250 km. Then, it continues in the general southeasttrend until it reaches the Oman Line in southwest Iran. At the Oman Line, the Zagros seismicity stopsabruptly, indicating that a major deformational change takes place at this boundary. The topographymimics these changes. The focal mechanisms solutions in the Zagros Mountains have nodal planesconsistent with the fold axes and indicate that the folds are still active as the Arabian Plate pushes intothe Eurasian Plate.
Figure 20: Southern Zagros tectonic map showing major faults, volcanics, and focal mechanisms ofCMT and Cornell (MENA) catalog. The majority of seismic events show thrust type fault planesolutions with main compression axes perpendicular to the Zagros trend. The numbers represent(1) Zagros Suture; (2) Fore-arc Basin; (3) Volcanic Arc; (4) Fold belt; (5) Arabian Platform; and (6)Oman Line.
Undifferentiated Faults
Cornell database
CMT database
Paleogene volcanics
Quaternary/Neogenevolcanics
Earthquake epicenters
1
2
3
45
6Normal Faults
Thrust Faults
IRAQ
ARABIANGULF
IRAN
0 250
Km55°E50°
30°
35°N

317
Geo-Information Systems for the Middle East
AnatoliaIn the northern part of the Arabian Plate the collision between Arabia and Anatolia is occurring alongthe Bitlis Suture and the East Anatolian Fault Zone. Some of the deformation resulting from thiscollision is taken up internally within the Turkish Plateau to form the high topography in easternTurkey. A component of the convergence is accommodated by the westerly escaping Anatolian Block.This escape takes place along the North Anatolian and East Anatolian Faults (Figure 1). Recent geodeticmeasurements based on Global Positioning Systems (GPS) in Turkey and the surrounding regionsdetermined both the internal shortening and the escape directions and rates (Reilinger et al., 1997). Weincluded these GPS results in SEIS and developed tools to analyze the data. Figure 21 shows the GPSvectors in Turkey and surrounding regions. The GPS displacement vectors indicate counter-clockwiserotational movement of the Anatolian Block relative to Eurasia. They indicate that not much shorteningoccurs along the Bitlis Suture Zone as relative motions both to the south and to the north of the suturezone show similar values. However, significant variations in GPS vector directions are observed northand south of the North Anatolian Fault. Another important conclusion from the analysis of GPS andsurface faulting is that in the western part of Turkey the amount of displacement increases towardsthe Aegean Sea where Aegean extension dominates the regional tectonics. This is interpreted to be aresult of the extension in western Turkey and subduction in the Aegean.
The right-lateral strike-slip motion along the North Anatolian Fault is evident from the relative GPSvelocity vectors. In the western part of the North Anatolian Fault near the Sea of Marmara, the faultsplits into two main segments (Figure 22). The GPS data, topography, and local seismicity collectivelyindicate that the northern strand is more active than the southern one. This observation has significantimplications for seismic hazard studies as the most populated city in Turkey, Istanbul, and much ofthe country’s industry are located within a few tens of kilometers of this fault. The two most recentearthquakes that occurred on August 17 and November 12, 1999 (Mw=7.4 and Mw=7.1, respectively)confirm the conclusion that the northern strand is more active and capable of producing largeearthquakes (Figure 22). These earthquakes produced significant damage and loss of lives.
Figure 21: Global Positioning System (GPS) displacement vectors in and around Turkey obtainedfrom Reilinger et al. (1997). GPS vectors indicate counter-clockwise rotation of the Anatolian Blockand shortening in eastern Turkey. The North Anatolian Fault marks a region where magnitudes ofGPS displacement vectors change significantly due to this fault’s right-lateral motion. Along theBitlis Suture shortening does not seem to be significant. The majority of the shortening occurfarther north in northeastern Turkey and in the lesser Caucasus.
20 mm/year
North Anatolian Fault
Bitlis SutureIRAN
TURKEY
SYRIA IRAQ
BLACK SEA
MEDITERRANEAN SEA
30° 40°E
40°N
0 250
Km
East Anatolian Fault

318
Seber et al.
It is clear that seismic hazard mitigation studies in the region need to be re-evaluated oncecomprehensive information systems are developed. Other seismically active regions of the MiddleEast, such as the Dead Sea Fault System and the Zagros Mountain belt, can also benefit from suchcomprehensive information systems. Not only seismic hazard, but also other natural hazard studieswill benefit significantly from organized information systems.
OPEN ACCESS TO SOLID EARTH INFORMATION SYSTEM (SEIS)VIA THE WORLD WIDE WEB
One of the most important aspects in developing a successful information system is its accessibility.Users should be able to access the information easily and efficiently. Today, the Internet providesunprecedented opportunities to build such open systems. We have developed SEIS as an efficient andsophisticated application to be used in WWW browsers for accessing and plotting data and information.This application not only provides access to data sets in SEIS, but also allows users to register theirown data sets and combine them with those of SEIS.
The WWW address for accessing SEIS is http://atlas.geo.cornell.edu. The application starts in a webbrowser as shown in Figure 23. The web interface enables users to create and display maps interactively.The map area in the application is dynamic and receives input from the computer mouse or accessbuttons; users can also zoom in on any region by drawing a box on the map area. Users can select anydata sets that they would like to see in a given region, change the plotting parameters of each data set,and identify features and view attribute information on maps directly from their web browsers. Theweb site includes a detailed users’ guide.
Similar versions of most of the figures shown in this paper can be duplicated from the WWW application.For example, if a user would like to combine the geologic data shown in Figure 5 and tectonicinformation shown in Figure 6 near the Dead Sea Fault region and northern Arabia, by selecting properdata sets from the web application the user can obtain the map shown in Figure 24. The map extent,data sets to be plotted, and other plotting parameters are all user-defined and can be changed at anytime during the analysis of data sets. This efficiency and availability make SEIS a powerful tool forresearchers and educators.
Figure 22: Map showing active faults, GPS displacement vectors, and seismicity (orange dots) inthe Sea of Marmara region of Turkey. The North Anatolian Fault splits into two segments about 150km east-southeast of Istanbul. The GPS results indicate that the northern strand is moving faster.
North Anatolian Fault
Mw= 7.4 Mw=7.1August 17, 1999 November 12, 1999
20 mm/year
32°E
42°N
40°
30°30°26°
BLACK SEA
SEA OFMARMARA
BULGARIA
GREECE
TURKEY
Istanbul
0 100
Km

319
Geo-Information Systems for the Middle East
CONCLUSIONS
The need for comprehensive geoscience information systems in research and education isoverwhelming. Examples shown in this study provide detailed explanations about an informationsystem that will lead to better and more efficient research studies in many parts of the world. Applicationof SEIS to the Middle East tectonics has already shown that using organized information systems ingeoscience research has a significant return. The success of future geoscience research relies on howefficiently and effectively researchers can access multidisciplinary and voluminous data sets in their
Figure 23: Recently developed web page for SEIS. Users anywhere with an Internet connection canaccess SEIS via this interface and make their own maps and analyze data sets. The address foraccessing this page and relevant documentation is http://atlas.geo.cornell.edu.

320
Seber et al.
analysis. As our understanding of the Earth increases, it is becoming clearer that cross-disciplinarytechniques must be utilized to achieve a higher level of understanding. For this it is unavoidable thatsimilar information systems must be developed not only in the geosciences, but in other scientificfields as well. It is no longer a scientific fantasy to think about developing unified information systemsthat encompass the natural, physical, biological, and social sciences to better understand the workingsof our home planet.
Figure 24: The web server allows interactive access to majority of data set in SEIS. Users can selectany data set(s) and a region and display their selection. The web application also allows users toidentify features displayed in maps and upload their own data to be plotted with existing data setsin SEIS. Selected “geology” and “ME Faults” are shown in this web page.

321
Geo-Information Systems for the Middle East
ACKNOWLEDGMENT
This research is supported by the United States Department of Defense and the United StatesDepartment of Energy under grants DSWA01-97-1-0006 and F19628-95-C-0092, respectively. Institutefor the Study of the Continents contribution number 259.
REFERENCES
Best, J.A., M. Barazangi, D. Al-Saad, T. Sawaf and A. Gebran 1993. Continental Margin Evolution ofthe Northern Arabian Platform in Syria. American Association of Petroleum Geologists Bulletin,v. 77, p. 173-193.
Dehgahni, G. 1981. Schwerefeld Und Krustenaufbau Im Iran. PhD Thesis. University of Hamburg,Hamburg, 74 p.
Kirkham, R.V. 1995. Generalized Geological Map of the World. Geological Survey of Canada, OpenFile 2915d, Ottawa, Canada, one CD-ROM.
Montgomery, D.R. 1994. Valley Incision and the Uplift of Mountain Peaks. Journal of GeophysicalResearch, v. 99, p. 13, 913-13, 921.
Pollastro, R.M., A.S. Karshbaum and R.J. Viger 1997. Maps Showing Geology, Oil and Gas Fields andGeologic Provinces of the Arabian Peninsula. U.S. Geological Survey Open-File Report 97-470B,one CD-ROM.
Reilinger, R.E., S.C. McClusky, M.B. Oral, R.W. King, M.N. Toksoz, A.A. Barka, I. Kinik, O. Lenk and I.Sanli 1997. Global Positioning System Measurements of Present-Day Crustal Movements in theArabia-Africa-Eurasia Plate Collision Zone. Journal of Geophysical Research, v. 102, p. 9,983-9,999.
Sandvol, E., D. Seber, A. Calvert and M. Barazangi 1998. Grid Search Modeling of Receiver Functions:Implications for Crustal Structure in the Middle East and North Africa. Journal of GeophysicalResearch, v. 103, p. 26,988-26,917.
Seber, D., M. Barazangi, T. Chaimov, D. Al-Saad, T. Sawaf and M. Khaddour 1993. Upper CrustalVelocity Structure and Basement Morphology Beneath the Intracontinental Palmyride Fold-ThrustBelt and Northern Arabian Platform in Syria. Geophysical Journal International, v. 113, p. 752-766.
Seber, D., M. Vallve, E. Sandvol, D. Steer and M. Barazangi 1997. Geographic Information Systems(GIS) in Earth Sciences: An Application to the Middle East region. Geological Society of AmericaToday, v. 7, p. 1-5.
Walker, D.J., R.A. Black, J.K. Linn, A.J. Thomas, R. Wiseman and M.G. D’Attilio 1996. Development ofGeographic Information Systems-Oriented Databases for Integrated Geological and GeophysicalApplications. Geological Society of America Today, v. 6, p. 1-7.
ABOUT THE AUTHORS
Dogan Seber is a Research Scientist in the Institute for theStudy of the Continents (INSTOC) at Cornell University.He earned a BS in Geophysics at Istanbul Technical University,an MS in Seismology at St. Louis University, and a PhD inSeismology at Cornell University. His doctoral researchincluded the analysis and interpretation of seismic and gravitydata for determining the crustal and lithospheric structure ofthe Atlas and Rif Mountains in Morocco and the PalmyridesMountains in Syria. He also worked on the application ofGIS to geologic research. His recent research focuses ondeveloping information systems for the geosciences. He has designed and developeda system for analysis and distribution of large and organized databases.

322
Seber et al.
David Steer is an Assistant Professor at the University of Akron.His academic background includes a BS in Engineering at the UnitedStates Military Academy and an M.Eng. in Applied Physics andPhD in Geophysics at Cornell University. His recent research focuseson developing a digital database of global seismological, geophysical,and geological data. His doctoral research included the analysis andinterpretation of deep seismic reflection data from the MontanaWilliston Basin and the Russian Ural Mountains for determiningthe crustal and lithospheric structure of ancient mountain belts.
Eric Sandvol is a Research Scientist in INSTOC at CornellUniversity. He earned a BS in Physics at the South Dakota Schoolof Mines & Technology and a PhD in Physics and Seismologyfrom New Mexico State University. His current research entailsusing waveform analysis to characterize crustal and upper mantleseismic velocity and attenuation in the Middle East and NorthAfrica. His doctoral research involved the observation andinterpretation of mantle seismic anisotropy in regions includingPakistan, Tibet, the Rio Grande rift, and the Japan subduction zone.
Christine Sandvol is a Research Support Specialist in INSTOCat Cornell University. She earned a BA in Physics at WashingtonUniversity and an MS in Geophysics at Cornell University. Shecurrently modifies and formats data for inclusion in the MiddleEast and North Africa database. Her masters research employedseismic modeling to study the feasibility of using the seismicreflection technique for paleoseismic research.
Carrie Brindisi is a Research Support Specialist in INSTOC atCornell University. She holds a BA in Geology from HartwickCollege. She currently works with satellite imagery as well ascreating and manipulating data sets for inclusion in the Cornelldatabase system. Her thesis work focused on a comparison ofstructure and stratigraphy in the southern French Alps.
Muawia Barazangi is a Professor in the Department of GeologicalSciences at Cornell University, Associate Director of INSTOC,and leader of the Cornell Middle East Project. His academicbackground includes a BS degree in Physics and Geology fromDamascus University, Syria, an MS in Geophysics from theUniversity of Minnesota, and a PhD in Seismology from ColumbiaUniversity’s Lamont-Doherty Earth Observatory. His researchhistory includes global tectonics, the seismotectonics of continentalcollision zones, intracontinental mountain belts, and Middle Easttectonics.
Manuscript submitted: August 10, 1999Revised: December 17, 1999Accepted: January 3, 2000