design and development a novel web-based gis for surveillance
TRANSCRIPT

Innovative Systems Design and Engineering www.iiste.org
ISSN 2222-1727 (Paper) ISSN 2222-2871 (Online)
Vol 3, No 6, 2012
42
Design and Development a Novel Web-based GIS for
Surveillance and Monitoring of Diarrhea by Using of Free Open
Source Software
Teerawong Laosuwan* Poramate Chunpang
Department of Physics, Faculty of Science, Mahasarakham University
Khamriang; kantarawichai, Mahasarakham 44150, Thailand
* E-mail of the corresponding author: [email protected]
Abstract
The prevalence of diarrhea is viewed as a serious problem greatly affecting the society. The plan to prevent and
control the spread of diarrhea requires large amounts of data for data processing. Disease prevalence situation is still
represented in elusive form. Therefore; to create people understands of diarrhea conditions; a Web-based GIS was
developed for surveillance and monitoring of diarrhea in Mahasarakham Province. The main gold of this study was
to represent statistical data on diarrhea collected during 2008-2011 by applying Free Open Source Software GIS
technology for surveillance and monitoring of diarrhea in Mahasarakham Province. Besides; it aimed to represent
novel spatial data and attribute data on diarrhea via internet network; facilitating data view in map form as well as
planning surveillance and monitoring of diarrhea with GIS technology. Results found that a novel Web-based GIS
user-friendly system for surveillance and monitoring of diarrhea is efficient and practical. People can access data at
anytime from anywhere with an internet connection.
Keywords: Web-based GIS; Surveillance and monitoring; Diarrhea; Free Open Source Software
1. Introduction
Population increase; fast urbanization; environmental poverty; and the misuse of antimicrobials have disrupted
the equilibrium of the microbial world; causing the rise of new emerging diseases (WHO 2009a). The Information
of health is helping people to know health phenomena; mitigate disease outbreaks; and analyze disease etiology.
Nevertheless; mainly public health departments typically collect data as needed and maintain it locally; and this
unavoidably limits the access to important public health data for health researchers and the public (Bédard et al.
2003; WU et al.2005; Jin et al. 2005).WHO (2010b) Pointed out that keeping disease outbreaks secret is no longer
feasible and sharing essential health information is one of the most feasible routes to global public health security.
Currently; many health departments have begun to provide public access to their health statistics via the Internet; and
this promotes interest in user involvement and dataset exploration (Toubiana et al. 2005). Diarrhea is considered as
an epidemic disease causing several problems in Thailand; especially Mahasarakham province. Diarrhea poses a
great impact on affected Mahasarakham people in each year. WHO (2007) definition of diarrhea; it refers to the
condition that affected people have more than three times loose or liquid stools a day or blood in stools at least one
time within 24 hours. People have normal stools or newborn babies have soft or liquid stools; though high frequent
excretion is not those who develop diarrhea.
People who are experiencing acute diarrhea may excrete soft or watery stools for several hours or several
days; usually within 7 days However; if its symptom takes longer than two weeks; it is called as persistent diarrhea.
If it takes longer than 3 weeks; it becomes a chronic diarrhea (Lamduan 2011). Therefore; the epidemic data
representation is very important step for surveillance and monitoring; control and prevention of epidemic disease
incident. The efficient use of information and news about epidemic disease surveillance requires improved and
quality epidemic information and news. This means data must be timely; complete; and accurate. Presently the
epidemics disease as broader is impacts throughout many provinces. All people have a risk of developing the
epidemic disease because of their changing lifestyle and work conditions. Therefore; people in Mahasarakham
province have suffered many troubles. Currently; the prevalence of epidemic disease is a serious problem influencing
social; political and economic factors.

Innovative Systems Design and Engineering www.iiste.org
ISSN 2222-1727 (Paper) ISSN 2222-2871 (Online)
Vol 3, No 6, 2012
43
The geographic information system (GIS) is applied in the form of data storage; analysis and evaluation to
support surveillance and monitoring of disease outbreaks (Chaput et al.2002; Richardson et al.2004; Wiafe et al
2005). GIS can collect data including geographic areas of epidemic disease incident; epidemic data and statistics;
statistics of patients who have epidemic disease at hospitals; public health data in Mahasarakham province; different
species of bacteria in each area; high risk areas and surveillance zones that must eliminate source of disease etc.
Those types of data can be analyzed by GIS (in the form of spatial data) (Beale et al.2008; Laosuwan et
al.2011). Besides; physical data in each area can be analyzed to support decisions and administration. Evaluating
the epidemic risk in affected areas in Mahasarakham province can support surveillance and monitoring of
widespread epidemics in other areas. There is efficient monitoring of diarrhea situations in surveillance areas to
prevent; improve and alleviate diarrhea incident situations in dynamic and sustainable manner. To facilitate GIS
sharing; the Open Geospatial Consortium (OGC) concentrates on the development of interoperable geospatial
standards that are independent of industrial vendors. It initiated the Open Web Service (OWS) program based on
Web Services; and has proposed several geospatial specifications to support geospatial data sharing and
interoperability. The framework of OWS contains five main categories of services: client services; registry services;
processing-workflow services; portrayal services; and data services (OGC 2003). Dozens of Geospatial Web Service
specifications have been proposed or adopted by OGC; such as Web Map Service (WMS); Styled Layer Descriptor
(SLD); Web Map Context (WMC); Geography Markup Language (GML); Web Feature Service (WFS); Web
Coverage Service (WCS); Keyhole Markup Language (KML); and Web Processing Service (WPS) (OGC 2004; SDI
2011). The objective of this study was to design and development novel web-based GIS and applies spatial data for
surveillance and monitoring diarrhea as an epidemic in Mahasarakham province via internet network by using Free
Open Source Software (FOSS).
2. Scope of the study
2.1 Location
In this study; Mahasarakham province; consists of 13 districts; 133 sub-districts and 1804 villages was
selected as a study location as shown in Figure 1. Mahasarakham is bordering with Kalasin to the north; Surin and
Buriram to the south; Roi-Et to the east and Khon Kaen to the west. For political and administrative structure; areas
in Mahasarakham are divided into 13 districts; 133 sub-districts and 1804 villages. The province has the total
population of 940911 of whom male’s forms 466 552 and females form 474 359 in 2011.
2.2 The development of Web-based GIS
The main goal of Web-based GIS is to make spatial data and attribute data and available to specific end-user;
and potentially to the community. The application allows the end-user to view spatial data and attribute data using a
web browser; and without GIS; it provides interactive query capabilities and integrates the GIS solutions with other
technologies. The spatial data and attribute data can be developed through internet according to server or client
applications. Generally; server applications generally have a limited user interface and a low performance; while the
client solutions are affected by software and data distribution limitations i.e. mainly platform incompatibility and
problems loading software. Rapid performances and commanding user interfaces are required when GIS technology
is applied on the internet. In this study; the disadvantages of both solutions (client and server) are improved. A
Web-based GIS was developed with Free Open Source Software (FOSS) i.e. Apache Web Server; UMN Map Server;
PHP; PHP My Admin; My SQL and HTML. In this research; the important brief descriptions are given as following:
Apache Web Server (Apache Ant 2004; Apache Web Server 2011). The FOSS Apache Web Server component uses
the Hypertext Transfer Protocol (HTTP) to portray project information and data in tabular and Web‐Based GIS
formats over the World Wide Web (WWW). This is the component that puts the information coming from the Map
Server; the RDBMS in a simple format that can be read with a simple web browser (e.g. Internet Explorer; Firefox;
etc.) and does not demand high computer or network power.
2.2.1 UMN Map Server (UMN Map Server 2011);
The FOSS map server component is a customized software environment that provides the elements necessary
to build spatially enabled internet applications (web services) that have the ability to respond to spatial queries by
creating customized maps on the fly. The University of Minnesota through a NASA sponsored project. The package

Innovative Systems Design and Engineering www.iiste.org
ISSN 2222-1727 (Paper) ISSN 2222-2871 (Online)
Vol 3, No 6, 2012
44
is a free alternative to other commercial applications; and it is a good solution when highly customized applications
are needed. Map Server is a Computer Graph Interface (CGI) programmed that sits inactive on the web server. A
request is sent in HTML format with the correct data metafile (Map File) and the server program creates and delivers
an image of the requested data. Map Server provides a scripting interface for the construction of web and stand-alone
applications; adding Web-based GIS capability to popular scripting languages (FREE GIS 2011). Map Server needs a
strong skilled programmer to develop the Web-based GIS application. It also provides the ability to display satellite
imagery and derived products. The map server is a set of programs that sit inactive in a computer waiting for requests
to build maps or send information related to the maps. When a request is sent to the map server; it uses the
parameters sent in the request to build its own request to the Spatial Data Engine (SDE) and when the SDE returns
the information; it builds mapping and a string with the response. That response is sent to the web server where it is
integrated with other elements.
2.2.2 Relational Database Management System (RDBMS)
The FOSS of Web-based GIS or Surveillance and Monitoring of Diarrhea store all data using MySQL (My
SQL 2011). Data include maps in vector format; satellite imagery in raster format and tabular data associated with
the maps; satellite images and even data of higher dimension which includes time. The diarrhea data was acquired
from Mahasarakham Provincial Health Office (MPHO) during 2008-2011 (MPHO 2011). In this study
surveillance and monitoring of diarrhea in Mahasarakham province was analyzed and divided into four different
levels of risk area that is; 1st risk level means area with high level of risk; 2
nd risk level means area with moderate
level of risk; 3rd
risk level means area with low level of risk; and 4th risk level means area with no level of risk.
3. Methodology
The conceptual data was collected and analyzed to design and develop novel Web-based GIS in order to
represent data via internet network as shown in Figure 2; Figure 3 shown flowchart of the study and figure 4 shown
data flow diagram of the study.
3.1 Data collection
Epidemics data; patient statistics; and epidemic surveillance and diarrhea data were collected to compare
various levels of risk in each area. Data must be accurate and meet demand. In this study; data during 2008-2011 was
collected.
3.2 Data analysis
After collecting data about diarrhea; data was analyzed to develop a novel Web-based GIS as a system model for
surveillance and monitoring of diarrhea. The determination whether some symptoms are viewed as a diarrhea
depends on several reasons:
3.2.1 Whether disease incidence rate is higher than normal rate; related to timing and geographic locations of
disease incidence
3.2.2 Whether rate of increase in disease incidence is statistically significant
3.2.3 Whether type of disease has ever been seen in the local
3.2.4 The severity of disease and
3.2.5 The rapidity of disease prevalence.
3.3 The structural design of web application
3.3.1 A system database is used for data storage; calculation and representation. Such data
requires population data as follows;
3.3.2 Data of population who had ever experienced diarrhea in the area in the same period of time.
3.3.3 Data of population who had ever experienced diarrhea in the area in the past five years.
3.3.4 Data about determination of diarrhea symptoms such as risk factors for diarrhea causes of diarrhea.
3.3.5 Data of geographic coordinate for showing locations found patients with diarrhea.

Innovative Systems Design and Engineering www.iiste.org
ISSN 2222-1727 (Paper) ISSN 2222-2871 (Online)
Vol 3, No 6, 2012
45
3.4 Map File Language (MFL)
All of spatial data in Mahasarakham province writing by using Map File Language (MFL) for example in this
study illustrate in Figure 5.
3.5 System development
The system developed has functions of the connection between database system and GIS. Moreover; such
data is connected with government agencies. Its main function is that when the system finds diarrhea prevalence; the
system will connect to GIS to notify which location has diarrhea prevalence. At this point; the system will show how
to protect ourselves from diarrhea with basic functions of a Web-based GIS for surveillance and monitoring diarrhea
in Mahasarakham province.
3.6 Map representation
Map representation has function to show geographic location found patients with diarrhea. At this part; data is
recorded and geographic location of diarrhea incident is represented by using different colors; reflecting severity of
the disease.
3.7 Results report
The results report has function to show numbers of patients. Such data can be viewed in each district;
Mahasarakham. Moreover; this part is still report disease incident rate; morality rate caused by diarrhea; geographic
location risk for epidemic prevalence.
3.8 Database system
Database system has function for data manipulation and representation since there is notification via website.
When a patient is accepted through the system; data of that patient is recorded or stored in the database as well as
data processing. If any geographic area is risk for diarrhea; the system will notify data in novel Web-based GIS.
4. Results
In this research project has established the pilot project area sites and developed novel Web-based GIS for
surveillance and monitoring diarrhea at in Mahasarakham province. Our early efforts as part of this project are to
complete work in Mahasarakham province. In addition to greater awareness and understanding about surveillance
and monitoring diarrhea. The study Web-based GIS was developed to clearly represent data and statistics and
numbers of diarrhea incident. Geographic information system was applied to support spatial data design and
descriptive database. Moreover data was represented via internet network. The system developed can be divided into
two major parts: 1) spatial database system and 2) a novel Web-based GIS’s data representation for surveillance and
monitoring epidemics in Mahasarakham province as the following detail.
4.1 Spatial database system
Spatial database system is on a novel Web-based GIS for surveillance and monitoring diarrhea in
Mahasarakham province. In this study; spatial data layer represented diarrhea statistics has polygon feature. Such
data layer represents data about sub-districts in Mahasarakham; statistics of diarrhea incident; disease incident during
2008-2011. Data was divided into sub-districts in Mahasarakham province. Data was mapped out to represent
diarrhea mapping in sub-districts as shown in Figure 6. Data and statistics of diarrhea are shown in Table 1.
4.2 Data representation system on a web-based GIS
Mapserver was applied as a FOSS was used as Map server’s application. Therefore the system can represent
data of novel Web-based GIS for surveillance and monitoring diarrhea in Mahasarakham province in maps form via
internet network. Initially the webpage show information on how to use the website (See in Figure 7).
Also it can create map’s components and functions for data access at anytime from anywhere with an internet
connection. In this study results of designing a Web-based GIS for surveillance and monitoring diarrhea were shown
as system and tools testing results as follows:
4.2.1 Results for the initial use of the system
Data output revealed diarrhea data during 2008-2011 at sub-districts level. Normal people can access data.

Innovative Systems Design and Engineering www.iiste.org
ISSN 2222-1727 (Paper) ISSN 2222-2871 (Online)
Vol 3, No 6, 2012
46
Then; data output was tested as follows: map of data layer about diarrhea statistics; map of sub-districts scope; map
of provincial scope; index map; x coordinate; y coordinate in the form of UTM WGS84 Zone 48; Scale Bar; and
Scale Text. Moreover; data representation in every layer and components of map representation were tested as shown
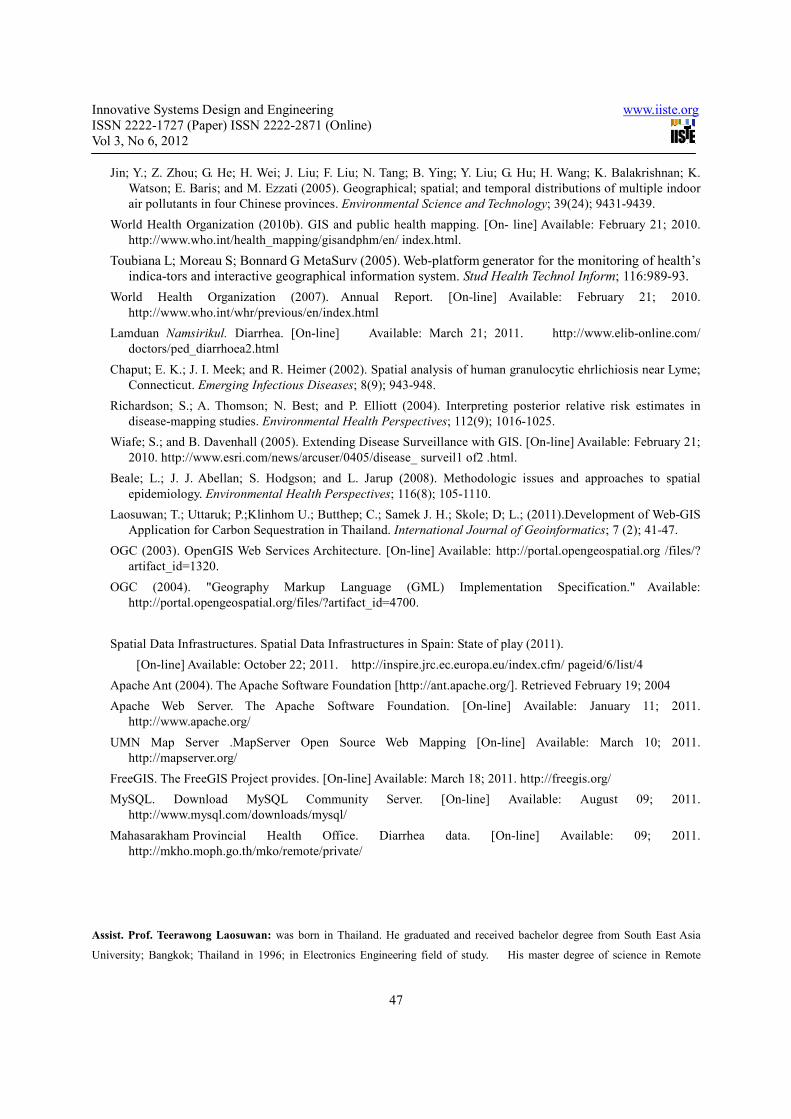
testing results as follows: (see in Figure 6 shown the spatial data and Figure 8 illustrate data query from spatial data).
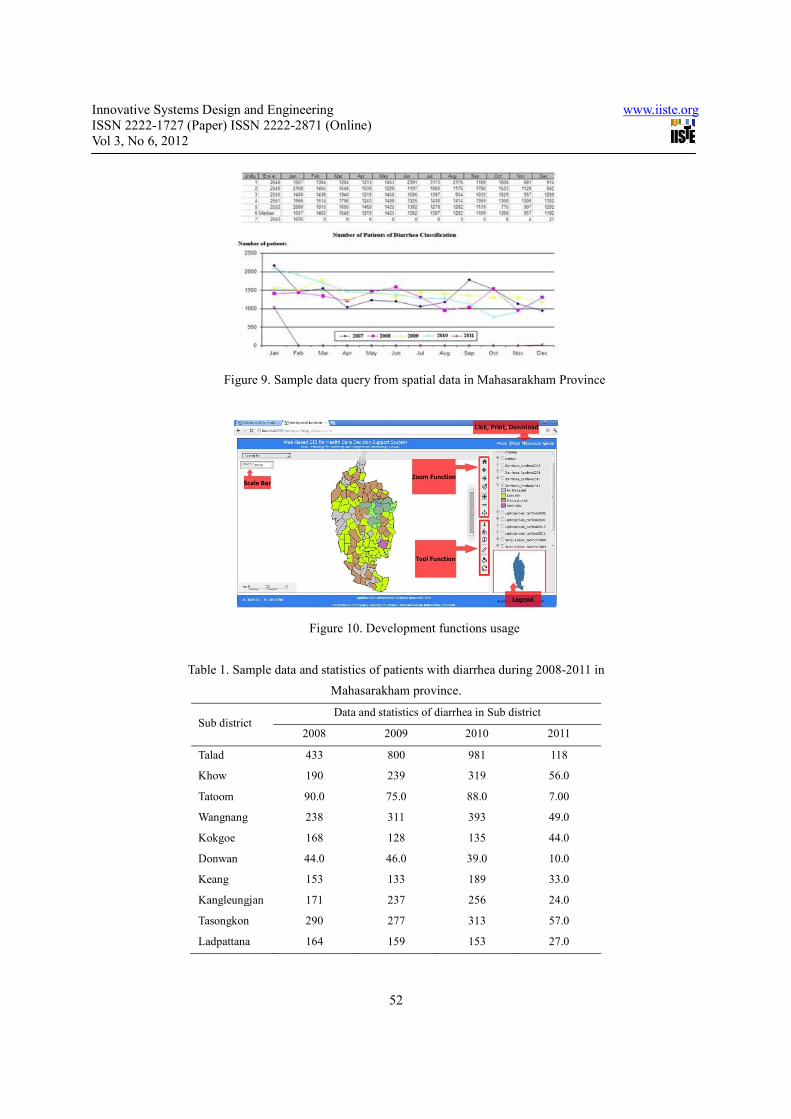
4.2.2 Development functions
We development more functions include novel Web-based GIS for surveillance and monitoring diarrhea in
Mahasarakham province as follows; Zoom In; Zoom Out; Zoom to Full Extent; Zoom to Select; Zoom Pan;
Identify; Select; Measure; Refresh Map; Resolution; Print Map (see in Figure 8)
5. Conclusion and discussion
The pilot project studies on the understandability and user-friendly; the participation of people in
Mahasarakham. A survey instrument was developed in order to collect basic data of user access in Web-based GIS
for surveillance and monitoring of diarrhea. The survey form was distributed to person in Muang district;
Mahasarakham Province on October 2011; and 398 (n=398) survey forms responded. The instrument revealed that
the majority of users (69%) found the website easy to use and navigate. The Graphics User Interface was perceived
as a good system of presenting the information. However; a number of users (31%) indicated that the absence of a
more readily available legend (i.e. an alternative to having to select the legend menu) was a main drawback when
understanding the spatial data.
The application of GIS technology to create diarrhea database in Mahasarakham province allows the system
user to gain spatial database; which represent as spatial data. Also the integrated system was developed with UMN
Map Server; Apache Web Server; P. Mapper; PHP; PHP My Admin; My SQL and HTML. Those programs are open
source software with free of charge for software license. Data about diarrhea was collected from Mahasarakham
provincial health office during 2008-2011. In this study; monitoring of diarrhea in Mahasarakham province was
divided into four different levels of risk in the area namely; 1st risk level means area with high level of risk; 2
nd risk
level means area with moderate level of risk; 3rd
risk level means area with low level of risk; and 4th risk level means
area with no level of risk. The work process as mentioned above; obviously a novel Web-based GIS enhances the
efficient representation diarrhea data and statistics in Mahasarakham province collected data during 2008-2011.
Relevant agencies such as Mahasarakham provincial health office; sub district administration organizations and
local people can apply a developed system for surveillance and monitoring of diarrhea in Mahasarakham province in
order to prepare and prevent diarrhea because they can access data at anytime from anywhere with internet
connection. To efficiently improve the system; some features should be further developed such as database changing
or update; improvement of function creation to allow user use the most efficient system. Also; data representation
system in the graphical form should be added for future implications.
6. Acknowledgements
The author would like to thanks Prof. Dr. Paisan Laosuwan; Dean Faculty of Science and Technology; Hatyai
University; Thailand for their thoughtful advice and input during the preparation of this study.
7. Reference
World Health Organization (2010a). WHO Global Health Atlas. [On-line] Available: February 21; 2010.
http://apps.who.int/globalatlas/
Bédard; Y.; P. Gosselin; S. Rivest; M. Proulx; M. Nadeau; G. Lebel; and M. Gagnon (2003). Integrating GIS
components with knowledge discovery technology for environmental health decision support. International
Journal of Medical Informatics; 70(1); 79-94.
WU Qunyong; WANG Qinmin; ZHOU Chenghu; CHEN Chuanbin and HUANG Ruiyin (2005). Study on GML
and SVG-based Open WebGIS and its Application; Proceedings 2005 IEEE International Geoscience and
Remote Sensing Symposium 2005 IGARSS 05; 810-812.
Innovative Systems Design and Engineering www.iiste.org
ISSN 2222-1727 (Paper) ISSN 2222-2871 (Online)
Vol 3, No 6, 2012
47
Jin; Y.; Z. Zhou; G. He; H. Wei; J. Liu; F. Liu; N. Tang; B. Ying; Y. Liu; G. Hu; H. Wang; K. Balakrishnan; K.
Watson; E. Baris; and M. Ezzati (2005). Geographical; spatial; and temporal distributions of multiple indoor
air pollutants in four Chinese provinces. Environmental Science and Technology; 39(24); 9431-9439.
World Health Organization (2010b). GIS and public health mapping. [On- line] Available: February 21; 2010.
http://www.who.int/health_mapping/gisandphm/en/ index.html.
Toubiana L; Moreau S; Bonnard G MetaSurv (2005). Web-platform generator for the monitoring of health’s indica-tors and interactive geographical information system. Stud Health Technol Inform; 116:989-93.
World Health Organization (2007). Annual Report. [On-line] Available: February 21; 2010.
http://www.who.int/whr/previous/en/index.html
Lamduan Namsirikul. Diarrhea. [On-line] Available: March 21; 2011. http://www.elib-online.com/
doctors/ped_diarrhoea2.html
Chaput; E. K.; J. I. Meek; and R. Heimer (2002). Spatial analysis of human granulocytic ehrlichiosis near Lyme;
Connecticut. Emerging Infectious Diseases; 8(9); 943-948.
Richardson; S.; A. Thomson; N. Best; and P. Elliott (2004). Interpreting posterior relative risk estimates in
disease-mapping studies. Environmental Health Perspectives; 112(9); 1016-1025.
Wiafe; S.; and B. Davenhall (2005). Extending Disease Surveillance with GIS. [On-line] Available: February 21;
2010. http://www.esri.com/news/arcuser/0405/disease_ surveil1 of2 .html.
Beale; L.; J. J. Abellan; S. Hodgson; and L. Jarup (2008). Methodologic issues and approaches to spatial
epidemiology. Environmental Health Perspectives; 116(8); 105-1110.
Laosuwan; T.; Uttaruk; P.;Klinhom U.; Butthep; C.; Samek J. H.; Skole; D; L.; (2011).Development of Web-GIS
Application for Carbon Sequestration in Thailand. International Journal of Geoinformatics; 7 (2); 41-47.
OGC (2003). OpenGIS Web Services Architecture. [On-line] Available: http://portal.opengeospatial.org /files/?
artifact_id=1320.
OGC (2004). "Geography Markup Language (GML) Implementation Specification." Available:
http://portal.opengeospatial.org/files/?artifact_id=4700.
Spatial Data Infrastructures. Spatial Data Infrastructures in Spain: State of play (2011).
[On-line] Available: October 22; 2011. http://inspire.jrc.ec.europa.eu/index.cfm/ pageid/6/list/4
Apache Ant (2004). The Apache Software Foundation [http://ant.apache.org/]. Retrieved February 19; 2004
Apache Web Server. The Apache Software Foundation. [On-line] Available: January 11; 2011.
http://www.apache.org/
UMN Map Server .MapServer Open Source Web Mapping [On-line] Available: March 10; 2011.
http://mapserver.org/
FreeGIS. The FreeGIS Project provides. [On-line] Available: March 18; 2011. http://freegis.org/
MySQL. Download MySQL Community Server. [On-line] Available: August 09; 2011.
http://www.mysql.com/downloads/mysql/
Mahasarakham Provincial Health Office. Diarrhea data. [On-line] Available: 09; 2011.
http://mkho.moph.go.th/mko/remote/private/
Assist. Prof. Teerawong Laosuwan: was born in Thailand. He graduated and received bachelor degree from South East Asia
University; Bangkok; Thailand in 1996; in Electronics Engineering field of study. His master degree of science in Remote

Innovative Systems Design and Engineering www.iiste.org
ISSN 2222-1727 (Paper) ISSN 2222-2871 (Online)
Vol 3, No 6, 2012
48
Sensing and Geographic Information System from Suranaree University of Technology; Nakhon Raschasima; Thailand was
received in 2001. He graduated and received Certificate of Advanced Studies in Remote Sensing and Geographic Information
System (course completed 21 credit) from Asian Institute of Technology; Bangkok; Thailand in 2010. He has worked as lecturer
since 2002 in Department of Physics (Applied Physics); Faculty of Science Mahasarakham University. His current research is
focused on application of geoinformatics technologies; atmospheric (cloud and aerosol) informatics; and research on integrating
GIScience education.
Dr. Poramate Chunpang: was born in Thailand. He graduated and received bachelor degree from Mahasarakham University;
Mahasarakham; Thailand in 1994; in Applied Physics field of study. His master degree of science in Applied Physics from King
Mongkut's Institute of Technology; Thailand in 2001. He graduated and received PhD degree in Applied Physics from King
Mongkut's Institute of Technology; Thailand in 2010. He has worked as lecturer since 2001 in Department of Physics (Applied
Physics); Faculty of Science Mahasarakham University. His current research is focused on application of robotics engineering;
sensor engineering; and research on geoinformatics technologies.
Figure 1. Mahasarakham province

Innovative Systems Design and Engineering www.iiste.org
ISSN 2222-1727 (Paper) ISSN 2222-2871 (Online)
Vol 3, No 6, 2012
49
Figure 2. Illustration conceptual of the study
Figure 3. Flowchart of the study

Innovative Systems Design and Engineering www.iiste.org
ISSN 2222-1727 (Paper) ISSN 2222-2871 (Online)
Vol 3, No 6, 2012
50
Figure 4. Illustrate data flow diagram
Figure 5. Illustrate Map File Language

Innovative Systems Design and Engineering www.iiste.org
ISSN 2222-1727 (Paper) ISSN 2222-2871 (Online)
Vol 3, No 6, 2012
51
Figure 6. Sample diarrhea risk area mapping in sub-districts; Mahasarakham province
Figure 7. Illustration webpage
Figure 8. Illustrate Web-based GIS system (risk area)
Innovative Systems Design and Engineering www.iiste.org
ISSN 2222-1727 (Paper) ISSN 2222-2871 (Online)
Vol 3, No 6, 2012
52
Figure 9. Sample data query from spatial data in Mahasarakham Province
Figure 10. Development functions usage
Table 1. Sample data and statistics of patients with diarrhea during 2008-2011 in
Mahasarakham province.
Sub district Data and statistics of diarrhea in Sub district
2008 2009 2010 2011
Talad 433 800 981 118
Khow 190 239 319 56.0
Tatoom 90.0 75.0 88.0 7.00
Wangnang 238 311 393 49.0
Kokgoe 168 128 135 44.0
Donwan 44.0 46.0 39.0 10.0
Keang 153 133 189 33.0
Kangleungjan 171 237 256 24.0
Tasongkon 290 277 313 57.0
Ladpattana 164 159 153 27.0

This academic article was published by The International Institute for Science,
Technology and Education (IISTE). The IISTE is a pioneer in the Open Access
Publishing service based in the U.S. and Europe. The aim of the institute is
Accelerating Global Knowledge Sharing.
More information about the publisher can be found in the IISTE’s homepage:
http://www.iiste.org
The IISTE is currently hosting more than 30 peer-reviewed academic journals and
collaborating with academic institutions around the world. Prospective authors of
IISTE journals can find the submission instruction on the following page:
http://www.iiste.org/Journals/
The IISTE editorial team promises to the review and publish all the qualified
submissions in a fast manner. All the journals articles are available online to the
readers all over the world without financial, legal, or technical barriers other than
those inseparable from gaining access to the internet itself. Printed version of the
journals is also available upon request of readers and authors.
IISTE Knowledge Sharing Partners
EBSCO, Index Copernicus, Ulrich's Periodicals Directory, JournalTOCS, PKP Open
Archives Harvester, Bielefeld Academic Search Engine, Elektronische
Zeitschriftenbibliothek EZB, Open J-Gate, OCLC WorldCat, Universe Digtial
Library , NewJour, Google Scholar