design and construction of a large-scale … · design and construction of a large-scale sediment...
TRANSCRIPT

Research Report
DESIGN AND CONSTRUCTION OF A LARGE-SCALE SEDIMENT BASIN AND
PRELIMINARY TESTING RESULTS
Prepared by
Michael Perez Dr. Xing Fang, PE, Dr. Wesley C. Zech
Dr. Jose Vasconcelos
AUGUST 2015

1. Report No.
2. Government Accession No. 3. Recipient Catalog No.
4. Title and Subtitle
Design and Construction of a Large-Scale Sediment Basin and Preliminary Testing Results
5. Report Date
August 2015
6. Performing Organization Code
7. Author(s)
Michael Perez, Xing Fang, Wesley C. Zech, and Jose Vasconcelos
8. Performing Organization
Report No.
9. Performing Organization Name and Address
Highway Research Center
Department of Civil Engineering
238 Harbert Engineering Center
Auburn, AL 36849
10. Work Unit No. (TRAIS)
11. Contract or Grant No.
12. Sponsoring Agency Name and Address
Highway Research Center
Department of Civil Engineering
238 Harbert Engineering Center
Auburn, AL 36849
13. Type of Report and Period Covered
14. Sponsoring Agency Code
15. Supplementary Notes
16. Abstract Stormwater regulations require construction generated pollution to be controlled on-site prior to discharge
to avoid impairment of receiving waterbodies. Sediment basins are stormwater detention practices commonly used to capture, and treat sediment-laden runoff prior to discharging from a construction site. Federal, state highway agencies, and environmental protection agencies have developed standardized guidance on the design of sediment basins, however further research is necessary to understand basin performance under various design conditions using large-scale testing techniques.
This study details the design and construction of a 2,789 ft3, large-scale sediment basin at the Auburn University-Erosion and Sediment Control Facility (AU-ESCTF). A testing methodology and phased experimental regime were developed to allow for future testing of various sediment basin design configurations and high-rate lamella plate settler technology within the basin. Data collection efforts including: water quality, flow rates, basin stage levels, sediment deposition volumes, and sediment sampling for particle characterization will be used to evaluate the performance of various basin design configurations. This report also discusses results on preliminary research efforts evaluating sediment basin design configurations.
17. Key Words
18. Distribution Statement
19. Security Classification (of this report)
Unclassified
20. Security Classification (of this page) Unclassified
21. No. of Pages 47
22. Price None.

_________________ Research Report
DESIGN AND CONSTRUCTION
OF A LARGE-SCALE SEDIMENT BASIN AND PRELIMINARY TESTING RESULTS
Prepared by
Michael Perez Dr. Xing Fang, PE, Dr. Wesley C. Zech
Dr. Jose Vasconcelos
AUGUST 2015
ii
DISCLAIMERS The contents of this report reflect the views of the authors who are responsible for the facts and accuracy of the data presented herein. The contents do not necessarily reflect the official views or policies of Alabama DOT, Auburn University, or the Highway Research Center. This report does not constitute a standard, specification, or regulation. Comments contained in this paper related to specific testing equipment and materials should not be considered an endorsement of any commercial product or service; no such endorsement is intended or implied.
NOT INTENDED FOR CONSTRUCTION, BIDDING, OR PERMIT PURPOSES
Dr. Xing Fang, PE, and Dr. Wesley C. Zech
Research Supervisors
ACKNOWLEDGEMENTS This paper is based on a study sponsored by the Highway Research Center. The authors gratefully acknowledge this financial support. The findings, opinions, and conclusions expressed in this paper are those of the authors and do not necessarily reflect the view of the sponsor.

iii
ABSTRACT
Stormwater regulations require construction generated pollution to be controlled on-site prior to discharge to avoid impairment of receiving waterbodies. Sediment basins are stormwater detention practices commonly used to capture, and treat sediment-laden runoff prior to discharging from a construction site. Federal, state highway agencies, and environmental protection agencies have developed standardized guidance on the design of sediment basins, however further research is necessary to understand basin performance under various design conditions using large-scale testing techniques.
This study details the design and construction of a 2,789 ft3, large-scale sediment basin at the Auburn University-Erosion and Sediment Control Facility (AU-ESCTF). A testing methodology and phased experimental regime were developed to allow for future testing of various sediment basin design configurations and high-rate lamella plate settler technology within the basin. Data collection efforts including: water quality, flow rates, basin stage levels, sediment deposition volumes, and sediment sampling for particle characterization. All data will be used to evaluate the performance of various basin design configurations. This report also discusses results on preliminary research efforts evaluating sediment basin design configurations.

iv
TABLE OF CONTENTS
LIST OF TABLES ............................................................................................................................ v
LIST OF FIGURES .......................................................................................................................... v
CHAPTER 1: INTRODUCTION ....................................................................................................... 1 1.1 BACKGROUND .................................................................................................................. 1 1.2 RESEARCH OBJECTIVES ................................................................................................. 2 1.3 ORAGANIZAITON OF FINAL REPORT ............................................................................. 2
CHAPTER 2: LITERATURE REVIEW ............................................................................................ 1 2.1 INTRODUCTION ................................................................................................................. 1 2.2 BASIN SIZING AND GEOMETRY ...................................................................................... 1 2.3 ENERGY DISSIPATION ..................................................................................................... 2 2.4 CHEMICAL TREATMENT .................................................................................................. 2 2.5 DEWATERING .................................................................................................................... 4 2.6 OTHER DESIGN CONSIDERATIONS ............................................................................... 6 2.7 SUMMARY .......................................................................................................................... 6
CHAPTER 3: SEDIMENT BASIN DESIGN AND CONTRUCTION ................................................ 9 3.1 INTRODUCTION ................................................................................................................. 9 3.2 DESIGN .............................................................................................................................. 9 3.3 CONSTRUCTION ............................................................................................................. 12 3.4 INFILTRATION MODIFICATIONS .................................................................................... 13 3.5 AS BUILT .......................................................................................................................... 14
CHAPTER 4: EXPERIMENTAL DESIGN AND TESTING METHODOLOGY ............................. 21 4.1 INTRODUCTION ............................................................................................................... 21 4.2 TESTING REGIME ........................................................................................................... 21 4.3 SEDIMENT INTRODUCTION ........................................................................................... 23 4.4 DATA COLLECTION......................................................................................................... 23
CHAPTER 5: RESULTS AND CONLUSIONS .............................................................................. 26 5.1 INTRODUCTION ............................................................................................................... 26 5.2 BASIN STORAGE ............................................................................................................. 26 5.3 WATER QUALITY ............................................................................................................. 26 5.4 SEDIMENT DEPOSITION ................................................................................................ 34 5.5 CONCLUSION .................................................................................................................. 35
APPENDIX A ................................................................................................................................. 39

v
LIST OF TABLES
Table 1: Chemicals Typically used for Treating Turbidity1 ............................................................... 3 Table 2: Literature Review Summary ............................................................................................... 7 Table 3: Sediment Basin Comparison to Standard Detail ............................................................. 12 Table 4: Sediment Basin Stage-Storage Relationship ................................................................... 16 Table 5: Basin Sizing, Runoff Vol., Peak Discharge, and Avg. Testing Flow Rates ..................... 23 Table 6: Water Sample Collection ................................................................................................. 25 Table 7: Basin Capture Efficiency .................................................................................................. 35
LIST OF FIGURES
Figure 1: Common Surface Skimmers ............................................................................................. 5 Figure 2: Design of the AU-ESCTF Sediment Basin Including Inflow Channel. ............................ 10 Figure 3: AU-ESCTF Sediment Basin (Bay 4) ............................................................................... 11 Figure 4: Construction and Stabilization of Sediment Basin .......................................................... 13 Figure 5: Installation of Basin’s Lining ........................................................................................... 14 Figure 6: Sediment Basin Topography .......................................................................................... 14 Figure 7: Sediment Basin and Forebay Detail ............................................................................... 15 Figure 8: Live Storage Stage-Storage Graphical Relationship ...................................................... 17 Figure 9: Water Introduction System ............................................................................................. 18 Figure 10: Sediment and Water Introduction System During Testing. .......................................... 19 Figure 11: 1.5 in. Faircloth Skimmer (J. W. Faircloth & Son 2007) ............................................... 20 Figure 12: Auxiliary Spillway .......................................................................................................... 20 Figure 13: Testing Regime ............................................................................................................. 21 Figure 14: 2-yr, 24-hr Storm Hydrographs ..................................................................................... 22 Figure 15: Sampler Suction and Discharge Line Routing .............................................................. 24 Figure 16: Basin Stage for Three Replicates ................................................................................. 26 Figure 17: Average Surface Turbidity vs. Time in Four Bays ........................................................ 28 Figure 18: Bay No. 2 Surface vs. Near-Bottom Turbidity (Average) .............................................. 29 Figure 19: Settling Rates Based on Turbidity in Bay 1 .................................................................. 30 Figure 20: Settling Rates Based on Turbidity in Bay 2 .................................................................. 31 Figure 21: Average Surface TSS vs. Time in Four Bays ............................................................... 32 Figure 22: Bay No. 2 Surface vs. Near-Bottom TSS (Average)..................................................... 33 Figure 23: Mass Discharge vs. Time ............................................................................................. 34 Figure 24: NTU vs. TSS Relationship ............................................................................................ 34 Figure 25: Sediment Retention by Weight (%) .............................................................................. 35 Figure 26: Bay No. 1 Turbidity ....................................................................................................... 40 Figure 27: Bay No. 2 Turbidity ....................................................................................................... 41 Figure 28: Bay No. 3 Turbidity ....................................................................................................... 42 Figure 29: Bay No. 4 Turbidity ....................................................................................................... 43 Figure 30: Bay No. 1 TSS .............................................................................................................. 44 Figure 31: Bay No. 2 TSS .............................................................................................................. 45 Figure 32: Bay No. 3 TSS .............................................................................................................. 46 Figure 33: Bay No. 4 TSS .............................................................................................................. 47
1
CHAPTER 1: INTRODUCTION 1
1.1 BACKGROUND
Several pollutants of concern are associated with construction activities including: sediment, pesticides, fertilizers, petrochemicals, construction chemicals, wash water, paper, wood, garbage and sanitary waste. Due to the nature of construction activity, sediment is the predominant pollutant of concern during the clearing and grading stages, which typically expose large un-vegetated and un-stabilized land areas to the erosive elements (USEPA 2005). The lack of ground cover results in high risks of soil erosion. Sediment runoff rates from construction sites can be 10 to 20 times higher than those of agricultural lands and 1,000 to 2,000 times greater than those of forested lands (USEPA 2009). Erosion rates from construction sites ranges from 7.2 to 500 tons/acre/yr (USEPA 2005). Stormwater conveyance systems typically discharge into natural water systems (i.e., receiving water bodies). Unprotected stormwater conveyance networks result in increased turbidity levels emanating from high runoff velocities, which suspend clays and other solids (Huang and Ehrlich 2003). Erosion and the resulting sedimentation in waterways has become Alabama’s largest water pollution problem (Alabama Water Watch Association 2013).
Federal, state, and local regulations and stormwater permits require construction generated pollution to be controlled on-site to avoid impairment to receiving waterways. Enforcement requires construction sites to provide erosion and sediment controls throughout all phases of land disturbing activities. In some cases, numerical discharge effluent limitations are imposed to provide maximum allowable pollutant discharge concentrations from disturbed sites. The Alabama Department of Environmental Management (ADEM) manages the National Pollution Discharge Elimination System (NPDES) permitting process for the state. The permit requires operators to develop a detailed stormwater pollution prevention plan (SWPPP) or construction best management practices plan (CBMPP) prior to submitting a notice of intent for a construction general permit (CGP). The CBMPP is a comprehensive site plan of action to prevent pollution of the environment surrounding a project area through the use of temporary erosion and sediment control (ESC) practices. The CBMPP is used to mitigate the problems associated with sediment migration from construction sites to receiving waterways, by incorporating proper ESC measures into construction projects during land disturbing phases. ADEM enforces increased compliance regulations for sediment or nutrient impaired waterways by limiting turbidity of effluent discharged from a construction site to a 50 NTUs increase above background levels (ADEM 2013). ADEM stipulates that BMPs shall be designed and maintained to minimize erosion and maximize sediment removal resulting from a 2-yr, 24-hr storm event as defined by the National Weather Service and Technical Paper No. 40, “Rainfall Frequency Atlas of the U.S.” (ADEM 2011).
As the largest manager of state highway construction and maintenance projects in the state of Alabama, the Alabama Department of Transportation (ALDOT) has established a CBMPP to guide designers, inspectors, and contractors in environmental and stormwater compliance. The ALDOT CBMPP standard specifications and general applications include a set of special drawings that demonstrate the ALDOT established standard practices for stormwater runoff ESCs. These drawings include the implementation and installation of: temporary slope drains, sediment barriers, erosion control practices, ditch checks, inlet protection practices, sediment basins, and various other common ESC practices.
Although ALDOT has developed standard drawings and specifications for ESCs, the performance of these practices needs to be evaluated to understand the overall effectiveness of practices. By having knowledge of performance, ALDOT can help improve and strengthen the stormwater program where ESC deficiencies are found. The understanding of ESC effectiveness is becoming increasingly critical for designers and contractors to ensure proper implementation and maintenance of practices to meet current and expected increasingly stringent stormwater effluent compliance regulations.
Sediment basins are temporary sediment control measures commonly used as a final polishing tool to capture and temporarily detain sediment-laden stormwater leaving a construction site. Sediment basins are designed to provide adequate detention time to allow for the settlement of soil particles. Federal, state highway agencies, and environmental protection agencies have
2
developed standardized guidance on the design of sediment basins (ALDOT 2010; ALDOT 2012; USEPA 1986), however, further study is necessary to understand the performance of sediment basins under various design conditions using large-scale testing techniques.
Through the CBMPP, ALDOT developed and updated its standard sediment basin specification to be used on all ALDOT projects in 2012. The design includes key components such as: a forebay (sump excavation between two riprap ditch checks), a 20 ft flocculent introduction zone, four equivalent sized bays within the basin separated by equally spaced baffles, a dewatering device, and an auxiliary (a.k.a. an emergency) spillway. Side slopes within the basin are not to exceed 3:1 (ALDOT 2012).
The purpose of this report is to summarize the research effort in the design and construction of a large-scale sediment basin at the Auburn University Erosion and Sediment Control Testing Facility (AU-ESCTF). Results on preliminary research efforts evaluating sediment basin design configurations are also discussed.
1.2 RESEARCH OBJECTIVES
The objectives of the study were to design and construct a large-scale sediment basin at the AU-ESCTF and to test several sediment basin design configurations for a better understanding the performance. This allows the researchers to evaluate the current standard design and focus on providing improvements to the efficiency and performance of the basin. The study focused on specific design configurations for improving performance of the current ALDOT sediment basin design. The following tasks were planned in the HRC proposal:
1) Design and construct a large-scale sediment basin at AU-ESCTF. 2) Test and improve the effectiveness of sediment basin configuration with forebay. 3) Test and improve sediment basin entry baffle configuration. 4) Test and improve introduction of flocculant additives to effectively assist and promote
settling of small sediment particles or flocs. 5) Test and improve design of discharge device (skimmer) in conjunction with discharge
pipe to obtain required detention time and increase efficiency of sediment basin discharge system.
The large-scale sediment basin, which including a water and sediment delivering system,
baffles, and skimmer, was constructed during the project period. In addition, an experimental design and testing protocol was developed. Some experiments were performed and preliminary results were developed. The key accomplishment of the project was the construction of the large-scale sediment basin and to use preliminary results to prepare a full proposal to ALDOT studying sediment basin performance because the funding and time of the HRC project are infeasible for researchers to complete all proposed tasks. The full proposal prepared is “Evaluation of high-rate settling technology for sediment control in roadway construction sites” by Jose G. Vasconcelos, Xing Fang, and Wesley C. Zech. The proposal was approved for funding by the ALDOT Research Advisory Committee on October 17, 2013. Project 930-863 is funded from May 2, 2014 through June 1, 2016. The funded project also reflects the fact that HRC and researchers agreed that the study of high-rate settling technology in a sediment basin has direct benefits to the immediate needs of ALDOT. The project also includes tasks to test and improve the effectiveness of sediment basin configuration with forebay and sediment basin entry baffle configuration.
1.3 ORAGANIZAITON OF FINAL REPORT
The project report includes a literature review (Chapter 2), sediment basin design and construction (Chapter 3), experiment design and testing methodology (Chapter 4), and preliminary results and conclusions (Chapter 5) in addition to Chapter 1 Introduction.

1
CHAPTER 2: LITERATURE REVIEW 2
2.1 INTRODUCTION
Sediment basin efficiency can be affected by several design factors, such as basin sizing and geometry, energy dissipaters, chemical treatment, dewatering mechanism, and other design considerations. In addition to basin design, site factors (i.e. storm event, soil characteristics, topography, upstream erosion and sediment controls, maintenance, etc.) also influence the performance. To understand the state of the practice, a literature review was conducted that investigated current and past design guidance as well as published research efforts on sediment basins. The chapter has been divided into the various components that are typically used within sediment basins.
2.2 BASIN SIZING AND GEOMETRY
Inflow hydrographs and sediment pollutograph (sediment concentration changes with time) as well as source soil composition directly correlate to the effluent grain size distribution from a sediment basin or pond. However, retention pond size and shape are the primary characteristics that most influence trapping efficiency by affecting flow patterns and residence times (Thaxton et al. 2004). Sufficient volume must be provided to store the sediment-laden runoff water so that the suspended sediment has sufficient time to settle from the water. Additional storage is also required to provide volume for collected sediment. Poor efficiencies, often found in improperly designed basins, are often due to short circuiting and dead space in the basins.
Sediment basin design volumes differs throughout the country. Early design guidance called for volumes to store the local 10-yr, 24-hr storm event (USEPA 1976). In an effort to simplify design calculations, volume requirements of 1,800 ft3/ac were adopted by several state agencies (North Carolina Department of Transportation [NCDOT] 2012). Recently the design volume has been increased to 3,600 ft3/ac (Alabama Soil and Water Conservation Commitee [AL-SWCC] 2014). ALDOT now requires either 3,600 ft3/ac or the volume resulting from the 2-yr, 24-hr rainfall event (Alabama Department of Transportation 2010).
Maximum contributing drainage basin sizes also vary greatly throughout the country. The AL-SWCC (2014) recommends that maximum drainage basin per sediment basin be no more than 10 acres, with the absolute maximum being 100 ac. To optimize pond performance, retention ponds should be long and narrow (Chen 1975). A minimum length to width ratio of 2:1 is the generally accepted recommendation (ASWCC 2014; Barfield et al. 1983; Griffin et al. 1985; NC-DENR 2013), however maximum settling efficiency can be expected from a sediment pond with a length-to-width ratio of about 5:1 (USEPA 1976). Basin surface area sizing is often derived through the concept of stokes law. Stokes law is described as the drag force acting on a spherical object at low Reynolds numbers (i.e. laminar flow conditions). Stokes law for spherical objects is shown below in eq. 1 (Cimbala and Cengel 2008; Fifield 2011):
∗ 1 ∗
18 ∗ Eq.1
Where, = terminal velocity (ft/s) = acceleration of gravity (32.2 ft/s2) = specific gravity of suspended particle = diameter of suspended particle = kinematic viscosity of fluid (ft2/s)
This relation shows that terminal velocity of a spherical particle is proportional to the
diameter and mass of the object. The velocity is also affected by the viscosity of the water, therefore warmer temperature water will provide faster settling times. This equation allows
2
designers to select a basin surface area that will provide a flow length sufficient to provide enough time for the design soil particle size to fall out of suspension.
2.3 ENERGY DISSIPATION
To provide sediment particles an increased opportunity to settle, energy dissipaters are commonly employed in sediment basins. Baffles help reduce turbulence and provide lower-velocity flow conditions. Flow energy is dissipated when baffles are used, and it allows water to flow across the width of the basin at uniform velocity (Chen 1975). Turbulent flows are undesirable in basins as it contributes to prolonged suspension (Goldman et al. 1986). In addition, studies conducted using steady-state tracer evaluations have shown that the use of barriers reduces short-circuiting by preventing inflow from moving directly to the outlet (Millen et al. 1997). Another advantage of baffles is that they provide an increase in the effective width of the basin.
Baffles constructed of silt fence with weirs have been shown to increase sediment retention when compared to open basins (Millen et al. 1997). Porous baffles constructed of coir mesh have been shown to be even more effective (Thaxton et al. 2004; Thaxton and McLaughlin 2005). Coir baffle dissipaters are now considered common practice in the design of sediment basins (ALDOT 2012; AL-SWCC 2014; NC-DENR 2013).
Thaxton et al. (2004) conducted experiments on various baffle materials installed in a 2:1 rectangular 812 ft3 sediment basin at the Sediment and Erosion Control Research and Education Facility (SECREF) on the North Carolina State University Lake Wheeler Field Laboratory in Raleigh, North Carolina. Experiments were performed with baffles made up of three different types of materials: woven polypropylene silt fence with 204 threads/ft, polyethylene tree-protection fence with openings of 2.0 x 4.0 in., and jute/coir combination composed of a 4 x 100 jute mesh backed by a woven coir erosion control blanket. Baffles were installed in three parallel rows spaced at 3.0 ft, perpendicular to the direction of flow. The silt fence installation included weirs placed at staggered locations to route flow around the baffles rather than through the material.
The baffles were evaluated in their capability in decreasing the velocity between each row. The study concluded that the use of baffles substantially reduced mean flow velocities and velocity fluctuations compared to an open basin. The jute/coir baffles out performed both the tree-protection baffles and the silt fence baffles. The jute/coir baffle greatly reduced mean flow velocity magnitude, indicating superior absorption of inflow momentum. The study further indicated that the jute/coir baffles more effectively diffused the incoming energy such that more of the pond volume participated in the sediment settling process. It was also found that the first baffle provided the greatest benefit, with marginal reduction in velocities and turbulence with each additional baffle (Thaxton et al. 2004).
2.4 CHEMICAL TREATMENT
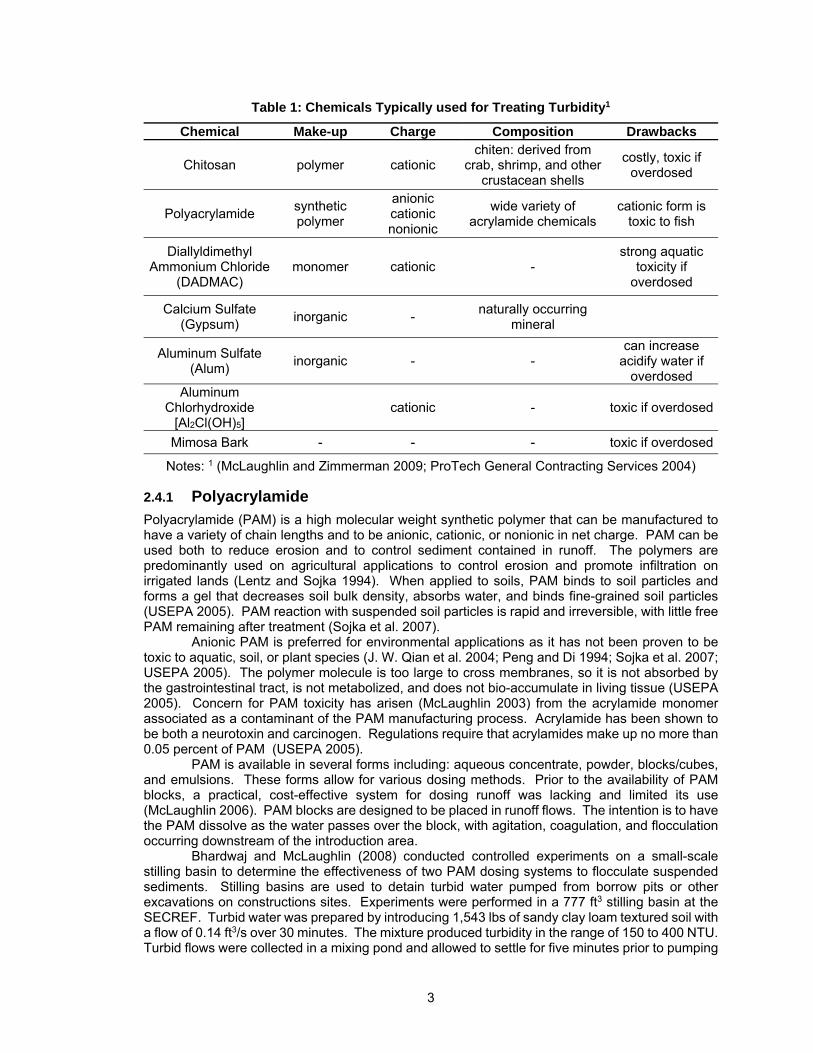
Very fine suspended soil particles (i.e., clay and silt) require long detention times that exceed typical sediment basin treatment conditions. Chemical treatment using coagulants can promote the process of soil particle binding, providing for flocculation. Several types of chemical treatments (Table 1) have been used in stormwater treatment including: aluminum sulfate (Harper 1990), calcium sulfate (Przepiora et al. 1997; Przepiora et al. 1998), and polyacrylamide (Bhardwaj and McLaughlin 2008) among others. Coagulant chemicals work by neutralizing the electrical charges of the soil particles in the water, allowing the fine material to agglomerate and form large clumps or flocs. Flocs settle out of suspension through gravity. Chemicals that function primarily by charge neutralization are considered to be coagulants, whereas chemicals that remove particulates by both charge neutralization and bridging are considered flocculants. These chemicals are commonly used to treat stormwater. In sediment basins, coagulants and flocculants can be used as an active treatment approach to promote settlement of the finely suspended soil particles.
These chemical agents use electrical charges to attract sediment particles to coagulate. Charges can be cationic (positive), anionic (negative), nonionic (neutral), or amphoteric (changeable, depending on pH of water). When used in excess, cationic treatments have been shown to be toxic to fish as the positively charged particles are attracted to the negatively charged hemoglobin in the gills (USEPA 2005).
3
Table 1: Chemicals Typically used for Treating Turbidity1
Chemical Make-up Charge Composition Drawbacks
Chitosan polymer cationic chiten: derived from
crab, shrimp, and other crustacean shells
costly, toxic if overdosed
Polyacrylamide synthetic polymer
anionic cationic nonionic
wide variety of acrylamide chemicals
cationic form is toxic to fish
Diallyldimethyl Ammonium Chloride
(DADMAC) monomer cationic -
strong aquatic toxicity if
overdosed
Calcium Sulfate (Gypsum)
inorganic - naturally occurring
mineral
Aluminum Sulfate (Alum)
inorganic - - can increase
acidify water if overdosed
Aluminum Chlorhydroxide
[Al2Cl(OH)5] cationic - toxic if overdosed
Mimosa Bark - - - toxic if overdosed
Notes: 1 (McLaughlin and Zimmerman 2009; ProTech General Contracting Services 2004)
2.4.1 Polyacrylamide
Polyacrylamide (PAM) is a high molecular weight synthetic polymer that can be manufactured to have a variety of chain lengths and to be anionic, cationic, or nonionic in net charge. PAM can be used both to reduce erosion and to control sediment contained in runoff. The polymers are predominantly used on agricultural applications to control erosion and promote infiltration on irrigated lands (Lentz and Sojka 1994). When applied to soils, PAM binds to soil particles and forms a gel that decreases soil bulk density, absorbs water, and binds fine-grained soil particles (USEPA 2005). PAM reaction with suspended soil particles is rapid and irreversible, with little free PAM remaining after treatment (Sojka et al. 2007).
Anionic PAM is preferred for environmental applications as it has not been proven to be toxic to aquatic, soil, or plant species (J. W. Qian et al. 2004; Peng and Di 1994; Sojka et al. 2007; USEPA 2005). The polymer molecule is too large to cross membranes, so it is not absorbed by the gastrointestinal tract, is not metabolized, and does not bio-accumulate in living tissue (USEPA 2005). Concern for PAM toxicity has arisen (McLaughlin 2003) from the acrylamide monomer associated as a contaminant of the PAM manufacturing process. Acrylamide has been shown to be both a neurotoxin and carcinogen. Regulations require that acrylamides make up no more than 0.05 percent of PAM (USEPA 2005).
PAM is available in several forms including: aqueous concentrate, powder, blocks/cubes, and emulsions. These forms allow for various dosing methods. Prior to the availability of PAM blocks, a practical, cost-effective system for dosing runoff was lacking and limited its use (McLaughlin 2006). PAM blocks are designed to be placed in runoff flows. The intention is to have the PAM dissolve as the water passes over the block, with agitation, coagulation, and flocculation occurring downstream of the introduction area.
Bhardwaj and McLaughlin (2008) conducted controlled experiments on a small-scale stilling basin to determine the effectiveness of two PAM dosing systems to flocculate suspended sediments. Stilling basins are used to detain turbid water pumped from borrow pits or other excavations on constructions sites. Experiments were performed in a 777 ft3 stilling basin at the SECREF. Turbid water was prepared by introducing 1,543 lbs of sandy clay loam textured soil with a flow of 0.14 ft3/s over 30 minutes. The mixture produced turbidity in the range of 150 to 400 NTU. Turbid flows were collected in a mixing pond and allowed to settle for five minutes prior to pumping

4
into the stilling basin. Pumping into the stilling basin was conducted for 130 minutes, 40 minutes of which overtopped through the exit spillway. A passive system using PAM blocks was compared to an active approach using PAM solution injection at 4 mg/L. The research concluded that both the active and passive systems provided significant turbidity decreases by 66% to 88%. Active PAM treatment provided TSS reductions by up to 80%, however the passive system reduced TSS by 45% to 65% which was found to be insignificant compared to control tests without PAM application. The study further concluded that the use of porous baffles had little effect compared to PAM treatment in water quality improvements (Bhardwaj and McLaughlin 2008).
2.5 DEWATERING
Sediment basins are designed to detain water for periods typically ranging between 24-72 hours. Dewatering is the slow, controlled removal of water from a sediment basin. The time required to dewater, detention time, is designed to allow adequate time for sediment to settle out of suspension, while allowing the basin to dewater to make storage available for subsequent runoff. As the detention period is increased, smaller sediment particles will be removed by gravitational settling. Research has shown that extended detention times provide enhanced sediment capture. Sediment loss (outflow) from basins with a six hour dewatering time was 2.7 times greater than the sediment loss when a 24 hr dewatering time was used. Furthermore, seven day detention time provided 70% of the sediment loss from basins with a 24 hr dewatering time (Albert 2001) because smaller particles require significantly longer time to settle and some very fine particles may never settle out by gravity.
The dewatering time of basins is typically controlled by the principal spillway. Effluent discharge has traditionally been achieved through the use of a riser structure, however recent technology has incorporated the use of surface skimmers to achieve higher quality discharge. Auxiliary or emergency spillways are also incorporated into dewatering designs to allow for passage of stormwater that exceeds the designed capacity of the basin.
2.5.1 Riser Structure
Traditional sediment basin designs used a perforated riser structure to provide for dewatering. These primary spillway structures are typically manufactured of corrugated aluminum pipe or plywood box. The structure consists of one or more columns of holes drilled into the device which allow water to pass through. The device is typically wrapped in a geotextile and backfilled with aggregate to provide a filtering mechanism. These passive flow systems control the basin dewatering time and withdraw effluent form several vertically distributed openings within the water column. However, poor principal spillway design often leads to rapid dewatering and inefficient sediment removal (Millen et al. 1997). Discharge through perforated risers varies depending on upon the hydrostatic head above the openings. Higher flow rates occur during conditions where the basin is full compared to when the basin is relatively empty. From a sediment discharge standpoint, this is undesirable as the basin tends to be at its greatest depth (and greatest suspended sediment concentration) immediately following storm events. Appropriately designed perforated riser structures have been shown to have sediment capture rates of 88% or better (Edwards et al. 1999; Fennessey and Jarrett 1997; Ward et al. 1979).
2.5.2 Surface Skimmer
Surface skimmers have recently been introduced as a standard practice for dewatering sediment basins and have been adopted by many state environmental regulatory agencies as the principal dewatering mechanism, replacing riser pipes. Skimmers function by floating at or near the water surface of the basin allowing dewatering to occur through one or several orifices. The floating mechanism is attached to a pipe that connected to the basin’s outlet (Figure 1). These surface skimmers typically have lower flow rates than riser structures do. Longer dewatering times are desirable as researchers have determined that the majority of sediment loss from a basin with a skimmer occurred in the first five to nine hours after the start of the storm event (Millen et al. 1997; Vaughan and Jarrett 2001). In contrast to riser structures, skimmers remove water from the top of the basin which is typically characterized by higher quality water (smaller concentration of
5
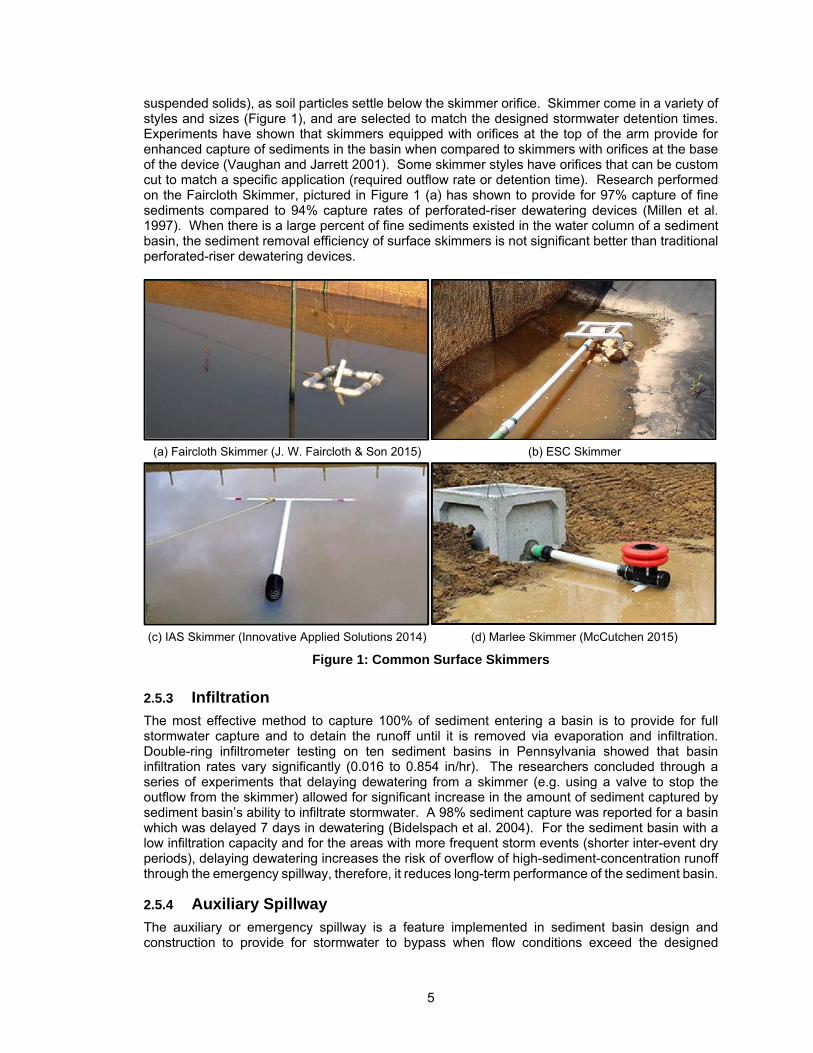
suspended solids), as soil particles settle below the skimmer orifice. Skimmer come in a variety of styles and sizes (Figure 1), and are selected to match the designed stormwater detention times. Experiments have shown that skimmers equipped with orifices at the top of the arm provide for enhanced capture of sediments in the basin when compared to skimmers with orifices at the base of the device (Vaughan and Jarrett 2001). Some skimmer styles have orifices that can be custom cut to match a specific application (required outflow rate or detention time). Research performed on the Faircloth Skimmer, pictured in Figure 1 (a) has shown to provide for 97% capture of fine sediments compared to 94% capture rates of perforated-riser dewatering devices (Millen et al. 1997). When there is a large percent of fine sediments existed in the water column of a sediment basin, the sediment removal efficiency of surface skimmers is not significant better than traditional perforated-riser dewatering devices.
(a) Faircloth Skimmer (J. W. Faircloth & Son 2015) (b) ESC Skimmer
(c) IAS Skimmer (Innovative Applied Solutions 2014) (d) Marlee Skimmer (McCutchen 2015)
Figure 1: Common Surface Skimmers
2.5.3 Infiltration
The most effective method to capture 100% of sediment entering a basin is to provide for full stormwater capture and to detain the runoff until it is removed via evaporation and infiltration. Double-ring infiltrometer testing on ten sediment basins in Pennsylvania showed that basin infiltration rates vary significantly (0.016 to 0.854 in/hr). The researchers concluded through a series of experiments that delaying dewatering from a skimmer (e.g. using a valve to stop the outflow from the skimmer) allowed for significant increase in the amount of sediment captured by sediment basin’s ability to infiltrate stormwater. A 98% sediment capture was reported for a basin which was delayed 7 days in dewatering (Bidelspach et al. 2004). For the sediment basin with a low infiltration capacity and for the areas with more frequent storm events (shorter inter-event dry periods), delaying dewatering increases the risk of overflow of high-sediment-concentration runoff through the emergency spillway, therefore, it reduces long-term performance of the sediment basin.
2.5.4 Auxiliary Spillway
The auxiliary or emergency spillway is a feature implemented in sediment basin design and construction to provide for stormwater to bypass when flow conditions exceed the designed

6
detention volume. Spillways are commonly designed as rectangular weirs on along the embankment of the basin. While sediment basins are typically designed to detain runoff emanating from a 2-yr, 24-hr storm event, the spillway is sized to pass the peak flow rate from a larger event (i.e. 10-yr, 24-hr or 25-yr, 24-hr design storm). The spillway is lined with a turf reinforcement mat or riprap to provide protection from high velocity flow (VDEQ 1992).
2.6 OTHER DESIGN CONSIDERATIONS
Proper stabilization of the basin is critical to minimize sediment erosion and resuspension of previously deposited sediment within the basin. Basin erosion and resuspension has been shown to account for up to 50% of the sediment loss from basins (Fennessey and Jarrett 1997; Millen et al. 1997).
2.7 SUMMARY
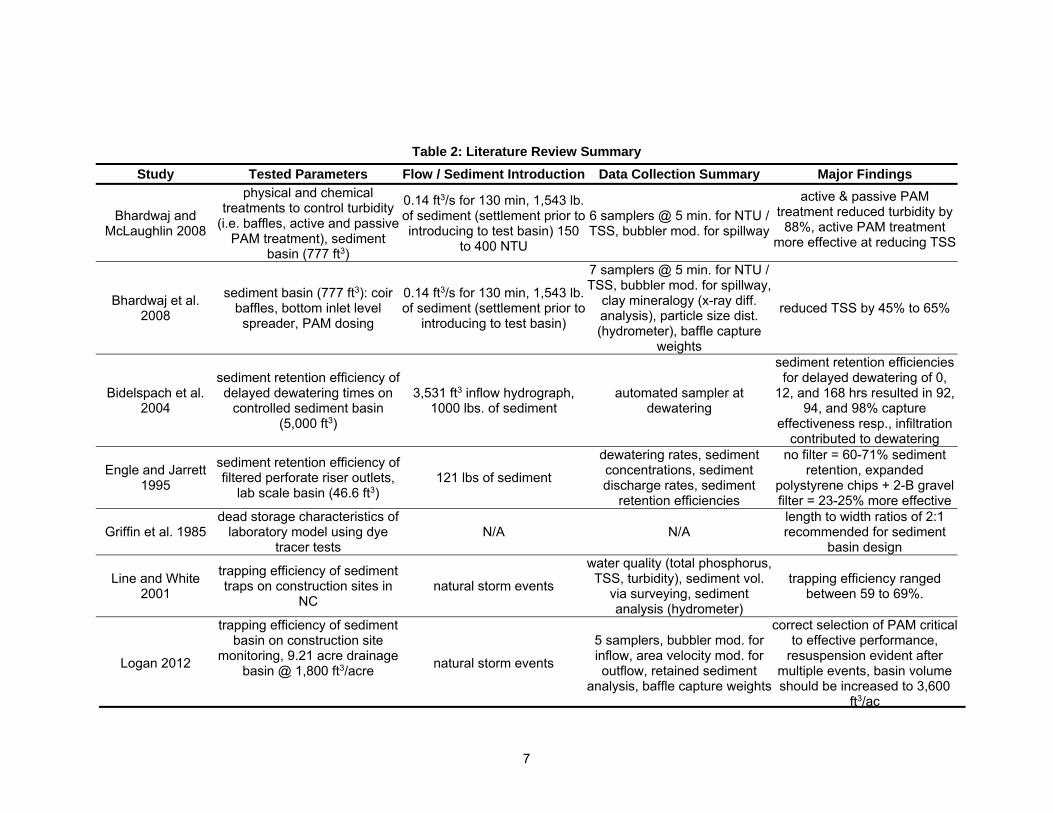
A summary of the presented literature relevant to the design and testing methodology of the AU-ESCTF sediment basin is presented in Table 2.
7
Table 2: Literature Review Summary
Study Tested Parameters Flow / Sediment Introduction Data Collection Summary Major Findings
Bhardwaj and McLaughlin 2008
physical and chemical treatments to control turbidity
(i.e. baffles, active and passive PAM treatment), sediment
basin (777 ft3)
0.14 ft3/s for 130 min, 1,543 lb. of sediment (settlement prior to introducing to test basin) 150
to 400 NTU
6 samplers @ 5 min. for NTU / TSS, bubbler mod. for spillway
active & passive PAM treatment reduced turbidity by
88%, active PAM treatment more effective at reducing TSS
Bhardwaj et al. 2008
sediment basin (777 ft3): coir baffles, bottom inlet level
spreader, PAM dosing
0.14 ft3/s for 130 min, 1,543 lb. of sediment (settlement prior to
introducing to test basin)
7 samplers @ 5 min. for NTU / TSS, bubbler mod. for spillway,
clay mineralogy (x-ray diff. analysis), particle size dist. (hydrometer), baffle capture
weights
reduced TSS by 45% to 65%
Bidelspach et al. 2004
sediment retention efficiency of delayed dewatering times on
controlled sediment basin (5,000 ft3)
3,531 ft3 inflow hydrograph, 1000 lbs. of sediment
automated sampler at dewatering
sediment retention efficiencies for delayed dewatering of 0,
12, and 168 hrs resulted in 92, 94, and 98% capture
effectiveness resp., infiltration contributed to dewatering
Engle and Jarrett 1995
sediment retention efficiency of filtered perforate riser outlets,
lab scale basin (46.6 ft3) 121 lbs of sediment
dewatering rates, sediment concentrations, sediment discharge rates, sediment
retention efficiencies
no filter = 60-71% sediment retention, expanded
polystyrene chips + 2-B gravel filter = 23-25% more effective
Griffin et al. 1985 dead storage characteristics of
laboratory model using dye tracer tests
N/A N/A length to width ratios of 2:1 recommended for sediment
basin design
Line and White 2001
trapping efficiency of sediment traps on construction sites in
NC natural storm events
water quality (total phosphorus, TSS, turbidity), sediment vol.
via surveying, sediment analysis (hydrometer)
trapping efficiency ranged between 59 to 69%.
Logan 2012
trapping efficiency of sediment basin on construction site
monitoring, 9.21 acre drainage basin @ 1,800 ft3/acre
natural storm events
5 samplers, bubbler mod. for inflow, area velocity mod. for outflow, retained sediment
analysis, baffle capture weights
correct selection of PAM critical to effective performance,
resuspension evident after multiple events, basin volume should be increased to 3,600
ft3/ac

8
Table 2 (Continued): Literature Review Summary
Study Tested Parameters Flow / Sediment Introduction Data Collection Summary Major Findings
McLaughlin et al. 2009
comparison of various design parameters (forebays, baffles,
ditch stabilization, PAM, skimmers) on construction site
sediment basins (~530 ft3)
natural storm events 15 min. interval sampling for
turbidity / TSS
water quality improvements by simple modifications, traps and skimmer did not contribute to
improvement
Przepiora et al. 1997
compared efficiency of several calcium sulfate sources in
reducing NTU of water samples collected from
construction site sediment basins in NC
laboratory, bench-scale experiments
turbidity, pH, conductivity, and dissolved Ca
calcium sulfate applied at the rate of 350 to 700 mg/L
reduced fine-grained suspended sediment in basins
within 3 hours
Przepiora et al. 1998
evaluated the efficiency of calcium sulfate as a chemical flocculent in three construction site basins(1,590 to 5,830 ft3)
equipped with skimmer
natural storm events 100 mL grab samples from
outlet
surface application of molding plaster significantly reduced
both turbidity and the cumulative amount of
suspended solids discharged
Thaxton and McLaughlin 2005
sediment basin (812 ft3): vel. reduction by baffle types
0.50, 1.00, 1.50 ft3/s velocity at 50 points, bubbler
mod. for flow rates
jute/coir and tree baffles most effectively diffuse inflow
momentum

9
CHAPTER 3: SEDIMENT BASIN DESIGN AND CONTRUCTION 3
3.1 INTRODUCTION
This chapter provides the summary of the design and construction of the sediment basin constructed at the AU-ESCTF.
3.2 DESIGN
The AU-ESCTF sediment basin was designed to be a large-scale sediment basin typical of ALDOT design standards. The basin is comprised of several features intended to facilitate the settlement of suspended sediment in stormwater. Inflow is directed into the sediment basin via a 90 ft Flexamat® tied concrete block armored channel with a longitudinal slope of 5% and the total channel depth of 4 ft (Figure 2). The inflow channel was designed for a bottom width of 4 ft, side slope of 2:1 (H:V), and top width of 20 ft (Figure 2). The most upstream of the inflow channel was designed to have a water and sediment introduction system, which is supported by 8 × 10 ft concrete pad. The sediment basin was designed for a bottom width of 15 ft, side slope of 2:1 (H:V), and top width of 31 ft at the total basin depth of 4 ft (Figure 2). Along the flow direction, the basin was designed as 45 ft long at the bottom (about 11ft for each bay, Figure 2) and 61 ft at the top at the water depth of 4 ft (2:1 side slope). The sediment basin was designed to have a floating skimmer (Figure 3) to dewater the basin, but the output flow of the skimmer can be controlled by a gate valve whenever it is necessary to test the basin without dewatering at certain water depth. The skimmer was installed in the Bay 4 of the basin but discharged through the side of the basin into the facility’s temporal water/sediment storage basin.
Three rows of wire backed coir baffles were installed in the basin to provide four separate bays, 11 ft x 16 ft in size. Steel t-posts were spaced 4 ft and inserted 24 in. into the ground. Wire backing was attached to the t-posts and extended along the width of the basin, up the side slopes. Coir netting was placed on both sides of the wire mesh and secured along the bottom of the basin and along the side slopes. The height of the baffles were set at the same elevation as the maximum water depth (freeboard) flowing through the spillway, which followed the design drawing recommended by AL-SWCC (AL-SWCC 2009) and the recommendation from a previous ALDOT study (Fang et al. 2012).

10
(a) plan view
(b) profile view
(c) channel section view
(d) sediment basin section view
Figure 2: Design of the AU-ESCTF Sediment Basin Including Inflow Channel.
Figure 3 below shows the as-built basin from the fourth bay. The baffles and sampling
apparatus are installed for data collection.

11
Figure 3: AU-ESCTF Sediment Basin (Bay 4)
Table 3 provides comparisons between the Alabama Handbook, ALDOT sediment basin
design standards, NCDOT design standards, and the constructed test sediment basin at the AU-ESCTF.

12
Table 3: Sediment Basin Comparison to Standard Detail
Parameters AL Handbook ALDOT NCDOT AU-ESCTF Upstream Sump - Y N Y Upstream Ditch Check - Y N Y Dewatering Skimmer Y Y Y Y Auxiliary Spillway Design 10 yr, 24 hr 10 yr, 24 hr 10 yr, 24 hr - Maximum Drainage Area (acres) 10 10 100 - Minimum Volume (ft3/acre) 3,600 3,600 1,800 - Design Detention Time1 (hrs) 48 - 120 72 48 561 Coir Baffles / Bays 3 / 4 3 / 4 3 / 4 3 / 4 Baffle Material Specs. (oz/yd2) 20.6 – 26.5 ≥ 23.02 ≥ 20 - Baffle Open Space Fraction 0.50 0.50 - Baffle Post Spacing (ft) 4 4 4 4 Min. Freeboard (ft) 1.0 1.5 0.0 Dead Storage (in.) - 6 - 12 12 ~4.8 Basin Depth (ft) ≥ 2.0 2.0 – 5.03 3.0-5.0 2.6 - 3.44 Min. Length : Width Ratio 2:1 2:15 3:16 2:1 Notes: 1estimated, to be verified 220 oz/yd2 min. (ALDOT 2012) 33.0 ft preferred 4basin bottom elevation varies 510:1 preferred 62:1 (NCSCC 2013)
3.3 CONSTRUCTION
Prior to excavation of the sediment basin, the cut and fill geometry of the basin and channel was staked out using a robotic total station, see Figure 4 (a). Two mini excavators and a skid steer were used during the excavation process, Figure 4 (b), which took the three operators two days to complete. Excavation started with the channel and worked into the basin. The channel was finalized to grade with the use of a mini skid steer and compacted with a vibratory plate compactor Figure 4 (c). To stabilize the channel and disturbed area around the basin, hydro-seeding was applied, Figure 4 (d). The hydro-seeding was allowed to cure prior to the installation of the concrete lined block system in the channel Figure 4 (e) and (f).

13
(a) Pre-Construction Layout (b) Sediment Basin Excavation
(c) Channel Compaction (d) Hydro-Seeding
(e) Flexamat Installation (f) Established Vegetation
Figure 4: Construction and Stabilization of Sediment Basin
3.4 INFILTRATION MODIFICATIONS
During construction, rocky soils were found on the south end of the sediment basin Figure 4 (b). The soils were indicative of high infiltration capacity, which was undesirable for the functionality of experimentally testing the sediment basin. In an attempt to prevent seepage, a plastic liner was installed along the south wall of the basin prior to the placement of 3.5 oz/yd2 of unwoven filter fabric geotextile material. The installation of the liner and filter fabric is shown in Figure 5.

14
(a) Plastic Membrane (b) Geotextile Lining
Figure 5: Installation of Basin’s Lining
During early stages of testing, it became evident that the plastic liner was insufficient in
reducing the infiltration rate and further modifications would be needed. Several lining options were investigated including: sealing with shotcrete, lining with concrete cloth material, lining with geo-membrane, and lining with bentonite sealer. Ultimately the most feasible option resulted in using a bentonite pond liner. Installation of the liner required excavation of 12 in. below the sediment basin. Once installed, the liner was backfilled and compacted with approximately 6 in. of soil.
To minimize the effects from natural storm events impacting testing, a reclaimed asphalt pavement (RAP) berm was constructed along the south face of the basin. This berm directs stormwater away from the test basin and towards the facility’s lower retention pond. Storm event influences are limited to direct rainfall and runoff occurring in the immediate local upstream vicinity of the test basin.
3.5 AS BUILT
A detailed as-built survey was conducted on June 17, 2014 using a Trimble S6 robotic total station. The survey provides existing topographical conditions of the basin. Data analyses were conducted using esri® ArcGISTM. Figure 6 shows the topography in and around the surrounding area of the sediment basin. The survey was updated on December 12, 2014 after re-grading and compacting the basin floor.
Note: dashed contour lines are ½ ft elevation increments from solid contour lines.
Figure 6: Sediment Basin Topography
Using the topographical survey, a general basin detail drawing was created on AutoCAD,
shown in Figure 7 (a). The constructed sediment basin measures 44 ft x 16 ft along the bottom, with a total excavated footprint of 56 ft x 28 ft.
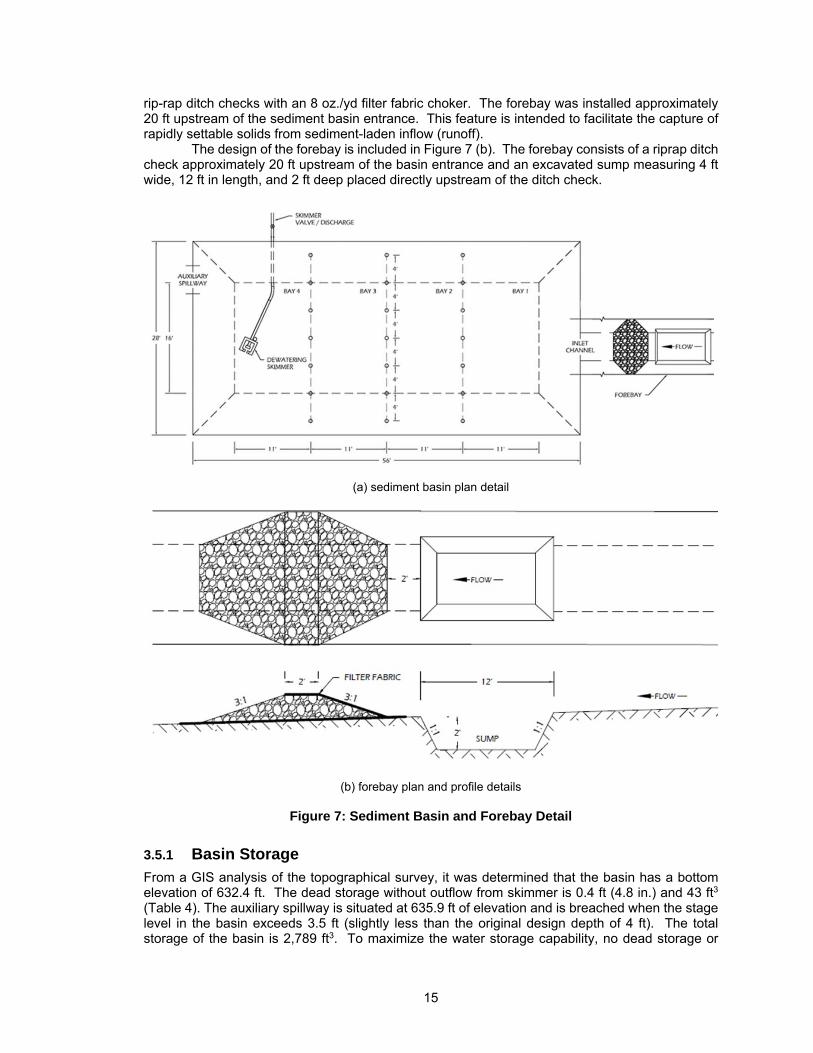
As an installation iteration, a forebay was constructed and prepared for testing. The design followed ALDOT standards and was constructed upstream of the sediment basin along the Flexamat channel. The forebay consisted of an excavated sump positioned between two standard
15
rip-rap ditch checks with an 8 oz./yd filter fabric choker. The forebay was installed approximately 20 ft upstream of the sediment basin entrance. This feature is intended to facilitate the capture of rapidly settable solids from sediment-laden inflow (runoff).
The design of the forebay is included in Figure 7 (b). The forebay consists of a riprap ditch check approximately 20 ft upstream of the basin entrance and an excavated sump measuring 4 ft wide, 12 ft in length, and 2 ft deep placed directly upstream of the ditch check.
(a) sediment basin plan detail
(b) forebay plan and profile details
Figure 7: Sediment Basin and Forebay Detail
3.5.1 Basin Storage
From a GIS analysis of the topographical survey, it was determined that the basin has a bottom elevation of 632.4 ft. The dead storage without outflow from skimmer is 0.4 ft (4.8 in.) and 43 ft3 (Table 4). The auxiliary spillway is situated at 635.9 ft of elevation and is breached when the stage level in the basin exceeds 3.5 ft (slightly less than the original design depth of 4 ft). The total storage of the basin is 2,789 ft3. To maximize the water storage capability, no dead storage or

16
freeboard was considered in the geometry of the basin. Volumetrically, the basin is 70% full when the stage is at 2.55 ft which corresponds to a volume of 1,691 ft3. A detailed stage-storage relationship has been provided in Table 4 and a graphical representation of the live storage volume is shown in Figure 8.
Table 4: Sediment Basin Stage-Storage Relationship
Elev. (ft) Stage (ft) Area (ft2) Storage (ft3)
Dead Storage
43 ft3
632.4 0.0 0.6 0.0
632.6 0.2 93.6 7.7
632.8 0.4 268.3 43.1
Live Storage
2,373 ft3
633.0 0.6 425.1 114.5
633.2 0.8 560.3 213.6
633.4 1.0 667.1 337.2
633.6 1.2 735.6 477.8
633.8 1.4 789.9 630.5
634.0 1.6 838.3 793.3
634.2 1.8 883.5 965.5
634.4 2.0 926.6 1146.6
634.6 2.2 968.1 1336.1
634.8 2.4 1010.6 1533.9
635.0 2.6 1055.4 1740.5
635.2 2.8 1102.3 1956.3
635.4 3.0 1148.8 2181.4
Freeboard
373 ft3
635.6 3.2 1197.6 2415.9
635.8 3.4 1259.5 2661.1
635.91 3.5 1292.9 2789.0
Notes: 1 spillway elevation

17
Figure 8: Live Storage Stage-Storage Graphical Relationship
3.5.2 Water Introduction System
The introduction of water into the basin was designed in a fashion that would allow for accurate flow rate monitoring and ease of use. To achieve the desired flow control necessary for testing, a four-stage water introduction process was developed. This setup consists of a pump system, a tank for equalizing and staging flows, shown in Figure 9 (b) and (c), a discharge weir for controlling flow rates introduced into the channel, pictured in Figure 9 (d), and a soil-water mixing trough for creating sediment-laden flow.
The pumping system used consisted of three semi-trash pumps. Two of these pumps were equipped with 4 in. outflow ports (NorthStar driven with a Honda GX 270 engine, 0.86 ft3/s capacity) and the third was a 3 in. outflow port (NorthStar driven with a Honda GX160 engine, 0.59 ft3/s capacity). These pumps transported water from the storage supply pond into the equalizing tank located upstream the basin inflow channel. This 300 gal (1,136 L) capacity tank was customized with three inlets and four outlets. The inlets are located on the back side of the tank and are connected directly to the pumps via 3 and 4 in. flexible hosing and plumbing fittings. The 4 in. outlets, located directly beneath the tank, are controlled by individual gate valves, shown in Figure 9 (a). These outlets are used to prevent overflows leaving the tank by returning water to the supply pond via 5 in. flexible hosing. By having all outlet valves open, the system allows for pumps to be primed and pressurized prior to commencing a test. Valves are adjusted to introduce water into the test channel at a desired flow rate by maintaining constant water level in the tank. Images of all water introduction components are shown in Figure 9.

18
(a) Gate Valves (b) 300-gal. Equalizing Tank
(c) Manufactured Trough Baffle (d) Installed Weir Plate
Figure 9: Water Introduction System
Water flowing into the test channel is measured through a fabricated rectangular weir plate
attached to an opening cut on the channel face of the equalizing tank, Figure 9 (d). The weir was constructed to allow for different weir plates to be easily interchanged for controlling varying flow ranges. This interchangeable system allowed for any opening to be cut into an approximate 16 in. high by 10 in. blank sheet metal plate which fit into the designed opening. The weir plate was secured to the polyethylene tank by bolts and butterfly nuts to a manufactured washer plate located on the inside of the equalizing tank. Between the tank and washer plate, a rubber gasket was fitted to provide a water tight seal. Two rectangular and a 90 degree V-notch interchangeable weir plates were fabricated for these experiments.
3.5.3 Sediment Introduction System
Sediment introduction system (Figure 10) was designed using a 6 in. diameter, 16 ft long auger that allows sediment to be introduced into the water/sediment mixing trough at a controlled rate. The motor, gear box, and sprocket system, were designed for the desired sediment introduction rate. A 1,740 rpm, 3.0 hp single phase motor (North American Electric, Inc.) was installed with a gear box reducer with ratio of 15:1 (WorldWide Electric Corp.). The gear box turned a 3.30 in. sprocket which was connected to a 1 in. diameter train shaft. This train shaft turned two sprockets. A 7.93 in. sprocket connected to the gearbox sprocket, and a 2.97 in. sprocket connected to the auger drive shaft. The auger drive shaft had a 7.61 in. sprocket. All sprockets were connected using a No. 40 roller chain. This gear ratio system reduced the auger drive shaft speed to approximately 18.8 RPM. The motor was equipped with a thermal protection switch and powered via single phase, 220 V electricity. To further protect the motor from overheating, 15 amp fuses were installed in the electrical circuit.
A hopper was fabricated to allow the system to be loaded with sediment during an experiment. Figure 10 (b) illustrates the complete sediment introduction assembly. For sediment-laden tests to be replicable, a stockpile of soil, native to the state of Alabama, was classified as loam (46.9% sand, 28.1% silt, 25% clay) according to the Unified Soil Classification System and was used for all tests.

19
(a) Flow Regulation System
(b) Sediment Introduction
Figure 10: Sediment and Water Introduction System During Testing.
3.5.4 Sediment Basin Dewatering
Dewatering is achieved using 1.5 in. Faircloth Skimmer which dewaters from the top of the water column. The skimmer is connected to a 1.5 in. section of schedule 40 PVC pipe and a flex hose connection. The flex hose connects to a 4 in. discharge PVC routed to the facility’s sediment basin. A gate valve allows the line to be closed if desired. Based on Faircloth sizing calculations, a 0.9 in. diameter orifice was cut to dewater the basin within approximately 72 hours.

20
Figure 11: 1.5 in. Faircloth Skimmer (J. W. Faircloth & Son 2007)
3.5.5 Auxiliary Spillway
The auxiliary or emergency spillway (Figure 12) has been provided to allow excessive water to overtop at a designated and protected channel. The crest of the spillway is situated 0.4 ft above the live storage section of the basin. The spillway was constructed by creating a depression on the northwest corner of the basin. Breached flows are routed towards the facility’s existing riprap channel and lower retention pond. The spillway is lined with Flexamat concrete matting to protect from scouring during overtopping conditions. Flows enter the spillway when the basin stage exceeds 3.4 ft.
(a) spillway (b) spillway breach
Figure 12: Auxiliary Spillway

21
CHAPTER 4: EXPERIMENTAL DESIGN AND TESTING METHODOLOGY
4
4.1 INTRODUCTION
This chapter describes the experimental design and methodology developed during the study, which are followed when we experimentally testing the performance of the sediment basin. The testing regime and data collection protocols are described in detail.
4.2 TESTING REGIME
The purpose of the conducted tests is to determine the most effective and feasible sediment basin configuration through a series of control tests. The first component of the control tests is to compare the performance of sediment basin with and without a sump. A series of three back-to-back tests were performed on each configuration. Upon the selection of the best performing configuration (i.e. with or without sump), tests continued to investigate the performance of the sediment basin* with an improved baffle between Bay No. 1 and 2. This testing regime allowed for the optimization of tests while allowing direct comparisons between the three tested practices. A total of twelve tests were conducted. Figure 13 depicts the testing regime (L1 stands for longevity evaluation segment).
Figure 13: Testing Regime
4.2.1 WATER INTRODUCTION
Sediment basins are sized based on the contributory drainage area treated by the basin. Two sizing options for the design of a sediment basin are commonly used by ALDOT. The first method provides 3,600 ft3 of storage per acre of contributory area, which can store 1 in. of runoff from the drainage area. To mimic expected flow conditions based on the constructed size of the basin, back calculation procedures were performed. Using the 3,600 ft3/acre design criteria, the basin will provide retention from a contributory area of 0.775 acres under 1 in. of runoff (or effective rainfall) because the storage of the basin is 2,789 ft3. This drainage area results in 2-yr, 24-hr storm hydrograph volume of 8,938 ft3 with a peak flow rate of 2.47 ft3/s.
The second method considers the complete detention of a 2-yr, 24-hr event over the contributory area (ALDOT 2010). When a 2-yr, 24-hr design storm is used, several generalizations need to be made. The CN was determined by applying the state average hydrologic curve number (CN) of 88.5 to the complete contributory area (Perez et al. 2014). It was also assumed that the time of concentration for the event would be 0.083 hour (5 min.), based on the relatively small size of the contributory area. Using these parameters, the contributory area was calculated using the TR-55 method for a 2-yr, 24-hr SCS Type III storm distribution. The 2-yr, 24-hr storm event in the state of Alabama has an average rainfall of 4.43 in (USDA 1986). The iterative analysis conducted using Bentley® PondPack™ software and concluded in a contributory area of 0.242 acres. The resulting storm runoff volume is 2,793 ft3 with a peak flow rate of 0.77 ft3/s.
The intent of flow introduction was to provide the sediment basin with the total volume of runoff produced by a 2-yr, 24-hr storm event. The volume was introduced over the course of 30 minute to mimic the peak flow rate of the storm event. Hydrographs for the 2-yr, 24-hr design storm events are provided in Figure 14 for both the 0.775 acre and 0.242 acre drainage basins derived

22
from the two sizing options. The hydrographs are characterized by a peak at approximately 12.1 hours. For 0.775 acre of drainage area, average flow rates over peak 30, 60, and 90 minutes are 1.66, 1.15, 0.87 ft3/s, respectively. The flow rates before and after the peak 90 minutes are less than 10% of the peak flow, and these small runoff rates most likely do not have significant impacts on soil erosion at the highway construction sites.
(a) 0.775 acre basin
(b) 0.242 acre basin
Figure 14: 2-yr, 24-hr Storm Hydrographs
To investigate contributory drainage area and corresponding storm volume and peak flow
rates for the SCS Type III local 2-yr, 24-hr storm event, several iterations were analyzed. Based on the basin sizing analysis and preliminary sediment basin fill testing runs, the targeted flow introduction rate of 1.50 ft3/s for a 30 minute test duration was selected. This rate maximizes the storage capability of the basin, filling the entire volume during testing. This targeted test flow rate produces 2,700 ft3, and is nearly double the peak flow rate of the design storm, exceeding the peak by 0.73 ft3/s for 0.242 acre drainage area (Table 5). Table 5 summarizes the drainage basin sizing options and provides test flow rates based on typical test durations (i.e., 30, 45, and 60 min.) and calculated storm volume from SCS Type III 2-yr, 24 hr storm (column 4 in Table 5).
The test flow rate of 1.5 ft3/s used for all tests is very close to the average flow rate over peak 30-minute (1.66 ft3/s) for 0.775 acre drainage area (Table 5), which is designed for 3600 ft3 of basin storage per acre of contributory area for 1 in. of runoff. The test flow rate of 1.5 ft3/s used for all tests is basically same as the 30-minute average testing flow rate (1.55 ft3/s) for 0.242 acre drainage area (Table 5), which is designed for 2-yr, 24 hr storm in Alabama.

23
Table 5: Basin Sizing, Runoff Vol., Peak Discharge, and Avg. Testing Flow Rates
Sizing Parameter Contributory Area1 Storm
Volume2 (ft3)Peak Flow
(ft3/s)
Avg. Testing Flow Rate (ft3/s)
acres ft2 30 min 45 min 60 min
1,800 ft3/acre 1.549 67,474 17,864 4.93 9.92 6.62 4.96
3,600 ft3/acre 0.775 33,747 8,938 2.47 4.97 3.31 2.48
2-yr, 24-hr event 0.242 10,541 2,793 0.77 1.55 1.03 0.78
Notes: 1 based on design or sizing parameter, 2 simulated runoff volume for SCS Type III 2-yr, 24 hr storm, and available storage in AU-ESCTF sediment basin is 2,789 ft3
4.3 SEDIMENT INTRODUCTION
To mimic expected sediment transport, the sediment introduction rate was computed using the Modified Universal Soil Loss Equation (MUSLE), which estimates sediment yields based on storm events (Williams 1975). MUSLE uses runoff variables to estimate soil loss on the basis that runoff is a better indicator of sediment yield rather than rainfall amount. The MUSLE is given by the equation: 95 . , where: is sediment yield (tons), is the 2-yr, 24-hr storm runoff volume (acre-ft), is the event peak discharge (ft3/s), and , , , are MUSLE parameters.
Based upon experimental flow calculations conducted for the state of Alabama, the MUSLE equation was applied to the peak 30 minutes of the design rainfall event volume of 935 ft3 with a peak discharge of 0.77 ft3/min (Table 5). A soil erodibility factor (K) of 0.085, was selected for sandy-silt. The slope-length and steepness factor (LS) was determined to be 0.83, representative of 16% slopes at 20 ft lengths for conditions of high rill to interrill erosion ratios (Pitt et al. 2007). Although erosion control practices (i.e., mulching, temporary seeding, etc.) would be implemented alongside sediment controls, the worst-case design scenario for a vegetative cover practice factor (C) of 1.0 was chosen for bare soil conditions. Similarly, the ponding or erosion control practice factor (P) was selected to be 1.0. This situation may be encountered where sediment basins are constructed prior to final site grading and the installation of erosion controls and/or vegetative establishment.
Using the aforementioned variables, total sediment yield was computed for an output of 1,348 lbs. The sediment load targeted metering rate is 44.9 lbs/min over the 30 minute test duration. Based upon this rate, the sediment introduction concentration is 8,044 mg/L (1,356 lbs / 2,700 ft3) if all introduced sediment would flow into the basin (in reality certain amount of sediment is deposited in the inflow channel).
4.4 DATA COLLECTION
Data collected during testing will provide comparative means of performance with the varying tested basin configurations and treatments. Data collected through the experimental process will include: water quality, flow rates, basin stage levels, sediment deposition volumes, and sediment sampling.
4.4.1 Water Sampling
Total suspended solids (TSS) and turbidity are critical water quality indices for comparative performance among tested sediment basin configuration, practices, and treatments. Samples were collected via two methods, automated sampling, and manual grab samples. Collected samples were processed in the laboratory. TSS and turbidity analysis methods follow EPA standard testing specifications (USEPA 1999; 2003). TSS data were also used as part of the mass balance calculations to determine the total amount of solids exiting the basin.
During the duration of the flow introduction period (30 minutes), grab samples were taken in two locations along the channel. The first point was directly downstream of the mixing trough, and the second point was at the sediment basin entrance. Samples were taken at five minute intervals. All manual grab samples commenced once flows reached the sampling location and

24
ended once all flow has subsided (i.e., reached the sediment basin). Typically, six samples were taken at the upstream point, and up to twelve samples at the downstream location due to the delayed dewatering of the forebay.
Five Teledyne ISCO 6712 full-size portable samplers were used in the basin, one per each of the four bays for near surface sampling, and a fifth at approximately 6 in. from the bottom of Bay No. 2. For surface sample collecting samplers, suction tubing was routed to a suction head mounted to floating skimmers in the center of each bay. Sample collection began once the stage in the basin reached the height of the floating skimmers. To minimize the turbulent disturbance caused by the automated sampling, the 3/8 in. suction tubing was modified to route purge and rinse volumes from reentering the basin. Figure 15 depicts the setup which utilizes a tee connection to split sampler line to a collection point and discharge point. One-way check valves direct flows in the desired flow path. The suction line was attached to a taught steel wire angled down gradient across the basin. Since the sampler was programmed to suction the length of line between the collection point and sampler, the slope allows the drain line section between the check valve and discharge point to drain without the need of additional pumping. This setup however was abandoned after valve clogging became an issue causing air to bleed through the valves. A single purge cycle replaced the one-way valve mechanisms.
Figure 15: Sampler Suction and Discharge Line Routing
The automated samplers were programed to collect 400 mL samples through two separate
collection cycles using a non-uniform time paced sampling program. The first cycle of the program collected samples every five minutes for the first 60 minutes of sampling. The second cycle collected one sample every 120 minutes (2 hours) for a period of 23 hours. A total of 24 water samples per sampler will be collected, totaling 120 total automated samples per test (Table 6).

25
Table 6: Water Sample Collection
Sample Type Location Sample Interval Samples Total Samples
Grab Samples Introduction Zone
5 min. 6
18 Basin Entrance 12
Automated Surface
Samples
Bay 1
5 min (0-60 min) /
120 min (1-24 hr)
24
96 Bay 2 24
Bay 3 24
Bay 4 24
Automated Bottom
Sampler Bay 2
5 min (0-60 min) /
120 min (1-24 hr) 24 24
Total Samples: 138
4.4.2 Rain Gauge
To account for any precipitation occurring during testing and dewatering durations, an ISCO 674 rain gauge was used with the sampler located in Bay No. 4. The gauge details the start time of rain events, duration, and intensity.
The experimental design and methodology were developed and described. They are followed and used when the performance of the sediment basin will be experimentally tested. The testing regime and data collection protocols are described to guide future experiments.
26
CHAPTER 5: RESULTS AND CONLUSIONS 5
5.1 INTRODUCTION
The basin’s performance was evaluated by analyzing data that was collected during testing. Sediment basins are considered water quality treatment practices as they are used to detain and remove suspended particles from stormwater prior to discharge. The primary focus of the test results was on turbidity and TSS analysis. Other parameters were also investigated including: the amount of sediment captured in the forebay and in each of the four bays, as well as the basin’s dewatering over time. This chapter presents the results from the initial tests performed on the sediment basin.
5.2 BASIN STORAGE
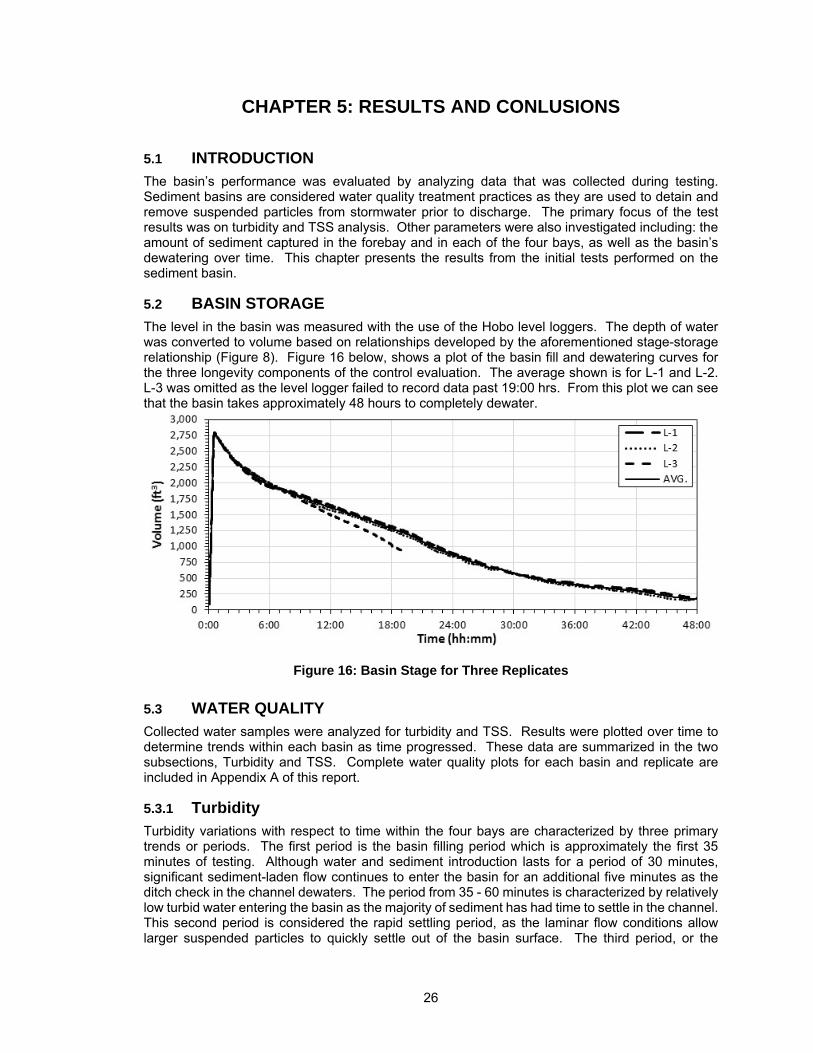
The level in the basin was measured with the use of the Hobo level loggers. The depth of water was converted to volume based on relationships developed by the aforementioned stage-storage relationship (Figure 8). Figure 16 below, shows a plot of the basin fill and dewatering curves for the three longevity components of the control evaluation. The average shown is for L-1 and L-2. L-3 was omitted as the level logger failed to record data past 19:00 hrs. From this plot we can see that the basin takes approximately 48 hours to completely dewater.
Figure 16: Basin Stage for Three Replicates
5.3 WATER QUALITY
Collected water samples were analyzed for turbidity and TSS. Results were plotted over time to determine trends within each basin as time progressed. These data are summarized in the two subsections, Turbidity and TSS. Complete water quality plots for each basin and replicate are included in Appendix A of this report.
5.3.1 Turbidity
Turbidity variations with respect to time within the four bays are characterized by three primary trends or periods. The first period is the basin filling period which is approximately the first 35 minutes of testing. Although water and sediment introduction lasts for a period of 30 minutes, significant sediment-laden flow continues to enter the basin for an additional five minutes as the ditch check in the channel dewaters. The period from 35 - 60 minutes is characterized by relatively low turbid water entering the basin as the majority of sediment has had time to settle in the channel. This second period is considered the rapid settling period, as the laminar flow conditions allow larger suspended particles to quickly settle out of the basin surface. The third period, or the

27
polishing period, is the time from 60 minutes to 25 hours where the basin is no longer receiving inflow and is allowed to settle suspended settlement without turbulent inflow.
During the filling period, turbidity in the first bay averaged 930 NTU (Figure 17) and was contributed to by strong mixing and turbulence created by the inflow. During the first period, the inflow took about three minutes to reach the basin through the inflow channel and ditch check. It took about five minutes to fill the dead storage (0.4 ft or 43 ft3, Table 4). During filling of the dead storage, flow velocity and circulation (turbulence) were strong which created somewhat uniform turbidity in all four bays of the basin. Automated sampling was started once all receiving sampler inlets were submerged (typically 8-10 minutes after test start). In contrast to bay 1, the three other bays (bay 2, 3, and 4) showed an exponential decrease in turbidity after about 15 minutes into the test. This decrease can be contributed to a decrease in turbulence near the water surface in those bays, which allow particles to settle from suspension. This decrease indicates that although the filling period lasts for the first 35 minutes of the test, the turbid conditions are only experienced for the first 15 minutes in bays 2, 3, and 4. In contrast to surface conditions, the samples collected near the basin bottom in bay 2 show consistent levels of turbidity in the magnitude of ~1,150 NTU, and had relatively small variations (~130 NTU) during the filling period as shown in Figure 18.
The second or rapid settling period was from 35 to 60 minutes in the first bay and from 15 to 60 minutes in the other three bays. This rapid settling period is characterized by larger particles quickly settling towards the bottom of the basin from the upper stratum of the water column. The turbidity dropped from ~900 NTU to 300 - 400 NTU (Figure 17) across all bays. Bay 1 had the most drastic decrease in turbidity levels occurring about 35 minutes into the test, once inflows had subsided.
The third, or polishing, period started from about 60 minutes after the testing commenced. Turbidity decreased slowly with time when turbidity became lower than 300 - 400 NTU. This indicates only relatively fine particles remain in suspension and settle very slowly. The gradual decrease of turbidity was from approximately 300 - 400 to ~100 NTU in all four bays (Figure 17). In the third period, water velocity in the basin is basically zero, the vertical settling process in each bay is more or less independent. Therefore, surface turbidities in all four bays are similar except for outlier samples due to unknown disturbance. The turbidity in bay 4 at the conclusion of sampling (~25 hours) was measured at 83 NTU, a 91% reduction from the inflow average of 930 NTU experienced in bay 1.
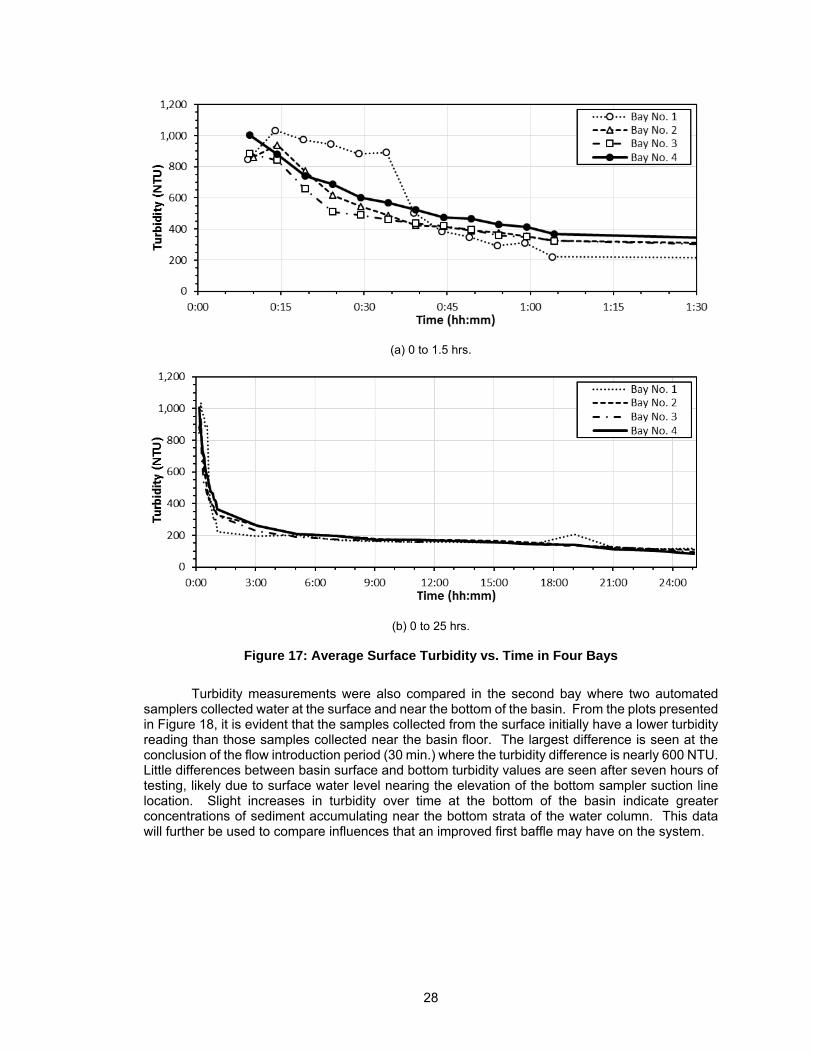
28
(a) 0 to 1.5 hrs.
(b) 0 to 25 hrs.
Figure 17: Average Surface Turbidity vs. Time in Four Bays
Turbidity measurements were also compared in the second bay where two automated
samplers collected water at the surface and near the bottom of the basin. From the plots presented in Figure 18, it is evident that the samples collected from the surface initially have a lower turbidity reading than those samples collected near the basin floor. The largest difference is seen at the conclusion of the flow introduction period (30 min.) where the turbidity difference is nearly 600 NTU. Little differences between basin surface and bottom turbidity values are seen after seven hours of testing, likely due to surface water level nearing the elevation of the bottom sampler suction line location. Slight increases in turbidity over time at the bottom of the basin indicate greater concentrations of sediment accumulating near the bottom strata of the water column. This data will further be used to compare influences that an improved first baffle may have on the system.

29
(a) 0 to 1.5 hrs.
(b) 0 to 25 hrs.
Figure 18: Bay No. 2 Surface vs. Near-Bottom Turbidity (Average)
Figure 19 and Figure 20 show data analysis for turbidity in bay 1 and 2 that determined the
settling rate (change of turbidity with time) in the rapid settling and polishing periods. Exponential decrease functions of turbidity versus time were fitted to the data in each period. Fitted exponential decay coefficients clearly show rapid settling in bay 1 after the conclusion of water introduction, strong settling in bay 2 after 15 minutes into testing, and slow settling in the third period in both bays 1 and 2. Regression coefficient R2 values are high for all fitted exponential decrease functions.

30
(a) 2nd period of settling
(b) 3rd period of settling
Figure 19: Settling Rates Based on Turbidity in Bay 1

31
(a) 2nd period of settling
(b) 3rd period of settling
Figure 20: Settling Rates Based on Turbidity in Bay 2
5.3.2 Total Suspended Solids (TSS)
TSS measurements corroborate the conditions extrapolated from the turbidity data. Three dominant periods are evident (i.e., filling, rapid settlement, and polishing periods) from the TSS reductions over time. The filling period for TSS is apparently shorter than the turbidity filing periods. The filing period in bay 1 ends at approximately 20 minutes. Furthermore, only bay 1 and 2 have a filling period similar to those seen in the turbidity data. Bays 3 and 4 have no filling period effect as the trends show that rapid settlement occurs at the commencement of sampling as depicted in Figure 21. Unlike turbidity, there is a significant separation in TSS between the first bay and the three others, indicating that a reduction in surface turbulence is a catalyst to allowing suspended sediment to settle. TSS in bay 1 during the filling period averages 1,190 mg/L and spikes at 1,380 mg/L. The rapid settling period reduced TSS from ~1,400 mg/L in bay 1 and ~750 mg/L in bays 2, 3, and 4 to ~250 mg/L across all four bays. The polishing period starts approximately 1 hour into testing and reduces TSS from ~250 to ~50 mg/L.

32
(a) 0 to 1.5 hrs.
(b) 0 to 25 hrs.
Figure 21: Average Surface TSS vs. Time in Four Bays
Figure 22 shows a plot comparing TSS at the surface and near the bottom of bay 2. The
basin bottom has a filling period of 35 minutes indicated by increased TSS levels. TSS concentrations decline from a maximum of 1,950 to 200 mg/L during the rapid settling period. After the rapid settling period (i.e., first 60 minutes), minor difference is noted between surface and bottom TSS concentrations.
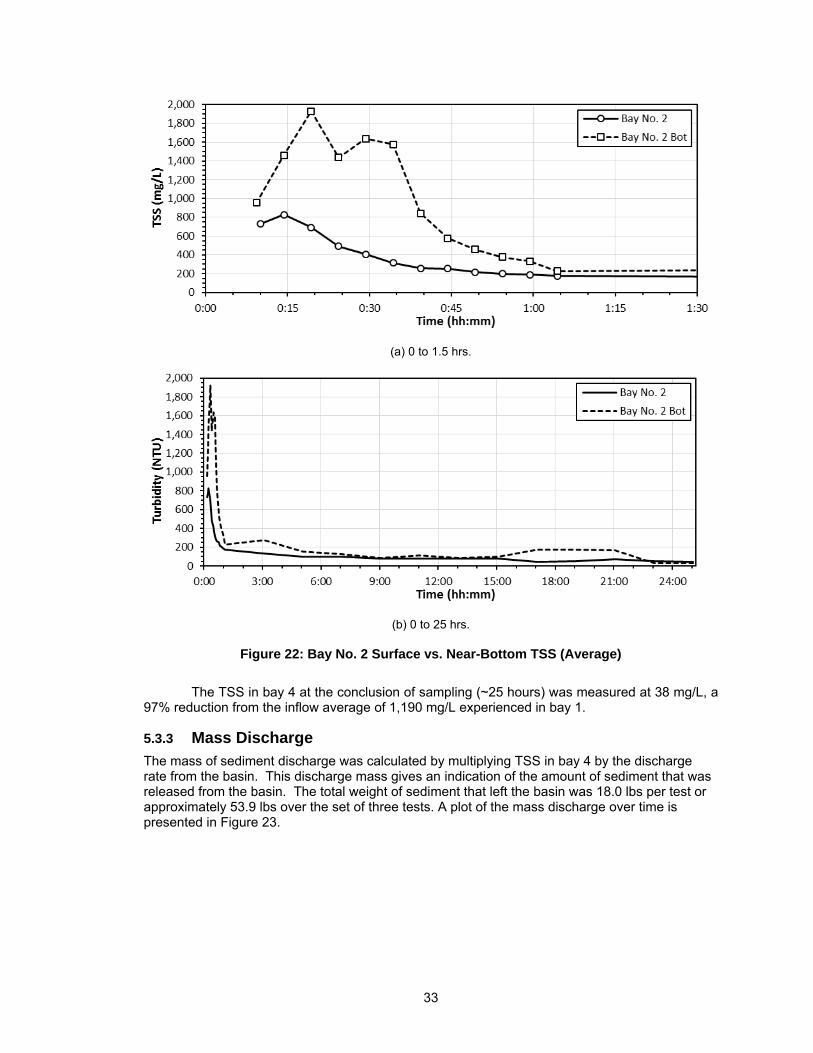
33
(a) 0 to 1.5 hrs.
(b) 0 to 25 hrs.
Figure 22: Bay No. 2 Surface vs. Near-Bottom TSS (Average)
The TSS in bay 4 at the conclusion of sampling (~25 hours) was measured at 38 mg/L, a
97% reduction from the inflow average of 1,190 mg/L experienced in bay 1.
5.3.3 Mass Discharge
The mass of sediment discharge was calculated by multiplying TSS in bay 4 by the discharge rate from the basin. This discharge mass gives an indication of the amount of sediment that was released from the basin. The total weight of sediment that left the basin was 18.0 lbs per test or approximately 53.9 lbs over the set of three tests. A plot of the mass discharge over time is presented in Figure 23.

34
Figure 23: Mass Discharge vs. Time
5.3.4 NTU vs. TSS Relationship
To characterize the relationship between turbidity and TSS, a plot showing the comparative response of the two water quality parameters was generated. The data input for the chart included all water quality samples collected and analyzed from the automated samplers to date. Figure 24 shows the relationship which has an R2 correlation of 0.78.
Figure 24: NTU vs. TSS Relationship
5.4 SEDIMENT DEPOSITION
The amount of sediment deposited per basin was manually collected in each bay and forebay area and stored in individual fabricated boxes at the conclusion of the third replicate test. These boxes allowed the sediment to separate from water and adequately dry to a uniform moisture content. The sediment contained in the boxes was measured and the volume calculated geometrically. In addition to volume, three representative core soil samples from each box were collected and processed for moisture content to calculate the weight of sediment within each box.
An estimated total of 4,066 lbs of sediment was introduced into the basin during the three replicate evaluations. At the conclusion of the three replicates, the forebay captured the majority of the sediment (2,500 lbs or 61.5% of introduced sediment). The basin was responsible for capturing 14.5% of introduced sediment. The resulting discharge from the basin is calculated to
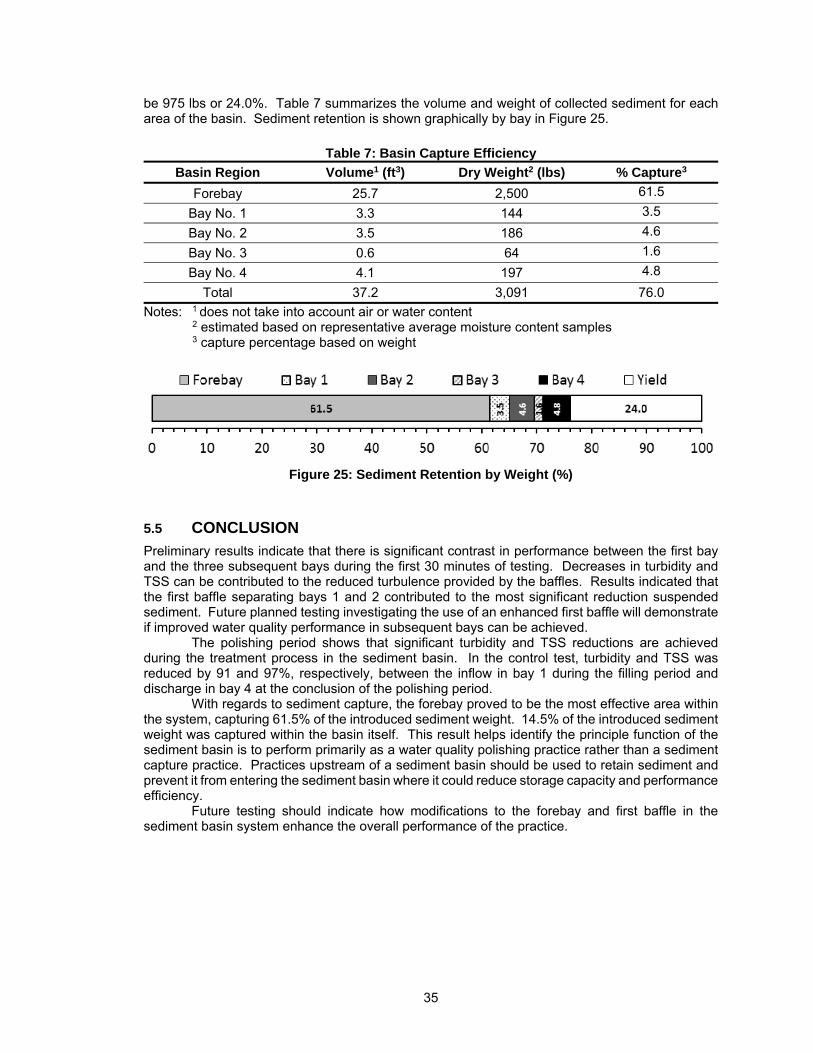
35
be 975 lbs or 24.0%. Table 7 summarizes the volume and weight of collected sediment for each area of the basin. Sediment retention is shown graphically by bay in Figure 25.
Table 7: Basin Capture Efficiency
Basin Region Volume1 (ft3) Dry Weight2 (lbs) % Capture3
Forebay 25.7 2,500 61.5
Bay No. 1 3.3 144 3.5
Bay No. 2 3.5 186 4.6
Bay No. 3 0.6 64 1.6
Bay No. 4 4.1 197 4.8
Total 37.2 3,091 76.0
Notes: 1 does not take into account air or water content 2 estimated based on representative average moisture content samples 3 capture percentage based on weight
Figure 25: Sediment Retention by Weight (%)
5.5 CONCLUSION
Preliminary results indicate that there is significant contrast in performance between the first bay and the three subsequent bays during the first 30 minutes of testing. Decreases in turbidity and TSS can be contributed to the reduced turbulence provided by the baffles. Results indicated that the first baffle separating bays 1 and 2 contributed to the most significant reduction suspended sediment. Future planned testing investigating the use of an enhanced first baffle will demonstrate if improved water quality performance in subsequent bays can be achieved.
The polishing period shows that significant turbidity and TSS reductions are achieved during the treatment process in the sediment basin. In the control test, turbidity and TSS was reduced by 91 and 97%, respectively, between the inflow in bay 1 during the filling period and discharge in bay 4 at the conclusion of the polishing period.
With regards to sediment capture, the forebay proved to be the most effective area within the system, capturing 61.5% of the introduced sediment weight. 14.5% of the introduced sediment weight was captured within the basin itself. This result helps identify the principle function of the sediment basin is to perform primarily as a water quality polishing practice rather than a sediment capture practice. Practices upstream of a sediment basin should be used to retain sediment and prevent it from entering the sediment basin where it could reduce storage capacity and performance efficiency.
Future testing should indicate how modifications to the forebay and first baffle in the sediment basin system enhance the overall performance of the practice.

36
REFERENCES
Alabama Department of Environmental Management (2011). "National Pollutant Discharge Elimination System Permit General Permit."Montgomery, AL.
Alabama Department of Environmental Management (2013). "Water Division - Water Quality Program: Division 335-6."Montgomery, AL.
Alabama Department of Transportation (2010). "ALDOT Sedimentation Basin Recommendations."Montgomery, AL.
Alabama Department of Transportation (2012). "Standard Best Management Practices."Montgomery, AL.
Alabama Department of Transportation (2012). "Standard Specifications for Highway Construction."Montgomery, AL.
Alabama Soil and Water Conservation Committee (2009). "Alabama Handbook for Erosion Control, Sediment Control and Stormwater Management on Construction Sites and Urban Areas."Montgomery, AL.
Alabama Soil and Water Conservation Committee (2014). "Alabama Handbook for Erosion Control, Sediment Control and Stormwater Management on Construction Sites and Urban Areas."Montgomery, AL.
Alabama Water Watch Association (2013). "Turbidity and Secchi Disk Principles." <Error! Hyperlink reference not valid.. (July 16, 2013).
Albert, R. J. "Designing Sedimentation Basins for Better Sediment Capture." Proc., Soil Erosion Research for the 21st Century, Proc. Int. Symp, American Society of Agricultural Engineers, 63-66.
Barfield, B. J., R.C. Warner, and Haan, C. T. (1983). Applied Hydrology and Sedimentology for Disturbed Areas, Oklahoma Technical Press, Stillwater, OK.
Bhardwaj, A. K., and McLaughlin, R. A. (2008). "Simple Polyacrylamide Dosing Systems for Turbidity Reduction in Stilling Basins." Transactions of the ASABE, 51(Compendex), 1653-1662.
Bidelspach, D. A., Jarrett, A. R., and Vaughan, B. T. (2004). "Influence of Increasing the Delay Time Between the Inflow and Outflow Hydrographs of a Sediment Basin." Transactions of the American Society of Agricultural Engineers, 47(Compendex), 439-444.
Chen, C. N. (1975). "Design of Sediment Retention Basins." Proc., National Symposium on Urban Hydrology and Sediment Control.
Cimbala, J. M., and Cengel, Y. A. (2008). Essentials of Fluid Mechanics: Fundamentals and Applications, McGraw-Hill, New York, NY.
Edwards, C. L., Shannon, R. D., and Jarrett, A. R. (1999). "Sedimentation basin retention efficiencies for sediment, nitrogen, and phosphorus from simulated agricultural runoff." Transactions of the American Society of Agricultural Engineers, 42(Compendex), 403-409.
Fang, X., Zech, W. C., Logan, C. P., and Clement, T. P. (2012). "Assessing Performance Characteristics of Sediment Basins Constructed in Franklin County." Research Report No. 2 (Project Number 930-791) to Alabama Department of Transportation, Auburn Highway Research Center, Auburn, AL 36849.
Fennessey, L. A. J., and Jarrett, A. R. (1997). "Influence of Principal Spillway Geometry and Permanent Pool Depth on Sediment Retention of Sedimentation Basins." Transactions of the American Society of Agricultural Engineers, 40(Compendex), 53-59.
Fifield, J. S. (2011). Designing and Reviewing Effective Sediment and Erosion Control Plans, Forester Media, Santa Barbara, CA.
Goldman, S. J., Jackson, K., and Bursztynsky, T. A. (1986). Erosion and Sediment Control Handbook, McGraw-Hill, New York, NY.
Griffin, M. L., Barfield, B. J., and Warner, R. C. (1985). "Laboratory Studies of Dead Storage in Sediment Ponds." Transactions of the American Society of Agricultural Engineers, 28(Compendex), 799-804.
Harper, H. H. (1990). "Long-Term Performance Evaluation of the Alum Stormwater Treatment System at Lake Ella, Florida." Florida Department of Environmental Regulation, Tallahassee, FL.

37
Huang, C., and Ehrlich, R. (2003). "Erosion Control and the Impact of Highway Construction on Wetland Water Quality: A Case Study." Watershed Management, 117-138.
Innovative Applied Solutions, LLC, (2014). "IAS Skimmer." <http://www.iasllcusa.com/>. (April 12, 2015).
J. W. Faircloth & Son, Inc., (2007). "1.5" Faircloth Skimmer Cut Sheet." <fairclothskimmer.com>. (July 10, 2014).
J. W. Faircloth & Son, Inc., (2015). "Faircloth Skimmer." <http://www.fairclothskimmer.com/home>. (April 12, 2015).
J. W. Qian, X. J. Xiang, W. Y. Yang, M. Wang, and Zheng, B. Q. (2004). "Flocculation Performance of Different Polyacrylamide and the Relation Between Optimal Dose and Critical Concentration." European Polymer Journal, 40.
Lentz, R. D., and Sojka, R. E. (1994). "Field Results Using Polyacrylamide to Manage Furrow Erosion and Infiltration." Soil Science, 158, 274-282.
McCutchen, J. (2015). "Fee Saver Stormwater Services." <http://www.swfeesaver.com/>. (April 12, 2015).
McLaughlin, R. A. "The Potential for Substantial Improvements in Sediment and Turbidity Control." Proc., Total Maximum Daily Load (TMDL) Environmental Regulations–II, ASAE, 262-272.
McLaughlin, R. A. "Polyacrylamide Blocks for Turbidity Control on Construction Sites." Proc., 2006 ASABE Annual International Meeting.
McLaughlin, R. A., and Zimmerman, A. (2009). "Best Managment Practices for Chemical Treatment Systems for Construction Stormwater and Dewatering." Federal Highway Administration, Vancouver, Wa.
Millen, J. A., Jarrett, A. R., and Faircloth, J. W. (1997). "Experimental Evaluation of Sedimentation Basin Performance for Alternative Dewatering Systems." American Society of Agricultural Engineers, 40(4), 1087-1095.
North Carolina Department of Environment and Natural Resources (2013). "North Carolina Erosoin and Sediment Control Planning and Design Manual."Raleigh, NC.
North Carolina Department of Transportation (2012). "Standard Specifications for Roads and Structures."Raleigh, NC.
North Carolina Sedimentation Control Commission (2013). "Erosion and Sediment Control Planning and Design Manual."Raleigh, NC.
Peng, F. F., and Di, P. (1994). "Effect of Multivalents Salts - Calcium and Aluminum on the Flocculation of Kaolin Suspension with Anionic Plyacrylamide." Journal of Colloid and Interface Science, 164.
Perez, M. A., Zech, W. C., Donald, W. N., and Fang, X. (2014). "Methodology for Evaluating Inlet Protection Practices Using Large-Scale Testing Techniques." Journal of Hydrologic Engineering, 20(4).
ProTech General Contracting Services, I. (2004). "Polymer Coagulatns and FLocculants for Stormwater Applications."Fairfield, CA.
Przepiora, A., Hesterberg, D., Parsons, J. E., Gilliam, J. W., Cassel, D. K., and Faircloth, W. (1997). "Calcium Sulfate as a Flocculant to Reduce Sedimentation Basin Water Turbidity." Journal of Environmental Quality, 26, 1605-1611.
Przepiora, A., Hesterberg, D., Parsons, J. E., Gilliam, J. W., Cassel, D. K., and Faircloth, W. (1998). "Field Evaluation of Calcium Sulfate as a Chemical Flocculant for Sedimentation Basins." J. Environ. Qual., 27(3), 669-678.
Sojka, R. E., Bjorneberg, D. L., Entry, J. A., Lentz, R. D., and Orts, W. J. (2007). "Polyacrylamide in Agriculture and Environmental Land Management." Advances in Agronomy, 92.
Thaxton, C. S., Calantoni, J., and McLaughlin, R. A. (2004). "Hydrodynamic Assessment of Various Types of Baffles in a Sediment Retention Pond." Transactions of the American Society of Agricultural Engineers, 47(Compendex), 741-749.
Thaxton, C. S., and McLaughlin, R. A. (2005). "Sediment Capture Effectiveness of Various Baffle Types in a Sediment Retention Pond." Transactions of the American Society of Agricultural Engineers, 48(Compendex), 1795-1802.
United States Department of Agriculture (1986). "Technical Release 55: Urban Hydrology for Small Watersheds." Natural Resources Conservation Service, Washington, DC.
38
United States Environmental Protection Agency (1976). "Erosion and Sediment Control: Surface Mining in the Eastern U.S."Washington, DC.
United States Environmental Protection Agency (1986). "Methodology for Analysis of Detention Basins for Control of Urban Runoff Quality."Washington, DC.
United States Environmental Protection Agency (1999). "EPA Method 160: Total Suspended Solids (TSS) ", United States Environmental Protection Agency, (USEPA).
United States Environmental Protection Agency (2003). "Standard Method 2130: Analystical Method for Turbidity Measurement." United States Environmental Protection Agency, (USEPA).
United States Environmental Protection Agency (2005). "National Managment Measures to Control Nonpoint Source Pollution from Urban Areas."Washington, DC.
United States Environmental Protection Agency (2009). "Effluent Limitations Guidelines and Standards for the Construction and Development Point Source Category." U. S. E. P. Agency, ed., EPA Federal Register, Washington, DC, 62995-63058.
Vaughan, B. T., and Jarrett, A. R. (2001). "Experimental Evaluation of Alternative Configurations for Floating Riser Sedimentation Basin Dewatering Devices." 2001 ASAE Annual MeetingSacramento, CA.
Virginia Department of Environmental Quality (1992). "Virginia Erosion and Sediment Control Handbook."Richmond, VA.
Ward, A. D., Haan, C. T., and Barfield, B. J. (1979). "Prediction of Sediment Basin Performance." Transactions of the American Society of Agricultural Engineers, 22(1).
Williams, J. R. (1975). "Sediment-Yield Prediction with Universal Equation using Runoff Energy Factor."Washington D.C., 244-252.

39
APPENDIX A
DETAILED WATER QUALITY GRAPHS

40
(a) 0 to 1.5 hrs.
(b) 0 to 25 hrs.
Figure 26: Bay No. 1 Turbidity

41
(a) 0 to 1.5 hrs.
(b) 0 to 25 hrs.
Figure 27: Bay No. 2 Turbidity
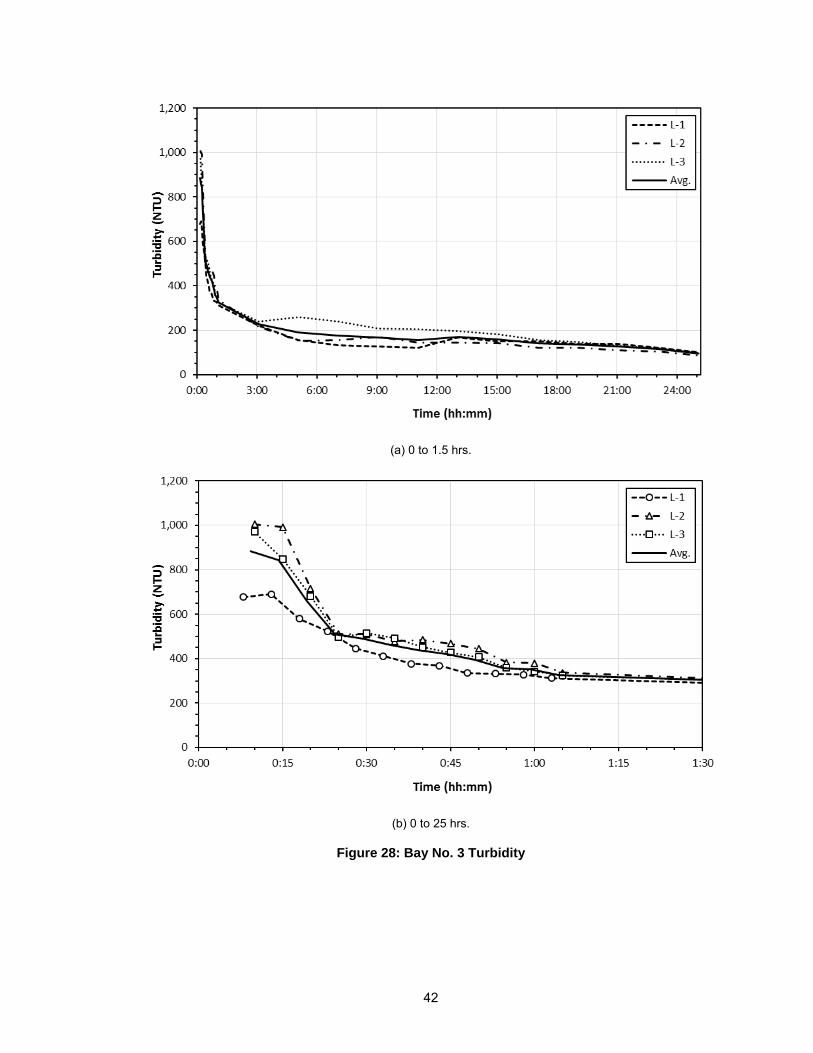
42
(a) 0 to 1.5 hrs.
(b) 0 to 25 hrs.
Figure 28: Bay No. 3 Turbidity
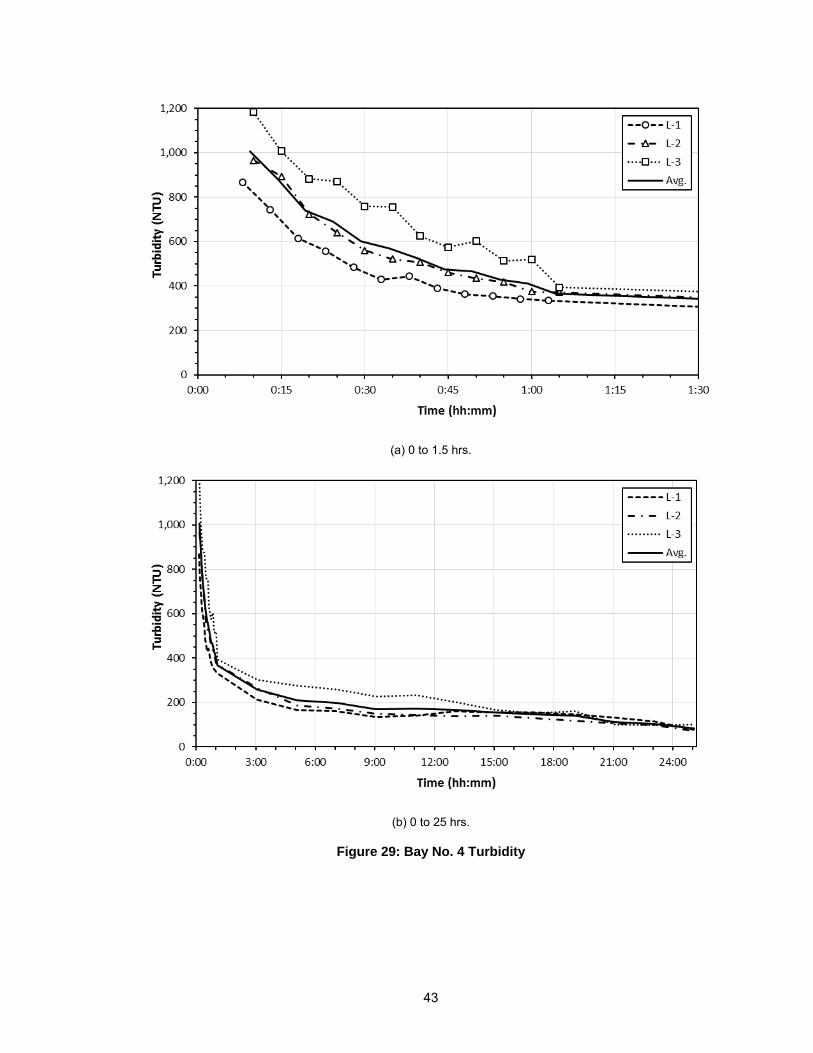
43
(a) 0 to 1.5 hrs.
(b) 0 to 25 hrs.
Figure 29: Bay No. 4 Turbidity

44
(a) 0 to 1.5 hrs.
(b) 0 to 25 hrs.
Figure 30: Bay No. 1 TSS

45
(a) 0 to 1.5 hrs.
(b) 0 to 25 hrs.
Figure 31: Bay No. 2 TSS

46
(a) 0 to 1.5 hrs.
(b) 0 to 25 hrs.
Figure 32: Bay No. 3 TSS

47
(a) 0 to 1.5 hrs.
(b) 0 to 25 hrs.
Figure 33: Bay No. 4 TSS