design and comprehensive analysis of maximum power point
TRANSCRIPT

Design and Comprehensive Analysisof Maximum Power Point TrackingTechniques in Photovoltaic Systems
Ali M. Eltamaly, Mohamed A. Mohamed, and Ahmed G. Abo-Khalil
Abstract In this chapter the performance of various maximum power point trackingtechniques for Photovoltaic (PV) systems has been presented, under uniform andnon-uniform irradiance conditions. Under uniform irradiance conditions, the power-voltage curve of PV systems is nonlinear and contains one peak point whose locationappertains to the irradiation and surface temperature of the PV system. Partial shadingon PV modules reduces the generated power than the maximum power generatedfrom each module separately. The traditional techniques of tracking the maximumpower point are designed to track the global peak but they always failed to capture theexact point. In this chapter, different techniques of maximum power point trackinghave been introduced, analyzed, and simulated. MATLAB, SIMULINK, and PSIMsoftware have been utilized to simulate the PV systems under various shading condi-tions. Furthermore, the response of the different techniques of maximum power pointtrackers has been evaluated under different weather conditions.
Keywords Photovoltaic · Maximum power point tracking · Partial shading ·PSIM · Optimal design · Solar energyA. M. Eltamaly (B)Electrical Engineering Department, Faculty of Engineering, Mansoura University, Mansoura35511, Egypte-mail: [email protected]
Sustainable Energy Technologies Center, King Saud University, Riyadh 11421, Saudi Arabia
K.A. CARE Energy Research and Innovation Center, Riyadh 11451, Saudi Arabia
M. A. MohamedElectrical Engineering Department, Faculty of Engineering, Minia University, Minia 61519, Egypte-mail: [email protected]
A. G. Abo-KhalilDepartment of Electrical Engineering, College of Engineering, Majmaah University, Almajmaah11952, Saudi Arabiae-mail: [email protected]
Department of Electrical Engineering, College of Engineering, Assuit University, Assuit 71515,Egypt
© The Author(s), under exclusive license to Springer Nature Switzerland AG 2021S. Motahhir and A. M. Eltamaly (eds.), Advanced Technologies for SolarPhotovoltaics Energy Systems, Green Energy and Technology,https://doi.org/10.1007/978-3-030-64565-6_9
253
254 A. M. Eltamaly et al.
1 Introduction
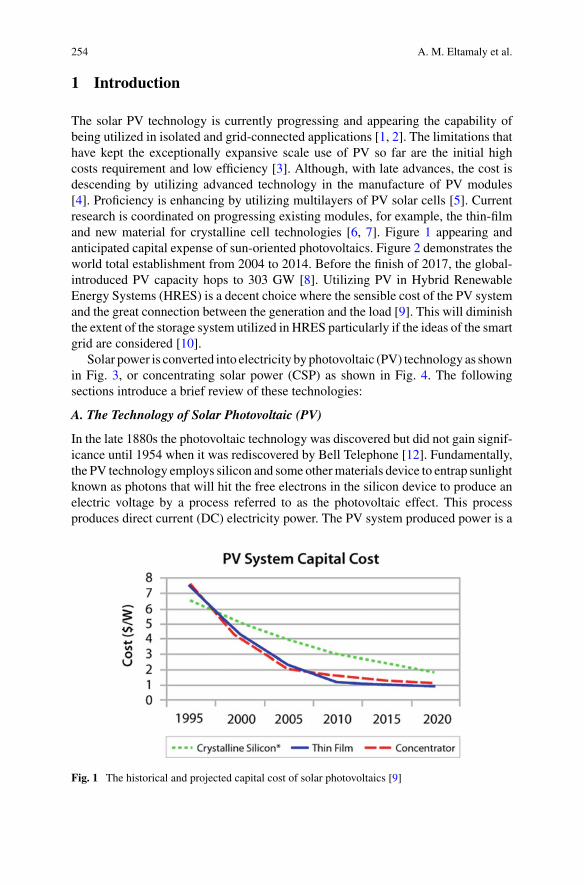
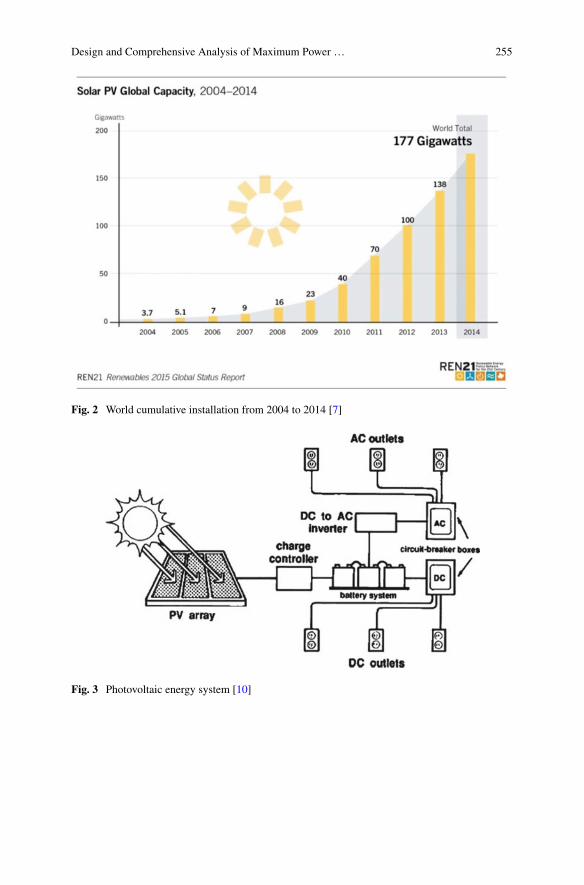
The solar PV technology is currently progressing and appearing the capability ofbeing utilized in isolated and grid-connected applications [1, 2]. The limitations thathave kept the exceptionally expansive scale use of PV so far are the initial highcosts requirement and low efficiency [3]. Although, with late advances, the cost isdescending by utilizing advanced technology in the manufacture of PV modules[4]. Proficiency is enhancing by utilizing multilayers of PV solar cells [5]. Currentresearch is coordinated on progressing existing modules, for example, the thin-filmand new material for crystalline cell technologies [6, 7]. Figure 1 appearing andanticipated capital expense of sun-oriented photovoltaics. Figure 2 demonstrates theworld total establishment from 2004 to 2014. Before the finish of 2017, the global-introduced PV capacity hops to 303 GW [8]. Utilizing PV in Hybrid RenewableEnergy Systems (HRES) is a decent choice where the sensible cost of the PV systemand the great connection between the generation and the load [9]. This will diminishthe extent of the storage system utilized in HRES particularly if the ideas of the smartgrid are considered [10].
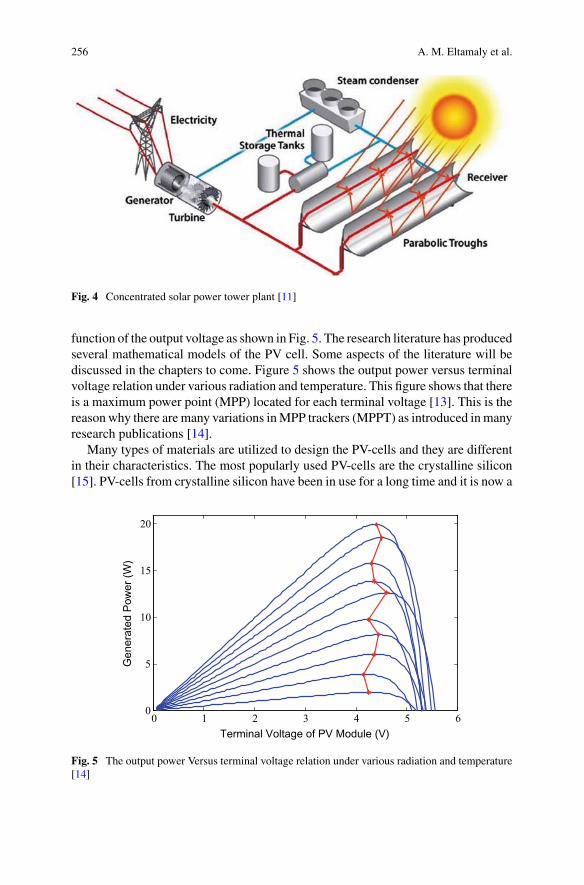
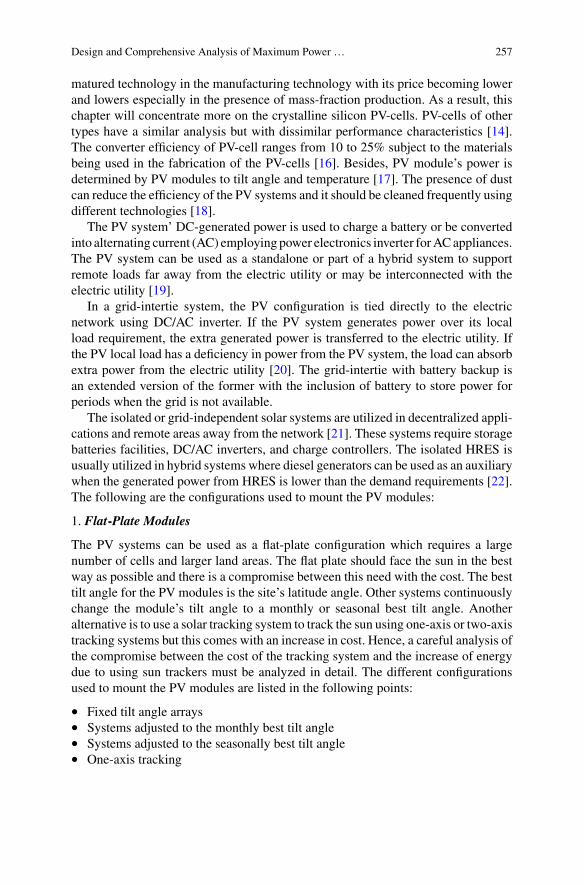
Solar power is converted into electricity by photovoltaic (PV) technology as shownin Fig. 3, or concentrating solar power (CSP) as shown in Fig. 4. The followingsections introduce a brief review of these technologies:
A. The Technology of Solar Photovoltaic (PV)
In the late 1880s the photovoltaic technology was discovered but did not gain signif-icance until 1954 when it was rediscovered by Bell Telephone [12]. Fundamentally,the PV technology employs silicon and some othermaterials device to entrap sunlightknown as photons that will hit the free electrons in the silicon device to produce anelectric voltage by a process referred to as the photovoltaic effect. This processproduces direct current (DC) electricity power. The PV system produced power is a
Fig. 1 The historical and projected capital cost of solar photovoltaics [9]
Design and Comprehensive Analysis of Maximum Power … 255
Fig. 2 World cumulative installation from 2004 to 2014 [7]
Fig. 3 Photovoltaic energy system [10]
256 A. M. Eltamaly et al.
Fig. 4 Concentrated solar power tower plant [11]
function of the output voltage as shown in Fig. 5. The research literature has producedseveral mathematical models of the PV cell. Some aspects of the literature will bediscussed in the chapters to come. Figure 5 shows the output power versus terminalvoltage relation under various radiation and temperature. This figure shows that thereis a maximum power point (MPP) located for each terminal voltage [13]. This is thereasonwhy there aremany variations inMPP trackers (MPPT) as introduced inmanyresearch publications [14].
Many types of materials are utilized to design the PV-cells and they are differentin their characteristics. The most popularly used PV-cells are the crystalline silicon[15]. PV-cells from crystalline silicon have been in use for a long time and it is now a
0 1 2 3 4 5 60
5
10
15
20
Terminal Voltage of PV Module (V)
Gen
erat
ed P
ower
(W)
Fig. 5 The output power Versus terminal voltage relation under various radiation and temperature[14]
Design and Comprehensive Analysis of Maximum Power … 257
matured technology in the manufacturing technology with its price becoming lowerand lowers especially in the presence of mass-fraction production. As a result, thischapter will concentrate more on the crystalline silicon PV-cells. PV-cells of othertypes have a similar analysis but with dissimilar performance characteristics [14].The converter efficiency of PV-cell ranges from 10 to 25% subject to the materialsbeing used in the fabrication of the PV-cells [16]. Besides, PV module’s power isdetermined by PV modules to tilt angle and temperature [17]. The presence of dustcan reduce the efficiency of the PV systems and it should be cleaned frequently usingdifferent technologies [18].
The PV system’ DC-generated power is used to charge a battery or be convertedinto alternating current (AC) employing power electronics inverter forACappliances.The PV system can be used as a standalone or part of a hybrid system to supportremote loads far away from the electric utility or may be interconnected with theelectric utility [19].
In a grid-intertie system, the PV configuration is tied directly to the electricnetwork using DC/AC inverter. If the PV system generates power over its localload requirement, the extra generated power is transferred to the electric utility. Ifthe PV local load has a deficiency in power from the PV system, the load can absorbextra power from the electric utility [20]. The grid-intertie with battery backup isan extended version of the former with the inclusion of battery to store power forperiods when the grid is not available.
The isolated or grid-independent solar systems are utilized in decentralized appli-cations and remote areas away from the network [21]. These systems require storagebatteries facilities, DC/AC inverters, and charge controllers. The isolated HRES isusually utilized in hybrid systems where diesel generators can be used as an auxiliarywhen the generated power from HRES is lower than the demand requirements [22].The following are the configurations used to mount the PV modules:
1. Flat-Plate Modules
The PV systems can be used as a flat-plate configuration which requires a largenumber of cells and larger land areas. The flat plate should face the sun in the bestway as possible and there is a compromise between this need with the cost. The besttilt angle for the PV modules is the site’s latitude angle. Other systems continuouslychange the module’s tilt angle to a monthly or seasonal best tilt angle. Anotheralternative is to use a solar tracking system to track the sun using one-axis or two-axistracking systems but this comes with an increase in cost. Hence, a careful analysis ofthe compromise between the cost of the tracking system and the increase of energydue to using sun trackers must be analyzed in detail. The different configurationsused to mount the PV modules are listed in the following points:
• Fixed tilt angle arrays• Systems adjusted to the monthly best tilt angle• Systems adjusted to the seasonally best tilt angle• One-axis tracking

258 A. M. Eltamaly et al.
Fig. 6 Fixed tilt angle, FTA photovoltaic system [24]
• Two-axis tracking• Concentrator arrays
2. Fixed Tilt Angle Arrays
In this method, the modules are fixed facing north in the southern hemisphere at atilt angle comparable to the site’s latitude [14, 23]. The best tilt angle approximatelyequals the latitude of the site facing the equator in the north and south of the earth[24]. Figure 6 shows a Fixed Tilt Angle (FTA) photovoltaic system.
3. Monthly Adjusted Tilting
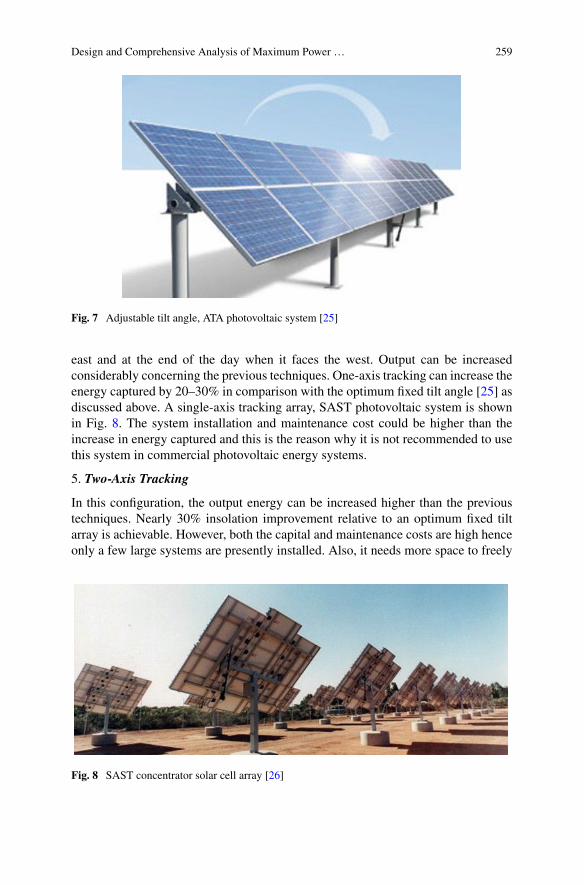
An alternative to using a fixed tilt angle of the photovoltaic array is to vary thetilt monthly depending on the monthly optimum tilt angle. The literature approxi-mate 8% [24] increase in energy captured by the photovoltaic compared to the fixedoptimum tilt angle. The optimum tilt angle is either adjusted manually or by using anelectromechanical system. Literature concluded that the adjustment to the tilt anglesevery three months increases the annual energy production by about 5% [25]. Thisincrease may not be economically beneficial, considering the cost of implementa-tion. In monthly adjusted tilted arrays, the monthly best tilt angle can be estimatedfor the site, and then the array’s monthly angle can be adjusted. This method has nocomplexity and yields increased efficiency. Figure 7 shows Adjustable Tilt Angle,ATA photovoltaic system with monthly adjusted tilting.
4. One-Axis Tracking
One-axis tracking is used to actively track the sun during the day time. The trackingis done each hour or in a lower period. This system changes the angle concerningthe vertical axis and the tracking starts in the morning where the array faces the
Design and Comprehensive Analysis of Maximum Power … 259
Fig. 7 Adjustable tilt angle, ATA photovoltaic system [25]
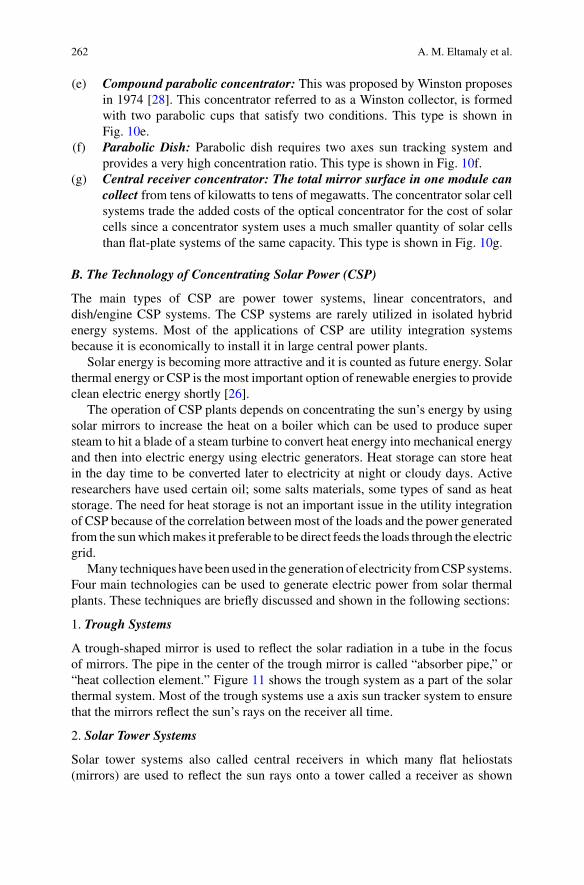
east and at the end of the day when it faces the west. Output can be increasedconsiderably concerning the previous techniques. One-axis tracking can increase theenergy captured by 20–30% in comparison with the optimum fixed tilt angle [25] asdiscussed above. A single-axis tracking array, SAST photovoltaic system is shownin Fig. 8. The system installation and maintenance cost could be higher than theincrease in energy captured and this is the reason why it is not recommended to usethis system in commercial photovoltaic energy systems.
5. Two-Axis Tracking
In this configuration, the output energy can be increased higher than the previoustechniques. Nearly 30% insolation improvement relative to an optimum fixed tiltarray is achievable. However, both the capital and maintenance costs are high henceonly a few large systems are presently installed. Also, it needs more space to freely
Fig. 8 SAST concentrator solar cell array [26]

260 A. M. Eltamaly et al.
Fig. 9 TAST concentrator solar cell array [25]
move the two-axis systems. The two-axis tracking system, TASTphotovoltaic systemis shown in Fig. 9. By mounting the array on a two-axis sun tracking, from 30% [24]to 40% [25] more solar energy can be collected over the year than in fixed tiltinstallation. Furthermore, the gain is mostly in the early morning and late evening,when it is particularly valuable in meeting peak loads.
6. Concentrator PV Arrays
The concentrator PV arrays utilize optical lenses or mirrors to focus the solar radi-ation on high-efficiency PV arrays. Precise tracking of the sun is required for thesesystems, principally when the concentration ratio is high. Tracking increases theintercepted insolation but with concentrators, the trade-off is the ability to accessonly the direct fraction. The overall outcome depends on the clarity of the sky at thesite. The concentrators will only use the direct beam light; the diffuse light cannot beimplemented. To increase total annual energy output the concentrators will requiretracking devices. Although the expenses will increase, the increase in annual energyoutput is up to 30% in comparison to the increase by using just the tracking devices.Another additional advantage of using concentrators is that it uses a reduced numberof solar cells and hence the area needed for installation. There are many types ofconcentrators as mentioned below [27]:
(a) Parabolic troughs: Silvered glass and polished aluminized flexible film areused in reflective materials. This type is shown in Fig. 10a.
(b) The ordinary lens: Glass lens collects the sunlight in the small solar cell area.This type is shown in Fig. 10b.
(c) Fresnel lens: Fresnel lens similarly diffracts the sunrays as would be doneby a conventional lens. The advantage of a fresnel lens is that; it is muchthinner and lighter than a conventional lens. The fresnel lens and parabolictrough concentrator have received themost attention for use in the photovoltaicsystem. This type is shown in Fig. 10c.

Design and Comprehensive Analysis of Maximum Power … 261
Fig. 10 Types of concentrator [27]
(d) Plan booster concentrator: This is the simplest form of flat-plate concentratoror booster. The solar cell output can be improved by about 50% [27]. Thistype of concentrator is proposed to be used with a space-satellite photovoltaicgeneration station. This type is shown in Fig. 10d.
262 A. M. Eltamaly et al.
(e) Compound parabolic concentrator: This was proposed by Winston proposesin 1974 [28]. This concentrator referred to as a Winston collector, is formedwith two parabolic cups that satisfy two conditions. This type is shown inFig. 10e.
(f) Parabolic Dish: Parabolic dish requires two axes sun tracking system andprovides a very high concentration ratio. This type is shown in Fig. 10f.
(g) Central receiver concentrator: The total mirror surface in one module cancollect from tens of kilowatts to tens of megawatts. The concentrator solar cellsystems trade the added costs of the optical concentrator for the cost of solarcells since a concentrator system uses a much smaller quantity of solar cellsthan flat-plate systems of the same capacity. This type is shown in Fig. 10g.
B. The Technology of Concentrating Solar Power (CSP)
The main types of CSP are power tower systems, linear concentrators, anddish/engine CSP systems. The CSP systems are rarely utilized in isolated hybridenergy systems. Most of the applications of CSP are utility integration systemsbecause it is economically to install it in large central power plants.
Solar energy is becoming more attractive and it is counted as future energy. Solarthermal energy or CSP is the most important option of renewable energies to provideclean electric energy shortly [26].
The operation of CSP plants depends on concentrating the sun’s energy by usingsolar mirrors to increase the heat on a boiler which can be used to produce supersteam to hit a blade of a steam turbine to convert heat energy into mechanical energyand then into electric energy using electric generators. Heat storage can store heatin the day time to be converted later to electricity at night or cloudy days. Activeresearchers have used certain oil; some salts materials, some types of sand as heatstorage. The need for heat storage is not an important issue in the utility integrationof CSP because of the correlation between most of the loads and the power generatedfrom the sunwhichmakes it preferable to be direct feeds the loads through the electricgrid.
Many techniques havebeenused in the generation of electricity fromCSPsystems.Four main technologies can be used to generate electric power from solar thermalplants. These techniques are briefly discussed and shown in the following sections:
1. Trough Systems
A trough-shaped mirror is used to reflect the solar radiation in a tube in the focusof mirrors. The pipe in the center of the trough mirror is called “absorber pipe,” or“heat collection element.” Figure 11 shows the trough system as a part of the solarthermal system. Most of the trough systems use a axis sun tracker system to ensurethat the mirrors reflect the sun’s rays on the receiver all time.
2. Solar Tower Systems
Solar tower systems also called central receivers in which many flat heliostats(mirrors) are used to reflect the sun rays onto a tower called a receiver as shown

Design and Comprehensive Analysis of Maximum Power … 263
Fig. 11 Trough system [26]
in Fig. 12 [21]. The heliostats rotate with two-axis control systems that can trackthe sun’s movement one axis to capture the sun during the day and the other one isto track it through the year. The mirrors are focusing on the receiver located at topof the tower to heat the fluid, such as molten salt, as hot as 1,050°F. The electricitygeneration can be achieved by direct use of the hot fluid or the heat can be stored in
Fig. 12 Scheme of a solar tower concentrating system for electricity generation [21]

264 A. M. Eltamaly et al.
Fig. 13 Solar Dish/Engine power plant illustration [22]
heat storage for later use at night or on cloudy days. The idea behind using moltensalt is its ability to store heat for a longer time than any other materials in a veryefficient way. Due to the higher temperature associated with the solar tower system,it has higher efficiency, and better use of the energy storage system.
3. Dish Engine Systems
Figure 13 [22] shows a schematic for the dish engine system. The dish should trackthe sun motion to capture the maximum possible energy. The receiver is attachedto a special combustion engine through tubes containing hydrogen or helium gasthat can drive a special engine to generate mechanical power. The mechanical powergenerated from the engine is used to generate the electric power.
4. Linear Fresnel Collectors (LFCs)
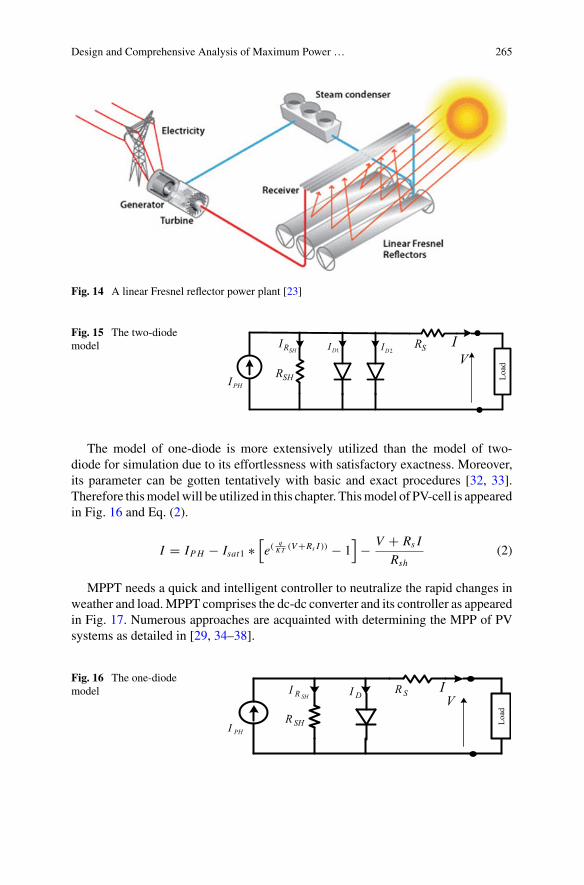
LFCs utilizes a series of long flat, or slightly curved, mirrors positioned at variousangles to focus sunlight on both sides of the fixed receiver [19]. A schematic for thelinear Fresnel reflector power plant is shown in Fig. 14 [23].
2 MPPT of PV Systems
Much research is developed to mathematically implement the PV-cell model. Thetwo-diode model has been utilized in numerous literature [29–31] as appeared inFig. 15 and Eq. (1).
I = IPH − Isat1 ∗[e(
qKT (V+Rs I )) − 1
]− Isat2 ∗
[e(
q2KT (V+Rs I )) − 1
]− V + Rs I
Rsh(1)
Design and Comprehensive Analysis of Maximum Power … 265
Fig. 14 A linear Fresnel reflector power plant [23]
Fig. 15 The two-diodemodel
SHR
SR
Load
V
PHI
SHRI I1DI 2DI
The model of one-diode is more extensively utilized than the model of two-diode for simulation due to its effortlessness with satisfactory exactness. Moreover,its parameter can be gotten tentatively with basic and exact procedures [32, 33].Therefore thismodelwill be utilized in this chapter. Thismodel of PV-cell is appearedin Fig. 16 and Eq. (2).
I = IPH − Isat1 ∗[e(
qKT (V+Rs I )) − 1
]− V + Rs I
Rsh(2)
MPPT needs a quick and intelligent controller to neutralize the rapid changes inweather and load.MPPT comprises the dc-dc converter and its controller as appearedin Fig. 17. Numerous approaches are acquainted with determining the MPP of PVsystems as detailed in [29, 34–38].
Fig. 16 The one-diodemodel
SHR
SR
Load
V
PHI
SHRI DI I

266 A. M. Eltamaly et al.
PV Voltage Sense
PV Current Sense
PV Cells
Load
MPPT Control
Fig. 17 The MPPT within the PV energy system [1]
1. Constant Ratio Technique
From the P-V curve, it is clear that the ratio of the maximum voltage of the arrayenergy, Vmp, to the open-circuit voltage, Voc, is approximately constant. Therefore,the PV array can be forced to act as a ratio of open-circuit voltage. The literatureindicates a 73 to 80% achievement of Voc [39]. Also, the relationship between theshort circuit current and the current connection to themaximumpower (MP) is almostconstant. Therefore, it is possible to use the constant current MPPT algorithm thatapproximates the current MPP as a fixed ratio of short circuit current [40, 41]. Theinstantaneous infiltration of continuous voltage or current can be avoided by using apilot cell [42].
2. Perturb and Observe (P&O) Technique
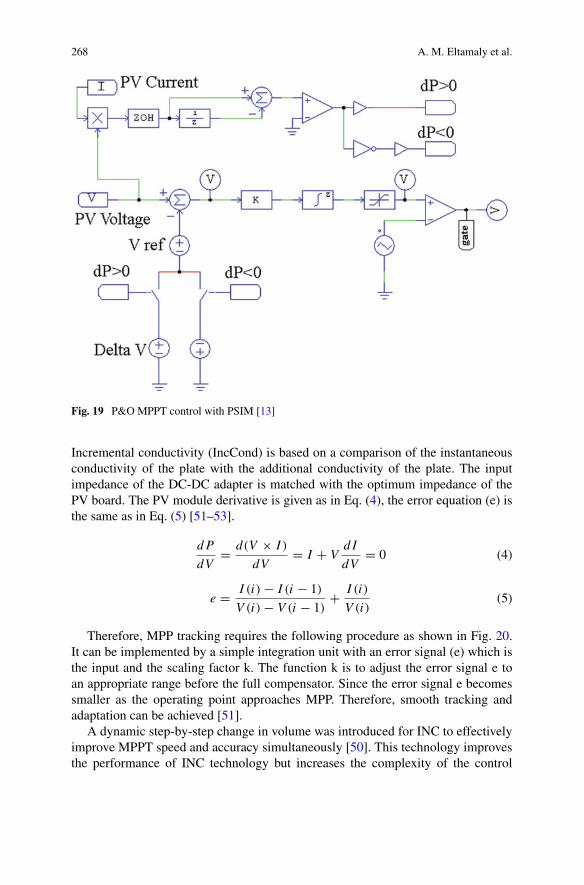
Perturb and observe (P&O) is one of the most popular techniques used in MPPtracking. This process is performed by periodically disrupting the system byincreasing the array operation voltage and observing its effect on the output powerof the array. Due to a fixed step-width, the system will experience high fluctuations,especially under unstable environmental conditions, resulting in loss of power in thePV system. This technique suffers from the wrong process, especially if multiplelocal maxima may occur in the case of partial shading [43, 44].
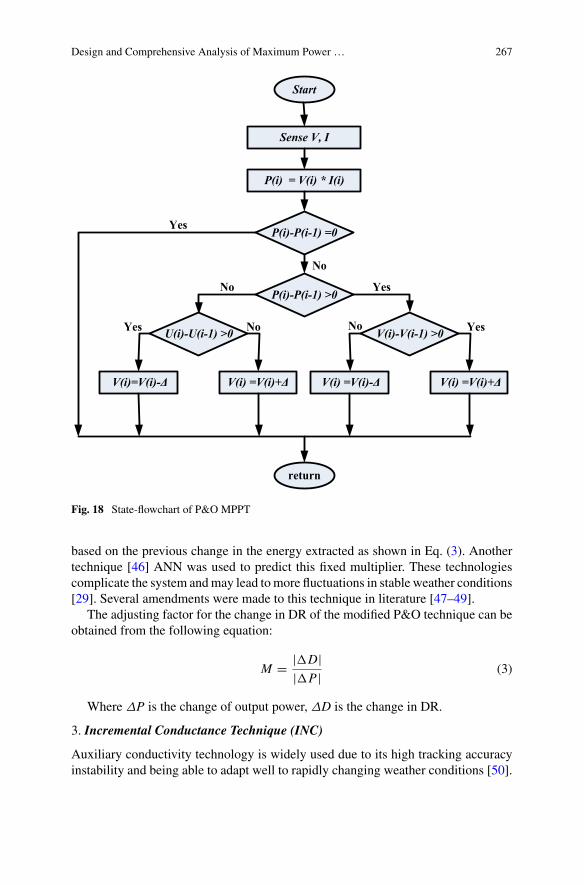
As appeared in Fig. 5 if the operating voltage of the PV module changes and thepower increase the control system moves the point of operation of the PV modulein that direction; otherwise the operating point is moved in the opposite direction.The flowchart appears in Fig. 18 and the simulation is included in the PSIM softwarepackage as appeared inFig. 19.Acommonproblemwith this technique is that thefinalvoltage of the PV unit is confused with each MPPT cycle. Therefore, when the MPPis reached, the output power oscillates around the maximum, which leads to powerloss in the PV system. A modified P&O technique was introduced in [45] to solvethis problem by multiplying the change in charge ratio (DR) by a dynamic constant
Design and Comprehensive Analysis of Maximum Power … 267
Start
Sense V, I
P(i) = V(i) * I(i)
P(i)-P(i-1) =0Yes
No
V(i) =V(i)+Δ
P(i)-P(i-1) >0
V(i)-V(i-1) >0
V(i) =V(i)-ΔV(i) =V(i)+Δ
U(i)-U(i-1) >0
V(i)=V(i)-Δ
return
YesNo
No NoYes Yes
Fig. 18 State-flowchart of P&O MPPT
based on the previous change in the energy extracted as shown in Eq. (3). Anothertechnique [46] ANN was used to predict this fixed multiplier. These technologiescomplicate the system andmay lead tomore fluctuations in stable weather conditions[29]. Several amendments were made to this technique in literature [47–49].
The adjusting factor for the change in DR of the modified P&O technique can beobtained from the following equation:
M = |�D||�P| (3)
Where ΔP is the change of output power, ΔD is the change in DR.
3. Incremental Conductance Technique (INC)
Auxiliary conductivity technology is widely used due to its high tracking accuracyinstability and being able to adapt well to rapidly changing weather conditions [50].
268 A. M. Eltamaly et al.
Fig. 19 P&O MPPT control with PSIM [13]
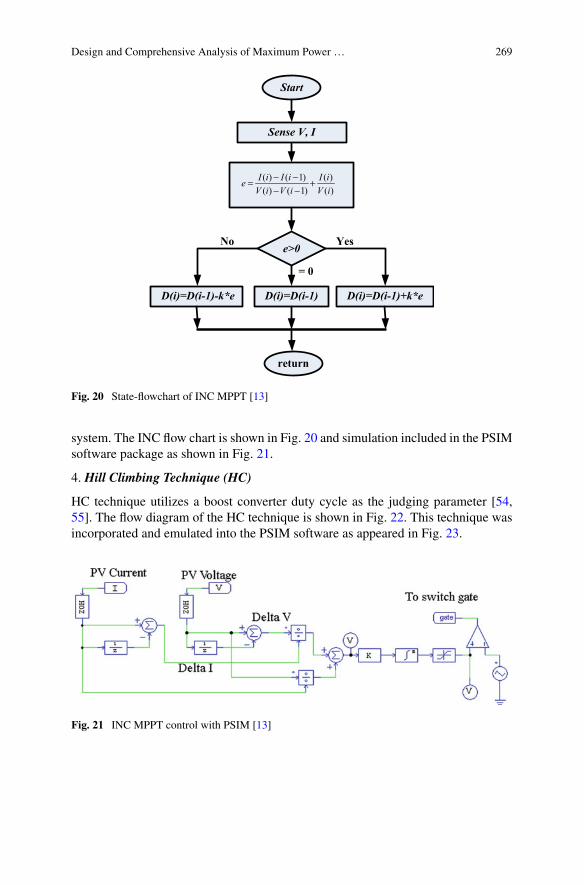
Incremental conductivity (IncCond) is based on a comparison of the instantaneousconductivity of the plate with the additional conductivity of the plate. The inputimpedance of the DC-DC adapter is matched with the optimum impedance of thePV board. The PV module derivative is given as in Eq. (4), the error equation (e) isthe same as in Eq. (5) [51–53].
dP
dV= d(V × I )
dV= I + V
d I
dV= 0 (4)
e = I (i) − I (i − 1)
V (i) − V (i − 1)+ I (i)
V (i)(5)
Therefore, MPP tracking requires the following procedure as shown in Fig. 20.It can be implemented by a simple integration unit with an error signal (e) which isthe input and the scaling factor k. The function k is to adjust the error signal e toan appropriate range before the full compensator. Since the error signal e becomessmaller as the operating point approaches MPP. Therefore, smooth tracking andadaptation can be achieved [51].
A dynamic step-by-step change in volume was introduced for INC to effectivelyimprove MPPT speed and accuracy simultaneously [50]. This technology improvesthe performance of INC technology but increases the complexity of the control
Design and Comprehensive Analysis of Maximum Power … 269
Start
Sense V, I
No
D(i)=D(i-1)+k*eD(i)=D(i-1) D(i)=D(i-1)-k*e
Yes
return
( ) ( 1) ( )( ) ( 1) ( )I i I i I iеV i V i V i
− −= +− −
e>0
= 0
Fig. 20 State-flowchart of INC MPPT [13]
system. The INC flow chart is shown in Fig. 20 and simulation included in the PSIMsoftware package as shown in Fig. 21.
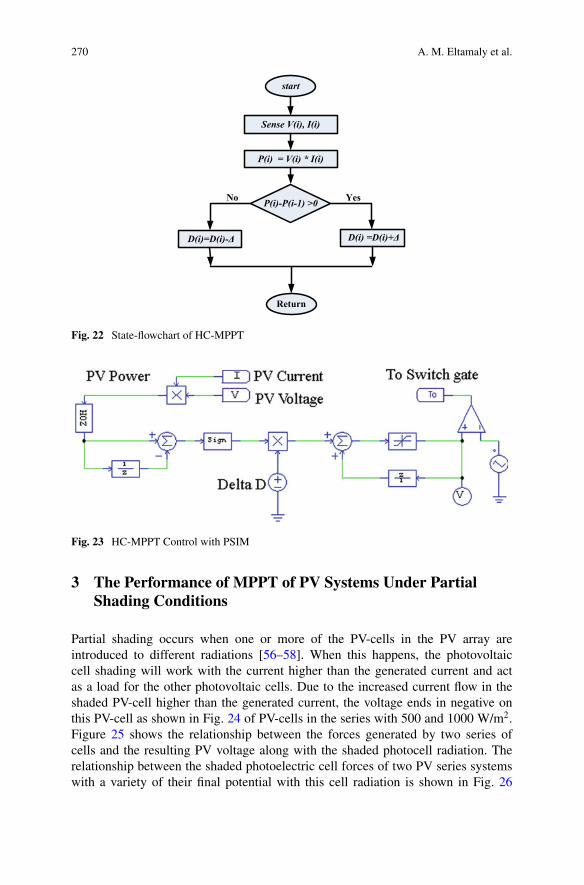
4. Hill Climbing Technique (HC)
HC technique utilizes a boost converter duty cycle as the judging parameter [54,55]. The flow diagram of the HC technique is shown in Fig. 22. This technique wasincorporated and emulated into the PSIM software as appeared in Fig. 23.
Fig. 21 INC MPPT control with PSIM [13]
270 A. M. Eltamaly et al.
start
Sense V(i), I(i)
P(i) = V(i) * I(i)
D(i) =D(i)+Δ
P(i)-P(i-1) >0
D(i)=D(i)-Δ
Yes
Return
No
Fig. 22 State-flowchart of HC-MPPT
Fig. 23 HC-MPPT Control with PSIM
3 The Performance of MPPT of PV Systems Under PartialShading Conditions
Partial shading occurs when one or more of the PV-cells in the PV array areintroduced to different radiations [56–58]. When this happens, the photovoltaiccell shading will work with the current higher than the generated current and actas a load for the other photovoltaic cells. Due to the increased current flow in theshaded PV-cell higher than the generated current, the voltage ends in negative onthis PV-cell as shown in Fig. 24 of PV-cells in the series with 500 and 1000 W/m2.Figure 25 shows the relationship between the forces generated by two series ofcells and the resulting PV voltage along with the shaded photocell radiation. Therelationship between the shaded photoelectric cell forces of two PV series systemswith a variety of their final potential with this cell radiation is shown in Fig. 26

Design and Comprehensive Analysis of Maximum Power … 271
-20 -10 0 10 20 30 40 50-40
-20
0
20
40
60
80
Pow
er (W
)
1000 W/m2
Total Power (W)
500 W/m2
Fig. 24 PV-cell’ terminal voltage of the two series PV-cells without bypass diode
Fig. 25 The two P-V cellstotal power without bypass
010203040
0
500
1000
0
20
40
60
80
100
120
Radiat
ion of
Shad
ed
Cell (W
/m2)
Output Voltage (V)
Out
put P
ower
(W)
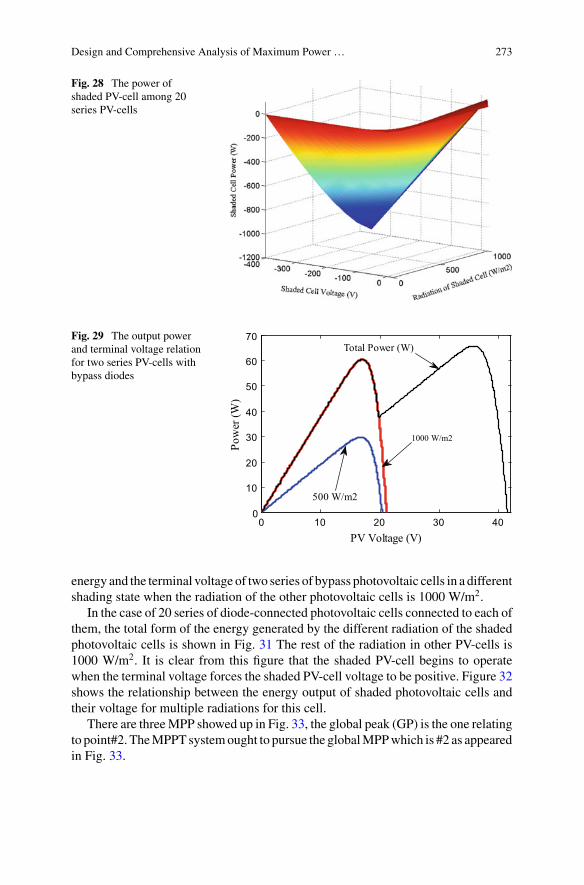
[59, 60]. Figure 27 demonstrates the variety-generated power of 20 series PV-cellswith the terminal voltage and radiation on the shaded PV cell when other cellsare exposed to 1000 W/m2 radiation. Figure 28 demonstrates the power of shadedPV cell among 20 series PV-cells along with its terminal voltage and the radiationof these cells where the rest of PV-cells is 1000 W/m2. It is clear from the abovediscourse that, the hotspot can be increasingly risky for a higher number of seriesPV cells. A few kinds of literature work in the optimum number of PV-cells onseries to prevent its damage due to the hotspot [59, 60].

272 A. M. Eltamaly et al.
Fig. 26 The shaded cellpower with its voltage andradiation
-20-1001020
0
500
1000
-60
-40
-20
0
20
40
60
Radiation of
shaded
cell (W
/m2)
Cell Voltage (V)
Out
put P
ower
(W)
Fig. 27 Total power of 20series with one shadedPV-cells
A wide range of literature has been produced to treat the influence of PV hotspots[61, 62]. One of the best ways is to include the side diode next to each PV-cell orit can be associated with a certain number of photovoltaics to reduce the cost ofphotovoltaics and reduce the losses of the PV system. In the case of two series ofphotovoltaic cells with bypass diodes, the relationship between the terminal voltageand the output energy of these two photovoltaic cells with radiation of 1000 and500 W/m2 is shown in Fig. 29. Figure 30 shows the relationship between the output
Design and Comprehensive Analysis of Maximum Power … 273
Fig. 28 The power ofshaded PV-cell among 20series PV-cells
Fig. 29 The output powerand terminal voltage relationfor two series PV-cells withbypass diodes
0 10 20 30 400
10
20
30
40
50
60
70
PV Voltage (V)
Pow
er (W
)
Total Power (W)
500 W/m2
1000 W/m2
energy and the terminal voltage of two series of bypass photovoltaic cells in a differentshading state when the radiation of the other photovoltaic cells is 1000 W/m2.
In the case of 20 series of diode-connected photovoltaic cells connected to each ofthem, the total form of the energy generated by the different radiation of the shadedphotovoltaic cells is shown in Fig. 31 The rest of the radiation in other PV-cells is1000 W/m2. It is clear from this figure that the shaded PV-cell begins to operatewhen the terminal voltage forces the shaded PV-cell voltage to be positive. Figure 32shows the relationship between the energy output of shaded photovoltaic cells andtheir voltage for multiple radiations for this cell.
There are threeMPP showed up in Fig. 33, the global peak (GP) is the one relatingto point#2. TheMPPT systemought to pursue the globalMPPwhich is #2 as appearedin Fig. 33.

274 A. M. Eltamaly et al.
Fig. 30 The output powerand terminal voltage relationfor two series PV-cells withbypass diodes under variousirradiances
Fig. 31 The total generatedpower along with terminalvoltage for differentradiation of shaded PV-cellin case of 20 series PV-cellswith bypass diodes

Design and Comprehensive Analysis of Maximum Power … 275
Fig. 32 The relation between the output power of shaded PV-cell and its voltage for differentradiation of this cell
Fig. 33 The relation between the generated power and terminal voltage in case of three seriesPV-cells at radiation of 1000, 700, 300 W/m2
A. Mismatch Power Loss
The relationship between the peak strength and the sum of the peaks is called amismatch loss (MML) and can be calculated mathematically as shown in Eq. (6).Along these lines, the more MML, the more energy is generated from the photoelec-tric system and vice versa. If the entire photovoltaic cells had the same radiation andthe entire photovoltaic system worked in the MPP and each cell operated in its MPP,then the MML factor would be 100%. The value of the MML factor can be obtainedfrom the accompanying equation:
276 A. M. Eltamaly et al.
MML = Maximum power of whole PV systemN∑i=1
Pmax(i)
∗ 100 (6)
where N is the total number of PV-cells in the PV system.
B. Fuzzy Controller MPPT Technique
Initially, the Fuzzy Logic Control (FLC) has been in focus since 1920 [63]. By1965 another exploration [64] had introduced FLC as a console for real applications.Since that time FLC has been applied to many applications in various fields ofscience [65]. FLC can be effectively implemented in various digital devices, forexample, microcontrollers [43, 66] digital signal processors, DSP [67] and field-programmable gate group, FPGA, [43, 68] and end up developing Innovation inindustrial applications. One of the valuable uses for FLC is theMPPT for PV systems.
C. PSO MPPT Technique
PSO is one of Swarm Intelligence techniques that use randomized population-basedvariables to solve optimization problems. This technology was first introduced byEberhart and Kennedy (1995) [69]. The first PSO work was used in MPPT from PVsystems implemented in 2004 [70]. PSO is inspired by the behavior of social swarmfrom school education or bird rising. An evolutionary PSO process, potential solu-tions, called particles; move around the multidimensional search space by followingand tracking the best current particle position in a swarm. The PSO process can beillustrated in the following [71]:
Every particle in the swarm has two variables: position vector xi(t) and velocityvector vi(t) as appeared in Eq. (7). Therefore, every particle xi(t) is described by avector [xi1(t), xi2(t),…,xiD(t)], as i is the index number of every particle, D is thedimension of the search space and t is iteration number.
xi (t + 1) = xi (t) + vi (t + 1) (7)
xi(t), vi(t), and the global best position Gi(t) are utilized to set the new positionof the particle by calculating the velocity as follows:
vi (t + 1) = ω(t)v(t)︸ ︷︷ ︸Inertial parameters
+ c1r1(Pi (t) − xi (t))︸ ︷︷ ︸Personal best velocity components
+ c2r2(Gi (t) − xi (t))︸ ︷︷ ︸Global best velocity component
(8)
where, ω(t) is the inertia weight factor that controls the search space exploration.The value of ω(t) can be chosen as a constant value equal to 0.5 or as a variable valuefor the obtained GP acceleration [72]. c1 and c2 are acceleration constants, whichprovide weight to individual and social GP components, individually. Where c1 isself-confidence; Range: 1.5–2; and c2 is swarm confidence. Range: 2–2.5 [73].

Design and Comprehensive Analysis of Maximum Power … 277
A modified PSO technology named deterministic PSO (DPSO) [74] was used toimprove MPPT performance under a partial shading component. Also, hill climbing(HC-MPPT) has been used in the uniform distribution of insolation on the PV systembut DPSO will be used in the case of PSC. The authors used three parallel branchesand four PV units in the series [74]. Another research [75] has suggested a great ideato use some particles to locate the LP and some other particles to find a global peak(GP).
A modified PSO (MPSO) technique [76] was used to adjust the weight of inertia,using the principles of a genetic algorithm (GA) to improve its strength whilesearching for a GP. The adjusted inertial weight ω can be obtained from the Eq. (9)which uses the main GA principles by increasing the inertial weight value ω at thebeginning (in the global research phase) and reducing it to a precise increase at theend of the improvement when the particles approach the optimal solution.
ω(k) = ωs − (ωs − ωe)(Tm − k)/Tm (9)
wheres is the initial inertia weight, ωe is the inertia weight when reaching maximuminertia times, and Tm is the maximum inertia times.
D. Simulation of Proposed Systems
Asimulationmodel of three PVunits and a boost transformer used in FLC andMPSOis shown in Fig. 34. The simulation model for the system proposed in SIMULINKis shown in Fig. 35. The simulation parameters for the PV unit are shown in Table 1.
The results of MPSO and FLC simulation are shown in Fig. 36. The response ofdifferent MPPT techniques is evaluated in rapidly changing weather conditions. Thesimulation time shown in this figure is divided into six periods of about two secondseach. Every two seconds, the radiation will be changed in two PV units out of threeand the first will be stationary (1000W/m2) throughout the simulation time (Fig. 37).
Fig. 34 The simulation model for PV modules and boost converter

278 A. M. Eltamaly et al.
Memory1
Memory
VV
IIDuty_RatioPSO
MPSO
Fuzzy Logic Controller
D_FLC
D_PSO
Delta_Error
dp
V_PV
I_PV
Fuzzy & PSO
Fig. 35 The SIMULINK model showing the co-simulation between SIMULINK and PSIM
Table 1 Simulation parameters of each PV Module in PSIM [54]

Design and Comprehensive Analysis of Maximum Power … 279
0 2 4 6 8 10 120
500
1000Radiation (W/m2)
0 2 4 6 8 10 120
100
200 Power (W)
0 2 4 6 8 10 120
0.5
Duty Ratio
0 2 4 6 8 10 120
50
PV Terminal Voltage (V)
0 2 4 6 8 10 123
3.5
4
Time (Sec.)
% Increase in PV power from PSO and FLC
G3
Pmax
P-PSOP-FLC
Pmp
D-FLC
V-PSO
G1G2
D-PSO
V-FLC
Fig. 36 The simulation results of MPSO and FLC
4 Conclusion
In this chapter, various techniques for tracking, analyzing, simulating, and comparingmaximum power points are demonstrated. MATLAB/SIMULINK/PSIM is used tomodel the photoelectric system under partial shading conditions. Moreover, theresponse of various power point tracking techniques in rapidly changing weatherconditions is evaluated.

280 A. M. Eltamaly et al.
0 10 20 30 40 50 600
20
40
60
80
100
120
140
160
180
PV Voltage, V
PV P
ower
, W
0-2 Sec2-4 Sec4-6 Sec6-8 Sec810 Sec10-12 SecMPSOFLC
1
2
5
4
4-6 sec.
0-2 sec.
10-12 sec. 6-8 sec.
6
5
3
8-10 sec.4
2
6
Fig. 37 The relation between the generated power along with terminal voltage and the MPPTresponse for MPSO and FLC
References
1. Eltamaly AM, Al-Saud MS, Abokhalil AG, Farh HMH (2020) “Simulation and experimentalvalidation of fast adaptive particle swarm optimization strategy for photovoltaic global peaktracker under dynamic partial shading. Renew Sustain Energy Rev 124:109719
2. Eltamaly AM,Al-SaudMS, Abokhalil AG (2020) A novel bat algorithm strategy for maximumpower point tracker of photovoltaic energy systemsunder dynamic partial shading. IEEEAccess8:10048–10060
3. Eltamaly AM, Farh HMH (2020) PV Characteristics, Performance and Modelling. In: Modernmaximum power point tracking techniques for photovoltaic energy systems. Springer, Cham,pp 31–63
4. Gong X, Dong F, Mohamed MA, Awwad EM, Abdullah HM, Ali ZM (2020) Towardsdistributed based energy transaction in a clean smart island. J Clea Prod 122768
5. Eltamaly AM, Farh HMH, Al Saud MS (2019) Impact of PSO reinitialization on the accu-racy of dynamic global maximum power detection of variant partially shaded PV systems.Sustainability 11(7):2091
6. Lee TD, Ebong AU (2017) A review of thin film solar cell technologies and challenges. RenewSustain Energy Rev 70:1286–1297
7. Adib R, Murdock HE, Appavou F, Brown A, Epp B, Leidreiter A, Lins C et al (2015)Renewables 2015 global status report. REN21 Secretariat, Paris, France
8. Eltamaly AM,MohamedMA (2018) Optimal sizing and designing of hybrid renewable energysystems in smart grid applications. In: Advances in renewable energies and power technologies.Elsevier, pp 231–313
9. Mohamed MA, Eltamaly AM (2018) A novel smart grid application for optimal sizing ofhybrid renewable energy systems. In: Modeling and simulation of smart grid integrated withhybrid renewable energy systems. Springer, Cham, pp 39–51
10. Eltamaly AM, Mohamed MA, Alolah AI (2016) A novel smart grid theory for optimal sizingof hybrid renewable energy systems. Sol Energy 124:26–38

Design and Comprehensive Analysis of Maximum Power … 281
11. A Review of Concentrated Solar Power in 2014. https://www.engineering.com/ElectronicsDesign/ElectronicsDesignArticles/ArticleID/9286/A-Review-of-Concentrated-Solar-Power-in-2014.aspx
12. Motahhir S, Chouder A, El Hammoumi A, Benyoucef AS, El Ghzizal A, Kichou S, KamelK, Sanjeevikumar P, Silvestre S (2020) Optimal energy harvesting from a multistrings PVgenerator based on artificial bee colony algorithm. IEEE Syst J
13. Rezk H, Eltamaly AM (2015) A comprehensive comparison of different MPPT techniques forphotovoltaic systems. Sol Energy 112:1–11
14. EltamalyAM (2015) Performance of smartmaximumpower point tracker under partial shadingconditions of photovoltaic systems. In: J Renew Sustain Energy 7(4): 043141
15. Kroposki B,Margolis R, TonD (2009) Harnessing the sun. IEEE Power EnergMag 7(3):22–3316. Eltamaly AM (2018) Performance of MPPT techniques of photovoltaic systems under normal
and partial shading conditions. In: Advances in renewable energies and power technologies.Elsevier
17. Mohamed MA, Eltamaly AM, Alolah AI (2017) Swarm intelligence-based optimization ofgrid-dependent hybrid renewable energy systems. Renew Sustain Energy Rev 77:515–524
18. Mohamed MA, Eltamaly AM, Alolah AI (2016) PSO-based smart grid application for sizingand optimization of hybrid renewable energy systems. PLoS ONE 11(8):e0159702
19. Eltamaly AM, Al-Shamma’a AA (2016) Optimal configuration for isolated hybrid renewableenergy systems. J Renew Sustain Energy 8(4):045502
20. Mohamed MA, Eltamaly AM (2018) Modeling and simulation of smart grid integrated withhybrid renewable energy systems. Springer, New York
21. EltamalyAM,MohamedMA,Al-SaudMS,AlolahAI (2017) Loadmanagement as a smart gridconcept for sizing and designing of hybrid renewable energy systems. EngOptimi 49(10):1813–1828
22. MohamedMA, EltamalyAM,AlolahAI (2015) Sizing and techno-economic analysis of stand-alone hybrid photovoltaic/wind/diesel/battery power generation systems. J Renew SustainEnergy 7(6):063128
23. EltamalyAM (2015) Performance of smartmaximumpower point tracker under partial shadingconditions of PV systems. In: 2015 IEEE International Conference on Smart Energy GridEngineering (SEGE). IEEE, pp 1–8
24. Al-Saud M, Eltamaly AM, Mohamed MA, Kavousi Fard A (2019) An intelligent data-drivenmodel to secure intra-vehicle communications based on machine learning. IEEE Trans IndElectr
25. Eltamaly AM, Farh HMH (2019) Dynamic global maximum power point tracking of the PVsystems under variant partial shading using hybrid GWO-FLC. Solar Energy 177: 306–316
26. MohamedMA, Eltamaly AM, Farh HM, Alolah AI (2015) Energy management and renewableenergy integration in smart grid system. In: 2015 IEEE international conference on smart energygrid engineering (SEGE). IEEE, pp 1–6
27. Eltamaly AM, Addoweesh KE, Bawa U, Mohamed MA (2014) Economic modeling of hybridrenewable energy system: a case study in Saudi Arabia. Arab J Sci Eng 39(5):3827–3839
28. Farh HMH, Othman MF, Eltamaly AM, Al-Saud MS (2018) Maximum power extraction froma partially shaded PV system using an interleaved boost converter. Energies 11(10):2543
29. Eltamaly AM, Farh HMH, Othman MF (2018) A novel evaluation index for the photovoltaicmaximum power point tracker techniques. Solar Energy 174:940–956
30. Farh HMH, Eltamaly AM, Othman MF (2018) Hybrid PSO-FLC for dynamic global peakextraction of the partially shaded photovoltaic system. PloS one 13(11):e0206171
31. Eltamaly AM, Farh HMH, Al-Saud MS (2019) Grade point average assessment for meta-heuristicGMPP techniques of partial shadedPVsystems. IETRenewPowerGener 13(8):1215–1231
32. FarhHMH,OthmanMF,EltamalyAM(2017)Maximumpower extraction fromgrid-connectedPV system. In 2017 Saudi Arabia Smart Grid (SASG). IEEE, pp 1–6
33. FarhHMH,EltamalyAM,Al-SaudMS (2019) Interleaved boost converter for globalmaximumpower extraction from the photovoltaic system under partial shading. IET Renew Power Gener13(8):1232–1238
282 A. M. Eltamaly et al.
34. Motahhir S, Hammoumi AEL, Ghzizal AEL, Derouich A (2019) Open hardware/software testbench for solar tracker with virtual instrumentation. Sustain Energy Technol Assess 31: 9–16
35. Etamaly AM, Mohamed MA, Alolah AI (2015) A smart technique for optimization and simu-lation of hybrid photovoltaic/wind/diesel/battery energy systems. In: 2015 IEEE Internationalconference on smart energy grid engineering (SEGE). IEEE, pp 1–6
36. Eltamaly AM, Al-Saud MS, Abo-Khalil AG (2020) Performance improvement of pv systems’maximum power point tracker based on a scanning PSO particle strategy. Sustainability12(3):1185
37. Balouktsis A, Karapantsios TD, Anastasiou K, Antoniadis A, Balouktsis I (2006) Loadmatching in a direct-coupled photovoltaic system-application to Thevenin’s equivalentloads. Int J Photoenergy
38. Eltamaly AM, El-Tamaly HH, Enjeti P (2002) An improved maximum power point tracker forphotovoltaic energy systems. In: The 2nd Minia international conference for advanced trendsin engineering
39. Eltamaly AM, Al-Saud MS, Abokhalil AG (2020) A novel scanning bat algorithm strategyfor maximum power point tracker of partially shaded photovoltaic energy systems. Ain ShamsEng J
40. Eltamaly AM, Al-Saud MS, Abokhalil AG, Farh HMH (2020) Photovoltaic maximum powerpoint tracking under dynamic partial shading changes by novel adaptive particle swarmoptimization strategy. Trans Inst Measurement Control 42(1):104–115
41. Yuvarajan S, Xu S (2003) Photo-voltaic power converter with a simple maximum-power-point-tracker. In: Proceedings of the 2003 international symposium on circuits and systems, vol 3.ISCAS’03. IEEE, pp III–III
42. Veerachary M, Senjyu T, Uezato K (2002) Voltage-based maximum power point trackingcontrol of PV system. IEEE Trans Aerosp Electron Syst 38(1):262–270
43. Eltamaly AM, Alolah AI, Abdulghany MY (2010) Digital implementation of general purposefuzzy logic controller for photovoltaic maximum power point tracker. In: SPEEDAM 2010.IEEE, pp 622–627
44. Farh HMH, Eltamaly AM (2020) Maximum power extraction from the photovoltaic systemunder partial shading conditions. In: Modern maximum power point tracking techniques forphotovoltaic energy systems. Springer, Cham, pp 107–129
45. Al-Diab A, Sourkounis C (2010) Variable step size P&O MPPT algorithm for PV systems.In: 2010 12th International conference on optimization of electrical and electronic equipment.IEEE, pp 1097–1102
46. Mohamed MA, Eltamaly AM (2018) Sizing and techno-economic analysis of stand-alonehybrid photovoltaic/wind/diesel/battery energy systems. In: Modeling and simulation of smartgrid integrated with hybrid renewable energy systems. Springer, Cham, pp 23–38
47. Femia N, Granozio D, Petrone G, Spagnuolo G, Vitelli M (2007) Predictive & adaptive MPPTperturb and observe method. IEEE Trans Aerosp Electron Syst 43(3):934–950
48. Eltamaly AM, Mohamed MA (2016) A novel software for design and optimization of hybridpower systems. J Braz Soc Mech Sci Eng 38(4):1299–1315
49. El-Tamaly HH, El-Tamaly AM, El-Baset Mohammed AA (2003) Design and control strategyof utility interfaced PV/WTG hybrid system. In: The ninth international middle east powersystem conference. MEPCON, pp 16–18
50. Liu F, Duan S, Liu F, Liu B, Kang Y (2008) A variable step size INC MPPT method for PVsystems. IEEE Trans Industr Electron 55(7):2622–2628
51. Abouobaida H, Cherkaoui M (2012) Comparative study of maximum power point trackersfor fast changing environmental conditions. In: 2012 International conference on multimediacomputing and systems. IEEE, pp 1131–1136
52. EltamalyAM,MohamedMA (2014)A novel design and optimization software for autonomousPV/wind/battery hybrid power systems. Math Probl Eng

Design and Comprehensive Analysis of Maximum Power … 283
53. Siri K, Conner KA (2001) Fault-tolerant scaleable solar power bus architectures withmaximumpower tracking. In: APEC 2001. Sixteenth annual IEEE applied power electronics conferenceand exposition (Cat. No. 01CH37181), vol 2. IEEE, pp 1009–1014
54. Farh HMH, Eltamaly AM, Ibrahim AB, Othman MF, Al-Saud MS (2019) Dynamic globalpower extraction from partially shaded photovoltaic using deep recurrent neural network andimproved PSO techniques. Int Trans Electr Energy Syst 29(9): e12061
55. Eltamaly AM, Addoweesh KE, Bawah U, Mohamed MA (2013) New software for hybridrenewable energy assessment for ten locations in Saudi Arabia. J Renew Sustain Energy5(3):033126
56. Rajesh R, Carolin Mabel M (2014) Efficiency analysis of a multi-fuzzy logic controller for thedetermination of operating points in a PV system. Solar Energy 99:77–87
57. Kimball JW, Krein PT (2007) Digital ripple correlation control for photovoltaic applications.In: 2007 IEEE power electronics specialists conference. IEEE, pp 1690–1694
58. Mohamed MA, Eltamaly Am (2018) Introduction and literature review. In: Modeling andsimulation of smart grid integrated with hybrid renewable energy systems. Springer, Cham, pp1–10
59. Rossi D, Omaña M, Giaffreda D, Metra C (2014) Modeling and detection of hotspot in shadedphotovoltaic cells. IEEE Trans Very Large Scale Integr (VLSI) Syst 23(6):1031–1039
60. Solórzano J, Egido MA (2014) Hot-spot mitigation in PV arrays with distributed MPPT(DMPPT). Sol Energy 101:131–137
61. Eltamaly AM, Abdelaziz AY eds (2019) Modern maximum power point tracking techniquesfor photovoltaic energy systems. Springer
62. Kim K (2014) Hot spot detection and protection methods for photovoltaic systems. PhD diss.,University of Illinois at Urbana-Champaign
63. Libkin L (2016) SQL’s three-valued logic and certain answers. ACM Trans Database Syst(TODS) 41(1):1–28
64. Mendel JM (2007) Type-2 fuzzy sets and systems: an overview. IEEE Comput Intell Mag2(1):20–29
65. Eltamaly Am (2010) Modeling of fuzzy logic controller for photovoltaic maximum powerpoint tracker. In: Solar Future 2010 Conference, Istanbul, Turkey
66. Boukens M, Boukabou A (2013) PD with fuzzy compensator control of robot manipulators:Experimental study. In: 3rd International conference on systems and control. IEEE, pp 973–978
67. Eltamaly AM (2011) Modeling of fuzzy logic controller for photovoltaic maximum powerpoint tracker. Trends Electr Eng 1(2)
68. Tipsuwanpom R, Runghimmawan T, Intajag S, Krongratana V (2004) Fuzzy logic PIDcontroller based on FPGA for process control. In: 2004 IEEE international symposium onindustrial electronics, vol 2. IEEE, pp 1495–1500
69. Farh HM, Eltamaly AM, Mohamed MA (2012). Wind energy assessment for five locations inSaudi Arabia. In: International conference on future environment and energy (ICFEE 2012,)IPCBEE (2012) © (2012) IACSIT Press, February 26–28. Singapoore
70. MohamedMA, Eltamaly AM, Alolah AI, Hatata AY (2019). A novel framework-based cuckoosearch algorithm for sizing and optimization of grid-independent hybrid renewable energysystems. Int J Green Energy 16(1):86–100
71. Eltamaly AM, Farh HMH, Abokhalil AG (2020). A novel PSO strategy for improving dynamicchange partial shading photovoltaic maximum power point tracker. Energy Sour Part ARecovery, Utilization, Environ Effects, 1–15
72. Mohamed MA, Eltamaly AM (2018) A PSO-based smart grid application for optimum sizingof hybrid renewable energy systems. In: Modeling and simulation of smart grid integrated withhybrid renewable energy systems. Springer, Cham, pp 53–60
73. Ishaque K, Salam Z, Shamsudin A, Amjad M (2012) A direct control based maximum powerpoint tracking method for photovoltaic system under partial shading conditions using particleswarm optimization algorithm. Appl Energy 99:414–422

284 A. M. Eltamaly et al.
74. Fu Q, Tong N (2010) A new PSO algorithm based on adaptive grouping for photovoltaic MPPprediction. In: 2010 2nd International workshop on intelligent systems and applications. IEEE,pp 1–5
75. Mohamed MA, Eltamaly AM (2018) Modeling of hybrid renewable energy system.In: Modeling and simulation of smart grid integrated with hybrid renewable energy systems.Springer, Cham, pp 11–21
76. PSIM (2020) Psim User Manual of PSIM computer Simulation. Accessed June 2020. http://powersimtech.com/wp-content/uploads/2015/05/PSIM-User-Manual.pdf