design and comparative performance of a robust lung
TRANSCRIPT

IEEE JOURNAL OF BIOMEDICAL AND HEALTH INFORMATICS, VOL. 25, NO. 7, JULY 2021 2583
Design and Comparative Performance of aRobust Lung Auscultation System
for Noisy Clinical SettingsIan McLane , Dimitra Emmanouilidou, James E West, and Mounya Elhilali
Abstract—Chest auscultation is a widely used clinicaltool for respiratory disease detection. The stethoscopehas undergone a number of transformative enhancementssince its invention, including the introduction of electronicsystems in the last two decades. Nevertheless, stetho-scopes remain riddled with a number of issues that limittheir signal quality and diagnostic capability, renderingboth traditional and electronic stethoscopes unusable innoisy or non-traditional environments (e.g., emergencyrooms, rural clinics, ambulatory vehicles). This work out-lines the design and validation of an advanced electronicstethoscope that dramatically reduces external noise con-tamination through hardware redesign and real-time, dy-namic signal processing. The proposed system takes ad-vantage of an acoustic sensor array, an external facingmicrophone, and on-board processing to perform adaptivenoise suppression. The proposed system is objectivelycompared to six commercially-available acoustic and elec-tronic devices in varying levels of simulated noisy clini-cal settings and quantified using two metrics that reflectperceptual audibility and statistical similarity, normalizedcovariance measure (NCM) and magnitude squared coher-ence (MSC). The analyses highlight the major limitations ofcurrent stethoscopes and the significant improvements theproposed system makes in challenging settings by mini-mizing both distortion of lung sounds and contaminationby ambient noise.
Index Terms—Stethoscope, biomedical acoustics,adaptive signal processing, signal to noise ratio, publichealthcare.
I. INTRODUCTION
R ESPIRATORY diseases and illnesses pose some of themost serious threats to individuals and to the public, af-
fecting over 600 million people worldwide; early and accurate
Manuscript received April 7, 2020; revised September 14, 2020 andNovember 23, 2020; accepted January 24, 2021. Date of publica-tion February 3, 2021; date of current version July 20, 2021. Thiswork was supported in part by the National Institutes of Health underGrants R01HL133043, U01AG058532, and R43MD014104 and in partby the Office of Naval Research under Grants N000141912014 andN000141912689. (Corresponding author: Mounya Elhilali.)
The authors are with the Department of Electrical and Com-puter Engineering, Johns Hopkins University, Baltimore, MD 21218USA (e-mail: [email protected]; [email protected];[email protected]; [email protected]).
Digital Object Identifier 10.1109/JBHI.2021.3056916
diagnosis of respiratory conditions presents a major challengetoward successful triage and treatment [1]. The use of chestauscultation to rapidly screen for and diagnose lung diseasesand infections has been in practice since the invention of thestethoscope by R.T.H. Laennec in 1816 [2]. Stethoscopes areused in respiratory examination to distinguishing normal respi-ratory sounds from crackles, wheezes, and pleural rub in orderto make correct diagnoses and remain a key diagnostic devicedue to their portability, low cost, and noninvasive nature.
Despite its universal adoption, the use of the stethoscope isriddled by a number of issues including subjectivity in interpre-tation of chest sounds, interlistener variability and inconsistency,need for medical expertise, and vulnerability to airborne ambientnoise. The presence of background noise is particularly impor-tant because acoustic systems have several noise transmissionpaths–chestpiece, tubing, and earpieces–through which airbornenoise tends to ‘leak’ and mask body sounds, rendering theinterpretation of these sounds challenging or impossible andexacerbating the other issues related to subjectivity and variabil-ity. In global health or emergency medicine environments, noiselevels far exceed those of a clinical environment (approximately75 dB SPL) and frequently exceed the approximate upper limitof correct detection of abnormal breath sounds (an average of81 dB SPL) [3]. Health care providers in resource-limited ornon-traditional settings rely upon low-cost tools or clinical pre-sentations to make critical patient management decisions, rarelyrelying on auscultation due to these limitations [4]. However,one study showed that including auscultatory findings in theWHO case management guidelines for pneumonia significantlyincreased correct identification of radiographically-confirmedpneumonia by 16% [5].
Electronic stethoscopes were introduced in the last fewdecades, opening up new opportunities for sound amplification,enhanced frequency range, quality improvement, and comput-erized analysis. Passive filtering improves the sound quality,but these systems are still susceptible to dynamic noise seenin most real-world environments [6]. In many settings, back-ground chatter and other environmental noises are common, andpatient motion contaminates the sound signal picked up by thestethoscope. Several electronic systems (e.g., Littmann 3200 andEko Core) are additionally plagued by the same airborne soundtransmission paths as acoustic stethoscopes by using a traditionalchestpiece or a small loudspeaker and traditional binaural tubing.
2168-2194 © 2021 IEEE. Personal use is permitted, but republication/redistribution requires IEEE permission.See https://www.ieee.org/publications/rights/index.html for more information.
Authorized licensed use limited to: Johns Hopkins University. Downloaded on September 30,2021 at 13:10:00 UTC from IEEE Xplore. Restrictions apply.
2584 IEEE JOURNAL OF BIOMEDICAL AND HEALTH INFORMATICS, VOL. 25, NO. 7, JULY 2021
Therefore, most acoustic and electronic commercial devices aremeant to be used only in controlled clinical environments (e.g.,a quiet doctor’s office) or in stationary noise. They tend to beunusable in noisy clinical settings such as emergency or operat-ing rooms, ambulances, or outpatient or rural clinics. Because ofthese limitations, development of automated approaches basedon computer-aided auscultation for these electronic systems alsoremain in their infancy [7]–[10].
The aim of this work is to design an adaptable and multi-purpose device that could be used across the spectrum of clin-ical environments by any type of healthcare provider, and wasuniquely designed to overcome known limitations of currentdevices. This paper presents a comprehensive platform whichincludes both hardware and software redesign to improve sens-ing, acquisition, and analysis of body-generated sounds. Theproposed system comprises a collection of sensing and func-tional components—a microphone array, an external facing mi-crophone, an audio codec, and on-board processing—packagedas a standalone device that can be deployed into the field. Themicrophone array maximizes the measurement sensitivity anduniformity, while the external facing microphone is used foradaptive noise suppression. The algorithm was designed specif-ically for auscultation, dynamically adapting to the environmentand actively suppressing unwanted interfering noise, includingnoises with a spectral profile and temporal signature that overlapwith the body sounds.
In order to objectively quantify the design improvements, theproposed device is compared against 6 commercially availablestethoscopes ranging from acoustic designs to electronic state-of-the-art technologies. These specific devices were selectedbecause they each represent unique construction and parametersthat influence the characteristics of the transmitted sound anddeliver a different performance. The performance of the systemsis accounted for in terms of several key metrics: 1) sensitivityand uniformity of the transducing mechanism, 2) agreement withand quality-preservation of the transmitted body signals, and 3)resistance to unwanted ambient noise events.
The type of validation that is presented in this paper is notreasonable to do in real-world scenarios with this number ofdevices: exact comparison is limited by the reproducibility ofbody sounds in patients and ambient noise profiles in the realworld. We therefore use custom setups for reproducibility. Forsensing sensitivity, an 9-driver array was used to determineposition-dependency and sensitivity of the sensor. For quality-preservation of body sounds and noise robustness, a chest soundsimulator to emit signals recorded from normal and abnormalpatients is placed in an artificial clinical setting, created usinga sound booth wherein an 6-speaker setup broadcasts noisesof various types and volume levels. A combination of differentobjective quality measures adapted from speech processing areused to report performance for the various systems. By usingthese setups, we are able to directly compare the proposed deviceto many devices in hundreds of combinations of lung sounds andambient noises, and eliminate uncertainty across the analysis.
The sensing sensitivity analysis reveals that acoustic systemswith a diaphragm are highly sensitive to placement, while theproposed system provides uniformity across the entire pick-up
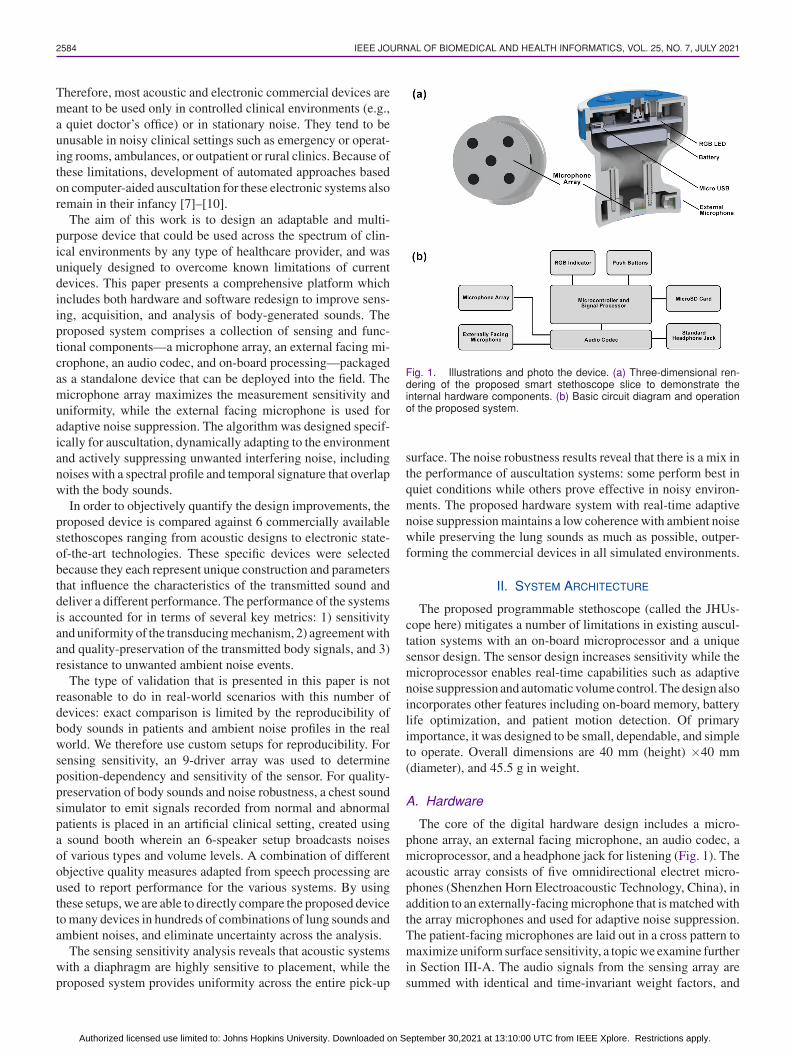
Fig. 1. Illustrations and photo the device. (a) Three-dimensional ren-dering of the proposed smart stethoscope slice to demonstrate theinternal hardware components. (b) Basic circuit diagram and operationof the proposed system.
surface. The noise robustness results reveal that there is a mix inthe performance of auscultation systems: some perform best inquiet conditions while others prove effective in noisy environ-ments. The proposed hardware system with real-time adaptivenoise suppression maintains a low coherence with ambient noisewhile preserving the lung sounds as much as possible, outper-forming the commercial devices in all simulated environments.
II. SYSTEM ARCHITECTURE
The proposed programmable stethoscope (called the JHUs-cope here) mitigates a number of limitations in existing auscul-tation systems with an on-board microprocessor and a uniquesensor design. The sensor design increases sensitivity while themicroprocessor enables real-time capabilities such as adaptivenoise suppression and automatic volume control. The design alsoincorporates other features including on-board memory, batterylife optimization, and patient motion detection. Of primaryimportance, it was designed to be small, dependable, and simpleto operate. Overall dimensions are 40 mm (height) ×40 mm(diameter), and 45.5 g in weight.
A. Hardware
The core of the digital hardware design includes a micro-phone array, an external facing microphone, an audio codec, amicroprocessor, and a headphone jack for listening (Fig. 1). Theacoustic array consists of five omnidirectional electret micro-phones (Shenzhen Horn Electroacoustic Technology, China), inaddition to an externally-facing microphone that is matched withthe array microphones and used for adaptive noise suppression.The patient-facing microphones are laid out in a cross pattern tomaximize uniform surface sensitivity, a topic we examine furtherin Section III-A. The audio signals from the sensing array aresummed with identical and time-invariant weight factors, and
Authorized licensed use limited to: Johns Hopkins University. Downloaded on September 30,2021 at 13:10:00 UTC from IEEE Xplore. Restrictions apply.

MCLANE et al.: DESIGN AND COMPARATIVE PERFORMANCE OF A ROBUST LUNG AUSCULTATION SYSTEM FOR NOISY CLINICAL SETTINGS 2585
both the array signal and ambient signal are processed through a96 kHz, 24-Bit ultra-low power NXP audio codec (NXP Semi-conductors, Netherlands), which coordinates data acquisition,analog-to-digital conversion, and transfer to the digital signalprocessing (DSP) block of the microprocessor.
The microprocessor is a Kinetis microcontroller with anARM Cortex-M4 core (NXP Semiconductors, Netherlands).The Kinetis microprocessor was chosen because of itssmall footprint, low power consumption, and low-costwithout compromising processing speed and DSP-specificarchitecture.The embedded microprocessor is a key componentof the JHUscope hardware, as it aims to run a number ofalgorithms to enable more intelligent capabilities to the system.In its current form, the microcontroller is used to implement thereal-time processing discussed in Section II-B. The inclusionof the microcontroller also allows for increased flexibility infuture iterations, including the addition of other sensors suchas inertial measurements to augment analysis methods.
Because this system is intended to be used in clinical, emer-gency medical, and global health environments, it was also care-fully designed in a way that offers optimal battery consumption.The device is powered by 3.7 V/500 mAh Li+ battery. Thesystem has an average current draw of 75 mA with peak currentdraws up to 120 mA and sleeping current draw less than 3 mA,meaning the battery lasts close to 6 hours of continuous usageor 2-3 days of normal clinical usage.
In addition, the design includes on-board storage for datacollection in the field and a micro-USB interface for rechargingthe battery of the device. The device is controlled through pushbuttons to control volume, initiate data recording, and poweringthe device on and off. LED indicators serve as simple visualguides for the user during the operation of the system. Users canlisten in real-time through a standard 3.5 mm headphone jack,which is enabled through the same NXP audio codec used forsignal acquisition (Fig. 1).
The device can also be easily reprogrammed through themicro-USB connected to a computer. Due to the programmablenature of the JHUscope, this same hardware system can beprogrammed to implement updates to signal processing, usabil-ity features, and real-time computerized lung sound analysis(CLSA). Noise suppression combined with CLSA would enablethis system to be deployed in all types of traditional and non-traditional clinical settings to provide objective and repeatablerespiratory assessment at a low cost.
B. Software
One of the key challenges of performing noise cancellation inauscultation systems is to deliver a noise-free signal that com-pletely removes any distortions from airborne ambient noise, allwhile cautiously avoiding cancellation of auscultation patternsthat are indicative of disease and can easily masquerade asnoise (e.g., crackling noises from the lung masquerading aspatient-generated noise).
The simple addition of active noise cancelling (ANC) head-phones to an electronic stethoscope does not adequately addressthese challenges because ambient noise is only controlled at
one entry point (the earpiece), but does not control for airborneambient noise contamination at the chestpiece. Therefore, theJHUscope runs a real-time adaptive noise suppression tech-nique on the device that optimizes both the removal of ambientnoise and the preservation of the signal in question, with betterquality than existing systems. At the core, the algorithm is anextension of classic spectral subtraction used in the fields ofcommunication and speech enhancement in that it operates in thefrequency domain and suppresses the ambient noise spectrumd(n) from the noisy auscultation spectrum y(n) [11], [12]. Afull account and validation of the algorithm has been presentedbefore (see [13] for complete details), but the real-time imple-mentation will be summarized next.
The device captures both y(n) and d(n) simultaneouslythrough a dual microphone setup, as described in Section II-A.The algorithm then maps short-time frames of the two signalsinto the spectral domain using a short-term Fourier transform,resulting in signals Yτ (ωk) and Dτ (ωk); where ωk indexesk = 1, . . ., 32 frequency bands and τ is used to represent pro-cessing over short-time windows w(n). The ambient noise isthen suppressed in an adaptive manner, such that
|Xτ (ωk)|2 = |Yτ (ωk)|2 − γτλk|Dτ (ωk)|2 (1)
where γτ and λk are time and frequency scaling coefficients,respectively. These coefficients are adjusted automatically foreach 50 ms time frame τ by the current SNR of that time frame,and for each frequency band k by the spectral profile of thesignals and a priori knowledge of body sound profiles [14]. Anestimate of the true lung sound signal xτ (t) is then obtained byapplying the inverse Fourier transform on Xτ (ωk) and then im-plementing a real-time version of overlap-and-add using circularbuffers. This localized time and frequency treatment is especiallycrucial given the variable, unpredictable, and nonuniform natureof noise that overlap in time and in frequency with lung sounds.
This algorithm was previously tested on real pediatric datacollected from busy or remote clinic centers with challeng-ing noise environments, part of a large-scale pneumonia eti-ology study (PERCH) [15]. Lung signals from 22 infants ac-quired in Gambia were analyzed using this algorithm. Objectivequality measures were used to compare the algorithm to anAdaptive-Noise-Canceling scheme (FXLMS) [16], [17]. Whilethe FXLMS algorithm was shown to deliver reasonable signalquality under controlled noise environments, it was unable toadapt fast enough to the high non-stationary nature of noise ina real-life, busy clinic. Furthermore, formal listening tests wereperformed by presenting a panel of 17 experts, a majority ofwhom were pediatric pulmonologists, with auscultation signalswith and without processing through the proposed denoisingalgorithm in a blind listening judgment of signal quality. Anoverwhelming 95.1% of cases processed through the proposedalgorithm were preferred by the panel of experts, further con-firming the efficacy of the denoising software at delivering im-proved quality signals without removing the clinically-importantinformation in the auscultation signal [13].
Finally, the system also includes an an automatic volumecontrol (AVC) block to amplify signals of interest and reducesloud, explosive signals caused by device or patient motion or
Authorized licensed use limited to: Johns Hopkins University. Downloaded on September 30,2021 at 13:10:00 UTC from IEEE Xplore. Restrictions apply.

2586 IEEE JOURNAL OF BIOMEDICAL AND HEALTH INFORMATICS, VOL. 25, NO. 7, JULY 2021
Fig. 2. Nine driver array setup (numbered) to determine surface sen-sitivity (left) and an example of how devices were affixed to the driverarray during recording (right).
friction. The AVC is designed as a traditional audio compressorthat decreases the signal when the measured level is above theprogrammed threshold. The threshold, the attack rate (the rate atwhich the incoming signal is attenuated down to the threshold)and the decay rate (the rate at which this volume returns backto its original level) are programmable, and customized so thatthe AVC does not distort important clinical sounds such as heartsounds.
III. METHODS
Two specific performance measures were chosen to comparethe JHUscope to the commercially-available systems: the JHUs-cope’s performance needs to balance high sensitivity with noiserobustness to ensure that the device can be used by all personnelin any type of environment. The following setups were usedto perform objective and repeatable assessment based on theseperformance measures.
A. Sensing Sensitivity
Sensing sensitivity examines the optimal positioning againstthe body by determining the sensitivity of the system’s pickupsurface. The sensing sensitivity is assessed by clamping the headof the JHUscope and subsequently, for comparison, a represen-tative acoustic stethoscope (ADC Adscope), and a representativeelectronic stethoscope (Thinklabs One) directly on top of a3-by-3 array of 8.5mm-diameter headphone drivers (ShenzhenHorn Electroacoustic Technology, China) spaced 4.5 mm apartand covered with a 2.5 mm layer of Ecoflex (Smooth On Inc., PA,USA) to account for the inertial loading introduced by the skinon the diaphragm. Ecoflex was chosen because of the similarmechanical properties to that of human skin [18]. See Fig. 2 fora depiction of the driver array setup.
A low-amplitude driving signal of pink noise xp(t) is playedfrom each driver position successively and output signals yij (t)are recorded for the individual driver positions i = [1, .., 9] overj = [1, .., 20] trials. Two comparisons are done to assess therole location and placement plays in the acoustic and proposedauscultation systems. The comparisons are only done with thediaphragm side of the acoustic stethoscope due to findings thatdeny the claims there is a significant difference in filteringbetween the diaphragm and bell settings [19].
TABLE ISPEAKER PLACEMENT RELATIVE TO THE POSITION OF THE STETHOSCOPE
ON THE CHEST SOUND SIMULATOR
First, we compare the spectral power for each yij (t) andcompare to the center position y5j (t). The spectral power wascalculated for frequencies in the range of [100, 1000] Hz, whichis where the majority of the power lies in lung sounds [14].An average power for each driver position i is calculated asPi =
120
∑20j=1 Pij , where the power of recorded signals Pij are
averaged for all j trials. Each Pi is then compared to the averagepower from the center position P5, calculated as logarithmicratio P = 10 log(Pi/P5).
Second, an analysis of variance (ANOVA) test is done to de-termine whether there are any statistically significant differencesbetween the full spectra of the driving and recorded signals at thenine positions for the three systems. To do this, the euclideandistance is measured between the magnitude spectrum of therecorded signal |Yij (n)|2 and the magnitude spectrum of thedriving pink noise signal |Xp(n)|2.
dij (|Yij |2, |Xp|2) =√∑N
n=1(|Yij (n)|2 − |Xp(n)|2)2 (2)
Considering the distance dij for each of the i positions as agroup, and each of the j trials for that position as observationsfor that group, we use a one-way ANOVA to determine if therea statistical significance in the distances between spectra basedon position. In other words, this test determines whether theposition of the input signal changes the output response of thesystems.
B. Clinical Simulation
The evaluation of the quality of the body signals that isdelivered to the end-user of the JHUscope is compared toother commercially-available stethoscopes in both quiet andextremely noisy environments. Noise robustness quantifies thedeterioration in auscultation signal quality as a function of back-ground noise. The proposed auscultation system was comparedagainst six commercially available systems, including state-of-the art and widely used acoustic or electronic devices, as listed inTable II. These systems are chosen to represent a wide selectionof options including acoustic and electronic devices as well asa wide range of features from static systems to active filteringones. It is important to note that this selection is not meant asan exhaustive list of all stethoscopes on the market, nor is ita statement about the performance of these systems in clinicalsettings. It is rather a comparison of their individual performanceunder specific simulated conditions.
The noise robustness validation tests are performed in asimulated noisy clinical setting recreated inside a sound boothin order to control the acoustic environment. Real auscultationsounds from both normal and abnormal lungs are played from a
Authorized licensed use limited to: Johns Hopkins University. Downloaded on September 30,2021 at 13:10:00 UTC from IEEE Xplore. Restrictions apply.

MCLANE et al.: DESIGN AND COMPARATIVE PERFORMANCE OF A ROBUST LUNG AUSCULTATION SYSTEM FOR NOISY CLINICAL SETTINGS 2587
Fig. 3. Schematic of the experimental setup illustrating the placement of the loudspeakers and the chest sound simulator (rectangular prism) fromthe side (left) and the top (right). h is the loudspeaker’s height position and d is the horizontal distance from the center of the chest sound simulator.The loudspeakers all face towards the chest sound simulator.
TABLE IILIST OF STETHOSCOPE DEVICES AND SETTINGS
chest sound simulation device, custom-built out of a loudspeakercovered in ballistic gelatin mimicking human tissue characteris-tics. The resulting signals emulate lung signals emanating fromthe body, used here as a reference for comparison. The use of thissetup ensured: i) control over the volume level of the emanatingbody sounds and ambient noise, ii) control over the variety of thepresented sounds iii) a repeatable setup for comparison amongvarious simulated noise profiles, iv) uniformity in sound pick-upamong auscultation systems, and v) reproducibility of results.
1) Clinical Room Simulation: Six loud speakers, one table,and one chest sound simulator were placed inside a sound boothof dimensions 148 in (long) x 123 in (wide) x 89 in (high),(Fig. 3). The table was positioned towards one end of the roomwhile the six Genelec 6010 A loudspeakers were arranged toroughly face towards the table at different height placements(Table I), independently broadcasting noise sounds of varioustypes and levels, reflecting a variety of examination settings froma quiet room to a busy clinic. On top of the table, the chest soundsimulator transmitted low volume body signals. The noise andbody sounds were delivered via a connected computer, stationedoutside of the sound booth.
For a given noise background and condition (signal-to-noiselevel), a commercially available stethoscope or the JHUscope arepositioned on top of the chest simulator in this setup and used toauscultate the reference signals while a calibrated microphoneis placed directly above it to capture the ambient noise signal.
2) Chest Auscultation Simulation: A chest sound simulatortransmitted digital breath signals at a low, fixed level (compara-ble to real chest auscultation signals) via a connected computerinstalled outside of the soundbooth. It was built comprisingof a Jawbone Jambox loudspeaker with frequency responseof 40–20 000 Hz and improved low-frequency sensitivity (viaa proprietary bass radiator). The loudspeaker was covered in1.5 in-thick medical synthetic gelatin (Humimic Medical, USA)that closely simulates the density and mechanical properties ofhuman muscle tissue and can be kept at room temperature with-out deforming [20], [21]. The gelatin was baked at 200°F for 4hours. A mold of the Jawbone Speaker was then placed inside theballistic gelatin and it was allowed to cool at room temperaturefor 12 hours. The mold was replaced with the speaker and sealedwith a heat gun; acoustic foam was placed at the bottom ofthe simulator to attenuate high frequency resonance and noisecoming from areas of contact with the table.
Each auscultation system was placed individually at a singledesignated location on top of the chest simulator and held inposition using a clamp to apply moderate pressure and ensurethe setup remained the same throughout the completion of allsimulations for each system.
3) Data Preparation: A collection of ten abnormal and tencontrol breath sounds of 10 s duration each were selected froma dataset of auscultation signals [22]. The abnormal group con-sisted of breath sounds containing wheeze, crackle and stridorsounds, while the control group consisted of mostly normalbreath sounds recorded over various chest and tracheal areas.All digital clips were downsampled to 8 kHz.
Authorized licensed use limited to: Johns Hopkins University. Downloaded on September 30,2021 at 13:10:00 UTC from IEEE Xplore. Restrictions apply.

2588 IEEE JOURNAL OF BIOMEDICAL AND HEALTH INFORMATICS, VOL. 25, NO. 7, JULY 2021
The High Stationary group of ambient noises consistedof several colored noise subgroups including white, pink, vi-olet, blue and brown, and fan-like noise found in the BBCdatabase [23]. In total, 20 ten-second clips were selected fromeach subgroup, resulting in 120 High Stationary noise sounds.
The Low Stationary noise group consisted of noise typesfound in the BBC and NoiseX-92 databases [23], [24], andincluded subgroups of hospital ICU noise, hospital corridornoise, pulse monitor sounds, ambulance noise, babble noiseand ambient talk, baby cry, street noise, chirping birds. Randomsilence periods were interjected to the noise clips to accentuatetheir non-stationary nature. An equal number of sounds wereselected from each subgroup and sorted according to their aver-age Power Spectral Entropy value (Eq. (3)), which was used as astationarity index such that minimum entropy occurs for highlyvariable sounds (low stationary noises) and maximum entropyoccurs when the spectral distribution in uniform (high stationarynoises).
PSE =1
M
M∑m=1
PSE(m) (3)
PSE(m) = −K∑
k=1
p(m, k) ln p(m, k) (4)
p(m, k) =PSD(m,ωk)∑K
k=1PSD(m,ωk)
(5)
where index m = 1, . . .,M signifies the processing windows ofduration 100 ms, ωk with k = 1, . . .,K and K = 1024 corre-sponds to the frequency index, and PSD to the multitaper powerspectral density estimate [25]. In a ranked list from lowest tohighest entropy, the first 120 sounds were selected and attributedto the Low Stationary group; the rest were discarded.
4) Sound Playback: While the chest sound simulator emittedthe selected body sounds at a fixed low volume, the loudspeakersindependently broadcasted noise sounds randomly selected fromthe database. The volume of individual speakers was set to arandom difference of {0, ± 0.5, ± 1, ± 2} dB from each other.The master speaker volume was automatically adjusted at thebeginning of each trial, ensuring a net noise effect of signal-to-noise ratio at various levels, SNRtrue ∈ {−20,−10, 0, 10, 15}dB. All transmitted lung sound clips were pre-amplified in-dependently to ensure equal average sound levels. In total 10normal and 10 abnormal lung sounds were used, each assignedto 5 random net noise combinations (trials), resulting in a set of100 sound recordings per SNRtrue value: 50 abnormal and 50normal.
The true SNR level, SNRtrue, for each lung sound/net noisecombination was determined by the short-term average of theratio of the individual signal powers, averaged over M framesof duration 100 ms each:
SNRtrue =1
M
M∑m=1
10 log10Ps(n)
Pd(n)(6)
where P∗(n) is the average signal power of the nth time frame;s corresponds to the sound signal recorded on the designatedreference point on top of the chest simulator; d corresponds tothe net ambient noise picked up adjacent to this designated point.Due to the dynamic nature of the lung sounds and noises as wellas the randomly interjected silence periods, the calculation ofSNRtrue considered only the top 30% of frames in order tocapture the highest average signal power. This way, it is ensuredthat no sound events exceed the desired SNR, while allowingfor lower sound level events to be present.
5) Sound Capture: For the calculation of the true SNR inSection III-B4, signals of interest s and d were recorded inde-pendently (not simultaneously). Signals s and d were obtainedusing two 1/4” PCB Piezotronics prepolarized, omnidirectionalcondenser microphones, connected to a Brüel & Kjaer 5935-Lpreamplifier at 20 dB gain. The first microphone was placedon top of the chest simulator, facing downwards for recordingsignal s; and the second microphone was placed adjacent to thefirst with a separating distance of 10 cm, facing upwards, forrecording signal d. The distance of these microphones from thespeakers follows the positioning presented in Table I and it isassumed that the signal power from the speakers is equal at bothmicrophones.
For the calculation of the quality metrics presented in Sec-tion III-C, simultaneous recordings were captured from theauscultation signal y, the reference sound driving the simulatorx, and the ambient microphone d. Digital sounds from theauscultation system were captured using an 8-track ZOOM H4recorder, situated outside the sound booth. All inherent soundeffects and sound filters were disabled and the master recordinggain was set at 0 dB.
C. Quality Metrics
The signal fidelity and noise robustness of each device isquantified by comparing the recorded auscultation signal yagainst the reference signalx that is driving the respiratory soundsimulator as well as against the noise background d recordedby a calibrated microphone positioned above the chest soundsimulator. This is done in order to assess two aspects of thesignal: (1) how distorted the recorded signal is relative to thereference signal; and (2) how much leakage the device has interms of letting noise mask the recorded auscultation.
There is currently no agreed upon standard for auscultation,so two existing objective quality metrics were chosen to quantifythe similarity between the reference and measured signals andthe amount of dissimilarity between the ambient and measuredsignals: normalized covariance measure (NCM ) and magnitudesquared coherence (MSC) [26]. Although NCM is a speech-based measure (as are most quality measures in the literature),it is biased by the perceptual system, accounting for signalaudibility at various frequency bands for the human ear hencereflecting a general account of improved quality of a signal asperceived by a human listener, or in this case the auscultatingclinician, on a scale of 0 (lowest quality) to 1 (highest quality).MSC is a statistical index that operates in the spectral domain
Authorized licensed use limited to: Johns Hopkins University. Downloaded on September 30,2021 at 13:10:00 UTC from IEEE Xplore. Restrictions apply.
MCLANE et al.: DESIGN AND COMPARATIVE PERFORMANCE OF A ROBUST LUNG AUSCULTATION SYSTEM FOR NOISY CLINICAL SETTINGS 2589
and examines the relation between two signals. Unlike NCM ,this metric treats the full frequency spectrum evenly and linearlyand the inclusion of MSC limits the shortcomings of using aperceptually biased metric alone. As with NCM , MSC givesa value of 1 for signals that have exact coherence to each other.
The metrics were chosen for their i) objective and standard-ized quality assessment ii) high correlation to human intelligi-bility scores, and iii) independence to signal amplification orvolume variations of the signals. The measures also highlighttwo different aspects of the system: MSC values are not affectedby non-linear operations whereas NCM is a measure that reliablypredicts the effects of non-linear operations such as envelopethresholding or distortions introduced by spectral-subtractionalgorithms [27].
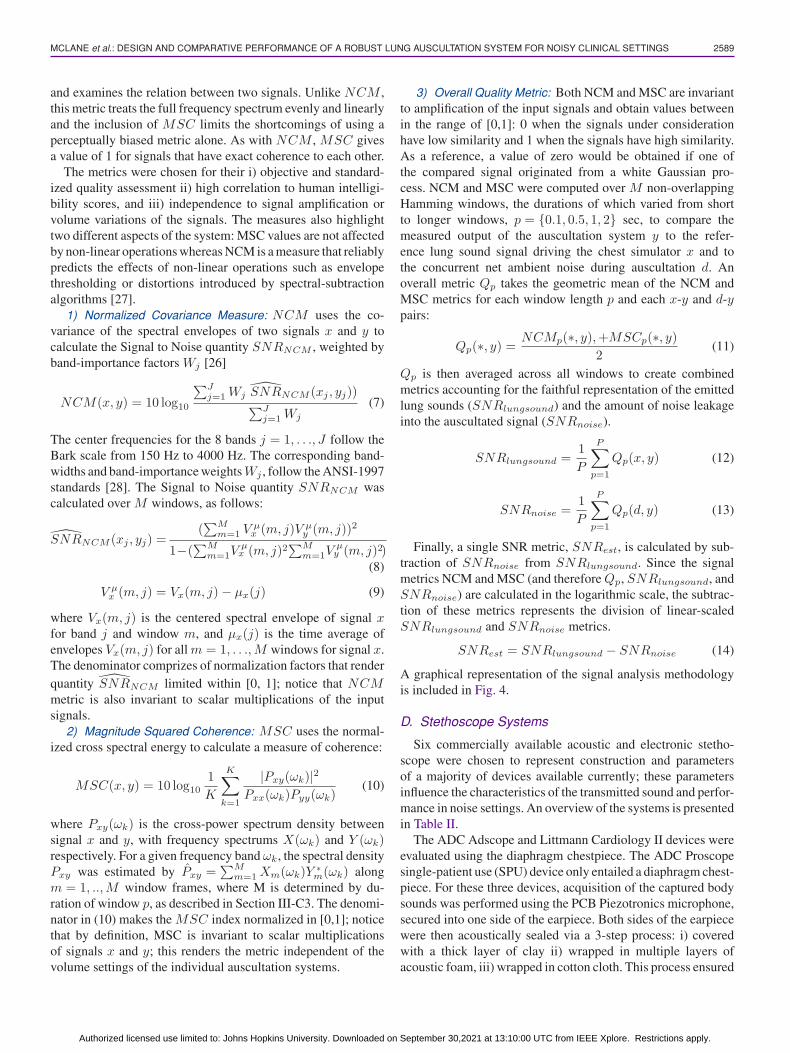
1) Normalized Covariance Measure: NCM uses the co-variance of the spectral envelopes of two signals x and y tocalculate the Signal to Noise quantity SNRNCM , weighted byband-importance factors Wj [26]
NCM(x, y) = 10 log10
∑Jj=1 Wj
SNRNCM (xj , yj))∑Jj=1 Wj
(7)
The center frequencies for the 8 bands j = 1, . . ., J follow theBark scale from 150 Hz to 4000 Hz. The corresponding band-widths and band-importance weightsWj , follow the ANSI-1997standards [28]. The Signal to Noise quantity SNRNCM wascalculated over M windows, as follows:
SNRNCM (xj , yj) =(∑M
m=1 Vμx (m, j)V μ
y (m, j))2
1−(∑M
m=1Vμx (m, j)2
∑Mm=1V
μy (m, j)2)
(8)
V μx (m, j) = Vx(m, j)− μx(j) (9)
where Vx(m, j) is the centered spectral envelope of signal xfor band j and window m, and μx(j) is the time average ofenvelopes Vx(m, j) for all m = 1, . . .,M windows for signal x.The denominator comprizes of normalization factors that renderquantity SNRNCM limited within [0, 1]; notice that NCMmetric is also invariant to scalar multiplications of the inputsignals.
2) Magnitude Squared Coherence: MSC uses the normal-ized cross spectral energy to calculate a measure of coherence:
MSC(x, y) = 10 log101
K
K∑k=1
|Pxy(ωk)|2Pxx(ωk)Pyy(ωk)
(10)
where Pxy(ωk) is the cross-power spectrum density betweensignal x and y, with frequency spectrums X(ωk) and Y (ωk)respectively. For a given frequency band ωk, the spectral densityPxy was estimated by Pxy =
∑Mm=1 Xm(ωk)Y
∗m(ωk) along
m = 1, ..,M window frames, where M is determined by du-ration of window p, as described in Section III-C3. The denomi-nator in (10) makes the MSC index normalized in [0,1]; noticethat by definition, MSC is invariant to scalar multiplicationsof signals x and y; this renders the metric independent of thevolume settings of the individual auscultation systems.
3) Overall Quality Metric: Both NCM and MSC are invariantto amplification of the input signals and obtain values betweenin the range of [0,1]: 0 when the signals under considerationhave low similarity and 1 when the signals have high similarity.As a reference, a value of zero would be obtained if one ofthe compared signal originated from a white Gaussian pro-cess. NCM and MSC were computed over M non-overlappingHamming windows, the durations of which varied from shortto longer windows, p = {0.1, 0.5, 1, 2} sec, to compare themeasured output of the auscultation system y to the refer-ence lung sound signal driving the chest simulator x and tothe concurrent net ambient noise during auscultation d. Anoverall metric Qp takes the geometric mean of the NCM andMSC metrics for each window length p and each x-y and d-ypairs:
Qp(∗, y) = NCMp(∗, y),+MSCp(∗, y)2
(11)
Qp is then averaged across all windows to create combinedmetrics accounting for the faithful representation of the emittedlung sounds (SNRlungsound) and the amount of noise leakageinto the auscultated signal (SNRnoise).
SNRlungsound =1
P
P∑p=1
Qp(x, y) (12)
SNRnoise =1
P
P∑p=1
Qp(d, y) (13)
Finally, a single SNR metric, SNRest, is calculated by sub-traction of SNRnoise from SNRlungsound. Since the signalmetrics NCM and MSC (and therefore Qp, SNRlungsound, andSNRnoise) are calculated in the logarithmic scale, the subtrac-tion of these metrics represents the division of linear-scaledSNRlungsound and SNRnoise metrics.
SNRest = SNRlungsound − SNRnoise (14)
A graphical representation of the signal analysis methodologyis included in Fig. 4.
D. Stethoscope Systems
Six commercially available acoustic and electronic stetho-scope were chosen to represent construction and parametersof a majority of devices available currently; these parametersinfluence the characteristics of the transmitted sound and perfor-mance in noise settings. An overview of the systems is presentedin Table II.
The ADC Adscope and Littmann Cardiology II devices wereevaluated using the diaphragm chestpiece. The ADC Proscopesingle-patient use (SPU) device only entailed a diaphragm chest-piece. For these three devices, acquisition of the captured bodysounds was performed using the PCB Piezotronics microphone,secured into one side of the earpiece. Both sides of the earpiecewere then acoustically sealed via a 3-step process: i) coveredwith a thick layer of clay ii) wrapped in multiple layers ofacoustic foam, iii) wrapped in cotton cloth. This process ensured
Authorized licensed use limited to: Johns Hopkins University. Downloaded on September 30,2021 at 13:10:00 UTC from IEEE Xplore. Restrictions apply.

2590 IEEE JOURNAL OF BIOMEDICAL AND HEALTH INFORMATICS, VOL. 25, NO. 7, JULY 2021
Fig. 4. Flowchart highlighting the signal analysis methodology for de-termining the overall quality metric SNRest.
restriction of potential noise leakage through the ends of theearpiece. It is important to highlight here that such systems forwhich sound travels through a chestpiece, noise leakage is morethan likely to occur throughout the full length of the tubing piece.It was outside of the scope of this study to attempt to contain allpossible sources of noise leakage, especially those that add to adevice’s vulnerabilities.
The EKO Core hybrid electronic/acoustic device was toggledto ON, to ensure digital acquisition, and the middle volumesetting was selected while the diaphragm chestpiece was usedfor auscultation. Sound was acquired through the earpiece usingthe same process as above. Notice here that the device offersan accompanying phone application for digital sound capturingand while the Bluetooth indicator was flashing, the device wasnot connected to a phone to ensure uniformity in the record-ing process. The current study focused on assessing the audiosignal reaching the user in real-time, simulating a scenario ofreal-world auscultation; and thus, additional computer softwarewas not considered here.
The Littmann 3200 electronic device was set to active mode(non-standby mode), the filter option was set to Extended mode,volume set at the middle setting. The Extended Range modeamplifies sounds from 20–2000 Hz similar to the DiaphragmMode, but provides more low frequency response between 50–500 Hz. Sound was again acquired using the process above.Due to the restricted automatic shut-off feature, the device hadto be set into active mode regularly throughout the duration ofthe experiments. This device also comes with an accompanyingcomputer software for digital sound acquisition which was alsoforgone to ensure uniformity in the recording process and a morerealistic use-case.
Thinklabs One electronic device offers a standard 3.5 mm au-dio jack output where the user connects headphones, providingthe capability of directly recording the transmitted sound via anaudio cable connected to the recording system. The filter option
Fig. 5. Sensitivity map of a traditional stethoscope head (left), sensitiv-ity map of the Thinklabs One electronic stethoscope head (center), andsensitivity map of the proposed JHUscope smart stethoscope (right) indecibels as compared to the power at the center position.
recommended for lung sounds was used (filter setting 3-4), andthe volume was set at the middle point.
IV. RESULTS
A. Sensing Sensitivity
First, we measure the output power as a function of location.Fig. 5 shows a surface sensitivity heatmap of the JHUscopeversus the ADC acoustic stethoscope and the Thinklabs Oneelectronic stethoscope, revealing spectral power in decibels rel-ative to the center position. In a traditional stethoscope head,the diaphragm is designed to partially integrate over the surfaceof the head [29]. However, our analysis shows that the acousticstethoscope is maximally sensitive at the center of the stetho-scope head, directly under the opening leading to the tubing, anddecreases dramatically towards the edges with a loss of almost30 dB in dynamic range at the outer edges of the stethoscope(Fig. 5-left). Similarly, the Thinklabs One electronic stethoscopeexhibits positional relationship to signal power (Fig. 5-center),possibly due to transducer design. In contrast, the JHUscope in-creases the number of pickup positions across the stethoscope’shead with a five microphone array and therefore provides amore uniform surface to capture body sounds (Fig. 5-right).These results are consistent with previously reported studiesthat demonstrate that diaphragms have the ability to increase themean vibrational velocity across the surface but have significantdifferences between the velocity values measured at center andedge points of those diaphragms [30].
In order to further illustrate these differences and the powerloss at certain positions, Fig. 6 shows an example of the powerspectrum from the JHUscope and the acoustic systems for aposition that is distant from the center. In this example, theaverage power spectrum from Position 1 relative to the averagepower spectrum from the center position, Position 5, was chosento illustrate the spatial dependencies of the sensitivity. For thisposition, the JHUscope preserves signal power relative to thecenter and across the frequencies of interest while the ADCAdscope shows a significant decrease in power—down to 20 dBless—and high variability across the spectrum.
Second, we further evaluate whether the full spectra of theoutput and input signals are statistically different (p < 0.05)across pickup positions. An ANOVA parametric analysis reveals
Authorized licensed use limited to: Johns Hopkins University. Downloaded on September 30,2021 at 13:10:00 UTC from IEEE Xplore. Restrictions apply.
MCLANE et al.: DESIGN AND COMPARATIVE PERFORMANCE OF A ROBUST LUNG AUSCULTATION SYSTEM FOR NOISY CLINICAL SETTINGS 2591
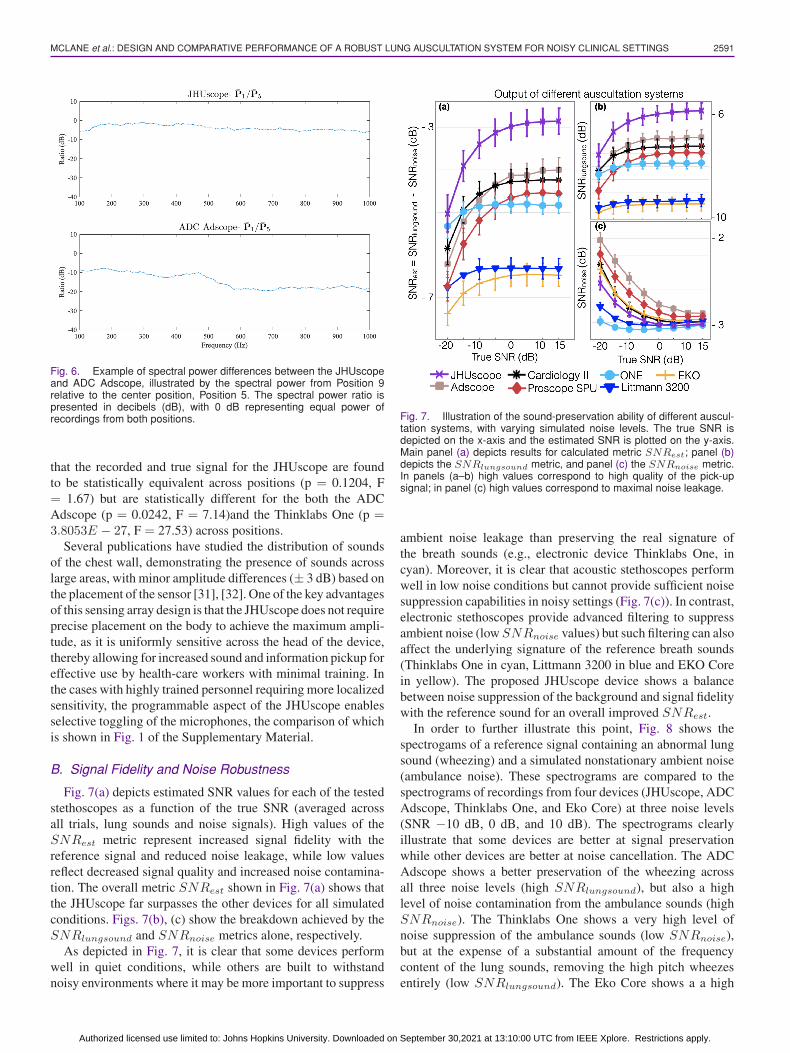
Fig. 6. Example of spectral power differences between the JHUscopeand ADC Adscope, illustrated by the spectral power from Position 9relative to the center position, Position 5. The spectral power ratio ispresented in decibels (dB), with 0 dB representing equal power ofrecordings from both positions.
that the recorded and true signal for the JHUscope are foundto be statistically equivalent across positions (p = 0.1204, F= 1.67) but are statistically different for the both the ADCAdscope (p = 0.0242, F = 7.14)and the Thinklabs One (p =3.8053E − 27, F = 27.53) across positions.
Several publications have studied the distribution of soundsof the chest wall, demonstrating the presence of sounds acrosslarge areas, with minor amplitude differences (± 3 dB) based onthe placement of the sensor [31], [32]. One of the key advantagesof this sensing array design is that the JHUscope does not requireprecise placement on the body to achieve the maximum ampli-tude, as it is uniformly sensitive across the head of the device,thereby allowing for increased sound and information pickup foreffective use by health-care workers with minimal training. Inthe cases with highly trained personnel requiring more localizedsensitivity, the programmable aspect of the JHUscope enablesselective toggling of the microphones, the comparison of whichis shown in Fig. 1 of the Supplementary Material.
B. Signal Fidelity and Noise Robustness
Fig. 7(a) depicts estimated SNR values for each of the testedstethoscopes as a function of the true SNR (averaged acrossall trials, lung sounds and noise signals). High values of theSNRest metric represent increased signal fidelity with thereference signal and reduced noise leakage, while low valuesreflect decreased signal quality and increased noise contamina-tion. The overall metric SNRest shown in Fig. 7(a) shows thatthe JHUscope far surpasses the other devices for all simulatedconditions. Figs. 7(b), (c) show the breakdown achieved by theSNRlungsound and SNRnoise metrics alone, respectively.
As depicted in Fig. 7, it is clear that some devices performwell in quiet conditions, while others are built to withstandnoisy environments where it may be more important to suppress
Fig. 7. Illustration of the sound-preservation ability of different auscul-tation systems, with varying simulated noise levels. The true SNR isdepicted on the x-axis and the estimated SNR is plotted on the y-axis.Main panel (a) depicts results for calculated metric SNRest; panel (b)depicts the SNRlungsound metric, and panel (c) the SNRnoise metric.In panels (a–b) high values correspond to high quality of the pick-upsignal; in panel (c) high values correspond to maximal noise leakage.
ambient noise leakage than preserving the real signature ofthe breath sounds (e.g., electronic device Thinklabs One, incyan). Moreover, it is clear that acoustic stethoscopes performwell in low noise conditions but cannot provide sufficient noisesuppression capabilities in noisy settings (Fig. 7(c)). In contrast,electronic stethoscopes provide advanced filtering to suppressambient noise (lowSNRnoise values) but such filtering can alsoaffect the underlying signature of the reference breath sounds(Thinklabs One in cyan, Littmann 3200 in blue and EKO Corein yellow). The proposed JHUscope device shows a balancebetween noise suppression of the background and signal fidelitywith the reference sound for an overall improved SNRest.
In order to further illustrate this point, Fig. 8 shows thespectrogams of a reference signal containing an abnormal lungsound (wheezing) and a simulated nonstationary ambient noise(ambulance noise). These spectrograms are compared to thespectrograms of recordings from four devices (JHUscope, ADCAdscope, Thinklabs One, and Eko Core) at three noise levels(SNR −10 dB, 0 dB, and 10 dB). The spectrograms clearlyillustrate that some devices are better at signal preservationwhile other devices are better at noise cancellation. The ADCAdscope shows a better preservation of the wheezing acrossall three noise levels (high SNRlungsound), but also a highlevel of noise contamination from the ambulance sounds (highSNRnoise). The Thinklabs One shows a very high level ofnoise suppression of the ambulance sounds (low SNRnoise),but at the expense of a substantial amount of the frequencycontent of the lung sounds, removing the high pitch wheezesentirely (low SNRlungsound). The Eko Core shows a a high
Authorized licensed use limited to: Johns Hopkins University. Downloaded on September 30,2021 at 13:10:00 UTC from IEEE Xplore. Restrictions apply.

2592 IEEE JOURNAL OF BIOMEDICAL AND HEALTH INFORMATICS, VOL. 25, NO. 7, JULY 2021
Fig. 8. Example of recordings from four different auscultation systems (JHUscope, ADC Adscope, Thinklabs One, and Eko Core) at threesimulated noise levels, to highlight the issues summarized in Fig. 7. Panel (a) represents the spectrogam of the reference recording of breathswith expiratory wheezing, an abnormal lung sound signal. Panel (b) represents the simulated ambient noise spectrogram of nonstationary, transientsounds (ambulance noises). Panels (c)–(e) show the pick-up signal for the three devices for SNRs −10 dB, 0db, and 10 dB, respectively. Therecordings from each device can be compared to the reference spectrograms to illustrate the SNRlungsound and SNRnoise metrics.
level of noise suppression (low SNRnoise), but adds noise inhigher frequency bands, resulting in a low SNRlungsound. Theproposed JHUscope preserves the power of the abnormal lungsounds in all three scenarios (high SNRlungsounds) while alsobeing able to suppress the ambulance sounds (low SNRnoise).
V. DISCUSSION
Three main points should be taken into consideration withthe current study. First, we note that there is expected to bevariability across system performances that is driven by a varietyof factors including product design and the physical device,system architecture and inherent signal processing, and signalacquisition layout. The quality performance results presented inthis work are based on the standalone capabilities of the includeddevices, and do not include supplementary computer programsor phone applications in the analysis.
Some well-known sources of sound alteration are the chestpiece design and the attached tubing typically found in acousticstethoscopes and some electronic devices (e.g., ADC Adcope,Littmann Cardiology II, EKO Core, Littmann 3200), as well asdigital filters in electronic systems. The diaphragm of acousticand electronic stethoscopes, by design, is meant to cut off some
of the very low and very high frequencies [33]. The narrowtubing and earpiece components are another source of soundalteration [34], [35]: sounds propagating through narrow longtubes have specific resonant frequencies and a decreased re-sponse to high frequency content. In addition to sound alteration,the chestpiece and tubing may further incur ambient noiseleakage, especially in noisy environments. This can result ina contaminated propagating sound that drifts further away fromthe actual body sounds. Electronic system also have varioussources of sound alteration. Electronic stethoscopes typicallyutilize various types of electroacoustic contact transducers thatwill influence the sensitivity and sound characteristic of thepickup signal in a different manner than a diaphragm of an acous-tic stethoscope [36]. Digital filters in electronic systems thatare geared towards lung sound auscultation typically suppressfrequencies below 300 Hz and above 800–1000 Hz, and althoughthese are deliberate design choices for attenuating external noiseand promoting specific signal frequencies, they may also furthercontribute to a decreased signal fidelity in certain electronicstethoscopes.
Second, the performance curves should not be interpreted asan absolute ranking of the various auscultation systems. Instead,they provide an insight into the variability of each individual
Authorized licensed use limited to: Johns Hopkins University. Downloaded on September 30,2021 at 13:10:00 UTC from IEEE Xplore. Restrictions apply.

MCLANE et al.: DESIGN AND COMPARATIVE PERFORMANCE OF A ROBUST LUNG AUSCULTATION SYSTEM FOR NOISY CLINICAL SETTINGS 2593
system when the level and type of the ambient noise varies. Notethat a system’s output can be sensitive to the amount of pressureused when placed on the body or on top of the chest simulator.High pressure allows for better contact with the chest simulatorand less ambient noise leakage via the chest piece. In our setup,the use of clamps to secure the chest piece of each device ensuredminimal setup variability; however, due to the different shapesand sizes of the auscultation devices full elimination of pressurevariability could not be guaranteed in a straightforward manner.In addition, there is a great deal of variability in setting choicesincluding volume of each system. Although steps were taken toprevent such variability such as using the middle volume settingfor all electronic devices and choosing performance metrics tobe invariable to scalar multiplications of the signals, one couldargue that the volume setting might still affect the end result: ahigh volume setting might allow for less relative noise leakagethat can contaminate the pick-up signal or it could be the casethat some systems process incoming sounds in a different waydependent on the input volume level.
Lastly, the objective metrics in this study reflect the systems’ability to preserve the reference emanating body sounds, butshould not be used to reflect an expert’s ability to form a diag-nostic opinion using these systems without further exploration.The present study compares the auscultated signals against thetrue breath sounds driving the chest simulator through a metricthat quantifies the fidelity of the information contained in theauscultation signal rather than other metrics such as amplifi-cation. Indirect measures that focus on sound quality ratherthan fidelity can obscure any filtering, attenuation, or distortionsapplied by the stethoscope to abnormal body sound events. Adirect correlation to the end-user’s ability to diagnose a bodycondition based on the delivered sounds would require furtherevaluation with expert listener panels and would depend on thenature of the body sounds of interest.
In future investigations, the real-time noise suppression algo-rithm should be validated against other noise reduction method-ologies in a similar manner to further characterize and under-stand the limitations of the current methodology, such as theuse of the Short-time Fourier Transform. We should also doa full comparison of the cost, processing power, battery life,and programmability against other available devices. To fullyvalidate the signal quality of the device, we would also needto consider real-life conditions. Although a preliminary studyhas been conducted of a pairwise comparison of the JHUscopeand the Thinklabs One in a small pediatric population [37],the JHUscope needs to be tested on a more extensive sets ofnormal and abnormal lung sounds, a larger patient populationwith various conditions, and in various real-life environmentalnoise conditions. The system’s validation would also benefitfrom evaluations for use with other body sounds, such as heart,bowel, and joint sounds.
VI. CONCLUSION
This work describes a new digital stethoscope that bringssolutions to old and recurring problems of auscultation toolsby equipping the system with an advanced sensing mechanism,
dynamic noise suppression design, and programmability totackle known shortcomings. Noise leakage and sound alterationeffects are evident among all compared systems. Although highnoise suppression is generally desirable, it can incur signif-icant sound alteration to the auscultated sounds. A balancedsolution is thus desirable which maintains the full spectrumof the sound while minimizing noise. Our experiments haveshown that the JHUscope delivers sound signals faithful to thereference body sounds, achieving increased pick-up sensitivityand decreased noise leakage. The proposed system is proven tobe a robust, powerful and versatile tool that can be used reliablyin challenging and noisy environments. This system can bringvalue to the clinicians in their traditional auscultation process,but can also add value to computer-aided auscultation systems(CAAS) that would benefit from a broader and more accuraterepresentation of body sounds. Most CAAS approaches havemainly been validated in well-controlled or quiet clinical settingson adult subjects; there is yet to have a true impact on health-carepractices in various clinical settings [38]–[41].
Since lung auscultation remains an important component ofrespiratory infection diagnosis with more predictive accuracythan an initial clinical assessment alone [5], a device that canprovide clinical workers with markedly improved signal qualitymay be critical for increasing the accuracy of clinical diagnosisof respiratory infections. Better still, the programmability of theJHUscope can enable deployment of real-time CAAS for clinicaldecision support: previously-evaluated CAAS algorithms thatcan subsequently be introduced on this hardware device [42],[43] would be able to be deployed to both traditional andnon-traditional clinical settings and support the diagnosis ofrespiratory conditions, bringing patients closer to successfultreatments in resource-limited settings.
Competing Interests: The authors declare the existence of afinancial competing interest. Under a license agreement betweenSonavi Labs and the Johns Hopkins University, I.M. and the Uni-versity are entitled to royalty distributions related to technologyused in the study discussed in this publication. Additionally, theUniversity owns equity in Sonavi Labs. I.M. is a founder of andholds equity in Sonavi Labs and serves as the company’s ChiefTechnology Officer and a member of its Board of Directors. Thisarrangement has been reviewed and approved by Johns HopkinsUniversity in accordance with its conflict of interest policies.
REFERENCES
[1] T. Ferkol and D. Schraufnagel, “The global burden of respiratory disease,”Ann. Amer. Thoracic Soc., vol. 11, no. 3, pp. 404–406, 2014.
[2] A. Sakula, “R t h laënnec 1781–1826 his life and work: A bicentenaryappreciation.” Thorax, vol. 36, no. 2, pp. 81–90, 1981.
[3] J. S. Russotti, R. P. Jackman, T. P. Santoro, and D. D. White, “Noisereduction stethoscope for united states navy application,” Nav. SubmarineRes. Lab, Groton, CT, Tech. Rep. 1214, 2000.
[4] World Health Organization, Revised WHO classification and treatment ofchildhood pneumonia at health facilities. Geneva, Switzerland, 2014.
[5] F. Pervaiz et al., “Building a prediction model for radiographically con-firmed pneumonia in peruvian children: From symptoms to imaging,”Chest, vol. 154, no. 6, pp. 1385–1394, 2018.
[6] G. Nelson, “Stethoscope design for auscultation in high noise environ-ments,” Ph.D. dissertation, Univ. Minnesota, Minneapolis, MN, USA,2015.
Authorized licensed use limited to: Johns Hopkins University. Downloaded on September 30,2021 at 13:10:00 UTC from IEEE Xplore. Restrictions apply.

2594 IEEE JOURNAL OF BIOMEDICAL AND HEALTH INFORMATICS, VOL. 25, NO. 7, JULY 2021
[7] J. Solà et al., “Towards an unsupervised device for the diagnosis ofchildhood pneumonia in low resource settings: Automatic segmentationof respiratory sounds,” Proc. Annu. Int. Conf. IEEE Eng. Med. Biol. Soc.,Oct. 2016, pp. 283–286.
[8] A. Poreva, Y. Karplyuk, A. Makarenkova, and A. Makarenkov, “Appli-cation of bispectrum analysis to lung sounds in patients with the chronicobstructive lung disease,” in Proc. IEEE 34th Int. Sci. Conf. Electron.Nanotechnol., 2014, pp. 306–309.
[9] M. Lozano, J. A. Fiz, and R. Jané, “Automatic differentiation of normaland continuous adventitious respiratory sounds using ensemble empiri-cal mode decomposition and instantaneous frequency,” IEEE J. Biomed.Health Informat., vol. 20, no. 2, pp. 486–497, Mar. 2016.
[10] G. Nelson and R. Rajamani, “Accelerometer-based acoustic control:Enabling auscultation on a black hawk helicopter,” IEEE/ASME Trans.Mechatronics, vol. 22, no. 2, pp. 994–1003, Apr. 2017.
[11] P. C. Loizou, Speech Enhancement: Theory and Practice. Boca Raton, FL,USA: CRC Press, 2013.
[12] G. Prasad et al., “A review of different approaches of spectral subtrac-tion algorithms for speech enhancement,” Curr. Res. Eng, vol. 1, no. 2,pp. 57–64, 2013.
[13] D. Emmanouilidou, E. D. McCollum, D. E. Park, and M. Elhilali, “Adap-tive noise suppression of pediatric lung auscultations with real applicationsto noisy clinical settings in developing countries,” IEEE Trans. Biomed.Eng., vol. 62, no. 9, pp. 2279–2288, Sep. 2015.
[14] L. E. Ellington et al., “Developing a reference of normal lung sounds inhealthy peruvian children,” Lung, vol. 192, no. 5, pp. 765–773, 2014.
[15] O. S. Levine et al., “The pneumonia etiology research for child healthproject: A 21st century childhood pneumonia etiology study,” Clin. In-fect. Dis.: Official Pub. Infect. Dis. Soc. Amer., vol. 54, no. Suppl 2,pp. S 93–S101, Apr. 2012.
[16] S. B. Patel et al., “An adaptive noise reduction stethoscope for auscultationin high noise environments,” J. Acoust. Soc. Amer., vol. 103, no. 5,pp. 2483–2491, 1998.
[17] G. Nelson, R. Rajamani, and A. Erdman, “Noise control challenges forauscultation on medical evacuation helicopters,” Appl. Acoust., vol. 80,pp. 68–78, 2014.
[18] N. Lu, C. Lu, S. Yang, and J. Rogers, “Highly sensitive skin-mountablestrain gauges based entirely on elastomers,” Adv. Funct. Mater., vol. 22,no. 19, pp. 4044–4050, 2012.
[19] L. J. Nowak and K. M. Nowak, “Acoustic characterization of stethoscopesusing auscultation sounds as test signals,” J. Acoust. Soc. Amer., vol. 141,no. 3, pp. 1940–1946, 2017.
[20] C. Van Sligtenhorst, D. S. Cronin, and G. Wayne Brodland, “High strainrate compressive properties of bovine muscle tissue determined using asplit hopkinson bar apparatus,” J. Biomech., vol. 39, no. 10, pp. 1852–1858,2006.
[21] M. L. Fackler and J. A. Malinowski, “Ordnance gelatin for ballistic studies.detrimental effect of excess heat used in gelatin preparation,” Amer. J.Forensic Med. Pathol., vol. 9, no. 3, pp. 218–219, Sep. 1988.
[22] J. A. S. McCann, Nursing Know-How: Evaluating Heart & BreathSounds. Philadelphia, PA, USA: Lippincott Williams & Wilkins, 2009, iD:731183533.
[23] BBC, “Sound Effects,” British Broadcasting Corporation. Accessed: Jan.17, 2017. [Online]. Available: http://sound-effects.bbcrewind.co.uk
[24] A. P. Varga, H. J. M. Steeneken, M. Tomlinson, and D. Jones, “The noisex-92 study on the effect of additive noise on automatic speech recognition,”Tech. Rep., Speech Res. Unit, Defense Res. Agency, Malvern, U.K., 1992.
[25] J. S. Richman and J. R. Moorman, “Physiological time-series analysisusing approximate entropy and sample entropy,” Amer. J. Physiol. - HeartCircul. Physiol., vol. 278, no. 6, pp. H2039–H2049, 2000.
[26] J. Ma, Y. Hu, and P. C. Loizou, “Objective measures for predictingspeech intelligibility in noisy conditions based on new band-importancefunctions.” J. Acoust. Soc. Amer., vol. 125, no. 5, pp. 3387–405, May 2009.
[27] R. L. Goldsworthy and J. E. Greenberg, “Analysis of speech-based speechtransmission index methods with implications for nonlinear operations,”J. Acoust. Soc. Amer., vol. 116, no. 6, pp. 3679–3689, 2004.
[28] American National Standards Institute. American National Standard:Methods for Calculation of the Speech Intelligibility Index. AcousticalSociety of America, 1997.
[29] T. Rossinger, Handbook of Acoustics, 2nd ed., T. Rossinger, Ed. Berlin,Germany: Springer, 2014.
[30] L. J. Nowak and K. M. Nowak, “An experimental study on the role andfunction of the diaphragm in modern acoustic stethoscopes,” Appl. Acoust.,vol. 155, pp. 24–31, 2019.
[31] G. Benedetto, F. Dalmasso, and R. Spagnolo, “Surface distribution ofcrackling sounds,” IEEE Trans. Biomed. Eng., vol. 35, no. 5, pp. 406–412,May 1988.
[32] Y. Kawamura, Y. Yokota, and F. Nogata, “Propagation route estimationof heart sound through simultaneous multi-site recording on the chestwall,” in Proc. 29th Annu. Int. Conf. IEEE Eng. Med. Biol. Soc., 2007,pp. 2875–2878.
[33] P. Y. Ertel, M. Lawrence, R. K. Brown, and A. M. Stern, “Stethoscopeacoustics,” Circulation, vol. 34, no. 5, pp. 899–909, 1966.
[34] G. Kirchhoff, “Ueber den einfluss der wärmeleitung in einem gase auf dieschallbewegung,” Annalen Der Physik, vol. 210, no. 6, pp. 177–193, 1868.
[35] D. E. Weston, “The theory of the propagation of plane sound waves intubes,” Proc. Phys. Soc. B, vol. 66, pp. 695–709, Aug. 1953.
[36] S. Leng, R. San Tan, K. T. C. Chai, C. Wang, D. Ghista, and L. Zhong, “Theelectronic stethoscope,” Biomed. Eng. Online, vol. 14, no. 1, pp. 1–37,2015.
[37] S. Graceffo, A. Hussain, S. Ahmed, E. D. McCollum, and M.Elhilali, “Validation of auscultation technologies using objective andclinical comparisons,” in Proc. Annu. Conf. Eng. Med. Biol. Soc., 2020,pp. 992–997.
[38] N. Q. Al-Naggar, “A new method of lung sounds filtering using modulatedleast mean square-adaptive noise cancellation,” J. Biomed. Sci. Eng., vol. 6,pp. 869–876, 2013.
[39] K. K. Guntupalli, P. M. Alapat, V. D. Bandi, and I. Kushnir, “Validationof automatic wheeze detection in patients with obstructed airways and inhealthy subjects,” J. Asthma, vol. 45, no. 10, pp. 903–907, Jan. 2008.
[40] J. Li and Y. Hong, “Wheeze detection algorithm based on spectrogramanalysis,” Proc. 8th Int. Symp. Comput. Intell. Des., vol. 1, 2015, pp. 318–322.
[41] M. Yamashita, M. Himeshima, and S. Matsunaga, “Robust classificationbetween normal and abnormal lung sounds using adventitious-sound andheart-sound models,” in Proc. IEEE Int. Conf. Acoust., Speech SignalProcess., May 2014, pp. 4418–4422.
[42] D. Emmanouilidou, K. Patil, J. West, and M. Elhilali, “A multiresolutionanalysis for detection of abnormal lung sounds,” in Proc. Annu. Int. Conf.IEEE Eng. Med. Biol. Soc., 2012, pp. 3139–3142.
[43] D. Emmanouilidou, E. D. McCollum, D. E. Park, and M. Elhilali, “Com-puterized lung sound screening for pediatric auscultation in noisy fieldenvironments,” IEEE Trans. Biomed. Eng., vol. 65, no. 7, pp. 1564–1574,Jul. 2018.
Authorized licensed use limited to: Johns Hopkins University. Downloaded on September 30,2021 at 13:10:00 UTC from IEEE Xplore. Restrictions apply.