design and collection of the neti new england travel survey
TRANSCRIPT

A report by the University of Vermont Transportation Research Center
Design and Collection of the NETI New England Travel Survey
Report # 10-013 | July 2010

Design and Collection of the NETI New England Travel Survey July 2010 Prepared by: Matthew Coogan, NETI Lucy Gibson, SMI Inc. Margaret Campbell, RSG, Inc. New England Transportation Institute 100 Railroad Way White River Junction, VT 05001 802 295 7499

Acknowledgements The original New England Transportation Survey was generously funded by Grant Agreement DTFH61-06-G-0008 between Federal Highway Administration and the New England Transportation Institute of White River Junction, Vermont, as mandated by the Safe, Accountable, Flexible, Efficient Transportation Equity Act of 2005. The costs of widening the scale of the survey activity to better serve the research needs of the University Vermont were generously funded by the UVM Transportation Research Center.
DisclaimerAny opinions or factual errors which might be contained in this document are the responsibility of its authors and not the funding agencies.

TableofContents
1. Background and Purpose ...................................................................................................................... 12. New England Transportation Survey Documentation .......................................................................... 1
2. a Approach ............................................................................................................................................ 12. b Survey Design .................................................................................................................................... 2
2. c Sampling Plan .................................................................................................................................... 42. d Survey Administration ....................................................................................................................... 5
3. Built Environment Analysis.................................................................................................................. 53. a Geographic Measures: Town and Neighborhood Level .................................................................... 6
3. b The Three D’s of Walkability ............................................................................................................ 6Neighborhood and town-wide Three D’s measures.............................................................................. 8
3. c Data Analysis Process ........................................................................................................................ 8
Geo-location of survey respondent residents ........................................................................................ 8Town-wide measures ............................................................................................................................ 9
Defining neighborhood area................................................................................................................ 10Smart Density: Determining population density in the neighborhood ............................................... 10
Refining the density measures using developed area rather than gross area ...................................... 10NETS Survey Built Environment Measures ....................................................................................... 12
The Population of Survey Respondents .............................................................................................. 13

ListofFiguresFigure 1 The post card “pre-notice” solicitation ........................................................................................... 2Figure 2 The cover page of the NETS .......................................................................................................... 3Figure 3 Example of a screenshot from the online survey............................................................................ 4Figure 4 Examples of rural land use patterns................................................................................................ 7Figure 5 Town-wide vs. school area districts ............................................................................................... 8Figure 6 Geographic distribution of survey respondents .............................................................................. 9
ListofTablesTable 1 List of Variables Included.............................................................................................................. 12Table 2 Respondents by census category.................................................................................................... 13Table 3 Respondents by self reported category .......................................................................................... 13Table 4 Respondents by transit supportiveness .......................................................................................... 14Table 5 Respondents by intersection density .............................................................................................. 14
AppendixA,theSurveyInstrument,followsafterpage14.

TRC Report # 10-013
Prepared by NETI, Smart Mobility, Inc., and RSG Inc Page 1
1. BackgroundandPurpose
The purpose of the New England Transportation Issues Study was to create a “portrait” of rural transportation patterns in the Northeast. Applying the concepts of both “mobility” and “accessibility,” the study explored the issue of “rural isolation,” and how perceptions of isolation differ given age and location of residence in rural versus suburban and urban areas. The study was undertaken by the New England Transportation Institute (NETI) in cooperation with the University of Vermont Transportation Research Center (UVM TRC.) The partnership between NETI and UVM TRC, as expressed in a Memorandum of Understanding in support of the research, allowed for the creation of a data resource of benefit to both institutions. In particular, the two groups determined that the information and data collected by each group will be jointly owned and available for both parties to use in current and future research. This includes education and advocacy for rural transportation planning issues.
NETI is conducting a multi-year research project that seeks to improve the understanding of rural isolation and levels of mobility in Vermont, New Hampshire, and Maine. It examines in some detail the potential for residents in isolated locations to move to a location nearer to traditional town centers, examines the constraints to such a change in location, and applies the logic of both “smart growth” and “livability” strategies to Northeastern rural states. The data collection described in this report is one part of the larger effort.
The survey draft was submitted to FHWA/ USDOT OST in January 2008, who approved its transmittal in February, 2008 to OMB, where it received final approval. The initially planned survey was to be conducted by mail and web. In working with the UVM team, it became clear that the initial scale of the proposed NETI survey effort would not be large enough to serve the more fine grained needs of the UVM research process, which would examine certain question (such as the effects of seasonality on travel). In response, the UVM and NETI agreed that UVM would contribute $60,000 to cover the cost of expanding the sampling, designing, executing, tabulating and analyzing the NETI rural mobility study and the processing of that survey, with NETI providing a parallel amount to serve as non-federal local share. In 2008, the UVM TRC submitted the research plan to the IRB process of the University, and has undertaken the project following the procedures established thereby.
This report documents the survey research process undertaken, and documents the format of the data describing the settlement patterns of the rural built environment developed as part of the NETI research program.
2. NewEnglandTransportationSurveyDocumentation2.aApproachIn the spring of 2009, NETI hired the Resource Systems Group Inc. (RSG) who conducted the New England Transportation Survey for residents of Maine, New Hampshire and Vermont. The work was originally commissioned by the New England Transportation Institute (NETI) under authorization from the Federal Highway Administration (FHWA).
During development of the survey, NETI began collaborating with the University of Vermont (UVM).

TRC Report # 10-013
Prepared by NETI, Smart Mobility, Inc., and RSG Inc Page 2
UVM was also researching transportation patterns and attitudes in Vermont and it was recognized that the two organizations could augment each other’s work. UVM provided additional funding for expanding the sample size to obtain additional responses from Vermont residents.
2.bSurveyDesignCooperating with NETI and UVM, RSG developed and implemented a survey questionnaire that gathered information from Maine, New Hampshire, and Vermont residents regarding their current travel behavior, attitudes towards the availability of various transportation services, and their perceptions of their ability to access locations important to their daily lives, including work, grocery stores, medical facilities, retail establishments, and recreational opportunities.
The survey queried respondents regarding their reasons for choosing their current home location, including the importance of various factors such as
• proximity to work, school, family, worship sites, recreational opportunities and other frequently visited locations
• perceived value of having space and separation from others • neighborhood type (walkability, crime rates or other disturbances.)
Figure1Thepostcard“pre‐notice”solicitation

TRC Report # 10-013
Prepared by NETI, Smart Mobility, Inc., and RSG Inc Page 3
Figure2ThecoverpageoftheNETS
The survey also included descriptive questions regarding the respondent’s type of home, owning/renting status, types of homes in the neighborhood, household size and ages, and number of vehicles available. The survey included questions regarding respondents’ self-perception of their ability to drive or to walk, and their perceptions of whether frequently visited sites such as work, school, retail locations, and medical services were too far away from their home or too difficult to access.
Respondents answered a series of questions about which transportation type (car/truck, walk, bike, taxi, bus, etc.) they typically use to access various locations, and how frequently they used each transportation type to make trips within the past month.
Finally, the survey queried respondents regarding their perceptions towards the possibility of residing in a
“Town Center,” which was described as a neighborhood with the following characteristics:
• Good sidewalks or walking paths • A mix of housing types including apartments and single family homes • Shopping for basic needs • A place to get something to eat • Access to community activities • Some form of bus service available • Whether it is as safe as where you live today
Respondents were asked about their likelihood of moving to a “Town Center” in the future and how this move might affect their future transportation behavior.
A series of standard demographic questions comprised the end of the survey.
When the survey was programmed into the web version and the paper layout completed, the surveys were

TRC Report # 10-013
Prepared by NETI, Smart Mobility, Inc., and RSG Inc Page 4
tested internally by RSG staff. Where necessary, changes were made to the wording of the surveys. Some instructions on the paper and web surveys were changed slightly based on feedback in order for respondents to better understand the instructions in the context of the survey method being used (e.g., instructing respondents to circle an answer makes sense on paper, but not on the web). RSG staff also reviewed the survey for flow to make sure the questions made sense in the order in which they were presented. Additionally, RSG staff tested the web survey to ensure that the correct data were being recorded and that it was being coded correctly.
2.cSamplingPlanThe sampling plan was designed to obtain a representative sample of residents less than 50 years old and those 50 years old or older residing in rural, suburban, and urban areas within each of the three states. Initially, a target sample of 800 across the three states was considered sufficient for the research purposes authorized under the FHWA grant.
When the collaboration with UVM was developed, the target sample was increased to 1200 to provide additional data from residents of the state of Vermont for UVM’s purposes. UVM anticipated using this additional data to augment a parallel research effort which is examining Vermont residents’ perceptions of the effect of seasonality on their transportation options and travel behavior. UVM provided funding for the additional costs incurred by this increase in sample size.
Figure3Exampleofascreenshotfromtheonlinesurvey

TRC Report # 10-013
Prepared by NETI, Smart Mobility, Inc., and RSG Inc Page 5
To develop the sampling plan, RSG used 2007 American Community Survey (ACS) data for the states of Maine, New Hampshire, and Vermont provided by the U.S. Census Bureau. For each state, the proportion of the population residing in rural, suburban, and urban areas was determined using the “% rural” statistic provided in the ACS data set. For the sampling plan purposes, zip codes identified as being 90 to 100% rural were classified as “rural”, zip codes identified as 20 to 89% rural were classified as “suburban”, and zip codes falling within 0 to 19% percent rural range were classified as “urban.” The ACS data set also provided the proportion of the population less than 50 years old and 50 years old or older.
Using these two sets of proportions (rural/suburban/urban and under 50/50 plus), target sample numbers were developed, and matched to the sets of zip codes representing rural, suburban and urban for each of the three states.
To calculate the number of households to survey, two assumptions were made: 1) a response rate of 10%, based on industry average survey response rates, and 2) an invalid address rate of 20%. Using these estimates, RSG determined that a total sample size of 15,000 would result in 1200 completed surveys.
2.dSurveyAdministrationThe survey approach employed a paper-based survey questionnaire with an option to complete the survey via the Internet using a computer-assisted self-interview (CASI) technique developed by RSG.
Potential respondents first received a postcard (Figure 1) in the mail informing them that they would be receiving the paper survey the following week. The postcard included instructions for completing the survey online using a unique password to access the online instrument.
A paper version of the survey (Figure 2) was then mailed to prospective respondents. The survey mailing included a prepaid business reply envelope for returning the survey to RSG, and a one dollar bill intended to express RSG’s appreciation for the respondent taking the time to complete the survey.
A total of 15,000 postcards and paper survey packets were mailed. Approximately 11% (1,600) surveys were returned due to invalid addresses. The response rate turned out to be much higher than the industry average: 3,767 surveys were completed, 952 via the Internet and 2815 returned via mail, resulting in a 28% response rate.
The completed paper surveys were scanned and entered into a database by Chicago- based Tab Service Company, and combined with the data obtained through the online survey instrument (Figure 3).
3. BuiltEnvironmentAnalysis
In order to complete the data collection process The New England Transportation Survey project included a series of studies to determine the optimum method by which to document the uniquely rural aspects of the settlement patterns in the three state study area. The survey asked wide ranging questions on rural mobility and accessibility, and attitudes about their community and residential location. In order to allow researchers to relate these responses to the community and neighborhood characteristics of the respondents, NETI hired Smart Mobility Inc. to develop geographic measures using existing Geographic Information Systems (GIS) data, and methodologies that have been used in transportation, urban planning, and public health research. This section of the Report describes the measures and the process

TRC Report # 10-013
Prepared by NETI, Smart Mobility, Inc., and RSG Inc Page 6
used to develop them. Several important, unique concepts that have been incorporated into these measures are discussed below.
3.aGeographicMeasures:TownandNeighborhoodLevelThe mobility and accessibility of the respondents is hypothesized to be influenced by both the community and municipality they live in (i.e. city or town), and the characteristics of their immediate neighborhood. The neighborhood represents the immediate environs around the subject’s home, i.e. the area within walking distance. The community includes their entire city or town, which have some uniformity of size in northern New England relative to other areas of the country. We have developed measures to describe both of these levels, as they will each influence transportation accessibility, mobility, behavior and perceptions.
The subject’s neighborhood was established as a 500 meter radius around their household location to represent areas with easy walking distance. Developing neighborhood measures required geolocating their residence from their street address, and using ArcGIS tools to establish a 500 meter buffer. The town-wide measures were determined from existing data that describe the city or town in which the subject resides.
3.bTheThreeD’sofWalkabilityMuch of the geographic data analysis was focused on determining the relative proximity or isolation from neighbors and services, and the general level of accessibility at both the neighborhood and community levels. In addition, characteristics of the street network were evaluated in terms of street connectivity, at both the neighborhood and community level. Together, these measures are often referred to as the “Three D’s: Density, Diversity and Design,”1 and have been widely used to describe transportation behavior. These are explained and defined for our purposes as follows:
1 Robert Cervero and Kara Kockelman, “Travel Demand and the 3 Ds: Density, Diversity, and Design,” Transportation Research: Transportation and Environment D, 2(3):199-219, 1997.

TRC Report # 10-013
Prepared by NETI, Smart Mobility, Inc., and RSG Inc Page 7
• Density is measured as the number of households per square mile. In our measures, we have further refined this to be number of households per square mile of developed land, to account the heterogeneity of rural areas, where there is often significant undeveloped land adjacent to their built up, higher density village areas.
• Diversity reflects the presence of a variety of land uses, including retail, services, civic institutions, etc. within close proximity. This is reflected by the job/housing balance within a community, using the ratio of households to employment. Due to limited availability of geographic data on employment, this measure cannot be determined at the neighborhood level.
• Design reflects the connectivity of the street network, which is closely associated with “walkability,” but also with general accessibility afforded by high levels of street connectivity. This is measured in terms of intersections per square mile of developed land.
Town of Swanton
Town of Georgia
Swanton Central Elementary School
Georgia Elementary School
Figure4Examplesofrurallandusepatterns

TRC Report # 10-013
Prepared by NETI, Smart Mobility, Inc., and RSG Inc Page 8
NeighborhoodandtownwideThreeD’smeasuresThe graphics included as Figure 4 show examples of maps created for a neighborhood analysis for two schools in Vermont, using the same methods for this study (we have not included maps of actual survey respondents to protect their confidentiality). These schools are located in the towns of Georgia and Swanton, Vermont, which share very similar town wide characteristics, such as total population, population density, etc. However, the land use patterns of each community are markedly different, as shown in the two maps below. Swanton has a dense, compact village center, where most of the population resides, and is surrounded by very rural farmland and natural areas. Georgia is also considered very rural, but has a more dispersed land use pattern, with no real “center” in the town. These differences are highlighted when looking at the specific neighborhoods of each town’s school, and are reflected in our neighborhood analysis of built environment measures. The second set of maps show the school neighborhoods, which are strikingly different in terms of the built environment.
Figure 5 compares the results of the neighborhood analysis (dark green) and the town-wide data (orange). In this case, these two towns have similar density from the scale of the entire town, which are both considered very rural. However, the school neighborhoods are quite different, and are reflected in the refined density calculations, which are explained later in this report. Both of these levels (town and neighborhood) are useful in describing the school environments, and we expect these two types of measures to be similarly useful in describing the residential location characteristics of the NETI survey respondents.
3.cDataAnalysisProcessSmart Mobility received data on survey respondents, including their password, address, city and state. For the respondents that provided street addresses, we developed geographic measures of the built environment with the following process.
GeolocationofsurveyrespondentresidentsThe first step in determining the geographic measures was to geo-locate the subject’s household. Of the total 3,767 survey responses received, 26 gave no street address, 6 had street addresses that were not locatable, and 105 had post office boxes, which were also not locatable. The remaining 3,630 subject households were located using the TransCAD US Street dataset, and the TransCAD address matching program. This was successful for locating 94% of these addresses, and the remaining had to be manually located using online mapping sources, such as Google Maps or local town maps that provide correct street names. Once initial locations were determined, these were reviewed to determine their accuracy. Many residence locations were adjusted to account for some error in the automatic geolocation results. For example, in some cases the TransCAD software clustered all of the residences on the same street in a
Figure5Town‐widevs.schoolareadistricts

TRC Report # 10-013
Prepared by NETI, Smart Mobility, Inc., and RSG Inc Page 9
single location. These were manually relocated in ArcGIS, after reviewing other sources, such as on-line mapping, to determine accurate street address locations. Additional error checking was conducted using techniques such as linking each household to the nearest street, and checking to see if the street names match.
TownwidemeasuresThe geolocated addresses allow us to accurately identify the city or town of their residence, which can often differ from the city or town of their mailing address. For example, some respondents live in very rural communities in Maine, but have mailing addresses from the nearest larger community. Therefore, it is important to determine the actual town of residence before determining basic measures of their built environment. Most of the town-wide built environment measures were determined using existing census and economic data sources, and are described in Table 1 later in this report.
Figure 6 shows the overall distribution of the survey households.
Figure6Geographicdistributionofsurveyrespondents

TRC Report # 10-013
Prepared by NETI, Smart Mobility, Inc., and RSG Inc Page 10
DefiningneighborhoodareaThe “neighborhood” for each respondent is defined as the area within 500 meters of their residence. This is a typical definition, and represents an area within easy walking distance. For each residence, a buffer area of 500 meter radius was established around each household to determine the geographic characteristics of their neighborhood, which could be quite different from the characteristics of their town overall.
SmartDensity:DeterminingpopulationdensityintheneighborhoodOnce neighborhood and developed area buffers were established with ArcGIS, we determined the population density of their immediate neighborhood using the “Smart Density” technique2. This involves overlaying the neighborhood area buffer (a circle of 500 meter radius) with census block population data. The graphics presented in Figure 7, using the same school locations as in the above examples (Swanton and Georgia), illustrate how census blocks can provide the more refined neighborhood density.
Swanton Elementary School Neighborhood Density
Georgia Central School Neighborhood Density
Figure7,CensusblockdataappliedtoGIS‐definedbuffer
RefiningthedensitymeasuresusingdevelopedarearatherthangrossareaThe calculation of land area in both the community and the neighborhood was refined to reflect what we have defined as the “developed area” of their neighborhood, in order to better measure characteristics of the built environment. The developed area is defined as land within 100 meters of a public roadway. The graphics below illustrate how most development (represented by the dots that are locations of buildings) lies within 100 meters of a roadway.
2 Owens PM, Titus-Ernstoff L, Gibson, L, Beach ML, Beauregard S, Dalton MA. Smart density: A more accurate method of measuring rural residential density for health-related research. International Journal of Health Geographics, 2010, 9:8. (doi:10.1186/1476-072X-9-8). http://www.ij‐healthgeographics.com/content/9/1/8.

TRC Report # 10-013
Prepared by NETI, Smart Mobility, Inc., and RSG Inc Page 11
Figure8Developmentalongroadways
The Smart Density technique basically determining the number of households in the neighborhood using census block data (pro-rated by area where necessary), and eliminates the undeveloped land from the denominator in the density calculation. The result provides a much improved and refined measures of the built environment for each respondent’s neighborhood.

TRC Report # 10-013
Prepared by NETI, Smart Mobility, Inc., and RSG Inc Page 12
NETSSurveyBuiltEnvironmentMeasures
Table 1 provides a list of the variables that are provided in the New England Transportation Survey data set.
Table1ListofVariablesIncluded
Description of Variables Included in Data Set
Unique respondent ID
Unique respondent password
City or town of residence
STF Identification number of subjects census block group (for purposes of matching additional demographic data)
# households/sq mi of subjects census block group (total block group area)
Variable indicating if the subjects house is located within 200 meters of an area designated by Census Bureau as an urban area or urban cluster
Distance in miles from geographic center of town to geographic center of nearest urban area, including urban areas in New York, Massachusetts and Maine.
Developed area in square miles of 500 meter neighborhood
Developed land area/total land area of 500 meter neighborhood
# households within 500 m neighborhood
Developed area of 500 m neighborhood in square miles
# households/sq mi of developed land within 500 m neighborhood
# intersections/sq mi of developed land within 500 m neighborhood
Developed area in square miles
Percent of land in the city or town that is within 100 meters of a public road.
2007 population estimate
2000 Occupied Housing Units
# persons/sq mi of developed land within each town
# households/sq mi of developed land within each town

TRC Report # 10-013
Prepared by NETI, Smart Mobility, Inc., and RSG Inc Page 13
# intersections/sq mi of developed land within each town
Variable indicating if any part of the town is designated by Census Bureau as an urban area, urban cluster, or rural area
Employment density in jobs/sq mile of developed area
Median household income from the 2000 Census
Ratio of employment/households
ThePopulationofSurveyRespondentsThe following sections are intended to help describe the general population of the survey respondents.
This table shows the number of respondents that were categorized by the US Census as living within an Urbanized Area (i.e. larger urban), an Urban Cluster (i.e. small urban area), or rural (neither of the above). Interestingly, this shows the study population relatively evenly distributed among these categories. The average household density of their household neighborhood is shown for each group as well.
Table2Respondentsbycensuscategory
UA/UC Description TotalBlockGroupHHDensity
null Rural 2102 134
UC UrbanCluster 688 714UA UrbanArea 758 5,485
Interestingly, the above measures differ substantially from the respondents own characterization of the type of area that they live in, from the survey response on “areas”. The following shows that the vast majority of respondents consider themselves living in a rural area.
Table3Respondentsbyselfreportedcategory
Typeofarea Count
AverageBGHHDensity
AverageNeighborhood
Density
Bigcity 66 2,547 2,574
Smallcity 501 6,492 1,691
Suburban 322 2,640 750
Ruraltownorvillage 1,288 330 455
Rural,outsideofatownorvillage 1,311 132 128
The geographic measures allow us to infer about the character of their neighborhood. While we do not have an exact measure of lot sizes for each respondent, we can estimate the prevailing lot sizes and residential density in their neighborhood, and compare to typical characterizations of likely successful

TRC Report # 10-013
Prepared by NETI, Smart Mobility, Inc., and RSG Inc Page 14
transit services. The following table breaks down the respondents by category of density, along the lines of appropriate or likely transit service availability.
Table4Respondentsbytransitsupportiveness
LandUseCharacteristics TransitImplicationsHouseholdsperSquareMileRange* Count
Rural/Exurban,3+acrelotrural Paratransitmarginal Lessthan200 1,763Semi‐rural,0.6to3acrelotsemi‐rural
Paratransitonly 200to1,200 1,256
SuburbanorVillagedensity(2to6unitsperacre)
LowerFrequencyFixedRouteBus
1,200to2,400 360
Walkable/Urbandensity(6to12units)
HighFrequencyFixedRouteBus
2,400to4,800 133
Over12unitsperacre PremiumBusorRail Over4,800 36* These ranges are adjusted to reflect the difference between gross density and net density, which reflects land not consumed by roads, utilities, etc. in urban areas.
Intersection density has been considered a simple way to measure the relative connectivity of the street network. While there are many other variables that can describe the “walkability” of an area, intersection density is the easiest to measure using available GIS data. The table below describes the survey population by categories of intersection density, using the recently published LEED-ND guidelines3
Table5Respondentsbyintersectiondensity
LEED‐NDCategory Description Count
BelowLEEDNDeligible Fewerthan90persquaremile 2,828MeetsMinimumLEEDNDeligibility Between90and144persquaremile 421
MeetsLEEDNDTarget Between144and300persquaremile 366Extrapointsforconnectivity Morethan300persquaremile 15
Not surprisingly, this data shows a predominantly rural population, mostly in neighborhoods that would be unlikely to be considered “walkable” by typical planning criteria.
AppendixA:TheSurveyInstrumentAttached to the next page of this Report is a copy of the survey instrument as administered.
3 US Green Building Council, LEED for Neighborhood Development. http://www.usgbc.org/DisplayPage.aspx?CMSPageID=148

NETI Rural Mobility Issues Survey
Appendix A – Survey
Questionnaire
July2010
DATA ANALYSIS SOLUTIONS

Resource Systems Group, Inc. NETI Rural Mobility Issues Survey – Appendix A July 2010 Page A1
TABLE OF CONTENTS
1.0 MOBILITY SURVEY .................................................................................... 2 1.1 Survey Questions ..................................................................................................................................... 2 1.1.1 Introduction and Instructions ............................................................................................................. 2 1.1.2 The Choice of Your Present Location .................................................................................................. 2 1.1.3 Your Current Situation ........................................................................................................................ 4 1.1.4 Your Current Neighborhood ............................................................................................................... 8 1.1.5 Current Trip Patterns ........................................................................................................................ 11 1.1.6 Considerations about Your Next Home Location .............................................................................. 15 1.1.7 Moving to a Location with More Mobility ........................................................................................ 17 1.1.8 Other Considerations ........................................................................................................................ 21 1.1.9 Final Questions ................................................................................................................................. 23

Resource Systems Group, Inc. NETI Rural Mobility Issues Survey – Appendix A July 2010 Page A2
1.0 MOBILITY SURVEY
1.1 Survey Questions Note: text in italics provides information for reviewers and programmers that will not be seen by respondents. Text in brackets <> is dynamically inserted based on responses to previous questions.
1.1.1 Introduction and Instructions Hello! Thank you for taking the time to participate in this important research study. This survey asks questions about:
• The features that led you to choose your current home location, and considerations
about the next home you might choose; • The types of transportation you and your family currently use, and • Your feelings about what kind of mobility you have now and will have over the coming
years.
Your answers and opinions will be of great value in understanding needs of households like yours and in planning improvements that address those needs. Participation in this survey is voluntary. Your answers will be kept strictly confidential and will NOT be associated with you in any way. Responses to these surveys will be analyzed by the New England Transportation Institute and the University of Vermont Transportation Research Center.
1.1.2 The Choice of Your Present Location 1. Did you receive your survey invitation at your primary residence, and not a "summer home" or
"second home"? Yes No

Resource Systems Group, Inc. NETI Rural Mobility Issues Survey – Appendix A July 2010 Page A3
2. How important were each of these considerations when you moved from your previous home to your present home?
3. Which of these phrases best describes you? I moved to this state because I wanted to live in a rural setting. I moved to this state because I had to, not because I chose to. I was raised in this state, and I stay here because I like it . I was raised in this state, and I stay here because I have little choice.

Resource Systems Group, Inc. NETI Rural Mobility Issues Survey – Appendix A July 2010 Page A4
If respondent chose answers one or two in question 3. 4. How many years ago did you move to this state?
Less than 1 year 1‐2 years 3‐10 years 11‐20 years 20 years or more
5. How long have you lived at your current home (primary residence) location?
Less than 1 year 1‐2 years 3‐10 years 11‐20 years 20 years or more
1.1.3 Your Current Situation 6. What type of residence is your primary residence?
House on working farmland or major open space A detached single‐family house (not on farmland or open space) Apartment, townhouse, condominium, multi‐family house (duplex) Dormitory or other institutional housing Other, please describe: _______________________________
If respondent chose a detached single family house in question 6. 7. Approximately what size is the lot on which your house is located?
Small Medium Large
8. Do you own or rent your current home?
Own Rent Other, please describe: _______________________________
9. What types of homes can be found within 1/3 mile of your current home location?
Please select all that apply. Detached single‐family homes Apartment buildings, townhouses, condominiums, multi‐family houses (duplexes) Other, please describe: _____________________________ None of these ‐ Only farmland or major open space within 1/3 mile
10. How many adults 18 years old or over, including yourself, are currently living in your home?
_________ yourself and any family members who are 18 or older _________other (non‐related) adults who are 18 or older

Resource Systems Group, Inc. NETI Rural Mobility Issues Survey – Appendix A July 2010 Page A5
11. How many children under the age of 18 are currently living in your home? _________ children under the age of 18 years
12. How many personal vehicles (cars, vans, SUV’s, trucks, motorcycles) does your household
currently own or lease? _________ personal vehicles
13. Are you limited, included self‐limited, in your ability to drive (either day or night) by any
physical condition? No Yes, limited in how often or how long I can drive Yes, my physical condition absolutely prevents me from driving
14. Are you limited from walking outside the home by any physical condition?
No Yes, limited in how often or how long I can walk Yes, my physical condition absolutely prevents me from walking
15. In which one of the following areas do you consider your current home to be?
Big city Small city Suburban Rural town or village Rural, outside of a town or village
16. Provide one answer for each row.
What is your one‐way commute distance to… …work? ______ miles Not Applicable …school? ______ miles Not Applicable What is the longest one‐way commute distance to work or school of anyone in your household? _____ miles Not Applicable
17. What is the approximate distance from your home to… ...the nearest store for basic needs like milk, bread, and coffee? ______ miles ...the place where you buy most of your groceries? ______ miles ...the place where you buy major retail items like clothing and appliances? ______ miles ...the medical facility or hospital that you would use in an emergency? ______ miles ...a place where you can eat or drink and have an enjoyable time in the evening? ______ miles

Resource Systems Group, Inc. NETI Rural Mobility Issues Survey – Appendix A July 2010 Page A6
18. Select one answer for each row.
• I feel that my distance to work is…
• I feel that my distance to school is…
• I feel that my distance to get basic food is…
• I feel that my distance to get groceries is…
• I feel that my distance to larger retail stores is…
• I feel that my distance to the hospital is…
Too long
Just right
Too short
19. What types of public transit are currently offered in your neighborhood? Please select all that apply.
Large bus Small bus Bus for special purposes, like medical or senior citizen service Other, please describe: ________________________________ No public transit currently available in my neighborhood
20. If all else were equal, where would you prefer to live?
Big city Small city Suburb Rural town or village Rural, outside of town or village
21. How many hours a day do you spend watching television?
hours per day I do not have access to television
How many hours a day do you spend playing video games or other games on a computer?
hours per day I do not have access to a computer
How many hours a day do you spend using the Internet or responding to emails, for work or personal responses?
hours per day I do not have access to the Internet

Resource Systems Group, Inc. NETI Rural Mobility Issues Survey – Appendix A July 2010 Page A7
22. Please select one answer for each row.
Statements are shown across two pages.
• Did you vote in the last Presidential election?
• Do you belong to any groups or social clubs in or near your community?
• Are you contemplating moving within the next five years?
• Did you work or volunteer for a candidate or party in the last Presidential election?
• Are you a licensed driver?
• Would you say you drive a lot less than you used to?
• Have you had a hunting or fishing license in the last two years?
• Does your household own a ‘second house?’
• In the past year, did you ever decide not to address a medical concern or keep an appointment because it was too difficult to get to the doctor or medical center?
Yes
No

Resource Systems Group, Inc. NETI Rural Mobility Issues Survey – Appendix A July 2010 Page A8
1.1.4 Your Current Neighborhood 23. How strongly do you agree or disagree with the following statements describing your current
home location?
• It is easy to get to a town center or other place of activity.
• I feel I know my neighbors extremely well.
• I feel safe when outside in my neighborhood.
• My home is conveniently located near to where I work or go to school.
• I can easily get to places where people gather, like community centers, libraries, or social clubs.
• I worry that it would be difficult to get help in case of an auto accident on my local roads.
• It is easy to get to a place to buy groceries near my home.
• I worry that, in the future, I will not be able to get to medical services from where I live now.
Strongly agree
Agree
Somewhat agree
Neither agree nor disagree
Somewhat disagree
Disagree
Strongly disagree
Don’t know or not applicable

Resource Systems Group, Inc. NETI Rural Mobility Issues Survey – Appendix A July 2010 Page A9
24. How strongly do you agree or disagree with the following statements describing your current home location?
• I have friends and relatives who could help me get where I need to go.
• Other people think my home and neighborhood are very nice.
• I like the feeling that I am physically isolated from other residents.
• Biking in my neighborhood is safe and enjoyable.
• My neighborhood has an adequate number of good sidewalks or walking paths.
• Having less money in my retirement account would tend to make it harder for me to move to a more densely settled area.
• I worry about how long it would take to get from my home to the hospital in an emergency.
• I feel safe in my home.
Strongly agree
Agree
Somewhat agree
Neither agree nor disagree
Somewhat disagree
Disagree
Strongly disagree
Don’t know or not applicable.

Resource Systems Group, Inc. NETI Rural Mobility Issues Survey – Appendix A July 2010 Page A10
25. How strongly do you agree or disagree with the following statements describing your current home location?
• Having less money in my retirement account might make it more important for me to move to a more densely settled area.
• I worry about how long it would take police and fire to get to my home.
• My home has adequate room for parking two or more cars.
• I live within walking distance of commercial activity, like stores and places where I can get coffee and other casual meals.
• To get to my home, I rely on dirt roads, or narrow, winding two lane roads.
• It is the government’s job to get me to the hospital, so I don’t worry about it.
Strongly agree
Agree
Somewhat agree
Neither agree nor disagree
Somewhat disagree
Disagree
Strongly disagree
Don’t know or not applicable.
26. Thinking about the area in which you live now…
• Overall, how satisfied are you with the area where you live?
• How satisfied are you with your ability to get where you need to go in a reasonable amount of time?
• How satisfied are you with the potential for economic advancement (good jobs) in this area?
• Overall, how satisfied are you with staying in your area, compared to moving to a more urban area?
Completely satisfied
Satisfied
Somewhat satisfied
Neither
Somewhat unsatisfied
Unsatisfied
Completely unsatisfied

Resource Systems Group, Inc. NETI Rural Mobility Issues Survey – Appendix A July 2010 Page A11
1.1.5 Current Trip Patterns 27. Thinking about the last few weeks, approximately how many hours per week did you spend on
each of these activities? Enter “0” if you do not do these activities.
Walking, jogging, or running for exercise, pleasure, or to walk the dog ____hours per week Biking for exercise or pleasure ____hours per week Exercising at a gym, fitness class, or health club ____hours per week Other physical activity, such as hiking, climbing, or kayaking ____hours per week Eating at fast food restaurants ____hours per week Eating at sit‐in restaurants ____hours per week Attending non‐work meetings, movies, plays, or concerts ____hours per week
28. For each trip purpose below, please indicate the transportation type (e.g., car or bus) that you
use most often. Select one answer for each row.
• To go food shopping
• Go shopping for non‐food items
• To go to the doctor
• To go to a restaurant, bar, or out for entertainment
• To go to a park or recreation area
• To see family
• To see friends
• To attend church/worship
Car or truck
Walk
Bike
Taxi
Bus
Other
Not applicable

Resource Systems Group, Inc. NETI Rural Mobility Issues Survey – Appendix A July 2010 Page A12
29. Which type of transportation do the children in your household take to school most often? School Bus Car or truck Walk Bike Taxi Other
30. For each trip purpose listed below, please indicate how often you used CAR, TRUCK,
MOTORCYCLE, OR BUS in the last month. Select one answer for each row.
• To go to work
• To go to school
• To go food shopping
• Go shopping for non‐food items
• To go to the doctor
• To go to a restaurant, bar, or out for entertainment
• To go to a park or recreation area
• To see family
• To see friends
• To attend church/worship
Daily
2 to 5 times per week
Once per week
Several times last month
Once last month
Never in the last month

Resource Systems Group, Inc. NETI Rural Mobility Issues Survey – Appendix A July 2010 Page A13
31. For each trip purpose listed below, please indicate how often you WALKED in the last month. Select one answer for each row.
• To go to work
• To go to school
• To go food shopping
• Go shopping for non‐food items
• To go to the doctor
• To go to a restaurant, bar, or out for entertainment
• To go to a park or recreation area
• To see family
• To see friends
• To attend church/worship
Daily
2 to 5 times per week
Once per week
Several times last month
Once last month
Never in the last month
Resource Systems Group, Inc. NETI Rural Mobility Issues Survey – Appendix A July 2010 Page A14
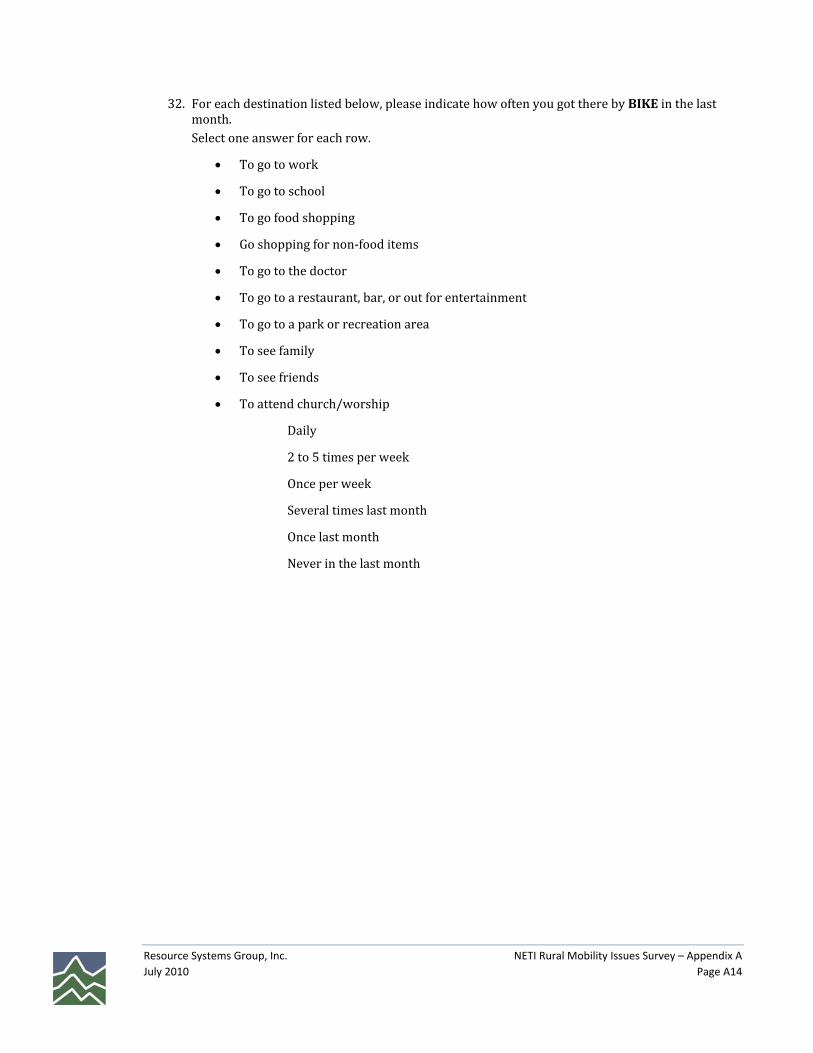
32. For each destination listed below, please indicate how often you got there by BIKE in the last month. Select one answer for each row.
• To go to work
• To go to school
• To go food shopping
• Go shopping for non‐food items
• To go to the doctor
• To go to a restaurant, bar, or out for entertainment
• To go to a park or recreation area
• To see family
• To see friends
• To attend church/worship
Daily
2 to 5 times per week
Once per week
Several times last month
Once last month
Never in the last month

Resource Systems Group, Inc. NETI Rural Mobility Issues Survey – Appendix A July 2010 Page A15
1.1.6 Considerations about Your Next Home Location 33. When you think of what you would want in your next home location, how important is…?
Select one answer for each row.
• Having an adequate number of sidewalks or walking paths in good, safe condition
• Having a place to do my shopping reasonably near my home
• Having a large lot with plenty of space
• Having a feeling of privacy from other people
• Having adequate room for parking two or more cars
• Having a safe and enjoyable place to ride a bike
• Being close to outdoor recreational areas
Extremely important
Important
Somewhat important
Neither
Somewhat unimportant
Unimportant
Extremely unimportant

Resource Systems Group, Inc. NETI Rural Mobility Issues Survey – Appendix A July 2010 Page A16
34. Please tell us how desirable the following things would be in the choice of your next neighborhood. Select one answer for each row.
• For me, the idea of moving away to a less rural state is…
• For me, to be able to take public transportation or carpool to work or for other trips would be…
• For my household to get along with fewer cars would be…
• For me to live closer to my job, and drive less, would be…
• For me, to live in less living space would be…
• For me, living in a neighborhood where I could exercise by walking or bicycling would be…
Extremely desirable
Desirable
Somewhat desirable
Neither
Somewhat undesirable
Undesirable
Extremely undesirable

Resource Systems Group, Inc. NETI Rural Mobility Issues Survey – Appendix A July 2010 Page A17
35. Please tell us how desirable the following things would be in the choice of your next neighborhood. Select one answer for each row.
• For me, having neighbors close by and making friends with neighbors would be…
• For me, to always have friends and relatives who can take me places would be…
• For me, having access to places where people meet and gather would be…
• For me, to live within walking distance of a town or village center with basic stores would be…
• For me, to live in a place where it was easier to get to essential medical services would be…
Extremely desirable
Desirable
Somewhat desirable
Neither
Somewhat undesirable
Undesirable
Extremely undesirable
1.1.7 Moving to a Location with More Mobility We are interested in your thoughts and opinions about moving to (or staying in) a particular type of neighborhood.
This type of neighborhood is in a rural state. It might be a neighborhood in a small town, or a neighborhood in a city like Burlington, VT, Manchester, NH, or Portland, ME. For the purposes of this survey, we will call this type of neighborhood a "Town Center." The "Town Center" has:
• Good sidewalks or walking paths; • A mix of housing types including apartments and single family homes; • Shopping for basic needs; • A place to get something to eat; • Access to community activities; • Some form of bus service available; • And it is as safe as where you live today.
Please answer each of the following questions by selecting the answer that best describes your opinion. Some of the questions may appear to be similar, but they do address somewhat different issues. Please read each question carefully.

Resource Systems Group, Inc. NETI Rural Mobility Issues Survey – Appendix A July 2010 Page A18
36. How true are the following statements? Select one answer for each row.
• The cost of housing makes it difficult to move closer to my work or school.
• I am confident that if I wanted to I could move to a Town Center in the next five years.
• I would like to live closer to my work or school.
• Most of the people who are important to me live or would like to live in a Town Center.
• Most people whose opinions I value would approve of me moving to a Town Center in the next five years.
• In the coming year, I would like to try to drive less and use less gasoline.
• I intend to move to a less isolated area in the next five years.
Definitely true
True
Somewhat true
Neither
Somewhat false
False
Definitely false

Resource Systems Group, Inc. NETI Rural Mobility Issues Survey – Appendix A July 2010 Page A19
37. How true are the following statements? Select one answer for each row.

Resource Systems Group, Inc. NETI Rural Mobility Issues Survey – Appendix A July 2010 Page A20
38. How likely are the following? Select one answer for each row.
• How likely is it that you could get by with less living space in the coming year if you were to move to a Town Center?
• How likely is it that people who are important to you think that you should move to a Town Center?
• How likely is it that you could get by with fewer household cars in the coming year if you were to move to a Town Center?
• I plan to move to a Town Center in the next five years?
• How likely is it that you could find an affordable home in or near a Town Center?
Very likely
Likely
Somewhat likely
Neither
Somewhat unlikely
Unlikely
Very unlikely
39. Select one answer for each row.
• For me to move to a Town Center in the next five years would be…
• For me to move to a somewhat less isolated area in the next five years would be…
• I will make an effort to move to a Town Center in the next five years.
1 Extremely undesirable
2
3
4 Neutral
5
6
7 Extremely desirable
Resource Systems Group, Inc. NETI Rural Mobility Issues Survey – Appendix A July 2010 Page A21
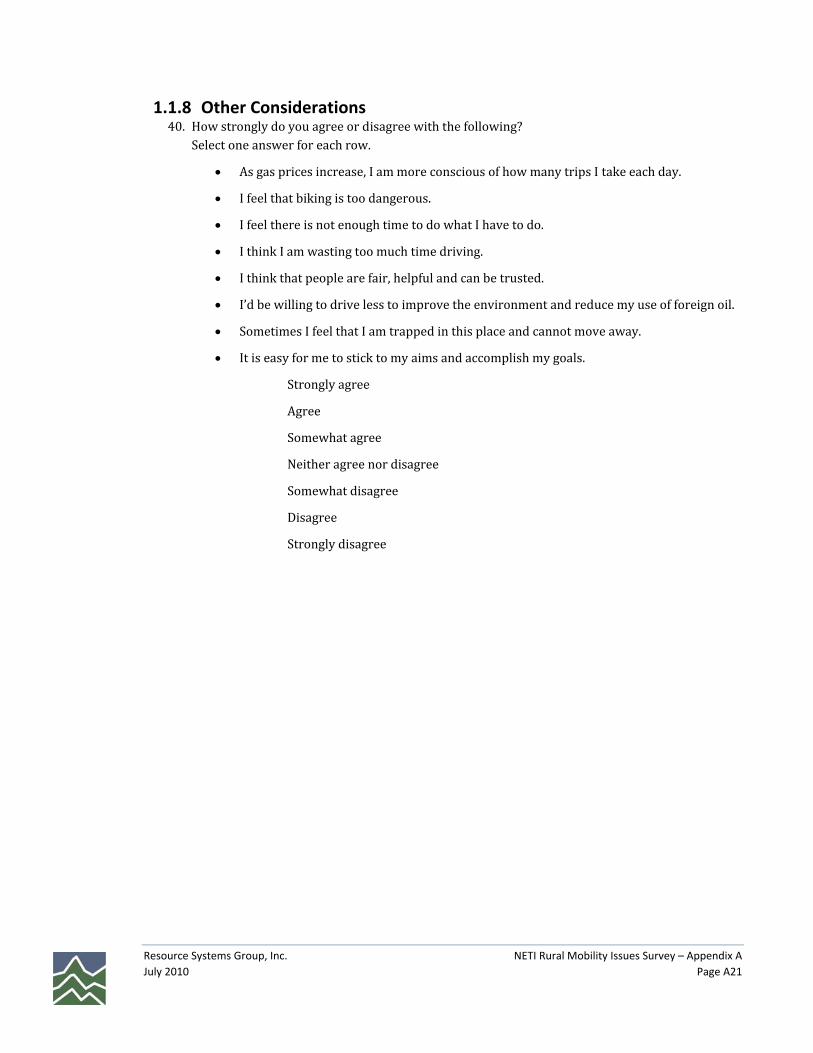
1.1.8 Other Considerations 40. How strongly do you agree or disagree with the following?
Select one answer for each row.
• As gas prices increase, I am more conscious of how many trips I take each day.
• I feel that biking is too dangerous.
• I feel there is not enough time to do what I have to do.
• I think I am wasting too much time driving.
• I think that people are fair, helpful and can be trusted.
• I’d be willing to drive less to improve the environment and reduce my use of foreign oil.
• Sometimes I feel that I am trapped in this place and cannot move away.
• It is easy for me to stick to my aims and accomplish my goals.
Strongly agree
Agree
Somewhat agree
Neither agree nor disagree
Somewhat disagree
Disagree
Strongly disagree

Resource Systems Group, Inc. NETI Rural Mobility Issues Survey – Appendix A July 2010 Page A22
41. How strongly do you agree or disagree with the following? Select one answer for each row.
• Carbon emissions from driving my vehicle contribute to climate change.
• I love the freedom and independence that owning several cars provides for my household.
• I can usually handle whatever comes my way.
• It would be hard for me to reduce my auto mileage and use of gasoline.
• I can solve most of the problems facing me if I invest the necessary effort.
• I think there is more chance for economic advancement in a more urban state.
• I really enjoy driving and don’t want to reduce the amount I drive.
• I need to drive my car to get where I need to go.
• I think I should spend more time walking, just to be healthier.
Strongly agree
Agree
Somewhat agree
Neither agree nor disagree
Somewhat disagree
Disagree
Strongly disagree
42. I the last ten years, how many traffic tickets for moving traffic offenses (i.e., excluding parking tickets) have you received as a driver?
None One Two Three Four Five or more

Resource Systems Group, Inc. NETI Rural Mobility Issues Survey – Appendix A July 2010 Page A23
1.1.9 Final Questions 43. What is your age?
_____ years
44. What is your highest completed education level? Less than high school diploma High school diploma or equivalency Some college, no degree Associate’s degree Bachelor’s degree Graduate or professional degree
45. What is your marital status?
Single Married or with partner Separated, divorced or widowed
46. What is your gender?
Male Female
47. What is your employment status?
Employed full‐time Employed part‐time Self‐employed Student Student and employed Retired Homemaker or stay‐at‐home‐parent Not currently employed
48. In what industry are you currently employed?
Agriculture, farming, forestry, mining Construction, carpentry Manufacturing/transportation Professional assistant/administrative Professional services/managerial Sales, retail Education Other

Resource Systems Group, Inc. NETI Rural Mobility Issues Survey – Appendix A July 2010 Page A24
49. What is your annual household income? If you are unsure of the answer, please give your best estimate.
Under $25,000 $25,000 ‐ $49,999 $50,000 ‐ $74,999 $75,000 ‐ $99,999 $100,000 ‐ $149,999 $150,000 ‐ $199,999 $200,000 ‐ $249,999 $250,000 or more
1. What is your height? (If you do not know exactly, please give your best estimate)
______ feet ______ inches
50. Do you weigh less than, equal to, or more than <insert maximum “normal” BMI weight> pounds? Less than XX lbs. Equal to XX lbs. More than XX lbs.
Thanks for your help in this important project. Your cooperation will help to improve the understanding of the transportation needs of citizens of the Northeast!