design and calibration of a tem stripline for...
TRANSCRIPT
DESIGN AND CALIBRATION OF A TEM STRIPLINE FOR ELECTROMAGNETIC
COMPATIBILITY TESTING
A Thesis Submitted to the Graduate School of Engineering and Sciences of
İzmir Institute of Technology in Partial Fulfillment of the Requirements for the Degree of
MASTER OF SCIENCE
in Electrical and Electronics Engineering
by Sezgin HİLAVİN
December 2011 İZMİR

We approve the thesis of Sezgin HİLAVİN
Assoc. Prof. Dr. Alp KUŞTEPELİ Supervisor
Assist. Prof. Dr. A. Sevinç AYDINLIK BECHTELER Committee Member
Assist. Prof. Dr. A. Haluk NALBANTOĞLU Committee Member
19 December 2011
Prof. Dr. Ferit Acar SAVACI Prof. Dr. R. Tuğrul SENGER Head of the Department of Dean of the Graduate School of Electrical and Electronics Engineering Engineering and Sciences

ACKNOWLEDGEMENTS
Firstly, I would like to express my sincere gratitude to my advisor Assoc. Prof.
Dr. Alp Kuştepeli for his constant support and guidance in the construction of the
original idea of this dissertation and for his efforts to improve my theoretical
background.
I would like to thank to my company VESTEL Electronics for opportunity to
improve original idea, chance to realize theoretical knowledge and put assertions into
real life and my colleagues for their help and fruitful cooperation. I have both privileged
and fortunate to have had such colleagues.
And finally, I would like to thank to my family for their great support and
understanding.

iv
ABSTRACT
DESIGN AND CALIBRATION OF A TEM STRIPLINE FOR ELECTROMAGNETIC COMPATIBILITY TESTING
Electrical products are used in every aspect of our lives. Every electrically
device has the potential of causing unintentional interference to other electrical devices.
All unwanted currents or voltages that may arise in a system generate electrical noise.
All kinds of unexpected radio-frequency (RF) energy produce this kind of noise.
The term Electromagnetic Interference –EMI – describes the situation that
electrical noise destroys the functionality of systems. Therefore, emissions and
immunity tests have to be performed according to the harmonized European norms like
EN55020 standard.
In this thesis, immunity to radiated fields testing will introduce and the basic
requirements of the suggested test site which is a TEM stripline will also be mentioned.
Stripline is a transmission line construction which provides a uniform electromagnetic
field between its parallel plates. Radiated immunity can be defined as the product’s
ability to withstand EM energy that arrives via free-space propagation for its
functionality.
Design of a new TEM stripline for EMC testing is given in order to construct an
alternative test site, a new stripline bigger than the one given by the standard was built.
Main attention has been focused on the design parameters (characteristic impedance,
field uniformity etc.) and calibration of the designed stripline. Defined stripline in the
standard has 80 cm height but it is not sufficient for big equipments under test (EUTs).
Then an alternative stripline can be used if it fulfills the specifications required by the
standard.

v
ÖZET
ELEKTROMANYETİK UYUMLULUK TESTLERİ İÇİN TEM ŞERİTHAT TASARIMI VE KALİBRASYONU
Günlük yaşantımızın her alanında elektrikli ürünleri kullanırız. Her elektrikli
cihazın bir başka cihazla istenmeyen bir girişime sahip olma potansiyeli vardır. Bir
sistem içinde istenmeyen akım ve voltajların üretilmesi ile elektriksel gürültü işareti
üretilebilir. Beklenmeyen radyo frekans (RF) enerjileri bu tür gürültü işaretlerini üretir.
Elektromanyetik girişim terimi –EMI- elektriksel gürültünün bir sistemin
fonksiyonlarını bozmasını tanımlar. Bu yüzden EN55020 standardı gibi Avrupa
Normlarına göre yayılım ve bağışıklık testlerinin yapılması gerekir.
Bu tezde, ışınımla bağışıklık testi açıklanacak ve bu test için standartta önerilen
test sahası olan TEM şerithat yapısının temel gerekliliklerinden bahsedilecektir. Şerithat
paralel iki plakası arasında düzgün elektromanyetik alan sağlayabilen bir iletim hattıdır.
Işınımla yayılım testinde ölçülen bir ürünün boşlukta yayılan elektromanyetik enerjiye
karşı koyabilmesiyle fonksiyonlarını istendiği gibi sürdürüp sürdüremediğidir.
Bu testte kullanılmak üzere alternatif bir test sahası oluşturabilmek için yeni bir
TEM şerithat tasarımı yapılmıştır. Bu şerithat standardın önerdiği yapıdan daha büyük
olarak tasarlanmıştır. Temel olarak dikkate alınan tasarım parametreleri (karakteristik
empedans, alan düzgünlüğü gibi) ve şerithattın kalibrasyonudur. Standartta önerilen
stripline 80 cm yüksekliğe sahiptir ancak test edilecek daha büyük cihazlar için bu
yükseklik yeterli değildir. Alternatif başka bir şerithat yapısı standartta belirtilen
gereklilikleri karşılamak kaydıyla kullanılabilir.

vi
TABLE OF CONTENTS
LIST OF FIGURES ....................................................................................................... viii
LIST OF TABLES ............................................................................................................ x
CHAPTER 1. INTRODUCTION .................................................................................. 1
CHAPTER 2. MEASUREMENT .................................................................................. 5
2.1. Application of the Test ............................................................................ 7
2.2. Measurement Setup ................................................................................. 8
2.3. Measurement Procedure .......................................................................... 9
2.4. Performance Criteria ............................................................................. 11
2.4.1. Measurement Procedure for Audio Assessment ............................. 12
2.4.2. Audio Power Output Measurement ................................................ 12
2.4.3. Measurement Procedure for Video Assessment ............................. 14
2.5. Radiated Field Immunity for Large Equipment
Not Fitting in the Open Strip Line ....................................................... 15
CHAPTER 3. STRIPLINE DESIGN ........................................................................... 17
3.1. Line Impedance ..................................................................................... 19
3.2. Cutoff Frequency .................................................................................. 22
3.3. Design Verification and Calibration ..................................................... 23
3.4. Field Uniformity ................................................................................... 29
3.5. Higher Order Modes ............................................................................. 32
3.6. TEM Mode Verification ....................................................................... 33
3.7. Test Volume and Maximum EUT Size ................................................. 34
3.7.1. Validation of Usable Test Volume ................................................. 35
3.7.2. Field Uniformity and TEM Mode Measurement Procedure ........... 36
3.8. Field Uniformity Criteria ...................................................................... 38
3.9. Efficiency of TEM Stripline in Terms of VSWR ................................. 40

vii
3.10. Design of Bigger Stripline .................................................................. 41
CHAPTER 4. SITE VALIDATION AND COMPARISON TEST ............................. 47
4.1. Validation of the Test Site .................................................................... 48
4.2. TV Comparison Tests ........................................................................... 54
CHAPTER 5. CONCLUSION ..................................................................................... 56
REFERENCES .............................................................................................................. 59
APPENDICES
APPENDIX A. SUBCLAUSE 5.8 OF EN55020: MEASUREMENT OF
IMMUNITY FROM RADIATED FIELDS ......................................... 63
APPENDIX B. ANNEX E OF EN 55020: CONSTRUCTION INFORMATION
FOR THE OPEN STRIPLINE ............................................................. 67
APPENDIX C. ANNEX F OF EN55020: CALIBRATION OF THE
OPEN STRIPLINE ............................................................................... 71
APPENDIX D. SUBCLAUSE 5.2 OF EN55020: PERFORMANCE
ASSESSMENT ..................................................................................... 75

viii
LIST OF FIGURES
Figure Page
Figure 1. 1. Open stripline TEM device, basic configuration with matching
network and terminating impedance ............................................................ 2
Figure 1. 2. Test sites for radiated immunity testing (a) IEC 61000-4-3 alternative
way for the EUTs not fitted in the stripline. (b) EN55020 stripline ............ 3
Figure 2. 1. Electromagnetic disturbance of the devices .................................................. 5
Figure 2. 2. Typical open two-plate stripline with E field shown .................................... 6
Figure 2. 3. Overview of an open stripline TEM device .................................................. 7
Figure 2. 4. Circuit arrangement for calibration of the measuring set-up ....................... 8
Figure 2. 6. Measurement of the immunity of broadcast receivers from radiated fields
in the frequency range 0.15 MHz to 150 MHz in an open stripline .......... 10
Figure 2. 7. Audio power test setup ............................................................................... 13
Figure 3. 1. Dimensions of EN55020 Stripline .............................................................. 18
Figure 3. 2. Microstrip line ............................................................................................. 20
Figure 3. 3. Block diagram of the stripline testing system ............................................. 22
Figure 3. 4. Circuit arrangement for calibration of the measuring set-up ...................... 23
Figure 3. 5. Calibration curve for suggested stripline in EN55020 ................................ 24
Figure 3. 6. Arrangement of the measuring apparatus .................................................... 25
Figure 3. 7. Matching network ........................................................................................ 28
Figure 3. 8. Termination Impedance (TI) ....................................................................... 28
Figure 3. 9. The fringing fields at the edges of a two-plate open stripline ..................... 29
Figure 3. 10. Illustration of the interference sources at the intersection
of tapered and parallel regions .................................................................... 30
Figure 3. 11. Usable test volume .................................................................................... 36
Figure 3. 12. EMC32 software arrangement for verification ......................................... 39
Figure 3. 13. Geometrical design in EMC Studio ........................................................... 42
Figure 3. 14. Field and voltage probe inserted in mesh mode view ............................... 42
Figure 3. 15. Side view of absorber loaded stripline ...................................................... 43
Figure 3. 16. Top view of absorber loaded stripline ....................................................... 43
Figure 3. 17. Complex permeability and permittivity of pyramidal ferrite absorber ..... 44
Figure 3. 18. Field probes with numbers for field uniformity simulation ...................... 44

ix
Figure 3. 19. Difference of field strengths in plane 1 (a) and in plane 2 (b) .................. 45
Figure 3. 20. VSWR vs frequency obtained from simulation ........................................ 46
Figure 4. 1. New TEM stripline ...................................................................................... 47
Figure 4. 2. Wooden stands with pyramidal absorbers ................................................... 48
Figure 4. 3. Wooden stands covered with ferrite tiles .................................................... 48
Figure 4. 4. Nominal plate voltage vs frequency for big stripline .................................. 49
Figure 4. 5. Field uniformity measurement .................................................................... 50
Figure 4. 6. Field uniformity points ............................................................................... 50
Figure 4. 7. Field uniformity deviations for whole frequency band for plane1 .............. 51
Figure 4. 8. Field uniformity deviations for whole frequency band for plane2 .............. 51
Figure 4. 9. Measurement of network analyzer .............................................................. 52
Figure 4. 10. Impedance of the whole system ................................................................ 52
Figure 4. 11. VSWR of the whole system ...................................................................... 53
Figure 4. 12. S11 of the whole system ............................................................................ 53
Figure 4. 13. Testing of same TV set in the new (a) and EN55020 stripline setup (b) .. 54
Figure 4. 14. EN55020 stripline test results for 32” TFT LCD product ......................... 55
Figure 4. 15. New TEM stripline test results for 32” TFT LCD product ....................... 55

x
LIST OF TABLES
Table Page
Table 2. 1. Measurement conditions for the test of immunity from radiated fields ....... 11
Table 2. 2. Limits of immunity to radiated fields test for TV sets in EN55020 ............. 16
Table 3. 1. Values K for expand uncertainty with normal distribution .......................... 38

1
CHAPTER 1
INTRODUCTION
CE marking on a product is the manufacturer's declaration that the product
complies with the essential requirements of the relevant European health, safety and
environmental protection legislations; in practice by the product directives. Product
directives contain the essential requirements and/or performance levels and harmonized
standards to which the products must conform.
Harmonized Standards are the technical specifications (European Standards or
Harmonization Documents) which are established by several European standard
agencies like European Committee for Standardization, European Committee for
Electrotechnical Standardization (CENELEC), etc.
Since the compatibility of the electronic devices in various electromagnetic
environments has become an important issue in recent years. One of the typical tests
performed during CE marking procedure is Electromagnetic Compatibility (EMC)
testing.
An electrical product must work as intended in its environment. It must not
generate electromagnetic disturbance which may influence the other products. Therefore
EMC deals with the problems of noise emission and/or noise immunity.
EMC stands for Electromagnetic Compatibility. The EMC Directive
89/336/EEC became mandatory on January 1, 1996. European Union (EU) defined
EMC as the ability of a device, unit or equipment, or system to function satisfactorily in
its electromagnetic environment without introducing intolerable electromagnetic
disturbances to any devices in that environment. This encompasses both immunity to
outside noise (function satisfactorily), and emission of noise (without introducing
intolerable disturbances).
Electromagnetic compatibility standards are divided into two areas which are
immunity and emission measurements. EN55020 published by CENELEC is the
standard of immunity measurements for audio and video products [1].
Immunity can be defined as the ability of an equipment to maintain a specified
performance when it is subjected to disturbance (unwanted) signals of specified levels.

2
Clause 5.8 of the EN55020, given in Appendix A, describes the setup for
measurement of immunity from radiated fields. An open Transverse Electro Magnetic
(TEM) stripline is specified in this standard for the test setup.
A stripline consists of two parallel conducting plates, with a voltage applied at
one end and the other end terminated with the conductor’s characteristic impedance as
shown in Figure 1.1. The stripline has to be operated in screened rooms to protect the
environment from the electromagnetic radiation generated by open stripline.
The constructional details of a suitable open stripline are given in Annex E of
EN55020 given in Appendix B. The open stripline has a frequency range usable up to
150 MHz and the characteristic impedance of the stripline is 150 Ω. The stripline whose
dimensions are given in the standard can only be used to test equipment up to 0.7 m
height. Equipment under test (EUT) might be higher than 0.7 m and cannot be tested in
this suggested open stripline. For example, a 47” flat panel display television has about
1 m height.
In this work, a TEM stripline which has a different dimension than the given in
the standard is designed, constructed and its performance is investigated.
Figure 1. 1. Open stripline TEM device, basic configuration with matching network and terminating impedance
The standard allows the use of TEM devices of other dimensions or types, if it is
shown that the results do not differ by more than 2 dB from the values measured in the
recommended stripline in the relevant frequency range.
The size of thin film transistor liquid crystal display television (TFT LCD TV)
sets is getting larger day by day. For instance a 47” TFT LCD product has a height of

3
100 cm. For this reason, suggested stripline in EN55020 is not a suitable test facility for
many TV sets anymore. EN55020 standard suggests a fully anechoic room as
alternative of the standard stripline for the testing of such big EUTs.
Clause 5.8.4 of EN55020, given in Appendix A, explains the field immunity test
for large equipment not fitting in the open stripline. In this case, the equipment can be
tested according to the standard IEC 61000-4-3 in the frequency range 80 MHz to 150
MHz [2]. This measurement is performed in a Fully Anechoic Room (FAR) based on
the radiated immunity testing in IEC 61000-4-3 as shown in Figure 1. 2.
In literature, there are some work on comparison between the open stripline
(OSL) and FAR measurements. One of them is Round Robin Test which is used to
clarify the test setup for a large EUT not fitting in the OSL. The work shows that there
is 9 dB difference between FAR and OSL and implies the need for an alternative test
site [3].
(a) (b)
Figure 1. 2. Test sites for radiated immunity testing (a) IEC 61000-4-3 alternative way
for the EUTs not fitted in the stripline. (b) EN55020 stripline
EUTs which are higher than 70 cm can be tested in a FAR but there are some
important issues that must be taken into account during testing.
Disadvantages of FAR are
• Calibration is difficult and only made in 16 points of testing area with spaces
of 0.5 m between points.
• Uniformity is lower (max 6 dB deviation allowed) so uncertainty is higher.

4
• High power is required.
• The broadband antennas cause more reflected power (high VSWR).
• Camera is used for monitoring so deviations can occur on test results.ç
• Frequency range of 150 KHz-150 MHz cannot be covered completely; test
can be performed only in the range of 80 MHz – 150 MHz.
Advantages of stripline are:
• Uniformity is higher (lower than 6 dB available).
• TEM mode is available.
• Calibration is easier (EUT is included for K factor correction for each test).
• Frequency range can be covered completely (150 KHz-150 MHz).
• The required power for the test will be significantly less.
In this thesis, a new stripline test facility is designed in order to be used for
bigger TFT LCD TV products.
Some additional benefits of using a stripline are pointed below:
• This new stripline can be used for all available sizes of EUTs, which makes
the test more stable and repeatable for the EUTs.
• Saves the setup arrangement time, which will reduce the testing time.
• Covers the required frequency range.
• Requires less power and have a lower VSWR.
• Not occupies the anechoic chamber anymore for this testing. So the chamber
can be used for emission testing and modification work.
• Gives more information about the immunity of the EUT to the radiated fields
generated by nearby devices.

5
CHAPTER 2
MEASUREMENT
Disturbance signal is an unwanted signal which may degrade radio reception of
receiver equipment or may cause malfunction in the equipment. Specific unwanted
signals are simulated disturbance signals. They are generated under laboratory
conditions for testing purpose.
The disturbance signal can be in the form of conducted interference or radiated
interference for other products as in Figure 2.1.
Figure 2. 1. Electromagnetic disturbance of the devices
In this thesis, the radiated interferences coming from nearby products are
considered. These disturbance signals can be simulated in special structures called
stripline. A transverse electromagnetic (TEM) cell was first described by M. L.
Crawford in 1974 [4]. TEM cells are frequently used for susceptibility measurements in
EMC testing. Even there are some specific researches for the purpose of determining
the emission levels of integrated circuits by using TEM cell measurements [5], [6]. A
parallel stripline for testing RF susceptibility was investigated by several researchers
[7], [8]. The uncertainty in the generation of standard fields in TEM cells is usually
specified as ±0.5 dB. A TEM cell operates from DC (0 Hz) to a cut-off frequency
which is determined by the dimensions of the cell.

6
A stripline consists of central rectangular parts and two tapered parts which end
in connectors without conducting side walls. The frequency limitation of the
configuration is caused by the transitions between the rectangular and the tapered parts.
At these transitions, which are discontinuities, higher order modes can be easily excited.
This disturbs a pure TEM wave propagation. However, at frequencies below the onset
of the first resonance, the TEM cell is capable of creating fields that are calculable with
low uncertainties from the power given to the cell.
A stripline is essentially a transmission line which forms an electromagnetic
field between the plates. The mode of propagation is in the form of a TEM wave i.e. a
wave which possesses single electric and magnetic field components, transverse to the
direction of propagation, as in the case of propagation in free-space. A homogeneous
electromagnetic wave under free space conditions can be simulated by a guided wave of
the TEM mode, travelling between two flat conducting surfaces. In this case the electric
field component is perpendicular and the magnetic field component parallel to the
conductors. Stripline test facilities, therefore, are transmission lines constructed with
their plates separated sufficiently for a EUT to put between them. The polarization of
the electric field vector is shown in Figure 2. 2.
Figure 2. 2. Typical open two-plate stripline with E field shown
For open stripline structures, some leakage fields radiate beyond the physical
extent of the plates from open sides since two sides are not enclosed by metal. For this
reason, the field strength and the field uniformity inside the stripline is dependent not
only on its construction but also the surroundings of the stripline. There can be
interactions with physical objects which may be present around, e.g. test equipment,
Electric field vector

7
people, etc., as well as from the influences of external electrical effects such as local
ambient signals and resonances associated with the room in which the stripline is
located. Shielding the room has the benefit of eliminating ambient signals but can
seriously increase the magnitude of the room resonance effects (the room acting like a
large resonant waveguide cavity). Where a shielded room is used to house the open
stripline, strategic use of absorbing panels (for damping resonance effects and generally
reducing other interactions) is essential. Use of an open stripline in a non-shielded room
may cause interference to objects around.
2.1. Application of the Test
The constructional details of a suitable open stripline are given by the Annex E
of the EN55020, given in Appendix A2. The open stripline has a frequency range usable
up to 150 MHz and may be used for EUTs up to 0.7 m high. The characteristic
impedance of the stripline is 150 Ω. The calibration and testing of the measuring set-up
is performed as in Annex F of the EN55020 given in Appendix C. The stripline defined
by the standard is shown in Figure 2. 3.
Key1 Top plate2 Bottom plate3 Plastic supports4 Wooden isolation table5 EUT
Figure 2. 3. Overview of an open stripline TEM device

8
The input voltage of the stripline is set to produce the correct voltage at the
measuring plate, shown in Figure 2.4, which is 27 mV. It corresponds to the required
measured field strength of 3 V/m at a frequency of 15 MHz. Then the input voltage of
the stripline is 10 V emf. The calibration setup of the stripline is shown in Figure 2. 4.
Key 1 Measuring plate of metal (200 ± 0.5) mm x 1 mm2 Measuring probe3 RF millivoltmeter4 Matching network5 Unwanted signal generator6 Termination resistor 150 Ω
Figure 2. 4. Circuit arrangement for calibration of the measuring set-up
2.2. Measurement Setup
The stripline should be placed on non-metallic supports at least 0.8 m from the
floor, and the top conductor plate shall be no closer than 0.8 m from the ceiling.
The equipment under test is placed on a non-metallic support which is in the
centre of the stripline. The height of the support is 0.1 m. The EUT must be positioned
in the same position as for normal home usage (e.g. in the case of portable equipment).
Connecting leads to the equipment under test are inserted through the holes in the base
conductor plate of the stripline. The lengths of the leads inside the stripline shall be as
short as possible and completely surrounded by ferrite rings to attenuate induced
currents. The transfer impedance of coaxial cables used shall be no higher than 50mΩ/m
at 30 MHz. The mains lead shall be bundled to a length less than 0.3 m. Any balanced-
to-unbalanced transformer used shall be connected to the equipment under test with
leads which are as short as possible. Terminals of the equipment under test which are

9
not used during the measurement shall be terminated with shielded resistors that are
matching the nominal terminal impedance.
If equipment under test requires another apparatus in order to function properly
such as a display when testing a broadcast receiver, that additional apparatus (i.e. the
display) shall be considered as part of the measuring equipment and precautions shall be
taken to ensure that the additional apparatus is not subject to the unwanted signal. This
requires generally the placing of the other apparatus outside the stripline.
For the connections to the antenna terminal or to the video input terminal of the
equipment under test, a high-grade coaxial cable with a high-grade connector at the
antenna or video input terminal side shall be used. These precautions may include
additional grounding of coaxial shields, shielding, and insertion of an RF filter on or
application of ferrite rings to the connecting cables.
2.3. Measurement Procedure
Figure 2. 5 shows the setup for testing a broadcast receiver in a stripline. For
adjusting the wanted signals, the audio or video controls of the equipment under test are
set as described in audio and video measurement procedure sections based on 5.2.2 and
5.2.3 clause of EN55020. During the adjustment procedure the unwanted signal
(generator G2) is switched off. The wanted signals are specified in Table 2.1.

10
Key 1. AF generator 1 kHz G1 9. Nonmetallic support 2. RF generator G2 for unwanted signal 10. Loud speaker bandstop filter LBS3. Widebandpower amplifier Am 0.15 MHz to 150 11. Mains bandstop filter MSB 4. Lowpass filter F 12. Sheath current chokes Sh 5. Matching network MN 13. Audio frequency voltmeter V 6. Open stripline device TEM 14. Mains cable7. Terminating impedence 150Ω 15. Band pass filter 8. Equipment under test
a) Channels 1 and 2 in the case of two-channel sound television equipment
Figure 2. 5. Measurement of the immunity of broadcast receivers from radiated fields in the frequency range 0.15 MHz to 150 MHz in an open stripline
The equipment however is switched off during the adjustment. For the
measurement, the unwanted signal is supplied by generators G1 and G2 which are
connected through wide-band amplifier “Am”, and low-pass filter “F” to matching
network “MN” of the stripline. The wide-band amplifier “Am” may be required to
provide the necessary field strength. The stripline is loaded with terminating impedance
“TI”. Care should be taken with respect to the harmonic level of the RF output of the
generator G2 and in particular the output of the wide-band amplifier “Am”. Harmonics
may influence the measurement if they coincide with the tuned channel or the IF
channel of the equipment under test. In some cases provisions shall be made to reduce
the harmonic level adequately by inserting a suitable low-pass filter “F”.
The unwanted signal supplied by generator “G2” and amplifier “Am” shall be
amplitude modulated with 1 kHz at 80 % depth.

11
Table 2. 1. Measurement conditions for the test of immunity from radiated fields (Source: Subclause 5.8.3 of EN 55020)
Operating mode of receiver/video tape
equipment
Wanted signal for adjustment of reference output power/ reference picture
FM broadcast reception 60 dB(µV) at 75Ω at a frequency of 98 MHz, 1 kHz freq. mod. with 40 kHz deviation
Phono 1 kHz, 500 mV(e.m.f.) for crystal 1 kHz, 5 mV (e.m.f.) for moving magnet 1 kHz, 0.5 mV (e.m.f.) fpr moving coil
CD, audio tape, audio amplifier, auxiliary
1 kHz, 500 mV (e.m.f.)
Audio playback A signal from a tape or disc, which has a recorded signal of 1 kHz, 500 mV (e.m.f.) with 0 dB sound level or a sound level specified by the manufacturer. For audio immunity measurement this may be a blank tape or disc
TV broadcast reception and recording
70 dB(µV) at 75 Ω at the frequency of the middle channel of the lowest band (the lowest of the available channels for system L: 04, 08, 25 or 55) and ITU-R BT.471-1 standard color bar and frequency modulated at 1 kHz with 30kHz deviation (or 54 % amplitude modulation for system L)
Video recording (other than broadcast signals) and video monitor mode
1 kHz, 500 mV(e.m.f.) sound signal and ITU-R BT.471-1 standard color bar video signal, with 1 V between white and synchronism level
Video playback A signal from a recorded standard color bar on a tape or disc, with 0 dB sound level or a level specified by the manufacturer. For audio immunity measurement this may be a blank tape or disc.
2.4. Performance Criteria
In order to decide whether the EUT comply with the standard, the equipment
shall continue to operate as intended during the test. No change of actual operating state
(for example change of channel) is allowed as a result of the application of the test.
Multifunctional equipment shall meet the relevant requirements for each
function. Evaluation is carried out for audio and video functions. The equipment is
supposed to operate as intended if the evaluation of audio and video performance is
satisfied according to the following requirements.
Evaluation of audio quality: The criterion of compliance with the requirement
is a wanted to unwanted audio signal ratio of ≥40 dB at a wanted audio signal power
level of 50 mW, or at another audio signal level specified by the manufacturer. If the
signal to noise (S/N) ratio is less than 43 dB, the performance criterion for audio
assessment is the actual S/N ratio minus 3 dB. In this case, at the beginning of the audio
quality evaluation, the actual S/N ratio is measured and noted in the test report as

12
reference value. For AM sound receivers, the criterion is ≥26 dB at 50 mW. For AM
and FM car radios and for broadcast receiver cards for computers, the criterion is ≥26
dB at 500 mW.
Evaluation of picture quality: In the evaluation of picture interference, the
wanted test signal produces a standard picture (in the case of video tape equipment, on
the screen of the test TV set) and the unwanted signal produces a degradation of the
picture. The degradation may be in a number of forms, such as a superposed pattern,
disturbance of synchronization, geometrical distortion, loss of picture contrast or color
and etc. The criterion of compliance with the requirement is just perceptible degradation
by observation of the picture not a numerical measurement is made. The screen shall be
observed under normal viewing conditions (brightness 15 lx to 20 lx), at a viewing
distance of six times the height of the screen.
2.4.1. Measurement Procedure for Audio Assessment
Firstly, the wanted test signal is applied to the equipment under test. This
produces a wanted audio signal which is measured. The volume control of the
equipment under test or test set-up is adjusted to set this audio signal at the required
level. The wanted audio signal is then removed by switching off the modulation or the
audio test signal. The unwanted disturbance signal is applied in addition and its
frequency is swept through the test range; its level is kept at the relevant limit value.
The evaluation of the interference is made by measuring the level of the unwanted
output signal and comparing this to the wanted output signal level. The equipment
under test is considered to meet the requirements if the conditions of evaluation of audio
quality are fulfilled.
2.4.2. Audio Power Output Measurement
The measurements should be performed with the flattest possible audio-
frequency response. If this flat response is not clearly marked at the controls, the control
setting shall be as prescribed by the manufacturer.
The audio power at the output of the equipment under test shall be measured as
follows:

13
a) For equipment under test with audio power output available through an
external loudspeaker connector, the levels of the wanted and the unwanted audio signals
are measured at the external loudspeaker terminals across the load impedance specified
by the manufacturer. A reference test setup is given in Figure 2.6.
Key 1. Equipment under test 5. Amplifier A2. Rated impedance RL of the audio output 6. Rated load impedance Ra of the amplifier
output3. Filter, FR: low pass or band pass 7. Microphone M4. Audio frequency voltmeter V
Figure 2. 6. Audio power test setup
(Source: Subclause 5.2 of EN55020)
b) For equipment under test without an audio power output, such as a radio
tuner, tape or record deck, an audio amplifier can be provided and connected to the
audio output under test. Level measurements are made at the output of the amplifier.
The volume control, if any, of the equipment under test shall be set at the mid-position.
The volume control of the audio amplifier provided shall then be adjusted to obtain the
required level of the wanted audio signal. The amplifier noise shall be at least 50 dB
below the level of the wanted signal. Care shall be taken to ensure that the amplifier is
not subjected to the effects of the unwanted signal.
As an alternative method, measurements can be made directly at the audio
output connector of the EUT. The reference level is in this case related to the output
level caused by the wanted input signal. The volume control of the EUT, if any, shall be

14
set at the mid-position. For equipment under test with audio power output fed to a built-
in loudspeaker having no external loudspeaker connector, the audio signal levels are
measured by placing a small high quality microphone (a directional type may be
required) close to the front of the built-in loudspeaker under test. The microphone
output is fed through a screened cable (ferrite loaded as required) to an external
amplifier, filter and audio voltmeter to measure the audio output power. The
microphone-audio voltmeter measurement chain shall be calibrated by the use of a
loudspeaker of a type similar to the one in the equipment under test, placed at the same
distance as that used in the measurement, and supplied with a 1 kHz tone at the required
levels.
Another method which avoids the use of a microphone is that, the speaker leads
are taken out from the internal speaker of the EUT and are connected through a relevant
filter to the audio voltmeter across the rated load impedance, specified by the
manufacturer. For the measurement of input immunity, filter “FR” shall be of a 15 kHz
low-pass type. The audio frequency voltmeter shall be provided with a weighting filter
according to ITU-R BS.468-4 [9]. The quasi-peak value shall be measured. For the
measurement of immunity from conducted voltages, radiated fields and conducted
currents, filter “FR” shall be of a 0.5 kHz to 3 kHz band-pass type. The audio frequency
voltmeter shall be applied without weighting filter. The r.m.s. value shall be measured.
In case of dispute, the measurement method mentioned in the test report shall be
verified.
2.4.3. Measurement Procedure for Video Assessment
The standard picture is a pattern consisting of vertical color bars in accordance
with ITU-R Std. BT.471-1, 100/0/75/0 [10]. First, only the wanted signal is applied to
the equipment under test. The controls of the equipment under test are set to obtain a
picture of normal brightness, contrast, and color saturation. This is obtained with the
following luminance values in terms of candela/m2 (cd/m2)
• black part of the test pattern 2 cd/m2;
• magenta part of the test pattern 30 cd/m2;
• white part of the test pattern 80 cd/m2.

15
The luminance of the magenta bar is set to 30 cd/m2. If this level cannot be
reached, the luminance is set as close as possible to 30 cd/m2. If a value different from
30 cd/m2 is used, this is stated together with the results.
The unwanted signal, with frequency adjusted to the relevant values (an
accuracy of ±fline/2 may be necessary, where fline = 15625 Hz, horizontal scan
frequency), is then applied in addition. The level of the unwanted signal shall be
maintained at the relevant limit value at each frequency. The equipment under test is
considered to meet the requirement if the conditions of evaluation of picture quality are
fulfilled. The degradation is more rapidly discerned and the variation of results due to
individuals is reduced, if the unwanted signal is switched on and off at a low rate (about
0.5 Hz) during the test. This can be done manually or automatically by an electronic
timer.
2.5. Radiated Field Immunity for Large Equipment Not Fitting in the Open Strip Line
Equipment not fitting inside the open stripline defined in EN55020 shall be
measured according to IEC 61000-4-3 in the frequency range 80 MHz to 150 MHz in an
anechoic chamber with limits as in Table 2. 2. The recommended step size of 1% shall
be replaced by a scanning, which allows for an adequate observation time of the
possible interference. The equipment shall be placed on a non-conducting table with a
height of 80 cm. Testing shall be done with a vertical polarized field with the equipment
in one position. Picture quality can be inspected by means of a video camera or by
direct observation. The arrangements concerning cables and filters are the same as for
measurements in the open stripline. The front side of the EUT shall be positioned
parallel to the antenna line of sight. The position shall be described in the measurement
report.
16
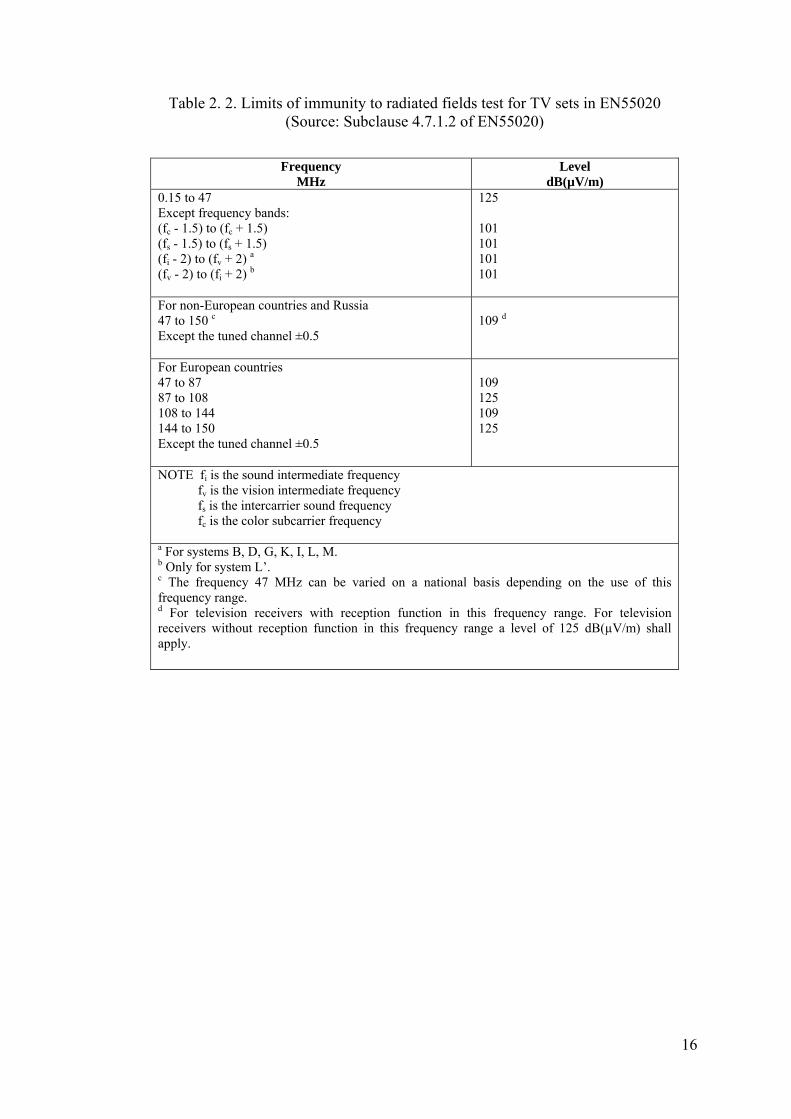
Table 2. 2. Limits of immunity to radiated fields test for TV sets in EN55020 (Source: Subclause 4.7.1.2 of EN55020)
Frequency
MHz Level
dB(µV/m) 0.15 to 47 Except frequency bands: (fc - 1.5) to (fc + 1.5) (fs - 1.5) to (fs + 1.5) (fi - 2) to (fv + 2) a
(fv - 2) to (fi + 2) b
125 101 101 101 101
For non-European countries and Russia 47 to 150 c
Except the tuned channel ±0.5
109 d
For European countries 47 to 87 87 to 108 108 to 144 144 to 150 Except the tuned channel ±0.5
109 125 109 125
NOTE fi is the sound intermediate frequency fv is the vision intermediate frequency fs is the intercarrier sound frequency fc is the color subcarrier frequency
a For systems B, D, G, K, I, L, M. b Only for system L’. c The frequency 47 MHz can be varied on a national basis depending on the use of this frequency range. d For television receivers with reception function in this frequency range. For television receivers without reception function in this frequency range a level of 125 dB(µV/m) shall apply.

17
CHAPTER 3
STRIPLINE DESIGN
The difficulties of testing with antennas led to developments of alternative test
sites. Groenveld and de Jong [11] designed a simple transmission line construction
which provides a uniform electromagnetic field between its plates over a comparatively
small volume, and this was written in to both IEC 801part 3 (1984) and EN55020 as a
recommended method of performing part of the radiated immunity testing [12]. Earliest
TEM waveguides were open striplines used for immunity measurements [7].
IEC 61000-4-3 allows the use of the stripline only if the field homogeneity
requirements are met, and if the EUT and wires can be arranged as the standard dictates
[13].
The stripline is essentially two parallel plates between which the field is
developed. It is fed at one end through a tapered matching section and terminated at
through an identical section the other side. The dimensions of the parallel section of
stripline are defined in the standards as 90 x 80 x 60 cm, and the EUT is placed within
this volume on an insulating support over the bottom plate. The test stripline is shown in
Figure 3.1. The field between the plates is propagated in TEM mode, which has the
same characteristics as free space. The calibration of the stripline is theoretically very
simple; assuming proper matching, the field is directly proportional to the voltage at the
feed point divided by the distance between the plates as in Equation 3. 1.
VEh
= V/m (3.1)
If the stripline test is conducted in a screened room, reflections from the walls
will disturb the propagation characteristics quite severely, which is similar with
antennas. In this case, we need to surround the stripline with absorbing plates to dampen
these reflections. This will be cheaper than lining the walls with anechoic absorbers.

18
Figure 3. 1. Dimensions of EN55020 Stripline
The accuracy of the stripline depends to a large extent on the dimensions of the
EUT. IEC 801-3 [12] recommends that the dimensions of the EUT should not exceed 25
cm, while EN55020 allows an EUT height up to 0.7m with a calibration correction
factor. There is also an upper frequency restriction of 150–200 MHz, above which the
plate spacing is greater than a half-wavelength and the transmission mode becomes
complex so that the field is subject to variability. It would be quite possible to use the
stripline structure for immunity testing below 200MHz (theoretically down to DC if
required) instead of biconical antennas. Above 200 MHz, log periodic antennas are
used. The power requirement of the stripline structure for the field strength of 10 V/m is
no more than a few watts.
A particular characteristic of testing with the stripline is that the connecting
cables for the EUT are led directly through one of the plates and are not exposed to the
field for more than a few centimeters. Thus it only tests for direct exposure of the
enclosure to the field, and for full immunity testing it should be used in conjunction
with common mode conducted current or voltage injection.
1 Metal top-plate (2 m x 0.6 m) parallel to base plate 2 Metal base-plate (2 m x 0.9 m) 3 Plastic bracing (0.8 m)x4 4 Non-metallic support 5 Equipment under test
19
3.1. Line Impedance
The characteristic impedance of a parallel plate is the key design parameter. It
determines the voltage across the plates for a given input power and therefore
determines (crudely) the E-field as this is the plate voltage divided by plate separation.
The characteristic impedance itself is determined by the physical configuration of the
line [14].
Since stripline has two conductors and a homogeneous dielectric, it can support
a TEM wave, and this is the usual mode of operation. Like the parallel plate guide and
coaxial lines, however, the stripline can also support higher order transverse magnetic
(TM) and transverse electric (TE) modes, but these are usually avoided in practice. The
main difficulty with the stripline is that it does not lend itself to a simple analysis like
transmission lines and waveguides. Since the TEM mode of the stripline will be
concerned primarily, an electrostatic analysis is sufficient to give the characteristic
impedance. An exact solution of Laplace's equation is possible by a conformal mapping
approach [15]. However the procedure and results are cumbersome. Thus, closed-form
expressions will be presented that give good approximations to the exact results and an
approximate numerical technique for solving Laplace’s equation for geometry similar to
stripline [16].
The characteristic impedance of a parallel plate is the key design parameter. It
determines he voltage across the plates for a given input power and therefore crudely
determines the E field as this is the plate voltage divided by plate separation. The
characteristic impedance itself is determined by the physical configuration of the line
with the relation in Equation 3. 2 for lossless line [14].
LZC
=
(3.2)
where Z is characteristic impedance of the parallel-plate line,
L the inductance per unit length ,
C the capacitance per unit length.

20
It can be shown that for an air-filled line the approximate impedance is given by
Equation 3. 3 [14], [17]. If h « w (i.e. h<0.1w, h and w denoted in Figure 1.1)
0hZ Zw
= × (3.3)
where h plate separation,
w plate width,
Z characteristic line impedance,
Z0 impedance of free space (377 Ω).
In our case, because of the designed stripline geometry; there is no dimension
relation like h<0.1w. Thus, it is needed to evaluate the microstrip parameters for
calculation of the characteristic impedance.
Firstly, design formulas were presented for the effective dielectric constant and
characteristic impedance of microstrip line; these results were curve-fit approximations
to rigorous quasi-static solutions [18].
Figure 3. 2. Microstrip line
Considering Figure 3. 2, the effective dielectric constant of the microstripline is
given approximately by Equation 3. 4 [16].
( ) ( )1 2 1 2 1 12ff r r h wε ε ε ⎡ ⎤= + + − +⎣ ⎦ (3.4)

21
Since rε =1 then ffε =1.
Given the dimension of the stripline, the characteristic impedance can be
calculated with Equation 3. 5 [16].
For / 1w h ≤ 060 8ln
4ff
h wZw hε
⎛ ⎞= +⎜ ⎟⎝ ⎠
(3.5)
For given characteristic impedance 0Z and dielectric constant rε , the /w h ratio
can be found by Equations 3.6-3.9 [16].
0 1 1 0,110,2360 2 1
r r
r r
ZA ε εε ε
⎛ ⎞+ −⎛ ⎞= + +⎜ ⎟⎜ ⎟ +⎝ ⎠ ⎝ ⎠ (3.6)
0
3772 r
BZ
πε
= (3.7)
For / 2w h < ( )
( )8exp
/exp 2 2
Aw h
A=
− (3.8)
For / 2w h > ( ) ( )12 0.61/ 1 ln 2 1 ln 1 0.392r
r r
w h B B Bεπ ε ε⎡ ⎤⎧ ⎫−
= − − − + − + −⎨ ⎬⎢ ⎥⎩ ⎭⎣ ⎦
(3.9)
According to these formulas, new stripline dimension was calculated.
50 Ω signal source was used to feed the stripline, and matching network was
used to transfer the 150 Ω line to 50 Ω source. At the end of the stripline, 150 Ω
resistive load was used for termination. Simplified form of the whole system is shown
in Figure 3. 3.

22
Figure 3. 3. Block diagram of the stripline testing system
3.2. Cutoff Frequency
Fields generated in a TEM cell are essentially plane waves with free space wave
impedance of 377 Ω. In addition to the TEM mode, stripline will propagate undesired
higher order TE and TM type modes with cutoff frequency roughly determined by the
cross-section of it [19]-[22].
Therefore there is another concern for the cutoff frequency which must be above
150 MHz at least in order to perform radiated fields test for EN55020 in the frequency
range of 150 KHz–150 MHz.
The excitation of the first mode is approximately given by the Equation 3. 10
[23].
( )300
2 0,8c
r
fw hε
=+
(3.10)
Note that cf is in gigahertz, h and w are both in millimeters. This expression is
useful in determining the lowest impedance that may be reliably used for an operating
frequency. As a rule of thumb, the maximum operating frequency should be chosen
lower. A good choice for maximum frequency may be 90% of this value or lower. For
instance; if this formula is applied to EN55020 stripline, then the cutoff frequency is
about 163 MHz.

23
3.3. Design Verification and Calibration
According to the EN55020, the following setup in Figure 3.4 is used for
calibration of the suggested open stripline structure. Induced voltage at the measuring
plate depends on the measuring frequency when 10 V e.m.f voltage level is applied
from the signal generator for whole frequency range. The calibration curve in Figure 3.5
should be obtained for the suggested stripline in EN55020. The upper and lower lines
are the limit lines and the line in the middle is the nominal voltage of the measuring
plate. Limited deviations of 2 dB are allowed from the nominal voltage value. The field
strength within the stripline is then 3 V/m.
Key 1 Measuring plate of metal (200 ± 0.5) mm x 1 mm2 Measuring probe3 RF millivoltmeter4 Matching network5 Unwanted signal generator6 Termination resistor 150 Ω
Figure 3. 4. Circuit arrangement for calibration of the measuring set-up

24
Figure 3. 5. Calibration curve for suggested stripline in EN55020
An empty stripline with plates separated by distance “h” should create a field
strength E given by Equation 3.11 for an input voltage Uin for an input voltage inU ,
furnish a field strength E given by Equation 3. 11.
inUEh
= (3.11)
where
E is the field strength in volts/meter,
inU is the input voltage in volts,
h is the distance between the plates, in meters.
In practice deviation from this relationship may be caused by mechanical
tolerances, material losses, internal reflections causing standing waves, radiation, etc.
These deviations are in general dependent on frequency. For this reason it is necessary
to calibrate a transfer factor, for the stripline which is given by Equation 3.12.
inT E U= − (3.12)

25
where
T is the transfer factor in dB (m-1);
inU is the input voltage measured at the input to the adapting network of the
stripline in dB(V);
E is the field strength of the TEM wave in dB (V/m).
For testing the field strength within the stripline according to Figure 3.4, a
metal-plate with the dimensions 200 mm × 200 mm is positioned 10 mm above the
base-plate of the stripline. The RF voltage of the measuring-plate related to the base-
plate of the stripline is measured by using a RF millivoltmeter or an appropriate
measuring apparatus. The termination by the measuring apparatus should be 3 pF
parallel to ≥100 kΩ. The capacity of the measuring plate related to the base plate of the
stripline is 35 pF. Above 10 MHz the termination resistance may decrease depending on
the frequency (e.g. to 10 kΩ for 100 MHz). An example for the arrangement of the
measuring apparatus is shown in Figure 3.6 retrieved from Annex F of EN55020, given
in Appendix C.
Key 1 Measuring plate of metal (200 ± 0.5) mm x 1 mm 2 Measuring probe 3 RF millivoltmeter 4 Plastic distance pieces, total cross area of all plastic distance pieces max. 1% of the plane of item 1 5 Connection to the base plate of the stripline, total min. 25 mm wide 6 Metal box (350 ± 1.2) mm x (250 ± 1.2) mm x (250 ± 1.2) mm, closed at the back, with the base plate of the stripline several times tightly connected
Figure 3. 6. Arrangement of the measuring apparatus

26
The voltage value at the measuring plate for an unmodulated signal from the
unwanted signal generator of 10 V (e.m.f.) shall comply with the calibration curve of
Figure 3.5. The field strength within the stripline is then 3 V/m. This test shall be done
for the measuring frequency range. Deviations greater than the limited deviations of ±2
dB shall be taken into account, depending on the frequency, by the correction factor K1:
1mes
nom
UKU
= (3.13)
where
1K is the correction factor,
mesU is the measured voltage value at the measuring-plate,
nomU is the nominal voltage value.
It should be verified whether spurious influence interferes the measuring result
during the calibration procedure. With switched on or switched off unwanted signal
generator and RF matched shortening of the measuring plate, the basic voltage
indication of the RF millivoltmeter shall be negligible.
The earth lead of the measuring probe should be directly connected to the base
plate of the stripline for grounding. RF millivoltmeter is to be placed in a one-side-open
metal box under the measuring point or beside it. Metal box should be in good
connection to the base plane of the stripline for effective ground matching.
The E-field (V/m) at the centre of the working volume of the stripline is given
by Equation 3. 14.
0pZVEh h
= =
(3.14)
where
V is the rms voltage on the septum (in volts),
h is the separation between the plates (in meters),
0Z is the characteristic impedance of stripline (in ohms),
p is the power flowing through stripline (in watts).

27
For a practical case, it is modified as in Equation 3. 15 [24].
0f
pZVE Ch h
= = (3.15)
fC is the correction factor for the average field strength over the volume of the
EUT derived from the analysis of the field distribution over the cross section of the cell.
Thus, by measuring the power flowing through the septum, the E-field can be calculated
for known values of h and fC .
Instead of this power relationship, EN55020 uses K1 factor correction to
establish 3 V/m at the center of the working volume.
Signal source is adjusted to 10 V e.m.f which corresponds to 140 dBµV rms or
134 dBµV at 50 Ω. This voltage is applied to the input of the matching network during
the calibration of the stripline defined in EN55020.
After this calibration procedure, new stripline plate voltage is (if deviation
greater than 2 dB) given by Equation 3. 16.
min 1 2new no alV V K K= − −
(3.16)
According the volume of the EUT, there might be some deviations at the
induced voltage on the measuring plate. Then another correction factor, which is K2,
must be defined which should be taken into account before each test. To determine K2,
the EUT is placed in the stripline while it is off. K2 is calculated with the same formula
K1 given by Equation 3.13 with the values measured at 15 MHz.
A stripline is essentially a two-port network where one port shown in Figure 3.8
is used as the input in Figure 3. 7and the other port shown in Figure 3. 8 as the output.
Input as well as output sections are tapered for impedance matching.

28
Components Bu1 Plug sockets for pins Plug socket a Insulated Plug socket b Connected to casing Bu2 Coaxial socket 50Ω X(1) Plastic plate approx. 3 mm thick Y Metal casing, approx. 40 mm x 30 mm x 15 mm, shown open Z Opening in metal casing R1 122.4 Ω (2x) soldered-in as close as possible R2 122.5 Ω soldered-in as close as possible The matching network is suitable for a signal generator output impedance Z0=50Ω Dimensions in millimeters
Figure 3. 7. Matching network (Source: Annex E of EN55020)
Stripline have rudimentary tapered sections from the line to the source and load
resistive networks to reduce the effects of sharp impedance discontinuities which
adversely affect the VSWR. The terminating resistor reduces the magnitudes of internal
standing waves and resonances and absorbs unwanted propagation modes.
X(2) Plastic plate approx.3 mm thick
Figure 3. 8. Termination Impedance (TI)
(Source: Annex E of EN55020)
These unwanted modes can arise from the construction of the feed taper as well
as from the input connector and any internal objects (supports, spacers, EUT, etc.),

29
limiting the broadband performance of a stripline. The limiting effect that unwanted
modes (and, in some cases, internal resonances and reflections) have on the broadband
performance of a stripline is disturbance of the plane wave nature of the internal field.
Open two-plate stripline cells can have equal plate widths or, as illustrated in
Figure 3.9, have a lower plate that is wider than its top plate. Electrically, the effect of
having the lower plate wider than the top prevents concentration and bowing of the
fields at the edges of the plates. The fringing fields from the upper plate can, as a result,
meet the lower plate at angles far closer to 90°, thereby increasing the uniformity of the
generated field [25]. Stripline in EN55020 and the new design has different plate widths
for this reason.
Figure 3. 9. The fringing fields at the edges of a two-plate open stripline
3.4. Field Uniformity
Ideally, all EUTs should be tested in planar electric fields, i.e. fields which are
uniform in both phase and amplitude. However, various effects disturb the required
field distribution in a stripline, amongst which are non-TEM (also termed: higher order)
modes, reflections, room resonances, etc.
The feed point and the tapered sections at both ends of the EN 55020 stripline
can be sources of these effects. For the feed point, the wave launched will naturally
exhibit a spherical wavefront. This can result in a considerable variation in phase across
the width of the line, particularly at the transition between the tapered feed section and
the start of the parallel plate region. Also at this junction between tapered and parallel
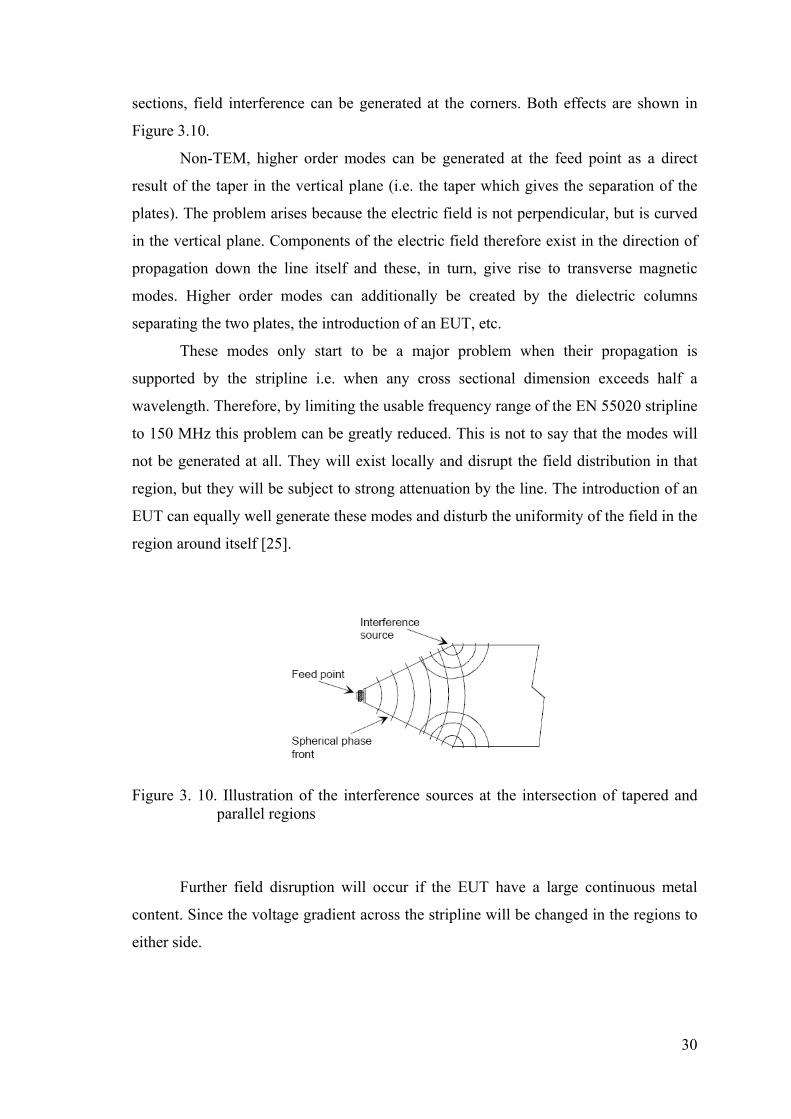
30
sections, field interference can be generated at the corners. Both effects are shown in
Figure 3.10.
Non-TEM, higher order modes can be generated at the feed point as a direct
result of the taper in the vertical plane (i.e. the taper which gives the separation of the
plates). The problem arises because the electric field is not perpendicular, but is curved
in the vertical plane. Components of the electric field therefore exist in the direction of
propagation down the line itself and these, in turn, give rise to transverse magnetic
modes. Higher order modes can additionally be created by the dielectric columns
separating the two plates, the introduction of an EUT, etc.
These modes only start to be a major problem when their propagation is
supported by the stripline i.e. when any cross sectional dimension exceeds half a
wavelength. Therefore, by limiting the usable frequency range of the EN 55020 stripline
to 150 MHz this problem can be greatly reduced. This is not to say that the modes will
not be generated at all. They will exist locally and disrupt the field distribution in that
region, but they will be subject to strong attenuation by the line. The introduction of an
EUT can equally well generate these modes and disturb the uniformity of the field in the
region around itself [25].
Figure 3. 10. Illustration of the interference sources at the intersection of tapered and parallel regions
Further field disruption will occur if the EUT have a large continuous metal
content. Since the voltage gradient across the stripline will be changed in the regions to
either side.

31
The EN55020 test facility needs a large room in which to be housed. Room
resonances can be encountered at all frequencies satisfying the Equation 3. 17 when the
room possesses rectangular cross-sections [25]:
2 2 2
150 m n pf MHzl b h
⎛ ⎞ ⎛ ⎞ ⎛ ⎞= + +⎜ ⎟ ⎜ ⎟ ⎜ ⎟⎝ ⎠ ⎝ ⎠ ⎝ ⎠
(3.17)
Here l , b and h are the length, width and height of the room in meters and m, n
and p are mode numbers. The only condition limiting the use of this formula is that only
one of m, n or p can be zero at any one time.
For a room measuring 8 m × 8 m × 4 m, there are 25 resonant frequencies within
the band 26.5 MHz to 120.1 MHz. This shows that, in principle, room resonances can
pose major problems. Their effects are worse for rooms which are metal lined (for
shielding from ambient signals). In this condition, the room acts like a waveguide and
will possess high Q factors for some or all resonant frequencies. Their effects are to put
sharp spikes into the field strength variation with frequency within the cells. In general,
these can only be damped by the use of absorbing material placed around the cell [25].
Other factors which can contribute to disturbance of the field include cabling (in
terms of reflections and its possible parasitic effect) and local ambient signals. In
general, to keep cabling problems to a minimum, these should be as short as possible
within the stripline, gain access to the test area via small holes in the bottom plate and
be heavily loaded with ferrite beads. To completely nullify ambient signals, a shielded
room is required but it should be borne in mind that such a room can provide extremely
sharp resonances [25].
Stripline radiate energy from the open sides. This not only represents a power
loss from the facility but also serves as an interference source by giving rise to possible
outside reflections. As a consequence, external objects can influence the results of
measurements. To counter this effect, recommended usage of the stripline involves
placing a screen of absorber around its open sides as well as raising the whole cell at
least 0.8 m above the ground and ensuring it is no closer than 0.8 m to the ceiling.
In order to evaluate the TEM mode working conditions of the stripline IEC
61000-4-20 [26] was used. After the design of the stripline was completed, final
measurements were performed according to this standard.

32
3.5. Higher Order Modes
A basic TEM-cell limitation is the appearance of resonance which tends to
destroy the desired TEM-mode field distribution. However, determining the resonant
length of a cell is nontrivial since the tapered sections affect each higher order mode
differently. Because TEM-cell is a high-Q cavity, the higher order resonance appears at
sharply defined frequencies.
The cutoff frequency for 10TE , usually the first higher order mode, is given by
Equation 3. 18 [26].
10( )2ccf TEa
= (3.18)
where c is the velocity of light and a is the width of the upper plate of the
stripline.
Referring to Figure 3. 11, the equation for the cutoff frequency for any higher
mode is given by Equation 3.19 [27].
( )2 2 2 2
, 2c m n
c h m a nf TEha+
= (3.19)
The TEM-mode propagates through the tapered ends of the cell without
significant alteration. Each higher mode is always reflected at some point within the
taper where it becomes too small to propagate the mode. The propagating energy in the
higher-order mode undergoes multiple reflections, end to end, within the cell until it is
dissipated. Electrical length of the line determines some specific frequencies for
resonances. These corresponds to integer multiples (p) of the half wavelength (λg/2)
given by Equations 3. 20 and 3.21. At the resonant frequencies ( )R mnpf , a mnpTE resonant
field pattern exists [27].
( )( )
2mn
mn
pl
λ= ; 1, 2,3p = (3.20)

33
( )2 2 2
1 1 1
g c mnλ λ λ= +
(3.21)
where ( ) ( )c mn c mnf c λ= and ( )c mnλ represents the cutoff wavelength value.
As the frequency increases, higher order resonant modes determined by the
Equation 3. 22.
2
2
2res mnpcf fl
⎛ ⎞= + ⎜ ⎟⎝ ⎠
(3.22)
where
mnf is the cutoff frequency in Hz of the mode of interest,
c is the wave propagation velocity (3.0×10⁸m/s),
l is the resonant length of the cell (in meters),
m , n , and p are integers corresponding to the particular mode and the resonant
length of the cell is frequency dependent (depending upon the particular mode of
interest) [28].
Extension of the useful frequency range of the cell can be done by absorber
loading. This is achieved by lowering Q-cavity inside the cell, which depends on
frequency. Absorber improves the uniformity of the field when they are used around
open sides of cells and at the tapered sections by increasing the vertical component of
the electrical field at the edges of the stripline [27], [29].
Complete details of the TEM waveguide requirements for field uniformity
algorithm are available in standard IEC 61000-4-20 [26].
3.6. TEM Mode Verification
TEM waveguides may exhibit resonances above a certain cut-off frequency
determined by the cross-sectional dimensions and/or the waveguide length. For practical
use, the field in a TEM waveguide is considered to propagate in a TEM mode when the

34
following requirements are met. This verification of the TEM mode applies to
waveguides used either for immunity or emissions testing. The TEM mode behavior
shall be confirmed at regular intervals.
Using an immunity-type uniform-area verification procedure (according to 5.2.3
of the IEC 61000-4-20) the magnitudes of the secondary (unintended) electric field
components shall be at least 6 dB less than the primary component of the electric field,
over at least 75% of the tested points in a defined cross-section of the TEM waveguide
(perpendicular to the propagation direction). For this 75% of test points, a primary
electric field component tolerance greater than 6 dB up to 10 dB, or a secondary electric
field component level up to –2 dB of the primary field component, is allowed for a
maximum of 5% of the test frequencies (at least one frequency), provided that the actual
tolerance and frequencies are stated in the test reports. The frequency range is from 30
MHz up to the highest frequency of intended use of the TEM waveguide. The first
frequency step shall not exceed 1% of the fundamental frequency and thereafter 1% of
the preceding frequency in 80 MHz to 1 000 MHz, 5% below 80 MHz and above 1000
MHz. One constraint on the sweep speed is the response time of the field probe [27].
3.7. Test Volume and Maximum EUT Size
The usable test volume of the TEM waveguide depends on the size, geometry,
and the spatial distribution of the electromagnetic fields. The maximum size of a EUT
must be less than the “usable test volume” in the TEM waveguide.
The usable test volume of a TEM waveguide shown in Figure 3.11 depends on
the “uniform area” as defined inside. The propagation direction of the waveguide TEM
mode (typically z-axis) is perpendicular to a uniform area (transverse plane, typically
xy-plane). In the xy-plane the entire cross-section of the usable test volume has to fulfill
the requirements of the uniform area defined in the subclause 5.2.3 of IEC 61000-4-20.
The minimum value for the distance hEUT between EUT and each conductor or absorber
of the waveguide (Figure 3.11) is given by the distance between the boundary of the
uniform area and the conductor. However, hEUT should not be zero, in order to avoid the
possible change of the EUT operational condition by the close coupling between EUT
and conductors of the waveguide (it is recommended that hEUT should be larger than
0.05 h). Along the z-axis (propagation direction) the usable test volume is limited by

35
zmin≤ z ≤zmax . The length of the test volume is L= zmax-zmin. The requirements of a
uniform area shall be validated for cross-sections at each z with zmin≤ z ≤zmax . It can be
assumed that the TEM mode requirements are fulfilled for zmin≤ z ≤zmax under the
following conditions:
• if TEM mode requirements are fulfilled at the position zmax, and the
geometry of the waveguide is similar to one shown in Figure 3.11 with a constant aspect
ratio of h to w (inherent shape) for 0≤ z ≤zmax or,
• if TEM mode requirements are fulfilled at the positions zmin and zmax, and
the waveguide cross-section is constant or uniformly tapered for zmin≤ z ≤zmax and the
derivatives dh/dz and dw/dz are a smooth function for zmin≤ z ≤zmax (no kinks or steps in
the conductor geometries).
The maximum size of a EUT is related to the size of the usable test volume. The
EUT shall be verified not to be larger than 0.6w times 0.6L [26].
3.7.1. Validation of Usable Test Volume
The concept of a ”uniform area“ which is a hypothetical area in which variations
of the field magnitude are acceptably small (see Figure 3.11). The TEM waveguide
dimensions determine the size of this uniform area (plane), unless the EUT can be fully
illuminated in a smaller surface.
The uniform area should be a vertical plane orthogonal to the propagation
direction of the field. It should be one plane face area in front of the EUT.
In principle, the uniform area may be located at any distance from the input port;
the location will depend on the specific waveguide geometry. The uniform area is valid
only for that distance from the input port at which it is calibrated.

36
Figure 3. 11. Usable test volume
The uniform area is validated in the empty enclosure, for the frequency range
and frequency steps specified in TEM mode verification part of the standard using a
non-modulated signal.
Depending on the size of the uniform area, it is validated at least with five
measurement points which four of them are at the corners and one at the centre. The
spacing between two test points has to be smaller than 50 cm. If the 50 cm limit is
exceeded, an equally spaced grid has to be used for the test points. This means that 9
points shall be used.
3.7.2. Field Uniformity and TEM Mode Measurement Procedure
The procedure for carrying out the validation is known as the “constant forward
power” method and is as follows:
a) Position the isotropic 3-axis probe at one of the points in the grid.
b) Apply a forward power to the TEM waveguide input port so that the electric
field strength of the primary field component is in the range of the given limit ELimit
through the frequency range and frequency steps specified, and record all the forward
power, primary and secondary components field strength readings.
c) With the same forward power, measure and record the primary and secondary
field strengths at the remaining grid points.

37
d) Calculate the standard deviation according to Equation 3.23. All measurement
results are expressed in dB (V/m).
e) The primary field component magnitude of the remaining points shall lie
within a range of 6 dB. The level of the secondary field components shall not exceed –6
dB of the primary field component at each of these points.
f) Of the remaining points, take the location with the lowest primary field
component Eref as the reference (this ensures the 6 dB requirement is met).
g) Knowing the forward power and the field strength, the necessary forward
power for the required test-field strength can be calculated using Equation 3.23, and
shall be recorded.
2
2test
test fwdref
EP PE
= with E in V
m and P in W (3.23)
where
Etest is the test electric field intensity,
Eref is the reference field intensity.
For example, if at a given point, 81 W gives 9 V/m, then 9 W is needed for 3
V/m.
Alternatively, an equivalent procedure is to establish constant primary
component electric field strength in the range of the given ELimit and record the forward
power delivered to the input port. Next, steps a), d), e), f) and g) shall be applied. This
method is known as the “constant field strength” method.
The uniformity validation is applicable for all EUTs whose individual faces
(including any cabling) can be fully enclosed by the ”uniform area“. It is required that
the full uniform area validation be carried out annually or when changes have been
made to the enclosure configuration (e.g. stripline within a shielded enclosure).

38
3.8. Field Uniformity Criteria
Assume that the field strength at test point “i” is given as iE . Then the mean-
value and the standard deviation are calculated for N test points by Equations 3. 24 and
3. 25.
1
1:N
ii
Mean E EN =
= ∑ (3.24)
Standard deviation: ( )( )
211E i
N
E EN
σ = −− ∑ (3.25)
In the statistical sense N = 5 reflects a very small quantity but nevertheless a
normal distribution for the measurements Ei can be assumed. Table 3.1 gives K values
with corresponding probabilities. From probabilities, 75% of the measurement results
will fall in the range given in Equation 3. 26 if the factor K is chosen to be 1.15.
iE EE K E E Kσ σ− ≤ ≤ + (3.26)
Table 3. 1. Values K for expand uncertainty with normal distribution
K Factor 1 1.15 1.3 1.5 2 3
Probability (%) 68.3 75.0 80.6 86.6 95.5 99.7
Dealing with dB-values, often the probability is requested whether the
measurement Ei falls into the band according to Equation 3.27.
rgLimit i Limit Ma inE E E E≤ ≤ + (3.27)
Comparing this band with Equation 3.26 gives Equation 3.28.
2Limit i Limit EE E E Kσ≤ ≤ + (3.28)

39
2E
MarginK
σ ≤ (3.29)
Value of K corresponding to 75% probability in Table 3.1 and a margin of 6 dB
are substituted in Equation 3.29. Then the standard deviation found to be less than 2.61
dB from Equation 3.30.
6 2.61
2 1.15E
dB dBσ ≤ =×
(3.30)
The largest dimension of the sensor for measuring the field shall be smaller than
10% of the distance between the inner and outer conductor. In this case, any field
perturbation can be neglected [26].
In this thesis, this algorithm is run with EMC32 EMC testing software from
Rohde&Schwarz in the following diagram [30]. Figure 3. 12 show the user interface of
the software.
Figure 3. 12. EMC32 software arrangement for verification
40
3.9. Efficiency of TEM Stripline in Terms of VSWR
Matching the cell to the source as well as with the load impedance is important
for an efficient test system in terms of sensitivity. The most accepted description of this
match is the voltage standing wave ratio (VSWR) given by Equation 3. 31. The ratio
describes how much power will be transmitted into the TEM cell and how much power
will be reflected back to the source. Thus, VSWR is an indication of the efficiency of
the TEM cell.
In a transmission line (TEM cell is a transmission line), the ratio of the
maximum to minimum voltage in a standing wave pattern is known as VSWR and it is a
measure of mismatch between the transmission line and the load. It is a real number
such that 1≤VSWR≤∞. VSWR=1indicates a perfectly matched load. It has frequency
dependent characteristics.
max
min
VVSWRV
= (3.31)
The refection coefficient |Г| of a cell can be calculated by using Equation 3. 32.
Reflection coefficient is a measure of impedance mismatch in a transmission line.
Ideally reflection coefficient is zero.
11
VSWRVSWR
−Γ =
+ (3.32)
In terms of ‘S’ parameters, reflection coefficient is S11 parameter of a two-port
network. Power propagating through a TEM cell can be calculated by Equation 3. 33.
21p gP P ⎡ ⎤= − Γ⎣ ⎦ (3.33)
where
Pp is the power propagating through the cell,
Pg is the generator power both in watts.
41
Thus, by measuring the VSWR and the reflection coefficient over the usable
frequency range, power through the cell can be determined. The E-field levels, inside
the working volume of the TEM cell, can be estimated.
The setup in Figure 3. 12 was used to measure the exact VSWR, power flow and
field uniformity of the cell in order to make decision on the efficiency and resonances.
3.10. Design of Bigger Stripline
In the first step of the design, the characteristic impedance of the new stripline
determined to be 150 Ω. If the stripline were designed with 50 Ω characteristic
impedance, it would be easy to drive a 50 Ω system without an additional impedance
matching network. However, to get 50 Ω characteristic impedance, the stripline must be
narrower or shorter which does not satisfy field uniformity [31].
In order to test bigger TFT LCD products at least 1.2 meter distance between the
plates is needed. Therefore the TV sets at which have height up to 1 m could be tested.
For this reason “h” was set to 1.2 m. Then using the equations from 3.4 to 3.9, w/h ratio
is about 0.66 then w (the width of the upper conductor) was set to 0.8 m.
Deciding the line impedance and the new dimensions of the big stripline, it was
better to simulate the performance of this structure before realizing it for measurements.
For this purpose, EMC Studio simulation program package was used [22]. The snapshot
of the program with the designed stripline is shown in Figure 3. 13. The calculation
cores are based on the most efficient computational techniques like Method of Moments
(MoM), Method of Auxiliary Sources (MAS), Transmission Line Methods (MTL) and
Network Analysis (SPICE).

42
Figure 3. 13. Geometrical design in EMC Studio
In order to simulate the field strength at the center of the volume as requested by
EN55020, a field probe was inserted in the middle of the stripline. In the same manner,
plate voltage is simulated via voltage probe in the software. The plate has the same
dimensions and properties with the measuring plate of EN55020 stripline which is used
to calculate the K1 factor. The configuration is shown in Figure 3. 14.
Figure 3. 14. Field and voltage probe inserted in mesh mode view

43
After several runs of the simulation program with MoM, it was seen that there
were some resonances at high frequencies (especially around 100-110 MHz). To
overcome this problem, some absorbers were placed around the stripline based on the
previous works of the TEM cell in literature and relying on the suggestions from
EN55020 and IEC 61000-4-20 as in Figures 3. 15 and 3. 16 [26], [28].
Figure 3. 15. Side view of absorber loaded stripline
Figure 3. 16. Top view of absorber loaded stripline
The electrical properties of the ferrite tiles with absorbers are set to values which
are given in the graphic in Figure 3. 17 [33].

44
Figure 3. 17. Complex permeability and permittivity of pyramidal ferrite absorber
Twelve field probes were placed inside of the stripline in order to evaluate the
field uniformity as well as voltage probe for measuring voltage induced on the
measuring plate as in Figure 3. 18.
Figure 3. 18. Field probes with numbers for field uniformity simulation

45
Input source was set to 15 V emf which was 1.5 times the source level of
EN55020 stripline then the following results in Figure 3. 19 were obtained. Plane 1
consists of field probes #1-6 and plane 2 consists of field probes #7-12.
0 50 100 1500
2
4
6
8
10
12
14
16
Frequency (MHz)
Fiel
d S
treng
th D
evia
tion
(dB
V/m
)
Plane 1
Probe #1Probe #2Probe #3Probe #4Probe #5Probe #6
(a)
0 50 100 1504
6
8
10
12
14
16
Frequency (MHz)
Fiel
d S
treng
th D
evia
tion
(dB
V/m
)
Plane 2
Probe #7Probe #8Probe #9Probe #10Probe #11Probe #12
(b)
Figure 3. 19. Difference of field strengths in plane 1 (a) and in plane 2 (b)

46
105 106 107 108 109 1010 10111.85
1.9
1.95
2
2.05
2.1
2.15
2.2
2.25
Frequency (Hz)
VS
WR
Figure 3. 20. VSWR vs frequency obtained from simulation
The VSWR of the stripline obtained from the simulation is given in Figure 3. 20.
VSWR of the stripline was higher than the expected values. Since, special resistive
networks, shown in Figure 3.3, were used to get lower VSWR in real measurements as
indicated by EN55020. If VSWR is lower than the value of 2.0, then TEM cell has very
good efficiency.
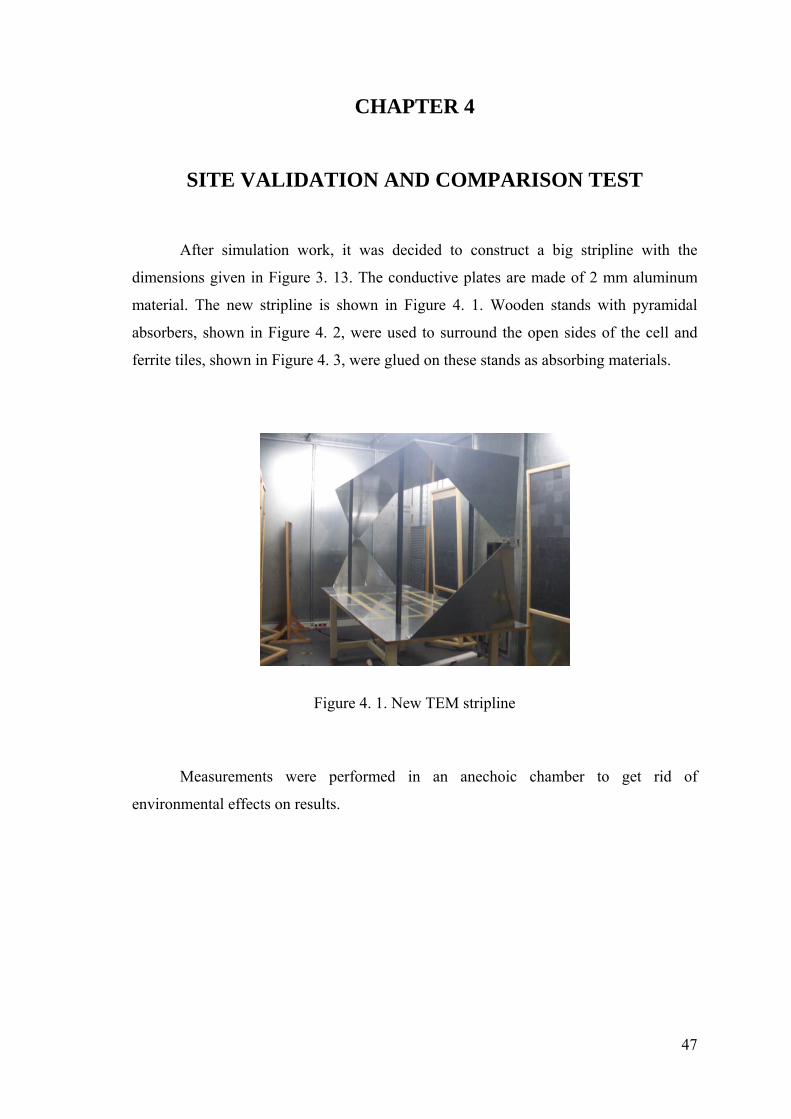
47
CHAPTER 4
SITE VALIDATION AND COMPARISON TEST
After simulation work, it was decided to construct a big stripline with the
dimensions given in Figure 3. 13. The conductive plates are made of 2 mm aluminum
material. The new stripline is shown in Figure 4. 1. Wooden stands with pyramidal
absorbers, shown in Figure 4. 2, were used to surround the open sides of the cell and
ferrite tiles, shown in Figure 4. 3, were glued on these stands as absorbing materials.
Figure 4. 1. New TEM stripline
Measurements were performed in an anechoic chamber to get rid of
environmental effects on results.

48
Figure 4. 2. Wooden stands with pyramidal absorbers
Figure 4. 3. Wooden stands covered with ferrite tiles
4.1. Validation of the Test Site
The input voltage of the stripline was set to the value which 3 V/m electric field
was seen at the center point of the stripline at 15 MHz as requested by EN55020. It was

49
33.6 dBm. Then this voltage was applied to the stripline and plate voltage was measured
for frequencies from 150 kHz to 150 MHz. The real measurement of the plate voltage
and the results obtained from simulation are given in Figure 4.4. In order to amplify the
signal generator output, RF amplifier is used. This value corresponds to 15.7 V emf
which is very close to 1.5 times the forward voltage of the EN55020 stripline. Clearly,
the height of the designed stripline is 1.5 times of the previous stripline. Then the input
voltage should be 1.5 times the voltage input for the EN55020 stripline which is 5 V
rms.
0.15 0.3 0.5 1 1.5 2 3 4 5 10 15 30 50 100 1501
10
100
Frequency (MHz)
Pla
te V
olta
ge (m
V)
ExperimentSimulationEN55020 Limits
Figure 4. 4. Nominal plate voltage vs frequency for big stripline
Field uniformity test setup according to IEC 61000-4-20 is shown in Figure 4. 5.
Twelve points shown in Figure 4. 6 were used to test field uniformity. The six points on
the left side were named plane 1 and the six points on the left side were named plane 2.
They are placed 0.5 m left and right of the center. The length of the testing volume “L”
was defined as the distance between plane 1 and plane 2 which was 1 m. Then, the
electrical field between plate 1 and 2 is assumed to be uniform.

50
Figure 4. 5. Field uniformity measurement
Figure 4. 6. Field uniformity points
Uniform area was selected according to the IEC 61000-4-20 which is a vertical
plane orthogonal to the propagation direction of the field. Table B.1 in this standard was
used to determine the uniform area calibration points so 0.5 m x 1.0 m dimension was
measured and evaluated at the both ends.
Usable test volume was determined between these planes. Evaluation results of
the measurements show that 100% of frequency points are inside of the 0-6 dB
tolerance range allowed by the standard. Then the testing field area can be considered as
uniform area according to IEC 61000-4-20 [26].
Using EMC 32 software, the maximum deviation of the electric fields at the
uniformity points were plotted with respect to testing frequency range which is 150 kHz

51
to 150 MHz. The deviation for plane 1 was plotted in Figure 4. 7 and the deviation for
plane 2 was plotted in Figure 4. 8. The solid line is determined by taking the difference
between the maximum and minimum field strengths of the six points for each frequency
for plane 1 and 2. According to IEC 61000-4-20, one point can be omitted to evaluate
the field uniformity. The dashed line is determined by omitting the point which
contributes to the difference the most. Then, the dashed line is drawn by taking the
difference between the maximum and minimum field strengths of the five points for
each frequency for plane 1 and 2. Figures 4. 7 and 4. 8 show that, the maximum
deviation was much lower than 6 dB throughout the testing frequency range. The
maximum deviation was 5 dB at about 3 MHz. This means that test repeatability is
better than the FAR testing.
Figure 4. 7. Field uniformity deviations for whole frequency band for plane1
Figure 4. 8. Field uniformity deviations for whole frequency band for plane2

52
The new design was verified with network analyzer Rohde&Schwarz ZVL13.
The impedance, S11 and VSWR of the whole system were measured. Measurement
setup with the network analyzer is shown in Figure 4.9.
Figure 4. 9. Measurement of network analyzer
Measured characteristic impedance is shown in Figure 4.10. The graph shows
that impedance matching for the whole system is very good. The worst mismatch is
43.116 Ω at 149 MHz.
Figure 4. 10. Impedance of the whole system

53
VSWR of the whole system is shown in Figure 4. 11. The worst value was 1.343
at 150 MHz. No resonances appeared and very good efficiency was obtained according
to this result.
Figure 4. 11. VSWR of the whole system
Figure 4. 12 shows S11 (reflection coefficient) of the whole system. The results
are very satisfying.
Figure 4. 12. S11 of the whole system

54
4.2. TV Comparison Tests
In order to validate the new stripline, test results must be compared as required
by EN55020. The result obtained from the standard and the new stripline must not differ
by more than 2 dB to validate the new design.
(a) (b)
Figure 4. 13. Testing of same TV set in the new (a) and EN55020 stripline setup (b)
A 32” TFT LCD product was located into the new stripline and it was tested
according to EN55020. This TV set has a touch pad card which was sensitive to
electromagnetic waves in the environment. For this reason, this sample was selected for
suitable comparison. The new setup is shown in Figure 4. 13 (a) and the EN55020
stripline is shown in Figure 4 .13 (b).
The TV set was tested in EN55020 stripline and it was observed that menu was
displayed and sometimes it was switched off at 12.4 MHz. The related test software
snapshot is given in Figure 4. 14. There is a malfunction of the device at this frequency
which is related to touchpad card. The disturbance level which causes this effect is 130
dBμV/m.

55
Figure 4. 14. EN55020 stripline test results for 32” TFT LCD product
It was observed that there was malfunction at nearly the same frequency in the
new stripline. The disturbance level for this case was about 3.56 V/m. This corresponds
to 131 dBμV/m which is almost 1 dB above the level (130 dBμV/m) found in normal
stripline. Based on this result, maximum 2 dB deviation in equivalent tests was fulfilled
which is allowed by EN55020. Then the new stripline was validated to be used fo
radiated immunity testing. The related test software snapshot is given in Figure 4. 15.
0
1
2
3
4
5
6
150k 300 500 1M 2M 3M 5M 10M 20 30 50 100M 150M
Imm
Lev
el in
V/m
Frequency in Hz
TargetLevel
12,438880 MHz3,567 V/m
Figure 4. 15. New TEM stripline test results for 32” TFT LCD product

56
CHAPTER 5
CONCLUSION
Understanding EMC is important to produce reliable interference-free products
and EMC testing is the key to demonstrating that well designed equipment meets
legislative and contractual requirements, including the European Community (EC)
regulations.
In this thesis, a new TEM stripline was designed and constructed for the purpose
of immunity to radiated fields testing according to EN55020. Suggested stripline in this
standard is not suitable for big TFT LCD products which are higher than 0.7 m.
The standard describes an alternative method for this test. However, it has to be
performed in an anechoic chamber with different frequency range (narrower) from the
test defined in a suggested stripline. This alternative test site has lower test repeatability
and consumes more power.
The stripline is designed by taking into the account that its purpose is to test TV
sets which are higher than 0.7 m. Then the dimensions of the stripline had to be chosen
to provide largest possible test area for the frequency range 150 KHz – 150 MHz while
maintaining standard characteristic impedance of 150 Ω. Dimensions were chosen to
provide more space in vertical dimension.
Microstrip design formulas were used to calculate the dimensions of the stripline
and characteristic impedance. The stripline consists of parallel plate transmission lines
tapered at each end to adapt connectors. One end of the tapered section has nominal
impedance of 150 ohm and the other end has matching network which is a 50 Ω to 150
Ω resistive network to match the voltage source to the line. By using these resistive
networks minimum voltage standing wave ratios (VSWR) was ensured. 1.343 VSWR
was measured during the verification of the stripline and it was very good result in
terms of efficiency.
Electromagnetic field is created inside the stripline when RF energy is coupled
to the line from the system consisting of RF signal source and amplifier at the 50 Ω
input of the matching network.

57
Theoretical analyses were made to check the validity of the stripline calibration
curve by using a computational electromagnetic simulation program (EMCoS) where
simulation was made [32]. After analyzing the resonances seen in the simulations, it
was obvious that the stripline must have been properly loaded and that only the TEM
mode of propagation be sustained with using ferrite tiles and pyramidal absorbers
covered plates.
It is known that, parallel plate stripline radiates a significant amount of energy
away from itself and must be used inside a shielded enclosure. For this reason, new
TEM stripline was located in a shielded room.
It was seen that the terminating resistors and absorbers reduced the magnitudes
of internal standing waves and resonances and absorbed unwanted propagation modes.
It was verified from the field uniformity measurements performed according to the
standards. Despite the requirement of the standard is 6 dB for %75 of the frequency
points, %100 was achieved.
Simulation of the plate voltage for new stripline was similar to the real
measurement; this plate voltage should be used as nominal plate voltage for TV testing.
There are other correction factors to establish the nominal field strength inside the
stripline when a TV set is located at the testing area. K1 and K2 factors are used to
compensate the attenuation on the measuring plate so there is more repeatability rather
than testing in an anechoic chamber.
The main design benefits that achieved from this project can be summarized as
follows:
• larger usable test area;
• upper useful frequency limit 150 MHz was obtained even though the plate
spacing is greater than 0.5 wavelength of this frequency
• minimize cell impedance mismatch or voltage standing wave
• required field uniformity was obtained (better than %75 for an anechoic
chamber)
The real advantage of using TEM transmission striplines for making
susceptibility testing is the elimination of background interference without the
introduction of measurement problems associated with anechoic chambers.
Furthermore, no EM fields are generated external to the stripline. The striplines
produce uniform and readily determined fields. Shielded enclosures on the other hand

58
reflect the emitted energy from their walls in such a complicated manner that prediction
of the enhancement or interference of the desired signal is extremely difficult.
Measurements using the stripline are simple to make and require a minimum of
detection equipment, e.g., no additional antennas are required.
The test field established by a parallel-strip transmission closely approximates
uniform plane waves. The new stripline technique discussed has the advantage of
creating a test field more accurate than the field which was created by an antenna.
Electrical field intensity as high as 3 volts per meter can be established across 50 Ω with
a signal generator and an RF amplifier. The same intensity would require much more
complex equipment if an antenna was used in an anechoic chamber. The simplicity of
the line allows a high degree of repeatability. Stripline test technique has an advantage
of cost efficiency compared to antenna system used in an anechoic chamber.
Finally, the main target, which is the 2 dB criteria given in EN55020 standard,
was achieved by the new construction [1]. Because maximum 2 dB deviation was
observed in equivalent tests for the same EUT. Same malfunction at exactly the same
frequency was obtained with 1 dB disturbance level difference. Therefore this new
TEM stripline can be used for wide range of TV sets and different assessment of EMC
performance from product to product can be eliminated.

59
REFERENCES
[1] Sound and Television Broadcast Receivers and Associated Equipment –
Immunity Characteristics – Limits and Methods of Measurement Specification, CENELEC Std. EN55020, 2007.
[2] Testing and measurement techniques – Radiated, radio-frequency,
electromagnetic field immunity test specification, IEC Std. 61000-4-3, ed.3, 2006.
[3] T. H. Jang and W. S. Cho, “Radiated immunity measurement comparison
between OSL and chamber”, in 17th International Zurich Symposium on Electromagnetic Compatibility, 2006, pp. 477-480.
[4] M. L. Crawford, “Generation of standard EM fields using TEM transmission
cells,” IEEE Transaction on Electromagnetic Compatibility, vol. 16, pp. 189-195, Nov. 1974.
[5] S. Deng, T. Hubing, and D. G. Beetner, ”Characterizing the electric field
coupling from IC heatsink structures to external cables using TEM cell measurements,” IEEE Transaction on Electromagnetic Compatibility, vol. 49, no:4, pp. 785-791, Nov. 2007.
[6] F. Fiori and F. Musolini, “Measurement of integrated circuit conducted
emissions by using a transverse electromagnetic mode (TEM) cell”, IEEE Transaction on Electromagnetic Compatibility, vol. 43, no. 4, pp. 622-628, Nov. 2001.
[7] B. E. Roseberry and R. B. Schulz, “A parallel stripline for testing of RF
susceptibility”, IEEE Transaction on Electromagnetic Compatibility, vol. 7, pp. 142-150, Jun. 1965.
[8] M. Valek, T. Korinek, and T. Bostik, “Design of stripline for EMC testing,” in
14th IEEE Conference on Microwave Techniques, 2008, pp. 1-4. [9] Measurement of audio-frequency noise voltage level in sound broadcasting,
ITU-R Std. BS.468-4, 1986.

60
[10] Nomenclature and description of colour bar signals, ITU-R Std. BT.471-1, 1986.
[11] P. Groenveld and A. de Jong, “A Simple RF Immunity Test Set-up”, in IEEE
2nd Symposium on EMC, 1977, pp 233-239. [12] Electromagnetic compatibility for industrial-process measurement and control
equipment - part 3: radiated electromagnetic field requirements, IEC Std. 801-3, 1984.
[13] T. Williams, EMC for Product Designers, 3rd ed., Great Britain: Newnes, 2001. [14] D. Morgan, A Handbook for EMC Testing and Measurement, 1st ed., Milton
Keynes, United Kingdom: The Institution of Engineering and Technology, 1994.
[15] H. Howe, Stripline Circuit Design, 1st ed., US: Artech House, 1974. [16] D. M. Pozar, Microwave Engineering, 2nd ed., United States of America: John
Wiley and Sons Inc., 1998. [17] D. Anke and D. Busch, “Parallel-Plate Antennas: Field Distortion Caused By
Test Objects”, Institution of Electronic & Radio Engineers, vol:55(6), pp.210-216, 1985.
[18] K. C. Gupta., R. Garg. and I. J. Bahl, Microstrip Lines and Slotlines, US:
Artech House, 1979. [19] Z. Jingjun and F. Junmei, “Higher order mode cutoff frequencies in TEM cells
calculated with TLM method,” IEEE Transaction on Electromagnetic Compatibility, vol. 30, no. 4, pp. 563-566 Nov. 1998.
[20] P. F. Wilson and M. T. Ma, “Simple approximate expressions for higher order
mode cutoff and resonant frequencies in TEM cells,” IEEE Transaction on Electromagnetic Compatibility, vol. 28, no. 3, pp. 125-130, Aug. 1986.

61
[21] J. Kuveda and R. K. Libla, “Determination of frequency range limit when using stripline as emission or immunity test methods,” in IEEE International Symposium on Electromagnetic Compatibility, vol. 3, pp. 823-828, Aug. 2006.
[22] R. Lampe, P. Klock, D. Tanner, and P. Mayes, “Analysis and experiment
concerning the cutoff frequncies of rectangular striplines,” IEEE Transactions on Microwave Theory and Techniques, vol. MTT-34, no. 8, pp. 898-899,Aug. 1986.
[23] M. Golio and B. Raton, The RF and Microwave Handbook, US: CRC Press
LLC, 2001. [24] M. J. Alexander, P. S. Bansal, and K. P. Holland, “The Use And Calibration of
Small Dipole And Loop Antennas”, in IEEE Colloquium on Calibration of Antennas for Close Range Measurements, 1990, pp. 2/1–2/3.
[25] ETSI, “Electromagnetic compatibility and radio spectrum matters (ERM);
improvement on radiated methods of measurement (using test site) and evaluation of the corresponding measurement uncertainties; part 5: striplines,” ETSI TR 102 273-5 v1.2.1, 2001-12.
[26] Electromagnetic Compatibility (EMC) – Part 4-20: Testing and measurement
techniques – Emission and immunity testing in transverse electromagnetic (TEM) waveguides specification, IEC Std. 61000-4-20, ed. 2, 2010.
[27] K. Malaric and J. Bartolic, “Design of a TEM-cell with increased usable test
area,” Turkish Journal of Electrical Engineering and Computer Sciences, vol. 11, no. 3, pp. 143-154, 2003.
[28] L. Carbonini, “Comparison and analysis of a WTEM cell with standard TEM
cells for generating EM fields,” IEEE Transaction on Electromagnetic Compatibility, vol. 35, no. 2, pp. 255-263, 1993.
[29] W. Bittinger, “Properties of open strip lines for EMC measurements,” 1993
IEEE International Symposium on Electromagnetic Compatibility, pp. 120-125, 1993.
[30] Software for EMC measurements, Rohde&Schwarz, ver. 8.40, Munich, 2010.
62
[31] Y. C. Chung, T. W. Kang, and D. C. Park, “Design and construction of stripline for measuring electromagnetic immunity of vehicular electrical cables,” Electromagnetic Compatibility Proceedings, 1997 International Symposium on, pp. 9-12, 1997.
[32] Emcos, EMC studio electromagnetic simulation software, ver.6.0.1, Georgia,
2010. [33] K. Shimada, T. Hayashi, and M. Tokuda, “Fully compact anechoic chamber
using the pyramidal ferrite absorber for immunity test,” in IEEE International Symposium on Electromagnetic Compatibility, vol.1, pp.225-230, 2000.

63
APPENDIX A
SUBCLAUSE 5.8 OF EN55020: MEASUREMENT OF
IMMUNITY FROM RADIATED FIELDS
A homogeneous, electromagnetic wave under free space conditions can be
simulated by a guided wave of the TEM (transverse electromagnetic) mode travelling between two flat conducting surfaces. In this case the electric field component is perpendicular, and the magnetic field component parallel, to the conductors. The open TEM stripline is specified in this standard.
A.1. The Open Stripline The constructional details of a suitable open stripline are shown in Annex E. The
open stripline has a frequency range usable up to 150 MHz and may be used for equipment under test up to 0.7 m high. The characteristic impedance of the stripline is 150 Ω.
The calibration and testing of the measuring set-up is performed as in Annex F. The input voltage of the stripline is set to produce the correct voltage at the
measuring plate, corresponding with the required field strength; at a frequency of 15 MHz.
The correction factor K1, established by the calibration, is taken into account during the further measurement procedure.
The use of TEM devices of other dimensions or types is acceptable if it is shown that in the relevant frequency range the results do not differ by more than 2 dB from the values measured in the recommended stripline.
A.2. Measurement Set-up The stripline shall be placed on non-metallic supports at least 0.8 m from the
floor, and the top conductor plate shall be no closer than 0.8 m from the ceiling. When used in a room, the stripline shall be spaced at least 0.8 m from its open
longitudinal sides to walls or other objects. When used inside a screened room, RF absorbing plates shall be placed in the space between the sides of the stripline and the walls of the screened room.
The equipment under test is placed on a non-metallic support, 0.1 m high, in the centre of the stripline in the same position as for normal home usage (e.g. in the case of portable equipment).
Connecting leads to the equipment under test are inserted through holes in the base conductor plate of the stripline, the lengths of the leads inside the stripline shall be as short as possible and completely surrounded by ferrite rings to attenuate induced

64
currents. The transfer impedance of coaxial cables used shall be no higher than 50 mΩ/m at 30 MHz.
The mains lead shall be bundled to a length less than 0.3 m. Any balanced-to-unbalanced transformer used shall be connected to the
equipment under test with leads as short as possible. Terminals of the equipment under test not used during the measurement shall be
terminated with shielded resistors matching the nominal terminal impedance. If equipment under test requires another apparatus in order to function properly,
that additional apparatus shall be considered as part of the measuring equipment and precautions shall be taken to ensure that the additional apparatus is not subject to the unwanted signal. This requires generally the placing of the other apparatus outside the stripline.
For the connections to the antenna terminal or to the video input terminal of the equipment under test, a high-grade coaxial cable with a high-grade connector at the antenna or video input terminal side shall be used. These precautions may include additional earthing of coaxial shields, shielding, and insertion of an RF filter on or application of ferrite rings to the connecting cables.
A.3. Measurement Procedure For adjusting the wanted signals the audio or video controls of the equipment
under test are set as described in D.2 and D.3. During the adjustment procedure the unwanted signal (generator G2) is switched off. The wanted signals are specified in Table A.1.
The required field strength is adjusted with the equipment under test inside the set-up as described in A.2. The equipment however is switched off during the adjustment.
For the measurement, the unwanted signal is supplied by generators G1 and G2 which is connected through wide-band amplifier Am, and low-pass filter F to matching network MN of the stripline. The wide-band amplifier Am may be required to provide the necessary field strength. The stripline is loaded with a terminating impedance TI.
Care shall be taken with respect to the harmonic level of the RF output of the generator G2 and in particular the output of the wide-band amplifier Am. Harmonics may influence the measurement if they coincide with the tuned channel or the IF channel of the equipment under test. In some cases provisions shall be made to reduce the harmonic level adequately by inserting a suitable low-pass filter F. Annex C describes the checking procedure for low-pass filters.
The audio output power levels shall be measured according to D.2. The unwanted signal shall be amplitude modulated with 1 kHz at 80 % depth,
supplied by generator G2 and amplifier Am. Measurements shall be performed while taking into account 4.1 and 5.1.
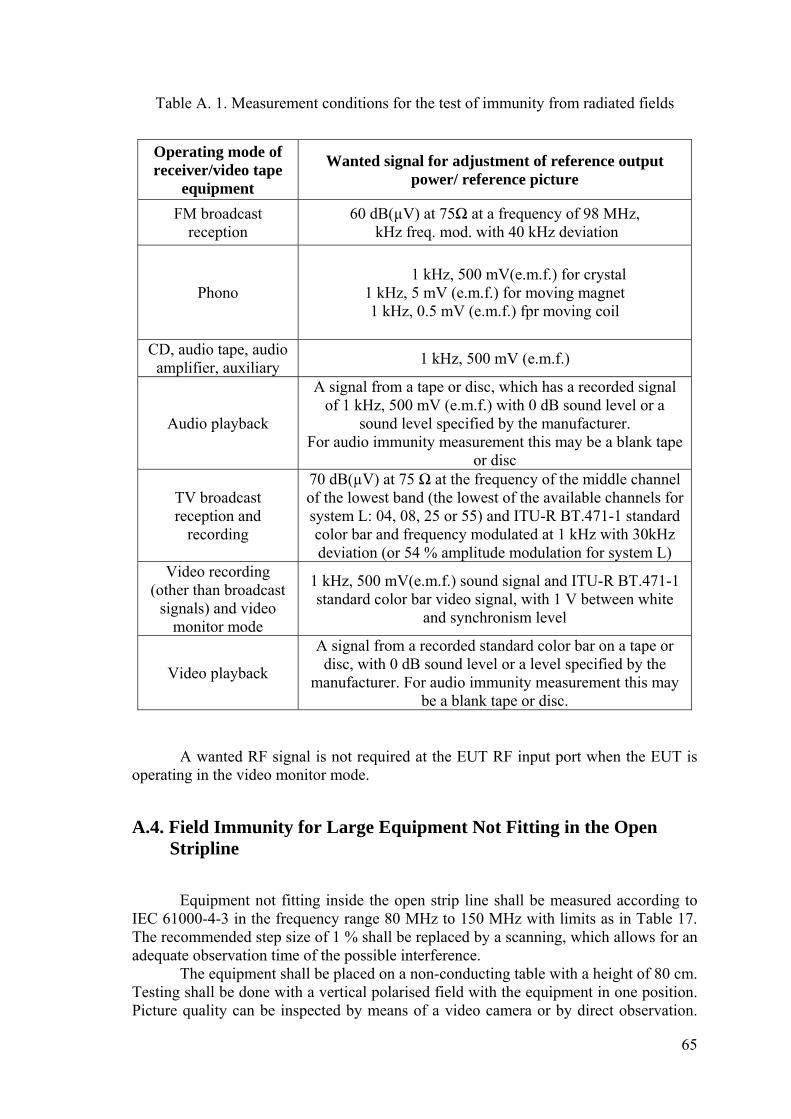
65
Table A. 1. Measurement conditions for the test of immunity from radiated fields
Operating mode of receiver/video tape
equipment
Wanted signal for adjustment of reference output power/ reference picture
FM broadcast reception
60 dB(µV) at 75Ω at a frequency of 98 MHz, kHz freq. mod. with 40 kHz deviation
Phono 1 kHz, 500 mV(e.m.f.) for crystal
1 kHz, 5 mV (e.m.f.) for moving magnet 1 kHz, 0.5 mV (e.m.f.) fpr moving coil
CD, audio tape, audio amplifier, auxiliary 1 kHz, 500 mV (e.m.f.)
Audio playback
A signal from a tape or disc, which has a recorded signal of 1 kHz, 500 mV (e.m.f.) with 0 dB sound level or a
sound level specified by the manufacturer. For audio immunity measurement this may be a blank tape
or disc
TV broadcast reception and
recording
70 dB(µV) at 75 Ω at the frequency of the middle channel of the lowest band (the lowest of the available channels for system L: 04, 08, 25 or 55) and ITU-R BT.471-1 standard color bar and frequency modulated at 1 kHz with 30kHz deviation (or 54 % amplitude modulation for system L)
Video recording (other than broadcast
signals) and video monitor mode
1 kHz, 500 mV(e.m.f.) sound signal and ITU-R BT.471-1 standard color bar video signal, with 1 V between white
and synchronism level
Video playback
A signal from a recorded standard color bar on a tape or disc, with 0 dB sound level or a level specified by the
manufacturer. For audio immunity measurement this may be a blank tape or disc.
A wanted RF signal is not required at the EUT RF input port when the EUT is
operating in the video monitor mode.
A.4. Field Immunity for Large Equipment Not Fitting in the Open Stripline
Equipment not fitting inside the open strip line shall be measured according to
IEC 61000-4-3 in the frequency range 80 MHz to 150 MHz with limits as in Table 17. The recommended step size of 1 % shall be replaced by a scanning, which allows for an adequate observation time of the possible interference.
The equipment shall be placed on a non-conducting table with a height of 80 cm. Testing shall be done with a vertical polarised field with the equipment in one position. Picture quality can be inspected by means of a video camera or by direct observation.

66
The arrangements concerning cables and filters are the same as for measurements in the open strip line.
The front side of the EUT shall be positioned parallel to the antenna line of sight. The position shall be described in the measurement report.

67
APPENDIX B
ANNEX E OF EN 55020: CONSTRUCTION
INFORMATION FOR THE OPEN STRIPLINE AND FOR
THE MAINS AND LOUDSPEAKER BAND-STOP FILTER
The basic configuration of the open stripline TEM device is given in Figure B.1,
an overview is given in Figure B.2. The nominal dimensions of the metal plates are given in Figure B.3. The construction details of both ends are given in Figure B.4 together with the
dimensions of the matching network MN and the terminating impedance TI (Figures B.5 and B.6 respectively).
Figure B. 1. Open stripline TEM device, basic configuration with matching network and terminating impedance

68
Key1 Top plate2 Bottom plate3 Plastic supports4 Wooden isolation table5 EUT
Figure B. 2. Overview of an open stripline TEM device
Figure B. 3. Constructional details of an open stripline, TEM device
(cont. on next page)

69
Key A Threaded screws M 5 x 15, maximum length 30 mmB Plastic bracing C Detail see Figure E.5D Blank at contacts (good electrical contact required with A and C) E Hole 25 mm in base plate for measuring probe
F Holes, 50 mm in base plate for mains cable passage Material metal thickness 3 mm to 5 mmDimensions in millimeters
Figure B.3. (cont.)
KeyG Connection pins diameter 1,3 mm to 1,5 mm, conductively connected to J H Insulating plate 4 mm thickI Threaded screws M 5 mm x 10 mm (countersunk head)J Contact intermediate plate made of tinplate 0,5 mm thick
Dimensions in millimeters
Figure B. 4. Supplementary constructional details of the open stripline TEM device
Figure B. 5. Matching network MN
(cont. on next page)

70
ComponentsBu1 Plug sockets for pins
Plug socket a Insulated Plug socket Connected to casing
Bu2 Coaxial socket 50ΩX(1) Plastic plate approx. 3 mm thick
Y Metal casing, approx. 40 mm x 30 mm x 15 mm, shown openZ Opening in metal casingR1 122.4 Ω (2x) soldered-in as close as possible R2 122.5 Ω soldered-in as close as possible
The matching network is suitable for a signal generator output impedance Dimensions in millimeters
Figure B.5. (cont.)
X(2) Plastic plate approx.3 mm thick
Figure B. 6. Terminating impedance TI

71
APPENDIX C
ANNEX F OF EN55020: CALIBRATION OF THE OPEN
STRIPLINE
An empty stripline with plates at distance h, should, for an input voltage Uin,
furnish a field strength E given by
inUEh
=
where E is the field strength in volts/meter Uin is the input voltage in volts h is the distance between the plates, in meters. In practice deviation from this relationship may be caused by mechanical
tolerances, material losses, internal reflections causing standing waves, radiation, etc. These deviations are in general dependent on frequency. For this reason it is necessary to calibrate a transfer factor, for each stripline, given by
inT E U= −
where T is the transfer factor in dB(m-1); Uin is the input voltage measured at the input to the adapting network of the stripline in dB(V); E is the field strength of the TEM wave in dB(V/m). For testing the field strength within the stripline according to Figure C.1 a metal-
plate with the dimensions 200 mm × 200 mm is positioned 10 mm above the base-plate of the stripline. The RF voltage of the measuring-plate related to the base-plate of the stripline is measured by using a RF millivoltmeter or an appropriate measuring apparatus. The termination by the measuring apparatus should be 3 pF parallel to ≥100 kΩ. The capacity of the measuring-plate related to the base-plate of the stripline is 35 pF. Above 10 MHz the termination resistance may decrease depending on the frequency (e.g. to 10 kΩ for 100 MHz). An example for the arrangement of the measuring apparatus is shown in Figure C.2.
The voltage value at the measuring-plate for an unmodulated signal from the unwanted signal generator of 10 V (e.m.f.) shall comply with the calibration curve of Figure C.3. The field strength within the stripline is then 3 V/m. This test shall be done
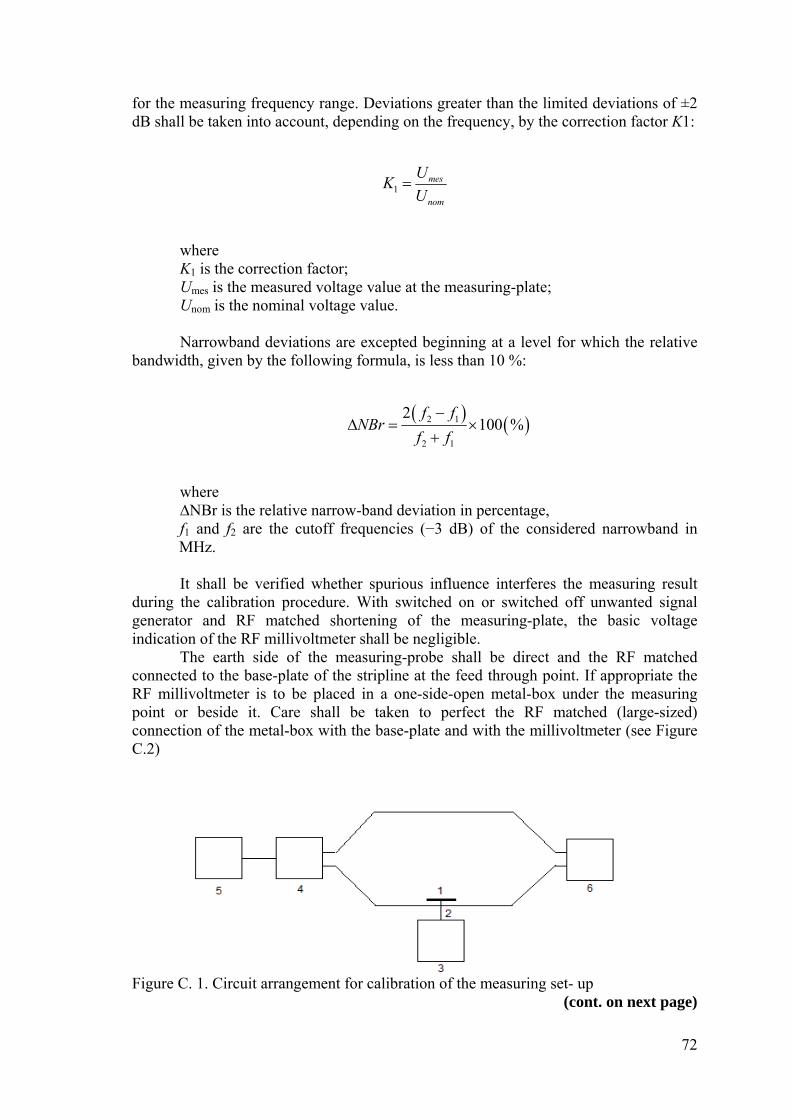
72
for the measuring frequency range. Deviations greater than the limited deviations of ±2 dB shall be taken into account, depending on the frequency, by the correction factor K1:
1mes
nom
UKU
=
where K1 is the correction factor; Umes is the measured voltage value at the measuring-plate; Unom is the nominal voltage value. Narrowband deviations are excepted beginning at a level for which the relative
bandwidth, given by the following formula, is less than 10 %:
( ) ( )2 1
2 1
2100 %
f fNBr
f f−
Δ = ×+
where ∆NBr is the relative narrow-band deviation in percentage, f1 and f2 are the cutoff frequencies (−3 dB) of the considered narrowband in MHz. It shall be verified whether spurious influence interferes the measuring result
during the calibration procedure. With switched on or switched off unwanted signal generator and RF matched shortening of the measuring-plate, the basic voltage indication of the RF millivoltmeter shall be negligible.
The earth side of the measuring-probe shall be direct and the RF matched connected to the base-plate of the stripline at the feed through point. If appropriate the RF millivoltmeter is to be placed in a one-side-open metal-box under the measuring point or beside it. Care shall be taken to perfect the RF matched (large-sized) connection of the metal-box with the base-plate and with the millivoltmeter (see Figure C.2)
Figure C. 1. Circuit arrangement for calibration of the measuring set- up (cont. on next page)
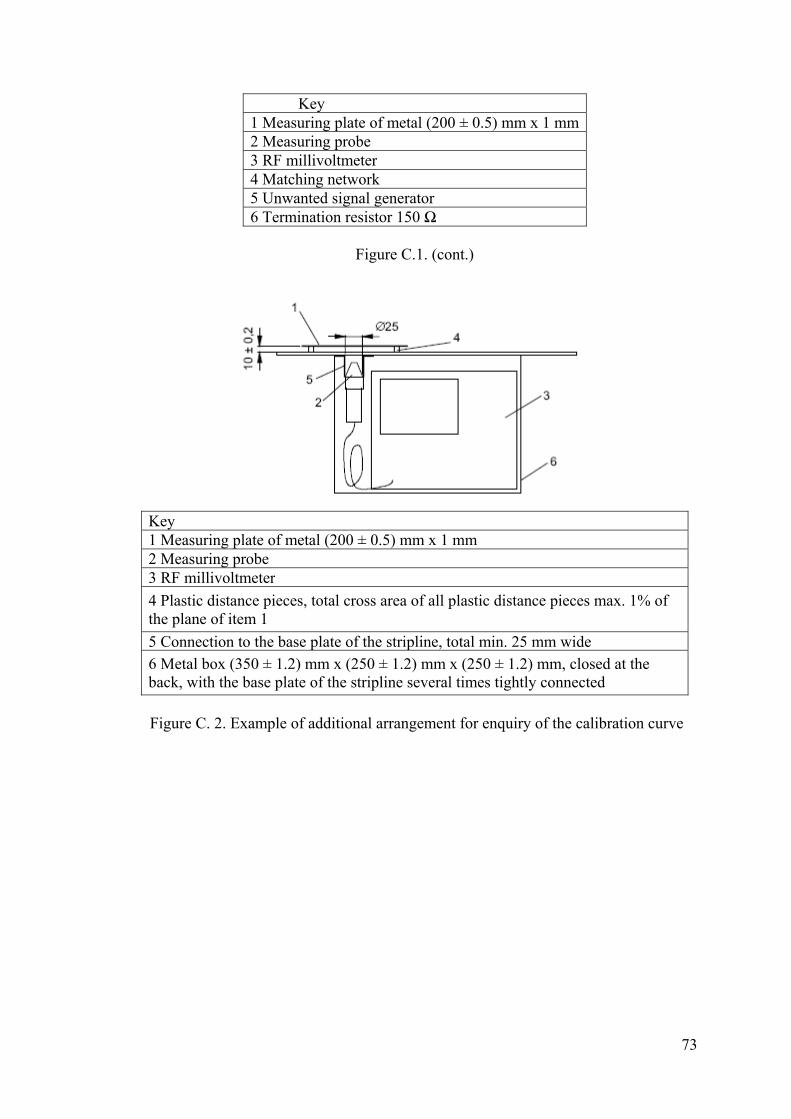
73
Key 1 Measuring plate of metal (200 ± 0.5) mm x 1 mm 2 Measuring probe 3 RF millivoltmeter4 Matching network5 Unwanted signal generator 6 Termination resistor 150 Ω
Figure C.1. (cont.)
Key 1 Measuring plate of metal (200 ± 0.5) mm x 1 mm 2 Measuring probe 3 RF millivoltmeter 4 Plastic distance pieces, total cross area of all plastic distance pieces max. 1% of the plane of item 1 5 Connection to the base plate of the stripline, total min. 25 mm wide 6 Metal box (350 ± 1.2) mm x (250 ± 1.2) mm x (250 ± 1.2) mm, closed at the back, with the base plate of the stripline several times tightly connected
Figure C. 2. Example of additional arrangement for enquiry of the calibration curve

74
Figure C. 3. Calibration curve
Voltage at the measuring plate depends on the measuring frequency for 10 V
e.m.f. voltage level of the unwanted signal generator and the ranges of the limited deviations of +/- 2 dB for the measuring setup. The field strength within the stripline is them 3 V/m.

75
APPENDIX D
SUBCLAUSE 5.2 OF EN55020: PERFORMANCE
ASSESSMENT
D.1. Measurement Procedure for Audio Assessment
First the wanted test signal is applied to the equipment under test. This produces
a wanted audio signal which is measured. The volume control of the equipment under test or test set-up is adjusted to set
this audio signal at the required level. The wanted audio signal is then removed by switching off the modulation or the audio test signal.
The "unwanted" disturbance signal is applied in addition and its frequency is swept through the test range; its level is kept at the relevant limit value.
The evaluation of the interference is made by measuring the level of the unwanted output signal and comparing this to the wanted output signal level.
NOTE: Concerning the measurement procedure for the criterion of sound interference of television receivers the frequency of the unwanted signal is adjusted to the relevant values.
Concerning the measurement procedure for the criterion of sound interference of video tape equipment with automatic modulation control, the modulation of the sound carriers of the wanted test signal or the wanted audio test signal shall not be switched off continuously but switched off and on at an appropriate low rate (e.g. 10 s off and 1 s on).
The equipment under test is considered to meet the requirements if the conditions of 4.1.1.1 are fulfilled.
D.2. Audio Power-output Measurement
The measurements shall be performed with the flattest possible audio-frequency
response. If this flat response is not clearly marked at the controls, the control setting shall be as prescribed by the manufacturer and recorded in the test report.
The audio power at the output of the equipment under test shall be measured as follows:
a) For equipment under test with audio power output available through an external loudspeaker connector, the levels of the wanted and the unwanted audio signals are measured at the external loudspeaker terminals across the load impedance specified by the manufacturer.
b) For equipment under test without an audio power output, such as a radio tuner, tape or record deck, an audio amplifier can be provided and connected to the audio output under test. Level measurements are made at the output of the amplifier. The volume control, if any, of the equipment under test shall be set at the mid-position.

76
The volume control of the audio amplifier provided shall then be adjusted to obtain the required level of the wanted audio signal. The amplifier noise shall be at least 50 dB below the level of the wanted signal. Care shall be taken to ensure that the amplifier is not subjected to the effects of the unwanted signal. As an alternative method, measurements can be made directly at the audio output connector of the EUT. The reference level is in this case related to the output level caused by the wanted input signal. The volume control of the EUT, if any, shall be set at the mid-position.
c) For equipment under test with audio power output fed to a built-in loudspeaker having no external loudspeaker connector, the audio signal levels are measured by placing a small high quality microphone (a directional type may be required) close to the front of the builtin loudspeaker under test. The microphone output is fed through a screened cable (ferrite loaded as required) to an external amplifier, filter and audio voltmeter to measure the audio output power. The microphone-audio voltmeter measurement chain shall be calibrated by the use of a loudspeaker of a type similar to the one in the equipment under test, placed at the same distance as that used in the measurement, and supplied with a 1 kHz tone at the required levels.
NOTE: Care should be taken that ambient noise does not adversely influence the measurement results.
As an alternative method, avoiding the use of a microphone, the speaker leads are taken out from the internal speaker of the EUT and are connected through a relevant filter to the audio voltmeter across the rated load impedance, specified by the manufacturer.
For the measurement of input immunity, filter FR shall be of a 15 kHz low-pass type (see annex B). The audio frequency voltmeter shall be provided with a weighting filter according to ITU-R BS.468-4. The quasi-peak value shall be measured.
For the measurement of immunity from conducted voltages, radiated fields and conducted currents, filter FR shall be of a 0.5 kHz to 3 kHz band-pass type (see annex B). The audio frequency voltmeter shall be applied without weighting filter. The r.m.s. value shall be measured.
In case of dispute, the measurement method mentioned in the test report shall be verified.
D.3. Measurement Procedure for Video Assessment
The standard picture is a pattern consisting of vertical colour bars in accordance
with ITU-R BT.471-1, 100/0/75/0 (see Figure A1b of the ITU-R Recommendation). First the wanted signal only is applied to the equipment under test. The controls
of the equipment under test are set to obtain a picture of normal brightness, contrast, and colour saturation. This is obtained with the following luminance values:
− black part of the test pattern 2 cd/m2; − magenta part of the test pattern 30 cd/m2; – white part of the test pattern 80 cd/m2. NOTE: The luminance of the magenta bar is set to 30 cd/m2. If this level cannot
be reached, the luminance is set as close as possible to 30 cd/m2. If a value different from 30 cd/m2 is used, this is stated together with the results.
The unwanted signal is then applied in addition, its frequency adjusted to the relevant values (an accuracy of ±fline/2 may be necessary, where fline = 15.625 Hz, horizontal scan frequency). The level of the unwanted signal shall be maintained at the

77
relevant limit value at each frequency. The equipment under test is considered to meet the requirement if the conditions of 4.1.1.2 are fulfilled (see ITU-R BT.500-10).
The degradation is more rapidly discerned and the variation of results due to individuals is reduced, if the unwanted signal is switched on and off at a low rate (about 0.5 Hz) during the test. This can be done manually or automatically by an electronic timer.