design and application of gas-gap heat switches - nasa · design and application of gas-gap heat...
TRANSCRIPT

JPL Publication 90-38 _
Design and Application of Gas-GapHeat Switches
Final Report of Phase II
C. K. Chan
R. G. Ross, Jr.
(NASA-CR-187339) DESTGN ANO APPLTCATTQN OFGAS-GAP HEAT SWTTCHES Fin_l Report (JPL)
62 p CcCL 09C
N91-10222
unclesG3133 0BI0154
March 15, 1990
Prepared for
Air Force Space Technology CenterKirtland Air Force Base
Under the Sponsorship of the
Strategic Defense Initiative Organization
by
Jet Propulsion LaboratoryCalifornia institute of TechnologyPasadena, California
https://ntrs.nasa.gov/search.jsp?R=19910000909 2020-03-17T23:19:30+00:00Z

JPL Publication 90-38
Design and Application of Gas-GapHeat Switches
Final Report of Phase II
C. K. ChanR. G. Ross, Jr.
March 15, 1990
Prepared for
Air Force Space Technology CenterKirlland Air Force Base
Under the Sponsorship of the
Strategic Defense Initiative Organizationby
Jet Propulsion LaboratoryCalifornia Institute of TechnologyPasadena, California

ABSTRACT
Gas-gap heat switches can serve as an effective means of
thermally disconnecting a standby cryocooler when the primary
(operating) cooler is connected and vice versa. This report
describes the final phase of the development and test of a
cryogenic gas-gap heat switch designed for loads ranging from 2
watts at 8K, to I00 watts at 80K. Achieved heat-switch on/off
conductance ratios ranged from ii,000 at 8K to 2200 at 80K.
A particularly challenging element of heat-switch design is
achieving satisfactory operation when large temperature differ-
entials exist across the switch. A special series of tests and
analyses was conducted and used in this Phase-II activity to
evaluate the developed switches for temperature differentials
ranging up to 200K. Problems encountered at the maximum levels
are described and analyzed, and means of avoiding the problems
in the future are presented. The report concludes with a
comprehensive summary of the overall heat-switch design method-
ology with special emphasis on lessons learned over the course
of the 4-year development effort.
iii

ACKNOWLEDGEMENTS
This publication reports the work performed under NASA Task RE-182, Amendment 403, with the Air Force Space Technology Center,Kirtland AFB, New Mexico, under the sponsorship of the StrategicDefense Initiative Organization.
The successful completion of this heat-switch development effortrequired important contributions from a number of individuals.Particular credit is due J. Gatewood, who fabricated the compo-nents and experimental apparatus, K. I. Boudaie, who conductedthe experiments, B. Lee, who conducted the computer thermalanalyses, and C. P. Kuo, who conducted the finite elementstructural analyses.
Dr. C. K. Chan served as manager and principal investigator from
the start of the project in March 1985 until November 1988, when
he left JPL to join TRW. After November 1988, Dr. Chan contri-
buted to the final report via a JPL subcontract #958485 with
TRW. Dr. R. G. Ross, Jr. managed the task following Dr. Chan's
departure from JPL, including co-authoring, and publishing this
final report.
Special thanks are due Dr. A. L. Johnson and J. Ligda of the
Aerospace Corporation for their many comments and suggestions
over the course of this development effort.
iv

TABLE OF CONTENTS
1i. INTRODUCTION .....................
i.i SUMMARYOF THE PHASE I DEVELOPMENTEFFORT ...... 2
1.2 PHASE II HEAT SWITCH DEVELOPMENT .......... 2
1.3 HEAT SWITCH DESIGN GENERALIZATION .......... 4
2. PHASE II HEAT SWITCH DEVELOPMENTAND TESTING ....... 5
2.1 DESIGN AND HARDWARECONSTRUCTION .......... 5
2.2 LOWTEMPERATURETESTS ................ 5
2.3 TESTS WITH LARGETEMPERATUREDIFFERENTIALS ..... i0
3. ANALYSESOF PERFORMANCELIMITATIONS CAUSEDBY LARGETEMPERATUREDIFFERENTIALS ............... 19
3.1 AXIAL EXPANSION DIFFERENCES ............. 19
3.2 RADIAL EXPANSION DIFFERENCES ............ 20
3.3 THERMALWARPING ................... 20
4. HEAT SWITCH DESIGN GUIDELINES............... 27
4.1
4.2
4.3
4.4
4.5 SORPTION PUMPDESIGN
ESTABLISHING DESIGN REQUIREMENTS .......... 28
DESIGNING FOR THE 'ON' RESISTANCE .......... 31
SWITCH GEOMETRYSELECTION .............. 38
ASSESSING THE 'OFF'-MODE PERFORMANCE........ 42
................ 48
5. SUMMARY.......................... 52
6. REFERENCES........................ 53
v

Fiqures
i-i Copper Fin Heat Switch Assembly ............ 3
2-1 Gold-Plated Heat Switch Assembly ............ 6
2-2 Components of Gold-Plated Heat Switch ......... 7
2-3 Support Tube with Three Ribs .............. 8
2-4 Analytical and Experimental Conductance of Copperand Gold-Plated Heat Switches When (i) Gaps are
Filled with Gas at 1 atm (gas), (2) Gas is Supplied
from the Gas Adsorption Pump ('on' mode) with the
Temperature at the Cold End at 4.2 K .........
2-5 Analytical and Experimental Conductance of
Copper and Gold-Plated Heat Switches When
(i) Gaps are Pumped Out (no gas), (2) Gas is
Removed by the Gas Adsorption Pump ('off' mode)
with the Temperature at the Cold End at 4.2 K ..... II
2-6 Photo of Heat Switch Test Apparatus .......... 13
2-7 Heat Conduction of the Gold-Plated Heat Switch
in the 'Off' Mode With and Without the External
Radiation Shield ................... 15
2-8 Comparison of the Heat Conduction of the Gold-
Plated and Copper Heat Switches in the 'Off' Mode
With No External Radiation Shield .......... 16
2-9 Electrical Resistance of Heat Switches ......... 18
3-1 Asymmetrical Fin Arrangement of the Phase Iand Phase II Heat Switches .............. 22
3-2 Deformation Pattern Under (a) No Stress,
b) Thermal Gradient, (c) Atmospheric Pressure
for 0.004 inch Wall, (d) Atmospheric Pressure
for 0.002 inch Wall .................. 25
3-3
4-1
Relative Gap Motion (in 10 .3 inch) Due to a
Temperature Difference of 220 K Across the Switch 26
Network Model of the Heat-switch/Cooler/Load
Interface ....................... 29
4-2 Effect of Heat-switch on/off Resistance Ratio on
Total Refrigeration Load and Heat-switch Hot-side
Temperature (R,=2K/W) ................. 32
I

Fiqures (Con't)
4-3 Thermal Conductivity of High Purity Coppers as
a Function of Temperature ............... 34
4-4 Gas Pressure Bounds for the Continuum and Free-
Molecular Conduction Regimes for N 2, H 2 and He .... 36
4-5 Thermal Conductivity versus Temperature for
Various Gases in the Continuum Regime ......... 37
4-6 Trial Heat-switch Configuration for Example
l-watt/60K Stirling Cooler .............. 39
4-7 Coefficient of Thermal Expansion for Copper,
300 Series Stainless Steel and Titanium 6AI4V ..... 41
4-8 Thermal Conductivity Data for 300 Series Stain-
less Steel and Titanium 6AI4V ............. 44
4-9 Modified Heat-switch Configuration for Reduced
Support-tube Conductance ................ 46
4-10 Conductance of Different Gases in the Free-
molecular Conductance Regime .............. 49
4-11 Sorption Isotherm Data for Helium and Hydrogenon PCB Charcoal .................... 51
Tables
2-1 Comparison of 'On' and 'Off' Conductance and
Switch Ratio for the Copper and Gold-Plated Heat
switches with a cold-side temperature of 4.2 K
and a hot-side temperature of 11.8 K ......... 12
vii

SECTION 1
INTRODUCTION
In applications where redundant cryocoolers are attached to asingle load it is generally necessary to have a means ofthermally disconnecting standby (nonoperating) coolers whenprimary units are operating, and vice versa. This disconnectionis required because the parasitic heat conduction fromnonoperating unit(s) is often equal to or greater than theuseful cooling available from the operating unit(s).
One means of achieving the thermal disconnection function is agas-gap heat switch. This device provides selectable thermalcoupling/thermal isolation depending on the presence/absence ofa conductive gas introduced in the narrow gap between the twosides of the switch. Key design parameters of a gas-gap heatswitch include:
i) Achieving low radiation and conduction losses across theswitch in the 'off' state.
2) Achieving high thermal conductance (low AT) across theswitch in the 'on' state.
3) Providing for a reliable switchable source of gas (andvacuum) to the gap.
This report documents the final (second) phase of a JPL contractconducted for the Air Force Space Technology Center, Kirtland
AFB, N.M., to develop a heat switch for application at
temperatures ranging from 8K to 80K.
The objective of the overall contract activity, which started in
1985, was to develop and demonstrate a gas-gap heat switch with
the following performance goals:
Stage
Cold Cooler
Plate Load
Temperature Capability
Temperature DifferenceBetween Cold Plate
and Cold Finger
First Stage
Second Stage
Third Stage
85 K 70 to I00 watts AT = 5 K
22 K 20 watts AT = 2 K to 5 K
9 K 2 watts AT = 1 K

I.i SUMMARYOF THE PHASE I DEVELOPMENTEFFORT
In the first phase of the heat switch development effort aprototype heat switch was designed, analyzed, fabricated andtested over the range of cryogenic temperatures from 8K to 80K.
Figure i-I illustrates the Phase I heat switch design. Theprincipal feature of the switch is the use of multiple inter-leaved copper fins to achieve a high surface area and narrow gasgap (0.002 inch). This maximizes thermal conduction andminimizes the temperature drop across the gap when the switch isin the 'on' state. The fins on each switch half were machinedusing wire electrical discharge machining (EDM), followed byhand lapping. 'Off'-state conduction losses were kept low byusing a low-conduction stainless steel tube (2 inch diameter x 2inches long x 0.004 inch thick) to support the switch halves andprovide the required gas/vacuum enclosure. Operation of theswitch is controlled by alternately heating or cooling acharcoal sorption bed; when the charcoal is heated, it liberatesthe sorbed gas into the gas gap; when it is cooled, it resorbsthe gas, thus creating a vacuum in the gas gap.
Testing of the Phase I heat switch was carried out at threecryogenic temperature levels, 80K, 20K and 8K using fourdifferent working fluids: neon, nitrogen, hydrogen and helium.The 'on' conductance was measured as 5 W/K at 10K, 8 W/K at 20K,and ii W/K at 80K. The switch ratio of 'on' conductance to'off' conductance increased from 2200 at 80K, 7500 at 20K, toii,000 at 10K. The major heat leaks across the switch wereconduction down the stainless steel peripheral support tube, andradiation between the copper faces of the heat-switch fins.
The design methodology, mechanical drawings, and assemblyprocess for the Phase I switch are detailed in the 183-pagePhase I Final Report (Reference i). This report also detailsthe test apparatus, data acquisition and control procedures, andthe measured results, including an error analysis. References 2and 3 describe means of actuating the heat switch so that noelectrical heater power is required.
1.2 PHASE II HEAT SWITCH DEVELOPMENT
Following the Phase I test program, a decision was made todevelop and test a second (Phase II) heat switch with theobjective of significantly lowering the 'off'-state parasiticconduction down the stainless steel support tube, and loweringthe 'off'-state parasitic radiation between the copper fins.This led to the fabrication, test, and analysis of a Phase IIprototype heat switch which incorporates low-emissivity gold-plated copper fins to reduce the radiative parasitics, and an
2

zn
EuJ
0_
I
3
0
z,_o,,
,a{J
._
.,.-4
O_O_0L)
I

ultra-thin-wall (0.002 inch thick) stainless steel support tube
to reduce the conductive parasitics.
The design and tests conducted to characterize the performance
of this gold-plated heat switch are described in this report
starting in Section 2.
An area of particular importance to heat switch design is the
performance of the switch under 'off'-state conditions, where
one side of the switch is at cryogenic temperatures, and the
other side of the switch is at the spacecraft heat rejection
temperature (typically 280 to 300K). The resulting large
temperature difference not only creates a large driving force
for parasitic losses, but is also likely to cause highly
stressful differential thermal expansion between the heat-switch
halves. If not properly accommodated, this differential
expansion can lead to destructive forces and/or relative motion,
contacting, and thermal shorting between the switch halves.
Section 3 of this report explores the details of these effects
for both the Phase I and Phase II (gold-plated) heat switch
design. The predictive methodology developed includes finite-
element codes to predict the conductive and radiative transfer
among the fins, the temperature profile on the support tube, andthe associated thermal deformation.
1.3 HEAT SWITCH DESIGN GENERALIZATION
Following completion of the Phase II analysis and testing
activity, a final Phase II activity was carried out to document
the lessons learned in the form of guidelines for designing gas-
gap heat switches for other applications. Because of the
rapidly increasing interest in 60 to 80K Stirling-cycle coolers,
a 1 watt cooler of this type was chosen as a design example to
aid in generalizing the developed heat-switch concept. The
results of this effort are presented in Section 4.

SECTION 2
PHASE II HEAT SWITCH DEVELOPMENT AND TESTING
2.1 DESIGN AND HARDWARE CONSTRUCTION
The design of the Phase II gold-plated heat switch (as shown in
Figure 2-1) _s fundamentally the same as the Phase I heat switch
illustrated in Figure i-i, except for several modifications for
improved performance and ease of manufacturing. These include:
I) All fin surfaces were electroplated with low-emissivity
gold to minimize radiant heat transfer between the hot and
cold sides of the switch.
2) The thickness of the circumferential stainless steel tube
was reduced from 0.004 inch to 0.002 inch, thereby reducing
conductive heat transfer by a factor of two. Reducing the
thickness necessitated adding three circumferential
stiffening ribs to prevent the tube from collapsing under
ambient external pressures.
3) The longitudinal clearance between the fin tips and the
slot bottoms in the mating half was increased from 0.002
inch to 0.005 inch; this was done to preclude possible
contact due to differential expansion of the stainless-
steel tube versus the copper fins.
4) The actuation gas was plumbed only to the hot side of the
switch to minimize parasitics to the cold side, and to
simplify construction.
5) The fins were machined using a carbide circular saw instead
of EDM, followed by hand lapping to achieve the precise
(0.002 inch) gap dimensions; the fins were then hand
polished with MET-ALL prior to gold plating.
Photographs of the disassembled and completed heat switch are
shown in Figures 2-2 and 2-3, respectively.
2.2 LOW TEMPERATURE TESTS
Using the test apparatus and the procedure as outlined in
Reference i, the gold-plated heat switch was tested at liquid
helium temperatures (4.2K) in both the 'on' state and 'off'
state. Figure 2-4 displays the 'on'-state data for the Phase II
gold-plated heat switch in comparison with that for the Phase I
copper heat switch. Data are presented for two gas fill
conditions: i) 1 atm helium from an external bottle, noted as
5

i
J
Im
l--I
0i
a,.
o
o
!
o
I
o
I

ORIGINAE PAGE
BLACK AND WHITE PI-;OTOGRAPH
I
l,a
-,-ID..,
o
"7

ORIGrNAL PAGE
BLACK AND WHITE PHOTOGRAPH
SUPPORT TUBE WITH THREE RIBS ............
Figure 2-3. Support Tube with Three Ribs
8

O
I
\\
I I I I
N
(X/M)]3NVLOAQN03
I
z
0 0 0 0
<IOOD
DDw
O..a ¢.j :._
_ [
II
g4 -_4
g_O gh4J
O_:: [3 _4J
O _'_L_ ---
_O
_J ,-.D _eq- Cq_ O".--'_: ,
r.)mN _
•_ -_ 0
um)- N_O_
0 '0 -I=) )4
O
IIN
O
t_.,-4
9

'gas', and 2) helium supplied by the sorption pump, noted as
'on mode' As expected, little difference is seen between the
'on' performance of the Phase I and Phase II heat switches.
Figure 2-5 presents a similar comparison of the 'off'-mode
performance of the two heat-switch designs--this time for two
vacuum conditions: i) vacuum provided by an external vacuum
pump, referred to as 'no gas', and 2) vacuum created by the
sorption pump, referred to as 'off mode'. In these tests the
temperature differential across the switch was varied in the
range from 4 to 16K, giving rise to average switch temperatures
in the range of 6 to 10K. At these low temperatures, radiation
exchange is negligible, and the primary contributor to the
parasitic conductance is the thin-wall stainless-steel tube that
connects the two switch halves. It can be seen from Figure 2-5
that the Phase-II gold-plated switch design, which has a 0.002-
inch thick tube, has approximately one half the losses of the
earlier Phase I design, which had a 0.004-inch thick tube.
Table 2-1 summarizes the performance of the two switches for the
condition when the cold-side temperature is 4.2 K and the hot-
side temperature is 11.8 K, i.e. the AT is 8 K.
2.3 TESTS WITH LARGE TEMPERATURE DIFFERENTIALS
In many applications it is foreseeable that the hot side of the
heat switch will reach temperatures considerably above the cold
side, and in the limit will approach a spacecraft ambient
temperature near 300K. Such large temperature differentials
across the heat switch not only create large driving forces for
parasitic conduction and radiation to the cold side, but also
cause severe differential expansion between the switch halves.
Dealing with large temperature differentials thus represents one
of the more difficult challenges for the heat-switch design.
A special series of tests was developed and conducted to
evaluate the large-temperature-differential performance of theheat switches. In these tests the cold end of the heat switch
was grounded to an 80K cold plate, while the hot end was heated
with electrical resistance heaters to temperatures ranging from
90K to 270K.
In the tests, the heat flow through the heat switch was computed
from the power applied to the hot-side heaters, with corrections
made for parasitic losses directly to the test environment. To
minimize the external losses the heat switch was outfitted with
an actively controlled radiation shield as shown in Figure 2-6.
One end of the shield was thermally grounded to the 80K sink,
while the other end of the shield was matched to the temperature
of the switch hot-side using electrical resistance guard
heaters.
i0

\
\\ [] _
\\\
_z#IK o
O-i-
o_Uo
oov
Z ®E_
O.
--o0 o
v
I I
| °
0
Z Z
v 0 v _
0 0 0 0
_ Z
2
I ,I
0
0
ci
0
0
0_
m
0_
_E_
_'-_ 0 _
=:_ m-_0 -_
_*_ 0
_-_.
_OOE_:
I _00_0-_
o_
I¢q
()1/_) _3N¥.I.3_IONO0
ll

.,_ ,._ I
_.1_o•,-i ,-_
OII1_
::14-) •'D_,o
U I O
_ON
O _
00_
.,-I
0._I
0_0__0_¢_-,-I_ _I
•,'t _
,4I
Q)
Xl
E-t
12

_R!GINAL PAGE
BLACK AND WHILE PHOFOGRAPH
HEATERS
COLD PLATE
AT 80 K
................ GAS ADSORPTION PUMP " " "
...._JZ._- i-:-:: .........................................................................................................
Figure 2-6. Photo of Heat Switch Test Apparatus
13

Figure 2-7 shows the results for the shielded and nonshielded
cases. As the temperature difference between the hot and the
cold base increased, the heat loss from the outer wall of the
support tube to the surrounding cold dewar wall increased, as
evidenced by the difference between the two curves in Figure
2-7. Figure 2-8 contrasts the performance of the earlier Phase
I copper switch with that of the Phase II gold-plated switch
(both without the radiation shield).
In all of the curves, it is evident that the heat flow through
the heat switch abruptly increases when the temperature
difference exceeds 130 to 170K. This rapid increase in heat
flow suggests a mechanical breakdown in the heat switch
insulation -- most likely contact between the heat switch halves
caused by the significant differential expansion between the hot
and cold sides.
In order to determine whether this rapid increase in heat flow
was caused by contact between the cold-side fins and the hot-
side fins, a series of tests that involved electrical resistance
measurements was performed. The voltage (V) across the switch
was measured while an electrical current (I = 1 A) was passed
from the hot base to the cold base; the resistance was
determined as R = V/I.
The theoretical electrical resistance of the stainless steel
tube R t is given by:
R t = p L/= D t (2.1)
where
p = electrical resistivity of SS 302 (ohm-cm)
L = length of the support tube (cm)
D = diameter of the support tube (cm)
t = thickness of the support tube (cm)
In carrying out the measurements, the heat switches were first
filled with 120 torr of helium gas. The resistances of both
heat switches (copper and gold plated) were then measured as the
hot and cold sides of the switch were cooled from room
temperature to 80K. The measured resistances were found to be
close to the resistance of the stainless-steel tube given by
Eq. (2.1), indicating there was no touching when the hot and the
cold sides were at the same temperature, i.e., no temperature
differential.
Next, the heat switch was evacuated to 10 .6 torr at room
temperature. After both the hot and cold sides were cooled to
equilibrium (80K), heat was applied to the hot side to raise its
14

I I I I I I I I
,-M
•,-I Q)
_X
,,.- q},._
0
"- ,"-'1-l..}
N _-,_
_ o i11
L -,-I -,'-t
i-- _g4
._ _-,_
_-,_ _
p_
I
-r-I
o
15

I I I I I I I
16

temperature. The electrical resistance was measured at each
temperature difference level (Thot - Tc0td), where Tcotd was always
80K. For a given Thot and Tcotd , the average temperature is (Thot +
Tcotd)/2 •
Figure 2-9 displays the measured resistances as a function of
both average temperature (bottom scale) and temperature
difference (top scale).
For the copper heat switch, the resistance dropped dramatically
at a temperature difference of 130K, indicating that the fins
did touch when the hot side temperature reached 210K (i.e., 80K
+ 13OK). This is consistent with the results from the heat
transfer test (Figure 2-8). For the tests that involved the
gold-plated heat switch, the resistance decreased less abruptly,and was therefore less conclusive.
17

(£'3 SWI.IO) :I3NV.LSIS2LI
"18

SECTION 3
ANALYSES OF PERFORMANCE LIMITATIONS CAUSED
BY LARGE TEMPERATURE DIFFERENTIALS
AS discussed in Section 2, the copper heat switch experienced a
thermal short at a temperature difference of 130K, while the
gold-plated heat switch experienced a much less severe, but
similar problem, at a somewhat higher temperature. The most
likely cause of this shorting is the severe differential thermal
expansion that must occur between the switch sides under these
conditions of large temperature difference. This Section
analyzes the various differential expansion mechanisms that come
into play with the subject heat switch design; specifically, the
mechanisms are divided into three categories:
I) Axial expansion differences between the outer stainless-
steel tube and the copper fins.
2) Radial expansion differences between the hot and cold
copper-fin halves.
3) Thermal warping (bending) of the switch due to asymmetrical
thermal gradients around the switch circumference.
3.1 AXIAL EXPANSION DIFFERENCES
When the heat switch operates under isothermal conditions all
elements of the switch shrink according to their respective
coefficients of thermal expansion (CTE) as the switch
temperature is reduced below room temperature. Because copper
has a higher CTE than stainless steel, the axial gap at the end
of the fins actually increases as the switch cools isothermally.
In contrast, if the hot side of the switch remains at room
temperature (T_) while the cold side is reduced to a cryogenic
temperature (To) , the stainless-steel tube, of active length(L), shrinks by an amount:
AL/L = CTE (T_-Tc) /2 (3.1)
Because the hot fins do not shrink at all, a possible axial
interference develops between the tips of the hot fins and the
adjacent cold side of the switch. Sufficient axial clearance
must be provided to preclude this possibility.
19

Possible axial clearance problems in the Phase I design weredealt with in the Phase II gold-plated design by increasing thefin axial clearance from the original 0.002 inch, to 0.005 inchin the Phase II design. This is very likely the reason that thePhase II design performed much better in the large-differential-temperature tests.
3.2 RADIAL EXPANSION DIFFERENCES
As with the axial dimensions of the switch, the radial, ordiameter dimension of the switch also changes (shrinks) as theswitch is isothermally cooled to cryogenic temperatures.Because the two switch halves are both made of copper, theshrinkage is identical and the fin alignment (spacing) remainsmatched for the two switch sides.
However, under conditions where the hot side remains at roomtemperature (TR) and the cold side is reduced to a cryogenictemperature (Tc), the cold side will shrink radially relative tothe hot side. This results in the fins on the cold side beingspaced closer together than those on the hot side, a situationthat can cause hot and cold fins farthest from the switchcenterline to contact one another.
For this situation the change in the fin gap spacing (Ag) isgiven by:
Ag = CTEc0_rxr× (TR-Tc) (3.2)
where r is the radial distance to the gap from the switch
centerline. For copper, Eq.(3.2) gives a gap closure of
approximately 0.0023 inch for a temperature differential across
the switch of about 170K. This correlates very well with the
onset of degraded performance with the gold-plated heat switch
at large temperature differentials.
3.3 THERMAL WARPING
Although the axial and radial differential expansion issues are
relatively easy to understand and compute, the third category of
temperature induced misalignment, thermal warpage, is highly
complex. The fundamental phenomenon that can cause warpage is
an asymmetrical temperature distribution around thecircumference of the stainless-steel tube.
With an isothermal heat switch there are no thermal gradients,
and thus there are no differential-expansion induced warpage
2O

forces. However, with a large temperature differential acrossthe heat switch, radiation exchange between the stainless-steelsupport tube and the adjacent heat-switch fins may cause thelocal tube temperature to partially track the adjacent fintemperature. Referring to Figure 3-1, this will cause the Fin#1side of the support tube to run somewhat cooler than the Fin#16side, and thus the Fin#1 side will be slightly shorter than theFin#16 side. This will cause the switch to curl or warp towardthe Fin#1 side. Had the layout of the fins been symmetrical,with, for example, a hot (or cold) fin for the outer fin on bothsides, then the differential expansion forces would have beenbalanced, and no net warpage forces would remain.
Lacking the present state of understanding, the Phase I andPhase II heat switches were manufactured asymmetrical. Toassess the degree of warpage with this design required a complexfinite-difference thermal analysis to predict the tube tempera-ture distribution, followed by a finite-element structuralanalysis to predict the resulting deflections.
Circumferential Temperature Distribution Analysis
Important assumptions used in the thermal analysis included:
(i) Radiation is transferred from the curved side of each
fin to the inner wall of the tube.
(2) There is no heat loss from the outer wall of the tube to
the surrounding environment.
(3) Heat is conducted longitudinally and circumferentially
in the tube.
(4) The fins are at the same temperature as their base.
(5) The thermal conductivity of the residual helium in the
gap between the wall and the fins is given by the free
molecular value at 10 .6 torr pressure.
(6) The thermal conductivity for the stainless-steel tube is
temperature dependent.
Using side-to-side symmetry, only half of the cylindrical tube
needed to be considered. In the model, the half-circle of the
tube was modeled as a rectangular sheet of 2.54 cm height by
7.98 cm width (i.e., half the circumference). The grid points
were 0.16 cm apart vertically and 0.285 cm apart horizontally.
Excluding points on the isothermal boundaries where the tube was
soldered to the hot and the cold copper base, there were 15 x 28
grid points. The combined gas conduction and radiation across
21

COLD SIDE
FINS ONHOT SIDE
FINS ONCOLD SIDE
GAS GAP
SUPPORTTUBE
SUPPORTTUBE
HOT SIDE
Figure 3-1. Asymmetrical Fin Arrangement of the Phase I andPhase II Heat Switches
22

the gap between an element on the tube and the opposing fin is
given by:
Q = h Ag AT (3.3)
where
h = K s + a E (T I + T2)(TI 2 + T22)
Kg = thermal conductance of He at 10 .6 torr (watts/cm2K)
= Stefan-Boltzmann constant (5.67×10 "12 watts/cm2_)
= effective emissivity, including shape factor
TI, T 2 = temperatures of element 1 and fin 2, respectively (K)
AT = T I - T 2
Ag = element gas-gap area (cm 2)
The conductive heat transfer between the support tube elements
is given by:
Q = -kss A VT (3.4)
where
kss = thermal conductivity of stainless steel (watts/cm-K)
A = cross-sectional area of the element (cm 2)
VT = temperature gradient (K/cm)
At steady state for each element, since no heat is accumulated,
the heat transferred to and from the fins has to be transferred
to the neighboring support-tube elements by conduction, both
longitudinally and circumferentially. Starting from an initial
guess of a linear temperature profile in the Z direction, the
two-dimensional temperature profile on the tube was calculated
by iteration using the relaxation method.
Deformation and Stress Analysis
To compute the deformation and stress associated with the
complex temperature distribution in the support tube required a
modestly complex finite-element structural analysis. In such an
analysis the structure is represented by a number of small
elements, each linked at their corners. The deformation at each
node, i.e., the corner of each element, is calculated from a set
of linear algebraic equations.
23

In modeling the heat switch, the relatively massive and rigidcold and hot ends were simulated as solid elements. In con-trast, the support tube behaves as a flexible thin shell and wasmodeled using shell elements. The support tubes of both thePhase I and Phase II heat switches were investigated: the 0.004-inch tube, and the 0.002-inch tube with additional reinforcingribs. The heat-switch fins were treated as isothermal elementsrigidly attached to either the cold or the hot base. They weremodeled as beam elements to accommodate the thermal expansion ofthe base. The total model consisted of 485 grid nodes, 16 beamelements, 44 solid elements, and 396 plate elements. A perspec-tive view of the model is shown in Figure 3-2a.
The first step in using the model was to compute the structuraldeformation due only to the tube temperature distributions.These results are shown in Figure 3-2b. To get the total defor-mation, it is necessary to add the additional contributionresulting from the gas pressure loading, assuming 1 atm pressureoutside of the tube, and vacuum inside. This is shown inFigures 3-2c and 3-2d. The addition of the gas loading turnedout to be negligible, and can be safely neglected in the gapmovement calculations.
Because of the nature of the tube's support, the thermal defor-mation of the heat switch is dependent only on the temperaturedistribution within the support tube, and independent of thetube thickness. Since the thermal gradients were very similarfor the Phase I and Phase II switches, the relative movement atthe base of the cold fin with respect to the tip of the hot finwas found to be the same for both heat-switch designs.
Figure 3-3 summarizes the computed fin displacements for each ofthe 15 gaps. Positive values refer to closing of the gap, andnegative values refer to opening of the gap (in thousandths ofan inch). The normal gap size is 0.002 inch. The calculationshows that these relative movements cause at least 3 of the 15gaps to be closed when the temperature difference is 220K. Thecontact area and the contact force for this type of mechanismare much smaller than those caused by axial contraction. Thismay be the reason why the gold-plated heat switch experienced amuch less severe contact problem than the Phase I design.
Because of the completeness of the structural analysis, thenumbers shown in Figure 3-3 not only include the deformationcaused by warpage, but also include that caused by the differ-ential radial expansion discussed in the previous Section 3.2.The symmetry of the numbers about the heat-switch centerlineimplies that the principal deformation is, in fact, radialdifferential expansion; contributions from warpage appear to bequite small. However, to preclude any possible warpageproblems, future heat-switch designs should adopt a symmetricalfin configuration.
24

7
(c) (d)
Figure 3-2. Deformation Pattern Under (a) No Stress,
b) Thermal Gradient, (c) Atmospheric Pressure
for 0.004 inch Wall, (d) Atmospheric Pressure
for 0.002 inch Wall
25

I_Jm o
O_Otn o o m
I-fit:0
n ixl
I
0
0
0._
_0
00
0
o
_o
0 0
0 0
t_ •O_
O0
I
0
.el
26

SECTION 4
HEAT SWITCH DESIGN GUIDELINES
As described earlier, the function of the gas-gap heat switch
considered in this report is to provide a means of thermally
disconnecting a standby (nonoperating) cooler from the cooler
load when the primary (operating) cooler is connected, and vice
versa. This disconnection is commonly required because the
parasitic heat conduction from the nonoperating cooler may
represent a significant fraction of the useful cooling available
from the operating cooler (References 4,5).
The 183-page Phase I Final Report (Reference i) provides a
thorough discussion of the principles behind the operation of
the gas-gap heat switch, and presents detailed data on the
design tradeoffs leading to the Phase I design. Although simple
in concept, cryogenic gas-gap heat switches must contend with
substantial thermal gradients and widely varying material
properties as the cold side of the switch is required to perform
at lower and lower temperatures. The Phase I and Phase II
efforts developed and used detailed computer programs that use
temperature-dependent material properties to analyze the various
performance attributes of gas-gap heat switches at applicationsas cold as 5 K.
As a complement, this section concisely summarizes the key
elements in the design of cryogenic gas-gap heat switches and
emphasizes lessons learned and simple calculational procedures
that can quickly scope out a useful heat-switch design. Keeping
the analyses simple also provides insights into the controlling
parameters that are often lost in more complex numericalsolutions.
By way of example, the design principles are applied to a new
application of current interest -- a 1-watt Stirling-cycle
cooler operating at 60K from a 280K heat sink. The modest cold-
side temperature (60K) for this design requires that temperature
dependent material properties be used, but is not so cold that
it rules out simple calculational procedures.
In the subsections that follow, the heat-switch design processis divided into four elements:
i) Establishing the design requirements of the switch -- in
particular, the maximum allowable thermal resistance of
the switch in the 'on' state, and the minimum allowablethermal resistance in the 'off' state.
2) Designing the switch diameter and gas-gap area to
achieve the required 'on' resistance, while avoiding
27

thermal contact between the fins under conditions withsevere thermal gradients.
3) Selecting the support tube thickness, switch radiative
properties, and 'off'-state vacuum levels to minimize
parasitic heating of the cold side in the 'off' state.
4) Designing the gas charging/venting system to achieve the
required switching pressures.
Each of these steps is detailed below.
4.1 ESTABLISHING DESIGN REQUIREMENTS
The first step in the design process is to establish the heat-
switch design requirements, namely the maximum allowable 'on'
resistance and minimum allowable 'off' resistance. This process
is generally interactive with the design process -- beginning
with comfortable starting values, then backing off or tightening
up, depending on the complexity and producibility of the
resulting heat-switch design.
As a reasonable starting point, it is useful to make the thermal
losses associated with both the 'on' heat switch, and the 'off'
heat switch, equal to a tolerable fraction -- say 10% -- of the
cooling power of the cooler.
For the 'on' heat switch, this implies selecting an allowable
temperature drop across the switch that corresponds to a 10%
loss in cooler output cooling power. For our l-watt/60K
Stirling-cooler example we shall assume that a 10% loss
corresponds to a 2K temperature drop; this gives the allowable
'on' resistance:
R, = 2 K/(I watt) = 2 K/W (4.1)
Before setting the allowable heat-switch 'off' resistance, it
is important to note that the thermal resistance of the 'off'
cooler is likely to be a significant fraction of that of the
'off' heat switch; it is therefore important to examine the
total thermal network representing the heat switches, the
coolers, and the thermal load.
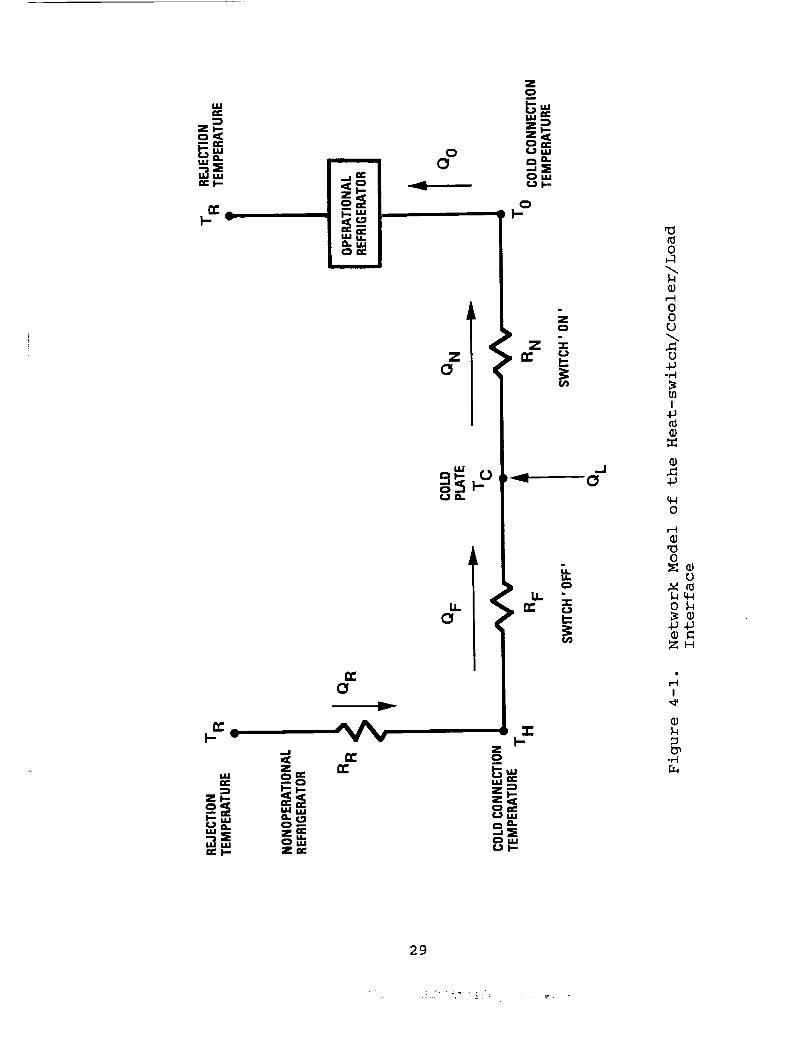
A representative network is illustrated in Figure 4-1. Here T R
is the heat rejection temperature of the cooler, and R R repre-sents the thermal resistance between the cold end and the heat-
rejection end of the nonoperating refrigerator. R. and R F arethe 'on' and 'off' resistances of the heat switch, respectively.
28
z_O
G:
2
UO.
Z
Z_
Z_
m.. _ |
o
oO
ZO
r.JL
u.O
U_-
o
ZO
Z_
z__.luj
,.I0
o
(1)rHooo
o
I
o
o
o
o_
ZH
I
29

By making flow balances between the various nodes of thenetwork, it is possible to derive four equations that are usefulfor examining the implications of various heat-switch 'on' and'off' resistances in terms of the overall cooling systemoperation:
where
QR= QF = (TR- Tc)/(RR + RF)
RF = (Te-Tc)/Qe -
TH = QRRF + T c = (RFTe+_Tc)/(_+RF)
T o = T c - QoR,
(4.2)
(4.3)
(4.4)
(4.5)
T c = cold load temperature, (e.g. 60K)
T o = temperature of the operational refrigerator (K)
T. = temperature of the nonoperational refrigerator (K)
T e = heat rejection temperature, (e.g. 280K)
Qe = parasitic load through 'off' heat-switch/refrig. (watts)
QL = cold load (watts)
Q0 = total refrigeration load = QL+Qe (watts)
R R = thermal resistance of the 'off' refrigerator (K/watt)
R F = thermal resistance of the 'off' heat switch (K/watt)
R, = thermal resistance of the 'on' heat switch (K/watt)
To obtain the requirement for the 'off' heat switch we use
Eq. (4.3), with the allowable parasitic conduction (QR) set equal
to 10% of the cooling load (QL), assuming the temperature dropacross the heat switch/cooler combination is the difference
between the cryogenic load temperature (Tc) and the cooler heat-
rejection temperature (Te) .
For our example, we assume that the Stirling-cycle cooler has a
measured nonoperating thermal conductive loss of 0.5 watts from
the cold finger at 60K to the heat rejection surfaces at 280K.
For comparison, the parasitic heat conduction of the well known
Oxford Stirling-cycle cooler is also approximately 0.5 watts
(Reference 6).
For this level of parasitics, the thermal resistance (_) of the
nonoperating cooler is given by:
R e = (280K-60K)/(0.5 watt) = 440 K/W (4.6)
3O

Thus, using Eq.(4.3), the required resistance of the 'off' heatswitch is:
TR- T c (280K- 60K)
R F - R R = - 440 = 1760 K/W (4.7)
QR 0.1watts
Using this value together with the assumed heat-switch 'on'
resistance (RN) of 2 K/W (from Eq.4.1) allows the effect ofvarious ratios of heat-switch 'off' to 'on' resistance to be
analyzed. Figure 4-2 presents the computed results for two key
parameters: the total refrigerator heat load (Q0), and the heat-
switch hot-side temperature (TH). It is clear from this figure
that the range of useful heat-switch ratios is from I000 to
I0,000, and that for these ratios, the heat-switch hot-side
temperature is close to the heat rejection temperature (T,).
4.2 DESIGNING FOR THE 'ON' RESISTANCE
The principal parameters governing the heat-switch 'on'
resistance are the total gas-gap area and spacing, and the fin
conductance.
Fin Conductance Losses
In general, in an optimum heat-switch design, temperature drops
down the fins should represent a small fraction, say 20%, of the
total heat-switch conductive losses, i.e., 20% of the allocated
'on'-mode temperature drop across the switch. For small thermal
gradients down the fins, the temperature drop down the length
(L_) of the fins can be accurately approximated as:
= Qf [ Lf 1ATf
2k c [(wt) (w+t)
Qf Lf
2 k c Af
where
ATf = temperature drop down fin (K)
Qf = heat conduction per fin (watts)
k c = thermal conductivity of copper @ T c (watts/cm-K)
w = width of fin (cm)
t = thickness of fin (cm)
Lf = length of fin (cm)
Af = cross-sectional area of each fin (cm 2)
31
(4.8)

I
(N) 3EInIvEI3dlN31 301S-.I.OH HO.LIMS 1V3H
I I
I I
(s_eM) OVO'I UOIVH391I:I=I31:I
32

For initial heat-switch sizing, it is useful to use Eq.(4.8) to
establish an estimate of the heat-switch diameter (D) required
to achieve the total allocated temperature drop down the heat
switch copper body including the fins; i.e. AT b = ATf + AT e ,
where AT_ is the total combined temperature drop for both solidends of %he heat switch.
For this we assume that the total cross-sectional area of the
fins is made the same on both sides of the switch, and therefore
the fins on each side represent approximately 50% of the total
cross-sectional area of the switch, i.e. total Af=A/2. Noting
that the total fin heat conduction (total Qf) is the same as the
total heat-switch heat conduction (Q), Eq.(4.8) gives:
Q Lf Q L e Q L
AT b = +
2 k c(A/2 ) k c A k c A
Therefore,
[40L] [4LID = (4A/=) _ = =
k c AT b _ k c R b
(4.9)
where
D
Q
L
Lf
AT b =
k c =
R b =
= heat switch diameter (cm)
= total heat switch power transmission (watts)
= total heat switch length (including ends) (cm)
= length of fins (cm)
combined length of heat-switch ends (cm)
'on'-mode AT allocation for switch body (K)
thermal conductivity of copper at T c (watts/cm-K)
total thermal resistance allocation for fin/body
conduction (K/watt)
Although Eq.(4.9) was derived from the fin equation, it is
identical to that for a solid copper rod of diameter D and
length L. Thus, in the 'on' mode the switch merely acts as two
resistances in series: that of a copper rod the diameter and
length of the heat switch, plus that of the gas gap.
To demonstrate Eq.(4.9), consider the problem of designing a
heat switch for our example Stirling cooler. A key consider-
ation is selecting the right copper, since at cryogenic temper-
atures, its thermal conductivity is very sensitive to the level
of impurities and work hardening. Figure 4-3 highlights this
sensitivity, but suggests that the difference is small for
33

I=,,I_ _'_ 0,1 _ao _u3_ff o3 o,1
(_l-mO/slle_) I.I.IAIlOnONoo 7VIAII:I3H1
0,1
u_
0'3
u}
o0
v _
3
uJ "_ _D (lJ
o ou
o
m 0
-,-'t
34

temperatures above 60K; we therefore select a common OFHC copper
with a conductivity around 7 watts/cm-K at 60K. Next, we select
a trial length of 4 cm for the heat switch -- a balance between
shortening the switch to reduce the 'on' resistance, and
lengthening it to increase the 'off' resistance. A 20% 'on'-
resistance allocation to the copper/fins gives R b = 0.2 x 2 =
0.4K/watt, so that Eq.(4.9) yields:
4 x 4 cm ]½D = = 1.35 cm (4.10)
3.14 × 7 x 0.4
Gaseous Conduction Losses
The second half of the 'on'-conduction calculation relates to
sizing the gas-gap area to limit the temperature differential
across the gas gap. For this calculation we assume that the gas
in the gap is pressurized sufficiently to insure that it is in
the continuum regime, i.e., above the corresponding upper line
in Figure 4-4 (for the derivation of this plot see Reference i).
For example, with hydrogen and a 0.005 cm gap spacing, the
minimum required pressure is approximately 30 torr.
Once in the continuum regime, the conductivity (kg) of the gasin the gap is solely a function of its temperature, as shown in
Figure 4-5. The thermal resistance (Rg) across the gap (g) istherefore given as:
g
Rg = (4. ii)
Ag kg
so that the required total gas-gap area (Ag) is given by:
g
Ag =
Rg kg
where
Ag = total gas-gap area in heat switch (cm 2)
g -= gap spacing (typically 0.005 cm)
kg = conductivity of gas at 'on'-mode temperature
(watts/cm-K)
Rg = allocation for gas-gap conduction resistance(K/watt)
(4.12)
35

I0
i0 -3
\\
\\
\
\t\
, \\
\\
\\
\\
\\
\
FREE-
MOLECULAR
REGIME
CONTINUUM
REGIME
\\
\
\\
\\
\
Figure 4-4.
10.4
10-3 10-2 10-1
GAP WIDTH (inches)
Gas Pressure Bounds for the Continuum and Free-
Molecular Conduction Regimes for Nz, H 2 and He
36

10_3
§
_ 10 -4
/
_ /
He .,_/
/ / 02
_ // /
i _ B w v v
I I I J | | i | J I | i i ....
10 50 100 500
TEMPERATURE (K)
Figure 4-5. Thermal Conductivity versus Temperature for Various
Gases in the Continuum Regime
37
/

For our Stirling-cooler heat switch we select hydrogen gas to
achieve both a high conductivity (0.00038 watts/cm-K from Figure
4-5), and the ability to achieve low (10 .3 torr) pressures with
a charcoal sorption pump at 60K (discussed later in Section
4.5). Combining this conductivity with our gas-gap resistance
allocation of Rg = R,-R b = 1.6 K/W (Eqs. 4.1 and 4.10), gives:
Ag = (0.005 cm/(l.6 x 0.00038) = 8.22 cm 2 (4.13)
4.3 SWITCH GEOMETRY SELECTION
Once the switch diameter and gas-gap area have been defined
using Eqs.(4.9) and (4.12), the next step is to select an
initial switch configuration that both satisfies these
constraints, and addresses important manufacturing and
operational tolerance issues. Three of the most important ofthese issues include:
1) Selecting a symmetrical fin arrangement so as to prevent
possible warping of the heat switch during conditions of
large temperature differences between the switch halves.
2) Minimizing the radial distance from the switch center-
line to the farthest gas gap to avoid gap closure due to
differential expansion of the switch halves during 'off'
conditions.
3) Maintaining sufficient axial clearance between the ends
of the fins and the slot bottoms of the mating half to
avoid fin bottoming.
For our example problem, the diameter derived in Eq. (4.10) and
the gas-gap area derived in Eq.(4.13) can both be satisfied by
the fin configuration shown in Figure 4-6. This configuration
has a number of important attributes:
i) It is relatively easy to machine.
2) It is symmetrical so as to avoid any warping in the
'off' mode.
3) The radial distance from the switch centerline to the
farthest gas gap is quite small (0.27cm).
Two important dimensions that must be confirmed are the radial
and axial fin clearances during 'off' conditions where large
temperature differences exist between the switch halves.
38

0.005
0.02 cm
1.40 cm
Figure 4-6.
1.35 cm
0.2 cm
3.0 cm
Trial Heat-switch Configuration for Example
1-watt / 60K Stirling Cooler
39

Axial Clearance Calculation
Reduction in the hot-fin axial or end clearance occurs during
'off' conditions when large temperature differentials develop
across the switch. Under these conditions the outer support
tube shrinks relative to the hot fins, thereby closing the axial
gap between the tips of the hot fins and the bottoms of the
cold-fin slots. Because the hot fins are essentially
isothermal, their change in length from room temperature is
readily computed as:
ALf = acLf (300- T,) (4.14)
where
ALf = change in hot-fin length (cm)
a c = average CTE of copper between 300K and T M (m/m-K)
Lf = length of the fins plus hot base of switch (cm)
T, = heat-switch hot-side temperature (K)
Because the support tube will generally have a large, often non-
linear temperature variation, computing its change in length may
require a numerical solution that divides the tube length into 5
or more sections. To obtain a quick approximation of the tube
shrinkage it is useful to simply use the average tube
temperature and the average CTE of the tube material over the
range of applicable temperatures. Thus:
AL t = atLt(300- (TH + Tc)/2 ) (4.15)
where
AL t = change (shrinkage) in support tube length (cm)
a t = ave. CTE of support tube between 300K and T c (m/m-K)
T c = heat switch cold-side temperature (K)
L t = unsupported length of support tube (cm)
Typical CTE data for copper, stainless steel, and titanium are
provided as a function of temperature in Figure 4-7.
Using these data in our example gives:
ALf = (16.3xi0 6) (3cm) (300K-280K) = 0.0009 cm (4.16)
AL t = (8×10 .6) (3cm) (300K-170K) = 0.0031 cm (4.17)
40

20
I
E
E
v
ZO
z<
xw 10-J
nrU.l
0
00
0
J
0
•TI'TANIUM 6At_V
I ' I ' I '100 200 300 400 500
TEMPERATURE (K)
Figure 4-7. Coefficient of Thermal Expansion for Copper,300 Series Stainless Steel and Titanium 6AI4V
41

The net shrinkage of the end gap is thus:
ALg = Lt-L f = (0.0031-0.0009) = 0.0022 cm (4.18)
This is easily accommodated by the 0.010 cm gap proposed in
Figure 4-6.
Radial Clearance Calculation
Reduction in the fin radial or side clearance also occurs during
'off' conditions when large temperature differentials develop
across the switch. Under these conditions the cold half of the
switch shrinks relative to the hot half. The net reduction in
the thickness of the gas gaps is thus given by:
Ag = _cr (T,-Tc) (4.19)
where
Ag = gas-gap thickness reduction (cm)
r = radial distance to the gas gap from the heat-
switch centerline (cm)
_c = average CTE of copper between T c and T, (m/m-K)
T M = hot-side temperature (K)
T c = cold-side temperature (K)
For our example, Eq. (4.19) gives:
Ag = (12 xl0 6) (0.27cm) (280K- 60K) = 0.0007 cm (4.20)
This is easily accommodated by the 0.005 cm gap proposed in
Figure 4-6.
4.4 ASSESSING THE 'OFF'-MODE PERFORMANCE
The principal parameters affecting the 'off'-mode performance of
the heat switch are the thermal conductance down the support
tube, the radiative exchange between the fins, and the 'off'-
mode conductance of the evacuated gas in the gas gap, i.e.:
K_ = K t + K r + Kg
42
• :: .__ • ..

To meet the stipulation of Eq.(4.7) that RF _ 1760 K/W requiresthat the sum of these conductances be below the limiting valuedefined by:
KF -- I/R F < 1/1760 _< 0.568 mW/K (4.21)
Thermal Conductance Down the SuDDort Tube fKtl
The 'off'-mode thermal conductance (Kt) down the support tube iswell approximated by the conduction equation:
k t A _ k t D t
K t = = (4.22)
L t L twhere
K t = Conductance of the support tube (watts/K)
k t = average thermal conductivity of support tube
over the temperature range TH to Tc,(watts/cm-K )
D = tube diameter (cm)
t = tube thickness (cm)
L t = tube unsupported length (cm)
T c = heat switch cold-side temperature (K)
T M = heat switch hot-side temperature (K)
Figure 4-8 provides representative conductivity data for two
materials: stainless steel and titanium. For our example, we
select a 0.005 cm thick titanium support tube with a 3-cm long
unsupported length. Thus:
3.14 x 0.125 x 1.40 x .005
K t = = 0.916 mW/K (4.23)
This value is somewhat greater than the allocated 'off'-mode
conductance in Eq.(4.21) for our heat-switch design, and
suggests a need to lower the conductance of the support tube if
possible. Because it is difficult to manufacture and assemble
tubes with wall thicknesses much less than 0.005 cm (0.002
inch), one is faced with either reducing the diameter or
increasing the tube length. Unfortunately, reducing the
diameter has an immediate detrimental impact on the switch's
'on' resistance, which tends to vary with the square of the
diameter. As a result, any attempt to reduce the diameter leads
to a runaway increase in the 'on' resistance.
43
• • • • _ r _ . • '

' I t I ' I0 100 200 300 400
TEMPERATURE (K)
Figure 4-8. Thermal Conductivity Data for 300 Series Stainless
Steel and Titanium 6AI4V
44
7"

Increasing the tube resistance by increasing its length is the
other alternative. If this is done by increasing the total
switch length, this will lead to a linear increase in the copper
conductivity losses (_Tb) in the 'on' mode, and will increasethe difficulty of alignment and assembly of the switch halves.
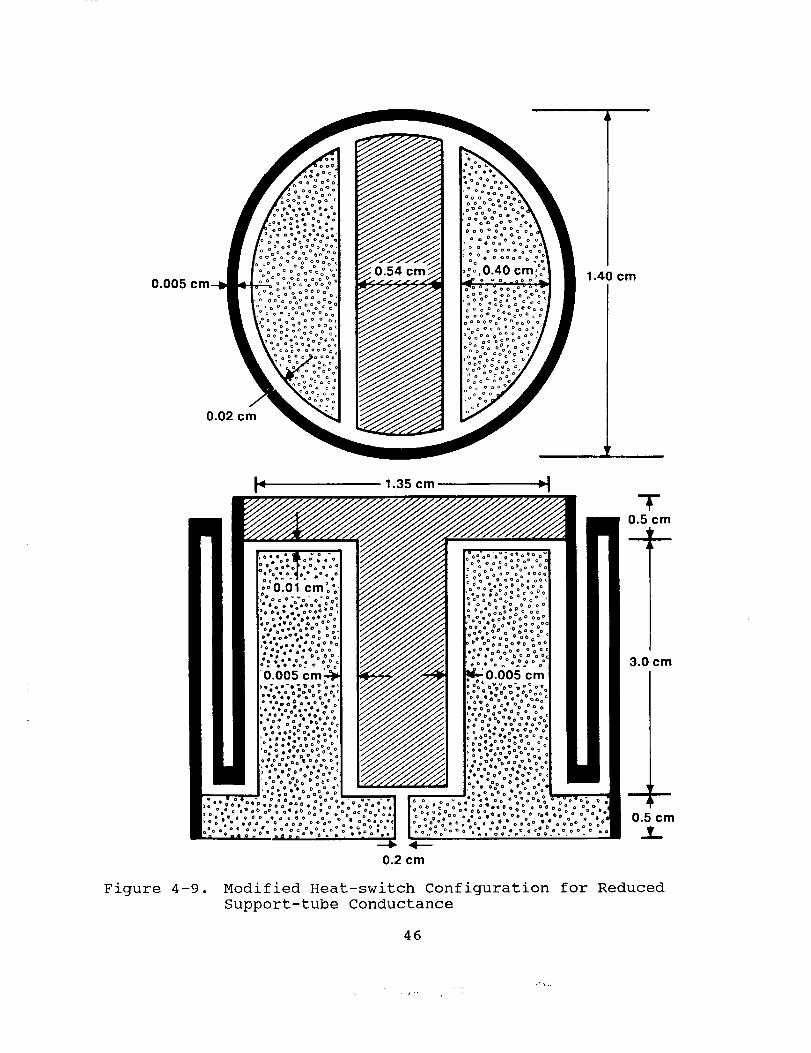
An interesting alternative is to use the folded-tube design
illustrated in Figure 4-9; this design nearly triples the outer
wall length while leaving the heat-switch conductive elements
unaffected. This reduces the conductive losses down the support
tube to about 0.3 mW/K -- well within the allocation. Although
this concept has been used previously at JPL, the alignment and
assembly issues associated with this application have not been
examined, and would have to be developed and proven.
Radiative Heat Transfer Across the Gap
Because of the large temperature differential across the switch
in the 'off' mode, radiative exchange between the hot and cold
fins may be an important consideration. For closely spaced
parallel fins the radiative heat transfer is given by:
a A s ( TH4 - Tc4)
Qr = (4.24)
(i/c H + i/e c - I)
= a Ag_ TH4 /2 for T H >> T c and _ << 1 (4.25)
where
Qr = radiative heat transfer across 'off' switch (watts)
T, = temperature of hot side (K)
T c = temperature of cold side (K)
= emissivity of fin surfaces
Ag = total gas-gap area including switch ends (cm z)
a = Stefan-Boltzmann Constant (5.67 x 10 "12 watts/cm 2_)
For our example heat switch we assume gold-plated fin surfaces
with an average emissivity of 0.02. Thus:
280 ]4Qr = (5"67)x(10cm2)x(0"02)x /2 O.003 watts
i000(4.26)
Thus, radiative heat transfer is negligible in this design.
45
0.005
0.02 cm
Figure 4-9.
4
1.40 cm
r
, ,i ,
1.35 cm =.Iv I
0.5 :m
L--
3.0 :m
0.2 cm
Modified Heat-switch Configuration for Reduced
Support-tube Conductance
46
,+

Heat Leakaqe by Gaseous Conduction (K_
The fundamental operating principle of the gas-gap heat switch
is to reduce the gaseous conduction between the switch halves in
the 'off' mode by reducing the gas pressure. At very low gas
pressures, the thermal conductivity of the gas is determined by
the relationship between the gap spacing and the mean free path
length between gas-molecule collisions. When the gap is small
compared to the mean free path length, the gas is said to be in
the free-molecular regime, and the thermal conductance becomes
independent of the gap spacing and directly proportional to the
gas pressure. In this regime the thermal conductance across the
gap is given by:
Kg = _ Ag p (4.27)
where
Kg = Gaseous conductance across the gap (watts/K)
= free molecular gas conductance (watts/cm2K torr)
Ag = total gas-gap area (cm 2)
p = pressure of the gas in the gas gap measured by a
remote pressure gage at room temperature (torr)
The free molecular gas conductance (_) is a complex function of
the physical properties of the gas-gap gas, and the ability of
the gas molecules striking the switch surfaces to achieve the
temperature of the surface; this later characteristic, referred
to as the gases accommodation coefficient, varies from 0.3 to
1.0 depending on the temperature of the surface that the gas
contacts. For closely spaced surfaces, such as the gas gap
walls, _ is given by (References 7 and 8):
where
- + -- -i
7 - 1 8 _MT a. a c
(4.28)
= free-molecular gas conductance (watts/cm2K torr)
7 = specific-heat ratio of gas-gap gas (=1.40)
M = gas molecular weight (grams/mole)
R = universal gas constant (8.48xi04 g-cm/mole-K)
T = temperature of pressure gage (300K)
a H = accommodation coefficient of gas at temperature T,
aC = accommodation coefficient of gas at temperature T c
c unit conversion factor (l.744×10"5watts2/cmS-torr2)
47
"_...,.... . :. -_ ... _..

Figure 4-10 provides values of _ for He, H2, and N 2 as a
function of cold wall temperature (Tc) for hot wall temperatures
in the 250 to 300 K temperature range.
In our example heat switch, hydrogen is proposed as the working
gas. Using Eq.(4.27) we obtain the following relationship for
the gaseous conductance as a function of the quality of vacuum
achieved in the gas gap:
Kg = (0.014)(10cm2)p = 140p (mW/K)
= 14.00 mW/K for p=10 I torr
= 1.400 mW/K for p=10 2 torr
= 0.140 mW/K for p=10 3 torr
= 0.014 mW/K for p=10 °4 torr
(4.29)
These data confirm that the gaseous conduction losses are
negligible for gas-gap vacuums better than 10 .3 torr.
4.5 SORPTION PUMP DESIGN
As a last step in. the design process, the sorption pump must be
designed to provide the pressure and vacuum required for
operation of the switch. The pump will normally be connected to
only one side of the switch so as to minimize heat-conduction
parasitics between the switch halves in the 'off' mode; the cold
side is often preferred, so as to minimize parasitics to the
pump when the pump must be cooled to cryogenic temperatures to
achieve the required 'off'-mode vacuum. Because the sorption
bed must be heated to provide gas for the 'on' mode, it is
critical that it be thermally well isolated from the switch
body.
One possible means of heating and cooling the sorption pump is
to attach it to the cold finger of the neighboring redundant
cooler; this has the advantage of automatically providing the
correct heating/cooling polarity to the heat switch. The only
caveat is that the redundant cooler must be able to carry the
full parasitics of the nonoperational cooler down to the
temperature required for the heat switch to open. This sorption
pum_ temperature required to pull a significant vacuum (below
I0 _torr) is thus a critical design parameter. A second design
driver is the upper temperature that must be reached to provide
the required gas quantity and pressure for switch conduction; as
noted earlier in Figure 4-4, this pressure is normally in the
range of i0 to i00 torr.
48
/ •

0.1
Eo
_ .05
U,I0z
.020
Z0
.01 -
0
.J0 .005
LU
U.
.00210
' ' ' I ' '''1 I I I [ I I I I
HOT-WALL TEMPERATURE = 280 K
' Nitro_
, , , 1 , , ,,I , , , , 1 , ,,,20 50 100 200 500
COLD-WALL TEMPERATURE (K)
Figure 4-10. Conductance of Different Gases in the Free-molecular
Conductance Regime
49
t

Figure 4-11 presents representative isotherm data relating the
amount of two gases, helium and hydrogen, adsorbed by PCB
charcoal as a function of temperature and pressure. Because
charcoal is a physical adsorption medium, similar data are
available in the literature for a broad variety of additional
gases. However, the high thermal conductivity of helium and
hydrogen (see Figure 4-5) makes them particularly good choices.
For hydrogen, an alternative to physical sorption on charcoal is
the use of chemisorption hydrides; however, a disadvantage of
these is the issue of whether the pump will sufficiently extract
possible outgassing gases that may be other than the chemisorbed
gas. The advantage of the chemisorbers is that they typically
sorb at much higher temperatures.
Based on the data of Figure 4-11 we have selected hydrogen gas
with a charcoal pump for our example design; this should provide
a pumping capacity of approximately 10cc STP of hydrogen per
gram of charcoal at 60K and 10 .3 torr. If the volume of gas in
the heat switch and connecting tubing is 2cc at 60K, this will
require about 1.3cc of hydrogen at STP, or 1.3/10 = 0.13 gram ofcharcoal.
A conservative adsorptio_ pump design would involve 0.5 gramof charcoal, which occupies 0.28cm 3 and is equivalent to a rod
4 mm in diameter by 2 cm long. The heat capacity of a suitable
copper container with 0.25-mm thickness and weighing 0.6 grm is
0.24 J/K. The heat capacity of the 0.5 gm of charcoal is 0.34
J/K. The heat adsorption for hydrogen is 0.7 J (based on 5000 J
per g-mole for the heat of adsorption). The heat input to the
pump is 1.76 W during a 30-second turn-on period, which will
raise the temperature from 60K to 150K.
50

f
I'--"
20O J
,oo /'l80 / /
= _ / • '° / /-- 40 /
.. / //
.'.".o / .,/ /m 10 •
. . // /• 4 / /
/" / /-18 -16 -14 -12 -10 -8 -6 -4 -2 0
Io!10 PRESSURE (TORR)
20O
:z< 100er
8O
40 I
° /0
o 2otu Imrr0 lO---
e-, 8
z 6
'" /_ 4
° /rr
Z
J! f
-18 -16
Figure 4-ii.
/
//
/ff f _
//
/
/
/ /-,4 -12 -lo -e -6 -4 -2 o
10910 PRESSURE (TORR)
Sorption Isotherm Data for Helium and Hydrogen on
PCB Charcoal
51

SECTION 5
SUMMARY
Over the course of the Phase I and Phase II contract activities,a cryogenic gas-gap heat switch concept for isolating redundantcryocoolers has been carried from initial concept throughsuccessful engineering model testing. In the process, thedesign has been thoroughly documented, and computer programshave been developed to provide the technology base required forfuture flight designs. An extensive test program has bothverified the excellent performance of the heat switch, andhighlighted minor deficiencies. These deficiencies, associatedwith heat-switch shorting during conditions of large temperaturedifferentials across the switch halves, have been thoroughlyanalyzed and understood. Means are described for eliminatingthese shortcomings in future designs. Lastly, the overallprocess of designing cryogenic gas-gap heat switches has beenconcisely summarized, and demonstrated for a l-watt/60KStirling-cooler application.
52

SECTION 6
REFERENCES
i. C. K. Chan, "Gas Adsorption/Absorption Heat Switch: Final
Report of Phase I," JPL Publication 87-7, Jet Propulsion
Laboratory, Pasadena, CA, July 15, 1987.
2. C. K. Chan, "Self-Actuated Heat Switches for Redundant
Cryocoolers," Proceedinqs of the Second Interagency
Meeting on Cryocoolers, David Taylor Research Center,
Annapolis, MD, pp. 217-226, 1986.
3. ',Self-Actuating Heat Switches for Redundant Refrigeration
Systems," U. S. Patent 4,771,823, September 20, 1988.
4. A. M. Lehtinen, "Cryocooler Subsystem Integration,"
AFWAL-TR-87-3054, Wright Patterson Air Force Base, Ohio,
September II, 1987.
5. C. A. Lewis, "Long Life Stirling Cycle Coolers for Appli-
cations in the 60 - IIOK Range: Vibration Characterization
and Thermal Switch Development," SAE Paper 891496, Society of
Automotive Engineers, Warrendale, PA, 1989.
6. A. H. Orlowska and G. Davey, "Measurement of Losses in
Stirling Cycle Cooler," CryoGenics, Vol. 27, 1987, p. 645.
7. Barron, R., Cryoqenic Systems, Second Edition, Oxford
University Press, New York, N.Y., 1985.
8. Scott, R.B., C_ryoqenic Engineerinq, D. Van Nostrand Co.,
Inc., Princeton, N.J., 1959.
53

TECHNICAL REPORT STANDARD TITLE PAGE
3. Recipient's Catalog No.1. Report No. 2. Government Accession No.JPL Pub. 90-38
4. Title and Subtitle
Design and Application of Gas-Gap Heat Switches:
Final Report of Phase II
7. Author b)C. K. Chan and R. G. Ross, Jr.
i
9. Performing Organization Name and Address
JET PROPULSION LABORATORY
California Institute of Technology4800 Oak Grove Drive _ ....-
Pasadena, Cal±fornlagll09
12. Sponsoring Agency Name and Addre_
NATIONAL AERONAUTICS AND SPACE ADMINISTRATION
Washington, D.C. 20546 -.
15. Supplementary Notes
5. Report DateMarch 15, 1990
6. Performing Organization Code
8. Performing Organization Report No.
10. Work Unit No.
11. Contract or Grant No.NAS 7-918
13. Type of Report and Period Covered
Jpl Publication
14. Sponsoring Agency Code
RE/ PX-644-I 1-00-05-81
16. A_tract
Gas-gap heat switcbes can serve as aneffective means of thermally disconnecting a
standby cryocooler when the primary (operating) cooler is connected and vice versa.
This report describes the final phase of the development and test of a cryogenic
gas-gap heat switch designed for loads ranging from 2 watts at 8K, to 100 watts at8OK. Achieved heat-switch on/off conductance ratios ranged from 11,000 at 8K to
2200 at 8OK,
A particularly challenging element of heat-switch design is achieving satisfactoryoperation when large temperature differentials exist across the switch. A special
series of tests and analyses was conducted and used in this Phase-II acitivity toevaluate the developed switches for temeprature differentials ranging up to 20OK.Problems encountered at the maximum levels are described and analyzed, and means of
avoiding the problems in the future are presented. The report concludes with a
comprehensive summary of the overall heat-switch design methodology with special
emphasis on lessons learned over the course of the 4-year development effort.
17. Key Words (Selected by Author{s))
ComponentsFluid Mechanics and Heat Transfer
-19. Security Classif. _f this report)
Unclassified
18. Distribution Statement
Unclassified -- Unlimited
20. Security Classlf. (of this page)
Unclassified
21. No. of Pages
59
22. Price
JPL 0184 R 9f'83