design & proportional computational assessment …
TRANSCRIPT

© 2018 JETIR July 2018, Volume 5, Issue 7 www.jetir.org (ISSN-2349-5162)
JETIRC006370 Journal of Emerging Technologies and Innovative Research (JETIR) www.jetir.org 354
DESIGN & PROPORTIONAL COMPUTATIONAL
ASSESSMENT BETWEEN A CONVENTIONAL
AND CIRCULAR DUCT SYSTEM
An industrial air conditioning – A Case Study
1 H A Shah, 2 P T Patel, 3 K B Gaywala 1, 2, 3Assistant Professor
1, 2, 3 Mechanical & Automobile Engineering Department 1, 2, 3 Chhotubhai Gopalbhai Patel Institute of Technology, Uka Tarsadia University, Gopal-Vidyanagar, Maliba Campus, Surat
(Gujarat) – 394350, India
________________________________________________________________________________________________________
Abstract : The successful operation of any air-conditioning system is dependent upon the sufficient circulation of air in the air-
conditioned space. The careful estimation of the pressure losses is necessary for the selection of proper duct size. The duct cost in
air conditioning system is 20 to 30 % of the total cost of the equipment's requirement and power required by the fan contributes
the substantial part of the running cost. It is, therefore, necessary to design an air duct system for least capital cost & lowest
running cost of the fan. Duct design is the design of pipes which convey conditioned air and then distribute it to different spaces
according to the requirement. The advantages of well designed and constructed interior duct systems are numerous. Among these
advantages are improved energy efficiency through the elimination of duct leakage to outside and the elimination of conductive
heat gains/losses. This paper focuses on a study of design and modifications air cooling duct using Computational Fluid
Dynamics (CFD) analysis considering all air flow features relating to the duct system efficiency. The need for optimizing duct
design especially to provide improved flow conditions. It combines theoretical and software-enabled tools to provide a detailed
comparative analysis of the costs and benefits involved in selecting a particular shape (rectangular or circular) of duct for a
prescribed situation. The focus of this paper will be on using CFD software tools to study velocity distribution of air in the duct at
various sections, pressure difference at various outlets and distribution of air flow for different load conditions.
IndexTerms - Duct system, Duct design, Duct installation, Heating, Ventilation, Air conditioning, Dynamic pressure
distribution, Velocity profile, Turbulence, CFD
________________________________________________________________________________________________________
I. INTRODUCTION
An air conditioning duct is a type of pipe or tunnel that is used to distribute air throughout a structure. Systems of ducts, known
as ductwork, are a central component of a building's Heating, Ventilation and Air Conditioning (HVAC) system. In most
systems, only one set of ductwork is present, which is used to transport cool air in the summer and heated air in the winter, along
with as air required for general ventilation needs [1]. Air conditioning duct is used only with central air units and is not required
for homes that rely on split systems or ductless air conditioning. The purpose of air conditioning ductwork is to deliver air from
the fan to the diffusers which distribute the air to the room. Air moves through the ductwork in response to a pressure difference
created by the fan [2].
A system of intake grilles or louvres pulls fresh air from outside into the central air unit. The air is cooled, blown into an air
conditioning duct system, where it is distributed to various rooms. The cool air enters the rooms through air terminal units
installed at the end of each duct line, which generally take the form of diffusers or grilles. This network of ducts that transport
cool air from the unit to each room is called the supply ductwork [3].
Fig. 1: Simple duct layout [2]

© 2018 JETIR July 2018, Volume 5, Issue 7 www.jetir.org (ISSN-2349-5162)
JETIRC006370 Journal of Emerging Technologies and Innovative Research (JETIR) www.jetir.org 355
II. DESIGN APPROACH
It consists of embroidery machines, which can be considered as factory. This design is mainly based on maintaining the
temperature of the room so aesthetic and noise considerations are of most importance in duct design. For this purpose, the aim is
to design effective duct layout which can ensure human comfort besides sufficient air distribution, lower power consumption
with the minimum noise level [4].
The objectives of good duct design are occupant comfort, proper air distribution, economical heating and cooling system
operation and duct installation. The outcome of the duct design process will be a duct system (supply and return plenums, ducts,
fittings, boots, grilles, and registers) that provides following functions [6].
(1) It provides conditioned air to meet all room heating and cooling loads.
(2) It is properly sized so that the pressure drop across the air handler is within manufacturer and design specifications.
(3) It is sealed to provide proper air flow and to prevent air from entering the house or duct system from polluted zones.
(4) It has balanced supply and return air flows to maintain a neutral pressure in the house.
(5) It minimizes duct air temperature gains or losses between the air handler and supply outlets, and between the return register
and air handler.
Fig. 2: Working principle of HVAC
Fig. 3: Types of supply duct system [3]
In this research article, cooling load calculation and completed the design of air condition duct for one site using HEAT LOAD
software and CAD software is discussed [7]. Load calculation and design of Radhe Krishna Diamond factory¸ Surat, Gujarat,
India site is discussed in below sections.
There are three different methods of duct design:
Velocity Reduction Method
Equal Friction Method
Static Regain Method
Duct design is done using velocity reduction method. Velocity method is one of the simplest ways of designing the duct system
for both supplies and return air. However, the application of this method requires selection of suitable velocities in different
duct runs, which requires experience. Wrong selection of velocities can lead to very large ducts, which, occupy large building

© 2018 JETIR July 2018, Volume 5, Issue 7 www.jetir.org (ISSN-2349-5162)
JETIRC006370 Journal of Emerging Technologies and Innovative Research (JETIR) www.jetir.org 356
space and increases the cost or very small ducts lead to large pressure drop and hence necessitates the selection of a large fan
leading to higher fan cost and running cost.
Fig. 4: Layout of Radhe Krishna Diamond factory¸ Surat, Gujarat, India
2.1 Calculation of duct cross-section area [5]:
Aspect Ratio: It is a ratio of two sides of rectangular duct shape.
Aspect ratio=a/b (Where a = width, b = height)
Fig. 5: Rectangular duct shape geometry
CFM (Cubic Feet per Minute): It is a unit of air flow rate generally used in air conditioner system.
Area=cfm/velocity
Equivalent diameter (D): The equivalent diameter is the diameter of a circular duct or pipe that gives the same pressure
loss as an equivalent rectangular duct or pipe.
Where, D=2ab/(a+b)
The factors for the dust design are: Area of the room, Occupancy, Cooling load
Table 2.1: Velocity for different applications
Type of area Velocity(ft/min) Remark
Bedroom 900 Silent
Living room 1000-1100 Somewhat noisy
Factory/Industry 1400 Noisy
2.2 Calculation of cooling load using Heat Load Software [10]:
A Layout of Radhekrishna Diamond factory is shown in above figure 4. Here different parameters include dimensions of the
site (length, width, height) and wall thickness are discussed by observing site properly. By entering these parameters into HEAT
LOAD software cooling load is calculated.
2.3 Selection of Air Conditioner Unit :
The Total cooling load required for an industrial site is 44520 Watt. The required corresponding air flow rate is 8228 cubic feet
per minute. With respect to the requirement of power and air flow rate, the AC unit have been selected from the catalogue of
DAIKIN AIR CONDITIONER. The unit having model No: RXYQ16PRY6/PAY6 is selected from the catalogue.
2.4 Calculation of Duct cross-section Area:
The selected velocity between the living room and factory which is 1200 ft/min.
Dimension for main duct:
Duct Area=cfm/velocity =8228/1200 = 6.86 ft2 = 0.64 m2
In order to make rectangular duct c/s, taken Aspect Ratio=a/b=2

© 2018 JETIR July 2018, Volume 5, Issue 7 www.jetir.org (ISSN-2349-5162)
JETIRC006370 Journal of Emerging Technologies and Innovative Research (JETIR) www.jetir.org 357
Area = a × b = 0.64 m2 = 2 × b2 = 0.64 m2, b = 0.56 m, a = 1.13 m
Likewise all the calculations for the main duct are tabulated as follows:
Table 2.2: Dimensions for main duct for Industrial site
Reduction
No. CFM
Velocity
(ft/min)
Area
(m2) Aspect ratio
a
(m)
b
(m)
Equivalent
diameter
(m)
1st 5484 1150 0.44 2.0 0.94 0.47 0.63
2nd 2740 1100 0.23 2.0 0.68 0.34 0.45
Equivalent diameter of main duct is 0.75 m.
Dimensions for branches from the main duct:
Table 2.3: Dimensions for sub-branches for Industrial site
Branch
No. CFM
Velocity
(ft/min)
Area
(m2)
Aspect
ratio
a
(m)
b
(m)
Equivalent
diameter (m)
1 1372 1100 0.11 2.0 0.46 0.23 0.31
2 1372 1100 0.11 2.0 0.46 0.23 0.31
3 1372 1000 0.12 2.0 0.50 0.25 0.33
4 1372 1000 0.12 2.0 0.50 0.25 0.33
5 1372 900 0.14 2.0 0.52 0.26 0.35
6 1372 900 0.14 2.0 0.52 0.26 0.35
III. SIMULATION-BASED APPROACH
The paper included the analysis of two shapes viz. circular and rectangular cross-section ducts and selection of one which
encounters minimum distribution losses. The principle of Computational Fluid Dynamics was applied for fluid flow analysis, by
using the following tool:-
Fluent – A commercial software package used to simulate the pressure drop inside the duct. The following sequence of steps
were followed to obtain the desired results while performing the software analysis: Creating geometry in ANSYS > Meshing in
ANSYS with Tool > Setting boundary types in ANSYS > Setting up a problem in FLUENT > Solving and obtaining solutions
in FLUENT. Duct design is done using velocity reduction method. This CFD tool can be used for a whole building to analyze
air pressure and velocity fluctuation for the duct [11, 12].
(a) CAD Geometry (b) Mesh Modal
Fig.6: Conceptual design of duct system
(a) Front view (b) Side view

© 2018 JETIR July 2018, Volume 5, Issue 7 www.jetir.org (ISSN-2349-5162)
JETIRC006370 Journal of Emerging Technologies and Innovative Research (JETIR) www.jetir.org 358
(c) Top view
Fig. 7: Velocity distribution in the rectangular duct for Industrial site
(a) Side view (b) Front view
(c) Top view
Fig. 8: Velocity distribution in the circular duct for Industrial site
The comparison of the velocity of air flowing through the rectangular duct and circular duct is shown in Fig. 7 & 8. Inlet
velocity of 6 m/s is selected in both cases [10]. In rectangular duct maximum velocity is 9.84 m/s and in circular duct maximum
velocity is 13.4 m/s. Here, maximum velocity in both cases occurs at bends. It is difficult to manufacture circular bend. So the
provision of a straight duct is done at a branch. Due to this maximum velocity occurs at a bend in the circular duct [13].
(a) Rectangular Duct (b) Circular Duct
Fig. 9: Static Pressure distribution for Industrial site
© 2018 JETIR July 2018, Volume 5, Issue 7 www.jetir.org (ISSN-2349-5162)
JETIRC006370 Journal of Emerging Technologies and Innovative Research (JETIR) www.jetir.org 359
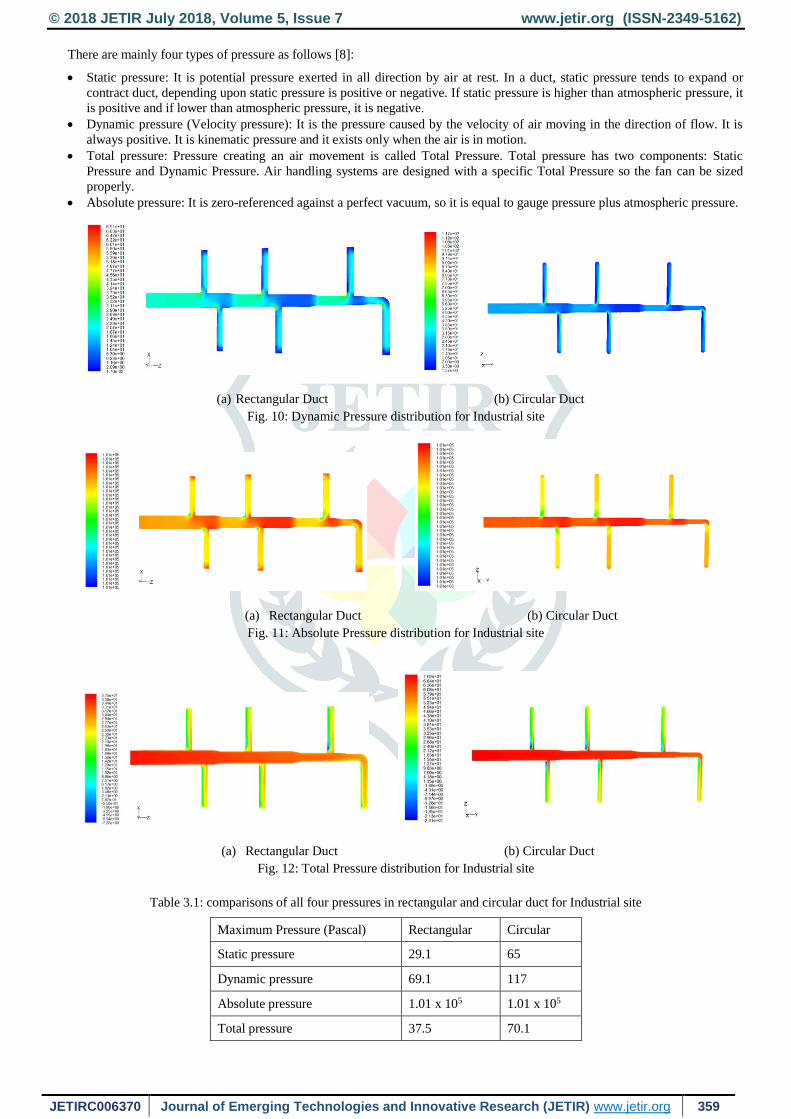
There are mainly four types of pressure as follows [8]:
Static pressure: It is potential pressure exerted in all direction by air at rest. In a duct, static pressure tends to expand or
contract duct, depending upon static pressure is positive or negative. If static pressure is higher than atmospheric pressure, it
is positive and if lower than atmospheric pressure, it is negative.
Dynamic pressure (Velocity pressure): It is the pressure caused by the velocity of air moving in the direction of flow. It is
always positive. It is kinematic pressure and it exists only when the air is in motion.
Total pressure: Pressure creating an air movement is called Total Pressure. Total pressure has two components: Static
Pressure and Dynamic Pressure. Air handling systems are designed with a specific Total Pressure so the fan can be sized
properly.
Absolute pressure: It is zero-referenced against a perfect vacuum, so it is equal to gauge pressure plus atmospheric pressure.
(a) Rectangular Duct (b) Circular Duct
Fig. 10: Dynamic Pressure distribution for Industrial site
(a) Rectangular Duct (b) Circular Duct
Fig. 11: Absolute Pressure distribution for Industrial site
(a) Rectangular Duct (b) Circular Duct
Fig. 12: Total Pressure distribution for Industrial site
Table 3.1: comparisons of all four pressures in rectangular and circular duct for Industrial site
Maximum Pressure (Pascal) Rectangular Circular
Static pressure 29.1 65
Dynamic pressure 69.1 117
Absolute pressure 1.01 x 10⁵ 1.01 x 10⁵
Total pressure 37.5 70.1

© 2018 JETIR July 2018, Volume 5, Issue 7 www.jetir.org (ISSN-2349-5162)
JETIRC006370 Journal of Emerging Technologies and Innovative Research (JETIR) www.jetir.org 360
Fig. 13: Turbulence in the rectangular duct for Industrial site
Fig.14: Turbulence in the circular duct for Industrial site
Here in case of a circular duct, more turbulence is created at the branch as bend are not provided. So, from noise generation
point of view rectangular ducts are preferable as it is possible to provide bends at a branch.
IV. RESULT & DISCUSSION
The experimental and computational investigation provided a satisfactory tool to capture the complex airflow pattern of a
number of industrial ducts. CFD analysis provides the ability to quantify flow improvement and to quickly predict the
behaviour of the several design proposals at low cost. The CFD analysis has offered a comprehensive range of output including
velocity distribution, pressure profile and turbulence levels. Subsequent testing of the modified duct system has validated the
approach using CFD analysis tools.
The following various conclusions summarize the present paper:
The cooling load calculation of an industrial site is done, applying various methods and duct design is carried out by
velocity method. All results are comparable with existing plant by authors.
Due to less value, duct diameter is increased but a loss in static pressure, velocity pressure can be avoided. The Smaller
diameter of the duct would increase the noise level. So the requirement of sound attenuating devices may need. Also, the
probability of dampers is decreased with increasing diameter. But the first cost is increased with increasing duct
diameter.
Due to proper branching (with elbow) of ducts, a loss is minimized in this design. But in existing plant, there is straight
branching in so many locations, which may increase the pressure loss.
Pressure loss in duct fitting is kept minimum by using elbow with proper shape considering very less pressure loss
coefficient.
CFD software is used to analyze the airflow in the straight duct and an elbow. Eddies are observed due to an incorrect
shape of the elbow. So proper shape of an elbow and correct velocity are estimated to minimize eddies as well as
pressure loss.
CFD can be used to study pressure and velocity fluctuation for a whole building. So it is a better tool which can be used
in HVAC system to save time and cost.
In this case study, it is concluded that if a proper cross-section of the duct and duct layout is designed then it can ensure proper
air distribution for human comfort. From a comparison of three duct design method named Velocity Reduction, Equal Friction
and Static Regain based on various parameters such as a total surface area of the duct, pressure losses, identify the best method
for duct design for a particular site. Pressure losses are also less in case of the circular duct. Due to improper shape and velocity,
eddies are observed in the elbow with CFD analysis. So by proper shape, eddies are minimized analysis of all ducting.

© 2018 JETIR July 2018, Volume 5, Issue 7 www.jetir.org (ISSN-2349-5162)
JETIRC006370 Journal of Emerging Technologies and Innovative Research (JETIR) www.jetir.org 361
V. ACKNOWLEDGMENT
The authors are very grateful to the management of Radhe Krishna Diamond factory, Gujarat, India for permitting to carry out
field research study at their mines. We would like to express our true and sincere acknowledgements as the appreciation for
their contributions, encouragement and support of Coolline Agency Pvt. Ltd. Surat. We would also thank our institution and our
students (Desai Jigar, Kapadia Shiv, Sharma Mahesh and Chaudhari Chetan) without whom this paper would have been a
distant reality. We would also like to acknowledge Faculties of SVNIT, SURAT for using their Lab facilities.
REFERENCES
[1] Dr. Ghate., K,Sudhakar., and Majumdar,P.M., “3-D Duct Design Using Variable Fidelity Method” CASDE, Powai ,
Mumbai, pp.1-11.
[2] Cai, J., and G. Thierauf. 1993. Discrete optimization of structures using an improved penalty function method. Eng.Opt.,
Vol. 21, pp. 293-306.
[3] Tsal, R.J., and M.S. Adler. 1987. Evaluation of numerical methods for ductwork and pipeline optimization ASHRAE
Transactions 93(1): 17-34
[4] HVAC duct systems inspection guide SECOND EDITION — JUNE 2000 Sheet metal and air conditioning contractors’
national association, inc. Lafayette center drive Chantilly.
[5] Tsal, R.J., H.F. Behls, and R. Mangel. 1988. T-method duct design, Part I: Optimization theory, Part II: Calculation
procedure and economic analysis. ASHRAE Transactions 94(2): 90-111, 112-151.
[6] ASHRAE. 1993. ASHRAE duct fitting database. Atlanta: American Society of Heating, Refrigerating and Air-
Conditioning Engineers, Inc.
[7] ASHRAE. 1997. 1997 ASHRAE handbook—Fundamentals, Chapter 32, Duct Design. Atlanta: American Society of
Heating, Refrigerating and Air-Conditioning Engineers, Inc.
[8] Modeling and optimization of HVAC systems using a dynamic neural network (online 27 April 2012 by Andrew
Kusiak, Guanglin Xu) ELSEVIER Publication on Energy.
[9] Experimental investigation of heat recovery system for building air conditioning in hot and humid areas. (Online 2
January 2012 by Shahram Delfani, Hadi Pasdarshahri, Maryam Karami, ) Published by Elsevier Ltd. On Energy and
buildings.
[10] Optimum Duct Design for Variable Air Volume Systems, Part 1: Problem Domain Analysis of VAV Duct Systems.
(Online 2002 by Taecheol Kim, Jeffrey D. Spitler, Ph.D., P.E. Ronald D. Delahoussaye, Ph.D. Published in ASHRAE
Transactions: Research.
[11] Dr. Neihad AL-KHALIDY, “Design Optimization Of Industrial Duct Using Computational Fluid Dynamics”, Third
International Conference on CFD in the mineral and Process Industries, CSIRO, Melborne, Australia, 10-12 December
2003.
[12] Huang Xiang, “CFD Simulation And Analysis Of The Combined Evaporative Cooling And Radiant Ceiling Air-
Conditioning System”, HVAC Technologies for Energy Efficiency Vol.IV-3-3.
[13] The Public Interest Energy Research (PIER) Program “Duct Leakage Impacts on VAV System Performance in
California Large Commercial Buildings”, Contract Number 400-99-012-1, conducted by the Energy Performance of
Buildings Group, Environmental Energy Technologies Division of the Lawrence Berkeley National Laboratory
(Published October 2003).