design a eeg transmission and receving system using infrared waves for states of sleep
TRANSCRIPT

Design a Electronenceohaplogram (EEG) transmission and receving system using infrared waves for states of sleep
Project
Submitted in partial fulfillment of the requirements For the degree of
BACHELOR OF ENGINEERING
By
VIRAJ N.SHAH RAHUL T.N.U NAIR
VIJIT MISHRA SHASHANK S. TOTRE
Under the guidance of
Prof. Bhavesh Parmar
DEPARTMENT OF BIOMEDICAL ENGINEERING MGM COLLEGE OF ENGINEERING AND TECHNOLOGY
UNIVERSITY OF MUMBAI 2004-2005

2
APPROVAL SHEET
Project Entitled: Design a Electronenceohaplogram (EEG) transmission and receving system using infrared waves for neurological disorders Submitted by: VIRAJ N.SHAH RAHUL T.N.U NAIR VIJIT MISHRA SHASHANK S.TOTRE in partial fulfillment of the degree of B.E. in Biomedical Engineering is approved. Guides Examiners _____________________ ______________________ _____________________ ______________________ ________________________ _____________________ Head of the Department Principal Date:

3
TableofContents
CHAPTER1................................................................................................................................5
INTRODUCTION.........................................................................................................................51.1MOTIVATION..............................................................................................................................71.2BASICBACKGROUND....................................................................................................................71.3ORGANISATIONOFTHEREPORT....................................................................................................81.4WORKDONE..............................................................................................................................9
1.4.1DemonstrationoftheEquipment....................................................................................91.4.2BlockDiagramDescription...............................................................................................9
CHAPTER2..............................................................................................................................10
ANATOMYOFTHEBRAIN........................................................................................................102.1.BRAINSTEM.............................................................................................................................11
2.1.1 MedullaOblongata....................................................................................................112.1.2 Midbrain....................................................................................................................112.1.3 Pons...........................................................................................................................112.1.4 Cerebellum.................................................................................................................11
2.2THELOBESOFTHEBRAIN............................................................................................................112.2.1FrontalLobe...................................................................................................................122.2.2ParietalLobe..................................................................................................................122.2.3OccipitalLobe................................................................................................................132.2.4TemporalLobe...............................................................................................................13
2.3.BRAINFUNCTIONS&DISORDERS.................................................................................................13
CHAPTER3..............................................................................................................................18
THEEEGSIGNAL......................................................................................................................183.1ALPHAWAVES:..........................................................................................................................193.2BETAWAVES:............................................................................................................................193.3THETAWAVES:..........................................................................................................................193.4DELTAWAVES:..........................................................................................................................19
CHAPTER4..............................................................................................................................20
THEBASICPRINCIPLESOFEEGDIAGNOSIS...............................................................................204.1MORPHOLOGY:.....................................................................................................................21
4.1.1Kcomplex:......................................................................................................................214.1.2Vwaves..........................................................................................................................214.1.3Lambdawaves...............................................................................................................224.1.4Positiveoccipitalsharptransientsofsleep[POSTS].......................................................224.1.5Sleepspindles.................................................................................................................224.1.6Muwaves-Wicketrhythmorrhythmenarceau..........................................................234.1.7Spikesandsharpwaves.................................................................................................234.1.8Benignepileptictransientsofsleep...............................................................................24
CHAPTER5..............................................................................................................................25
INSTRUMENTATION................................................................................................................255.1BLOCKDIAGRAMOFEEGPREAMPLIFIERANDTRANSMITTER:............................................................25
5.1.1 BufferAmplifier.........................................................................................................255.1.2 InstrumentationAmplifier.........................................................................................26

4
5.1.3 LowpassFilter...........................................................................................................275.1.4 HighPassFilter..........................................................................................................285.1.5 VtoFconverter.........................................................................................................285.1.6 InfraredDriver...........................................................................................................29
5.2DESCRIPTIONOFRECEIVERCIRCUIT:...........................................................................................30

5
Chapter 1 Introduction
EEG is an acronym for Electroencephalograph. This is a recording ("graph") of electrical signals
("electro") from the brain ("encephalo"). They are recorded on chart paper that moves underneath
pens that are connected to galvanometers that read the electrical signals from electrodes on the scalp.
These electrodes do not send any electricity to the person. They only receive electrical signals
naturally generated by the brain.
Electroencephalography (EEG) waveforms generally are classified according to their frequency,
amplitude, and shape, as well as the sites on the scalp at which they are recorded. The most familiar
classification uses EEG waveform frequency (e.g. alpha, beta, and theta).
Information about waveform frequency and shape is combined with the age of the patient, state of
alertness or sleep, and head site to determine significance.
Normal EEG waveforms are defined and described by the following criteria:
Ø Frequency (Hertz, Hz) is the initial characteristic used to define normal or abnormal EEG
rhythms.
Ø Most waves of 7.5 Hz and higher frequencies are normal findings in the EEG of an awaked
adult. Waves with a frequency of 7 Hz or less often are classified as abnormal in awaked
adults, although they normally can be seen in children or in adults who are asleep. In certain
situations, EEG waveforms of an appropriate frequency for age and state of alertness are
considered abnormal because they occur at an inappropriate scalp location or demonstrate
irregularities in rhythmicity or amplitude.
Ø Some waves are recognized by their shape, head distribution, and symmetry. Certain patterns
are normal at specific ages or states of alertness and sleep.
Ø The morphology of a wave may resemble specific shapes, such as vertex (V) waves seen over
the vertex of the scalp in stage 2 sleep or triphasic waves that occur in the setting of various
encephalopathies.
From the EEG signal it is possible to differentiate alpha (α), beta (β), delta (δ), and theta (Ө) waves
as well as spikes associated with epilepsy. The alpha waves have the frequency spectrum of 8-13 Hz
and can be measured from the occipital region in an awaked person when the eyes are closed. The

6
frequency band of the beta waves is 13-30 Hz; these are detectable over the parietal and frontal
lobes. The delta waves have the frequency range of 0.5-4 Hz and are detectable in infants and
sleeping adults. The theta waves have the frequency range of 4-8 Hz and are obtained from children
and sleeping adults.
The EEG signal is closely related to the level of consciousness of the person. As the activity
increases, the EEG shifts to higher dominating frequency and lower amplitude. When the eyes are
closed, the alpha waves begin to dominate the EEG. When the person falls asleep, the dominant EEG
frequency decreases. In a certain phase of sleep, rapid eye movement called (REM) sleep; the person
dreams and has active movements of the eyes, which can be seen as a characteristic EEG signal. In
deep sleep, the EEG has large and slow deflections called delta waves. No cerebral activity can be
detected from a patient with complete cerebral death.
Although the origin of EEG responses is not completely brought to light, the signal itself proved to
be a valuable tool for diagnosis in the environment of clinical medicine, in particular in neurology, in
neurosurgery and in psychiatry. In addition to that, EEG recordings still require additional
investigations in studying epilepsy. In indicating epilepsy, it is able to detect abnormalities in
waveforms, such as spikes, sharp waves and spikewave discharges. Not only that specific forms of
epilepsy (absence epilepsy, hypsarithmia and benign focal epilepsy of childhood) can be found, but
also non-epileptic focal brain dysfunctions possibly caused by cerebrovascular disorders, tumors,
infections or traumas and generalized brain dysfunction in case of metabolic encephalopathy,
intoxication, encephalitis or degenerative dementia are reflected by the EEG signal. Such defects can
be classified as either occurring periodically or befalling in a more continuous fashion.
In most cases the EEG is considered to be a sensitive rather than a specific diagnostic instrument,
making it a suitable instrument to monitoring the course of a disorder on the one hand and to
determining a prognosis of the abnormality on the other. That is, the EEG can pick up very mild
degrees of brain dysfunction, but it seldom gives much information about the exact cause of the
abnormalities.
EEG may be prescribed by doctors to study the patient with a problem of Epilepsy, brain disorders,
etc. Hence, now-a-days EEG is getting a wider scope for its applications.
7
1.1 Motivation
We came across the use of EEG waveforms in medicine during our In Plant Training. We were quite
impressed by the developments taking place in this field and also the growing significance it is
gaining with its wider applications. It is considered as a boon to the patients with any kind of brain
disorders, as also in case of other fields. These are readings that can provide extensive study of the
brain and it’s functioning. Also, an important factor in India, it is not expensive and very user
friendly, causing no irritation to the patient or the person kept under study. Hence, the patient can get
quick results in his case study and can get proper treatment by the diagnosis of the result achieved
from the EEG recordings, thus ensuring fast recovery.
In hospital, EEG is not only monitored in OPD patients but also during surgeries, especially in
Cardiac Bypass surgeries, where the surgeon tries to monitor the proper functioning of the brain. The
operating theatre is always full with equipments and adding on a EEG machine with all its wires
would further jam up the OT.
We, decided to make the EEG recording process wireless or rather somewhat wire free. This would
help in easing the problem of the surgeon as the EEG wires would not add more congestion to the
existing system. So, we decide to make this machine, which would transmit EEG from the main
machine connected to the patient to the computer or a receiver and display the waveform.
1.2 Basic Background
The purpose of this equipment is to study the wave patterns obtained from the patient’s brain and do
proper analysis of those waveforms. As we have introduced the use of Infrared in our circuitry, this
can also be used for the purpose of telemetry also, other than our main purpose of recording the EEG
signal during a surgery. This is possible with the use of a good range Infra-Red transmitter and

8
receiver so that no obstacle is created for the surgeon while he is operating as well as he gets a proper
report of the brain functioning. As the patient will be induced during the surgery or rather he is
anesthetized , the surgeon expect a certain wave pattern. Any distortion in this wave can be taken as
malfunctioning in the brain activity, thereby giving the surgeon an alarm of what is happening.
It can also help in preventing a patient from going in comma as the state of the brain can be studied
and thereby necessary steps can be taken.
It was thereby concluded that for intensive care patients, OT patients and OPD patients EEG
recording via transmission can prove to be a boon and can be used without any harm or side effect.
1.3 Organisation Of The Report
Our report consists of the basic introduction about the equipment. It also includes the
basic principle, brain physiology & physiological effects of the equipment. This report consists of the
explanation of the various block of the circuit diagram.
It also includes the varied results and the discussions we had during the making of the
equipment. It has the General Purpose PCB designing concepts and it also essays the problems we
faced during the making of the project.
The report also includes EEG waveforms collected using 10 subjects in various
situations under different degrees of brain activity. We have tried our level best to analyze these
different waveforms and have summed them up in our report.

9
1.4 Work Done
1.4.1 Demonstration of the Equipment - We have seen the working of this equipment during our In
Plant Training. The demonstration helped us in understanding the details of the basic blocks of the
EEG machine.
1.4.2 Block Diagram Description - Under the guidance of our project incharge, we modified the
block diagram of the machine and included IC LM324 instead of IC INA111 and IC 741.

10
Chapter 2 ANATOMY OF THE BRAIN
The figure below shows the anatomy of the brain. We will define each and every part labeled in the
figure and explain the role played by them.
Fig: - The image on the left is the outside of the brain, viewed from the side, showing the major lobes (frontal,
parietal, temporal and occipital) and the brain stem structures (pons, medulla oblongata, and cerebellum).
The image on the right is a side-view showing the location of the limbic system inside the brain. The
limbic system consists of a number of structures, including the fornix, hippocampus, cingulate gyrus,
amygdala, the parahippocampal gyrus and parts of the thalamus.

11
2.1. Brainstem - The lower extension of the brain where it connects to the spinal cord. Neurological
functions located in the brainstem include those necessary for survival (breathing, digestion, heart
rate, blood pressure) and for arousal (being awake and alert).
Most of the cranial nerves come from the brainstem. The brainstem is the pathway for all fiber tracts
passing up and down from peripheral nerves and spinal cord to the highest parts of the brain.
2.1.1 Medulla Oblongata - The medulla oblongata functions primarily as a relay station for
the crossing of motor tracts between the spinal cord and the brain. It also contains the
respiratory, vasomotor and cardiac centers, as well as many mechanisms for controlling
reflex activities such as coughing, gagging, swallowing and vomiting
2.1.2 Midbrain - The midbrain serves as the nerve pathway of the cerebral hemispheres and
contains auditory and visual reflex centers.
Fig: - The Brain Stem
2.1.3 Pons - The pons is a bridge-like structure, which links different parts of the brain and
serves as a relay station from the medulla to the higher cortical structures of the brain. It
contains the respiratory center.
2.1.4 Cerebellum - The portion of the brain (located at the back) which helps coordinate
movement (balance and muscle coordination). Damage may result in ataxia, which is a
problem of muscle coordination. This can interfere with a person's ability to walk, talk,
eat, and to perform other self-care tasks.
2.2 The Lobes of the Brain – The major lobes of the brain are Frontal, Parietal, Temporal and
Occipital. They can be described individually as follows:-

12
Fig: - Frontal lobe of the brain
2.2.1 Frontal Lobe - Front part of the brain; involved in planning, organizing, problem
solving, selective attention, personality and a variety of "higher cognitive functions"
including behavior and emotions.
2.2.1.1 The anterior (front) portion of the frontal lobe is called the prefrontal
cortex. It is very important for the "higher cognitive functions" and the
determination of the personality.
2.2.1.2 The posterior (back) of the frontal lobe consists of the premotor and
motor areas. Nerve cells that produce movement are located in the motor
areas. The premotor areas serve to modify movements.
2.2.1.3 The frontal lobe is divided from the parietal lobe by the central
culcus.
2.2.2 Parietal Lobe - One of the two parietal lobes of the brain located behind the
frontal lobe at the top of the brain.
2.2.2.1 Parietal Lobe, Right - Damage to this area can cause visuo-spatial
deficits (e.g., the patient may have difficulty finding their way around new, or
even familiar, places).
2.2.2.2 Parietal Lobe, Left - Damage to this area may disrupt a patient's
ability to understand spoken and/or written language.
2.2.2.3 The parietal lobes contain the primary sensory cortex which
controls sensation (touch, pressure). Behind the primary sensory cortex is a
large association area that controls fine sensation (judgment of texture, weight,
size, shape).

13
2.2.3 Occipital Lobe - Region in the back of the brain, which processes visual information.
Not only is the occipital lobe mainly responsible for visual reception, it also contains
association areas that help in the visual recognition of shapes and colors. Damage to this lobe
can cause visual deficits.
2.2.4 Temporal Lobe - There are two temporal lobes, one on each side of the brain located at
about the level of the ears. These lobes allow a person to tell one smell from another and one
sound from another. They also help in sorting new information and are believed to be
responsible for short-term memory.
2.2.4.1 Right Lobe - Mainly involved in visual memory (i.e., memory for
pictures and faces).
2.2.4.2 Left Lobe - Mainly involved in verbal memory (i.e., memory for
words and names).
2.3. Brain functions & Disorders - The function of the various parts of the brain described above and
the various disorders associated with them have been summarized in the table shown below.
Brain Structure Function Associated Signs
and Symptoms
Cerebral Cortex
Ventral View (From bottom)
The outermost layer of the cerebral
hemisphere, which is composed of
gray matter. Cortices are
asymmetrical. Both hemispheres are
able to analyze sensory data, perform
memory functions, learn new
information, form thoughts and make
decisions.

14
Left Hemisphere
Sequential Analysis: systematic,
logical interpretation of information.
Interpretation and production of
symbolic information: language,
mathematics, abstraction and
reasoning. Memory stored in a
language format.
Right Hemisphere
Holistic Functioning: processing
multi-sensory input simultaneously to
provide "holistic" picture of one's
environment. Visual spatial skills.
The right hemisphere coordinates
holistic functions such as dancing and
gymnastics. Memory is stored in
auditory, visual and spatial
modalities.
Corpus Callosum
Connects right and left hemisphere to
allow for communication between the
hemispheres. Forms roof of the lateral
and third ventricles.
î Damage to the Corpus
Callosum may result
in "Split Brain"
syndrome.

15
Frontal Lobe
Ventral View (From Bottom)
Side View
Cognition and memory.
Prefrontal area: The ability to
concentrate and attend, elaboration of
thought. The "Gatekeeper";
(judgment, inhibition). Personality
and emotional traits.
Movement:
Motor Cortex (Brodman's): voluntary
motor activity.
Premotor Cortex: storage of motor
patterns and voluntary activities.
Language: motor speech
î Impairment of recent
memory,
inattentiveness,
inability to
concentrate, behavior
disorders, difficulty in
learning new
information. Lack of
inhibition
(inappropriate social
and/or sexual
behavior). Emotional
liability. "Flat" affect.
î Contra lateral plegia,
paresis.
î Expressive/motor
aphasia.
Parietal Lobe
Processing of sensory input, sensory
discrimination.
Body orientation.
Primary/ secondary somatic area.
Inability to discriminate
between sensory stimuli.
î Inability to locate and
recognize parts of the
body (Neglect).
î Severe Injury:
Inability to recognize
self.
î Disorientation of

16
environment space.
î Inability to write.
Occipital Lobe
Primary visual reception area.
Primary visual association area:
Allows for visual interpretation.
î Primary Visual
Cortex: loss of vision
opposite field.
î Visual Association
Cortex: loss of ability
to recognize object
seen in opposite field
of vision, "flash of
light", "stars".
Temporal Lobe
Auditory receptive area and
association areas.
Expressed behavior.
Language: Receptive speech.
Memory: Information retrieval.
Hearing deficits.
î Agitation, irritability,
childish behavior.
î Receptive/ sensory
aphasia.
Limbic System
Olfactory pathways:
Amygdala and their different
pathways.
Hippocampi and their different
pathways.
Limbic lobes: Sex, rage, fear;
emotions. Integration of recent
memory, biological rhythms.
î Loss of sense of
smell.
î Agitation, loss of
control of emotion.
Loss of recent
memory.

17
Hypothalamus.
Basal Ganglia
Sub cortical gray matter nuclei.
Processing link between thalamus and
motor cortex. Initiation and direction
of voluntary movement. Balance
(inhibitory), Postural reflexes.
Part of extra pyramidal system:
regulation of automatic movement.
î Movement disorders:
chorea, tremors at rest
and with initiation of
movement, abnormal
increase in muscle
tone, difficulty-
initiating movement.
î Parkinson's.

18
Chapter 3 THE EEG SIGNAL
From the EEG signal it is possible to differentiate alpha, beta, delta, and theta waves as well as
spikes associated with epilepsy. An example of each waveform is given in Figure
The alpha waves have the frequency spectrum of 8-13 Hz and can be measured from the occipital
region in an awake person when the eyes are closed. The frequency band of the beta waves is 13-30
Hz; these are detectable over the parietal and frontal lobes. The delta waves have the frequency range
of 0.5-4 Hz and are detectable in infants and sleeping adults. The theta waves have the frequency
range of 4-8 Hz and are obtained from children and sleeping adults.
Fig3.1: - Some examples of EEG waves.
• 3.1 Alpha waves - 8-13 Hz
• 3.2 Beta waves - Greater than 13 Hz
• 3.3 Theta waves - 3.5-7.5 Hz

19
• 3.4 Delta waves - 3 Hz or less
3.1 Alpha waves:
1. Alpha waves generally are seen in all age groups but are most common in adults.
2. They occur rhythmically on both sides of the head but are often slightly higher in
amplitude on the nondominant side, especially in right-handed individuals.
3. They tend to be present posteriorly more than anteriorly and are especially prominent
with closed eyes and with relaxation.
4. Alpha activity disappears normally with attention (eg, mental arithmetic, stress, opening
eyes). In most instances, it is regarded as a normal waveform.
5. An abnormal exception is alpha coma, most often caused by hypoxic-ischemic
encephalopathy of destructive processes in the pons (eg, intracerebral hemorrhage). In
alpha coma, alpha waves are distributed uniformly both anteriorly and posteriorly in
patients who are unresponsive to stimuli.
3.2 Beta waves:
1. Beta waves are observed in all age groups.
2. They tend to be small in amplitude and usually are symmetric and more evident
anteriorly.
3. Many drugs, such as barbiturates and benzodiazepines, augment beta waves.
3.3 Theta waves:
1. Theta waves normally are seen in sleep at any age. In awake adults, these waves are
abnormal if they occur in excess.
2. Theta and delta waves are known collectively as slow waves.
3.4 Delta waves:
1. These slow waves have a frequency of 3 Hz or less.
2. They normally are seen in deep sleep in adults as well as in infants and children.
3. Delta waves are abnormal in the awake adult.
4. Often, they have the largest amplitude of all waves.
5. Delta waves can be focal (local pathology) or diffuse (generalized dysfunction).

20
Chapter 4 THE BASIC PRINCIPLES OF EEG DIAGNOSIS
The EEG signal is closely related to the level of consciousness of the person. As the activity
increases, the EEG shifts to higher dominating frequency and lower amplitude. When the
eyes are closed, the alpha waves begin to dominate the EEG. When the person falls asleep,
the dominant EEG frequency decreases. In a certain phase of sleep, rapid eye movement
called (REM) sleep; the person dreams and has active movements of the eyes, which can be
seen as a characteristic EEG signal. In deep sleep, the EEG has large and slow deflections
called delta waves. No cerebral activity can be detected from a patient with complete cerebral
death. Examples of the above-mentioned waveforms are figure shown below:
Fig 4.1: -
Various EEG responses obtained for different body conditions

21
4.1 MORPHOLOGY:
This section identifies some normal waveforms, including K complex, V waves, lambda
waves, positive occipital sharp transients of sleep (POSTS), spindles, mu rhythm, spikes,
sharp waves, and certain delta waves (polyphasic and monophasic shapes).
These waves are recognized by their shape and form and secondarily by their frequency.
They include waves that may be normal in some settings and abnormal in others (eg, spikes,
sharp waves).
4.1.1 K complex:
Fig 4.2 – K complex
1. K complex waves are large-amplitude delta frequency waves, sometimes with a sharp
apex.
2. They can occur throughout the brain and usually are higher in amplitude and more
prominent in the bifrontal regions.
3. Usually symmetric, they occur each time the patient is aroused partially from sleep.
4. Semiarousal often follows brief noises; with longer sounds, repeated K complexes can
occur.
5. K complexes sometimes are followed by runs of generalized rhythmic theta waves; the
whole complex is termed an arousal burst.
4.1.2 V waves 1. V waves are sharp waves that occur during sleep. They are largest and most evident at the
vertex bilaterally and usually symmetrically.
2. They show phase reversal at the vertex.
3. V waves tend to occur especially during stage 2 sleep and may be multiple.
4. Often, they occur after sleep disturbances (eg, brief sounds) and, like K complexes, may
occur during brief semiarousals.
5. V waves are easy to recognize.

22
4.1.3 Lambda waves
Fig 4.3 – Lambda – POSTS
1. Lambda waves occur in the occipital regions bilaterally as positive (upgoing) waves.
2. They are triangular in shape and generally symmetric.
3. They occur in the awake patient and are said to be most evident when the subject stares at
a blank, uniform surface.
4. Lambda waves occur when reading and occasionally when watching TV.
5. Morphologically, they are similar to POSTS both in form and in occipital distribution.
4.1.4 Positive occipital sharp transients of sleep [POSTS] 1. POSTS are triangular waves that occur in the bilateral occipital regions as positive
(upgoing) waves.
2. They can be multiple and usually are symmetric.
3. POSTS occur in sleeping patients and are said to be most evident in stage 2 of sleep,
although they are not uncommon in stage 1.
4. POSTS are similar if not identical to lambda waves both morphologically and in the
occipital distribution.
4.1.5 Sleep spindles 1. Spindles are groups of waves that occur during many sleep stages but especially in stage
2.
2. They have frequencies in the upper levels of alpha or lower levels of beta.
3. Lasting for a second or less, they increase in amplitude initially and then decrease slowly.
The waveform resembles a spindle.
4. They usually are symmetric and are most obvious in the parasagittal regions.

23
4.1.6 Mu waves - Wicket rhythm or rhythm en arceau
Fig 4.4 – MU Wave pattern
1. Mu waves are runs of rhythmic activity that have a specific shape. They are rounded in
one direction with a sharp side in the other direction.
2. Frequency is one half of the fast (beta) activity.
3. Mu waves disappear with motor acts of the contralateral hand or arm.
4. Unlike alpha activity, they are not blocked by eye opening.
5. They often are asymmetric.
6. Mu waves are seen best when the cortex is exposed or if bone defects (e.g., post surgical)
are present in the skull.
7. They tend to be more evident over the motor cortex and in the parasagittal regions.
4.1.7 Spikes and sharp waves 1. These are recognized by their height, their sharp top, and their narrow base.
2. Spikes and sharp waves usually are abnormal.
3. They can be normal in the following settings:
a. V waves of sleep in the parasagittal regions in stage 2 sleep can be normal.
b. Small, sharp spikes of sleep or benign epileptiform transients of sleep (BETS) are
nonpathologic. They occur in the temporal regions, often switching from side to side. They
do not have slow-following waves as do most of the pathologic spikes of epilepsy.
c. Numerous artifacts resemble spikes, but they are distinguished by other waves that
may be present, by observation of the patient while they are occurring, and by experience.
d. POSTS can have a sharp contour yet be quite normal. They occur in the occipital
regions bilaterally during sleep.

24
4.1.8 Benign epileptic transients of sleep
Fig 4.5 – Benign epileptic wave form
1. These sharp, usually small waves occur on one or both sides (usually asynchronously),
especially in the temporal and frontal regions.
2. BETS are rare in children but are more frequent in adults and elderly persons.
3. Although they can occur in epileptic patients, BETS often are seen in individuals without
epilepsy and can be regarded as a probable normal variant.

25
Chapter 5
Instrumentation
5.1 Block Diagram of EEG Preamplifier and Transmitter:
Fig 5.1 EEG Transmitter Block diagram
The figure1 shows the block diagram of EEG preamplifier and transmitter circuit. The input is taken
with the help of three surface electrodes placed on three positions: -
a) Left
b) Right
c) Common
The different stages of above block diagram are explained as follows: -
5.1.1 Buffer Amplifier - First stage is the buffer amplifiers, which provides the impedance
matching at the inputs of instrumentation amplifier. The differential mode signal is
given to both the buffer amplifiers. One from right electrode and other from left
electrode. While common electrode is connected to the common point of non-
inverting terminals of two buffer amplifiers as shown in circuit diagram in fig.

26
Fig 5.2 Buffer Amplifiers and Electrodes
5.1.2 Instrumentation Amplifier - As we know that the amplitude of EEG signal
varies from 2 to 200 µVolt. So we have to use instrumentation amplifier. Here, the
gain of the amplifier is taken as 1100. With 1st stage gain of 11 and 2nd stage gain
is100. At the output of two capacitors are connected which provides A.C.
coupling to nullify the D.C. offset.
5.1.2.1 Design- The gain of instrumentation amplifier is given by
A = Av1 x Av2 = (1 + 2R1) ( R4 ) R2 R3
1st stage: Av1 = 11 = (1 + 2R1 ) R2
Select R2 = 20KΩ (pot)
We get, R1 = 100KΩ
2nd stage: Av2 = R4 R3
Select R3 = 10 KΩ
We get R4 = 1 MΩ

27
Fig.5.3 Instrumentation Amplifier
5.1.3 Low pass Filter - Here, 2nd order low pass Butterworth filter is used. This filter is
designed to pass all frequency below 5Hz. Along with filtering this circuit also
provides a gain of 2 to the EEG signal. To achieve adequate filtering the two low
pass filter stages are used.
5.1.3.1 Design of Low Pass Filter (L.P.F.):
The higher cut-off frequency is given by
Fh = 1 . 2Π √ (R1 R2 C1 C2 )
Select R1 = R2 = R and C1 = C2 = C.
20 Hz = 1 . 2 Π R C
Select C = 0.1µf.
We get, R = 10 KΩ

28
Fig.5.4 Low Pass circuit
5.1.4 High Pass Filter: - Here, 1st order high pass filter is used. This filter is designed
to pass all frequency above 20 Hz. This stage also provides a gain of 10 to the
EEG signal. So, after all stages the overall gain of this circuit becomes 44000.
5.1.4.1 Design of High Pass Filter (H.P.F.):
fl = 1 . 2 Π R C
Select C = 4.7 µf.
We get R = 10 KΩ
Fig.5.5 High Pass Filter
5.1.5 V to F converter - Voltage to frequency converter is basically a transmitter
circuit. For the transmission of captured EEG signal, IC XR2206 is used. IC 2206
is an important waveform generator IC This IC is capable of generating the sine
wave, ramp, triangular and square wave output. But in our case we are interested
in square wave only which will be used later to drive an infrared LED. The basic
circuit diagram of IC2206 as a transmitter is shown below in fig.: -

29
Here the input is given at the pin no.7 and the output in the form of square wave is
taken at pin no.11. The frequency of output at pin no.11 will be directly
proportional to the amplitude of input signal given to the pin no. 7. i.e. if
amplitude of EEG signal is high than the frequency of square wave will be high
and vice versa. This square wave signal is used to drive the next stage.
Fig.5.6 EEG transmission Circuit
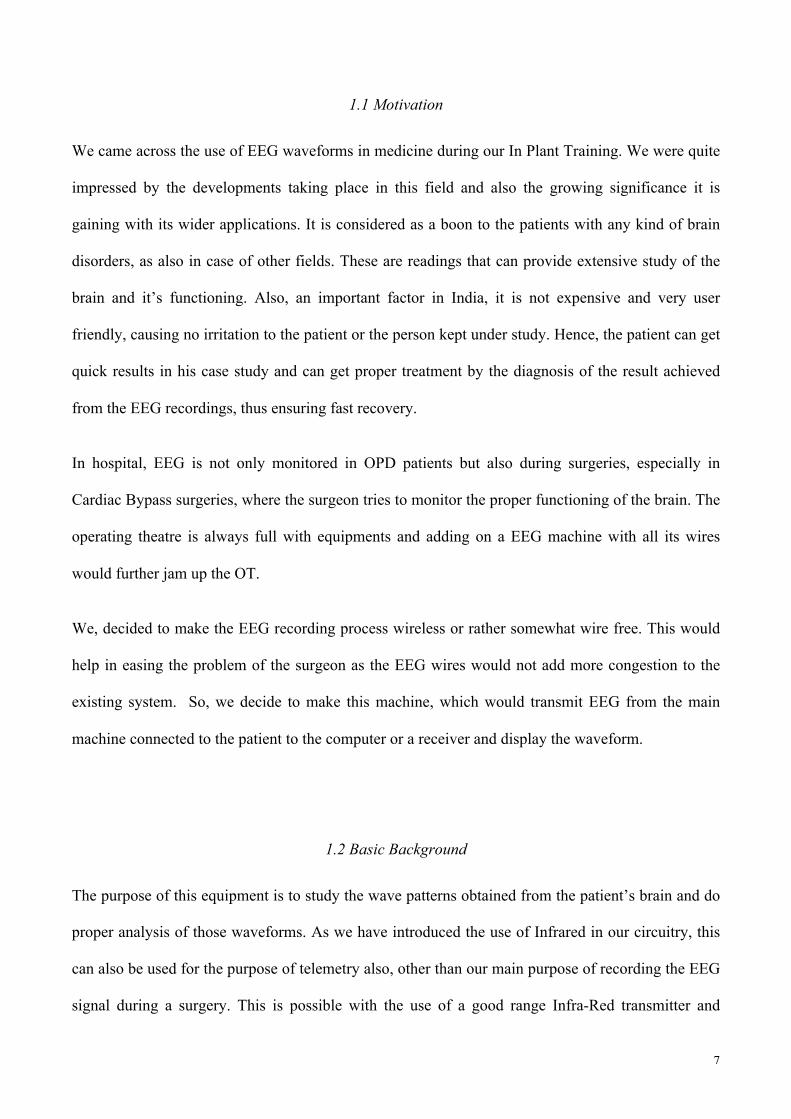
5.1.6 Infrared Driver - Now two infrared LEDs are used which are driven by a BJT,
which will be either in high state or low state as its input is square wave.
According to the amplitude of EEG signal the infrared LED will transmit the
signal. If the frequency is high then the transmission of the EEG signal will be
quicker and vice-versa.
30
Figure 5.7 Infrared Driver
5.2 Description of RECEIVER Circuit:
5.2.1 Infrared Receiver:
Infrared light generated by the LED’s is picked up at the receiver by a special infrared
phototransistor.
Referring to the circuit diagram of the receiver, the phototransistor is connected with its
cathode to the +9 v rail via an RC de-coupling network; while the anode is connected via
470k resistor to the ground. In operation the phototransistor acts as a current source i.e. it
generates the current proportional to the incident light. This current signal is converted to a
voltage signal by the 470k transistor.
The signal from the phototransistor is fed to the input T2 of a FET. The FET offers a high
input impedance, low output impedance. Output of FET is fed to a Band pass filter consisting
of transistor T3 and T4. The center frequency of the filter is about 10 KHz signal from the
transmitter, even allowing for some mistuning yet it affectively eliminates interference from
the other sources. (e.g. fluorescent light)
Disregarding the two 0.0068-microfarad capacitors (C5, C6) for the moment, T3 and T4 form
a second stage-inverting amplifier. Both transistors operate as CE amplifiers with the second
stage providing two separate outputs, one from the junction of the two 330-ohm transistor
and the second from T4’s collector. The first output has a low impedance and is used to drive
the filter and to provide DC feedback via the 47k resistor to bias T3.

31
The amplifier is used as a “multiple feedback” band pass filter. The filter components are the
0.068-microfarad capacitors (C5, C6) and the 47k bias resistors, which together with the low
output impedance of the previous FET stage determine the center frequency Q of the filter.
The collector output of T4 provides an amplified version of the filter output. This output is
DC coupled to the next stage, which consists of transistor T5, is another common amplifier
circuit. A 0.1-microfarad emitter bypass capacitor is included to provide further attenuation
of unwanted low frequency signals.
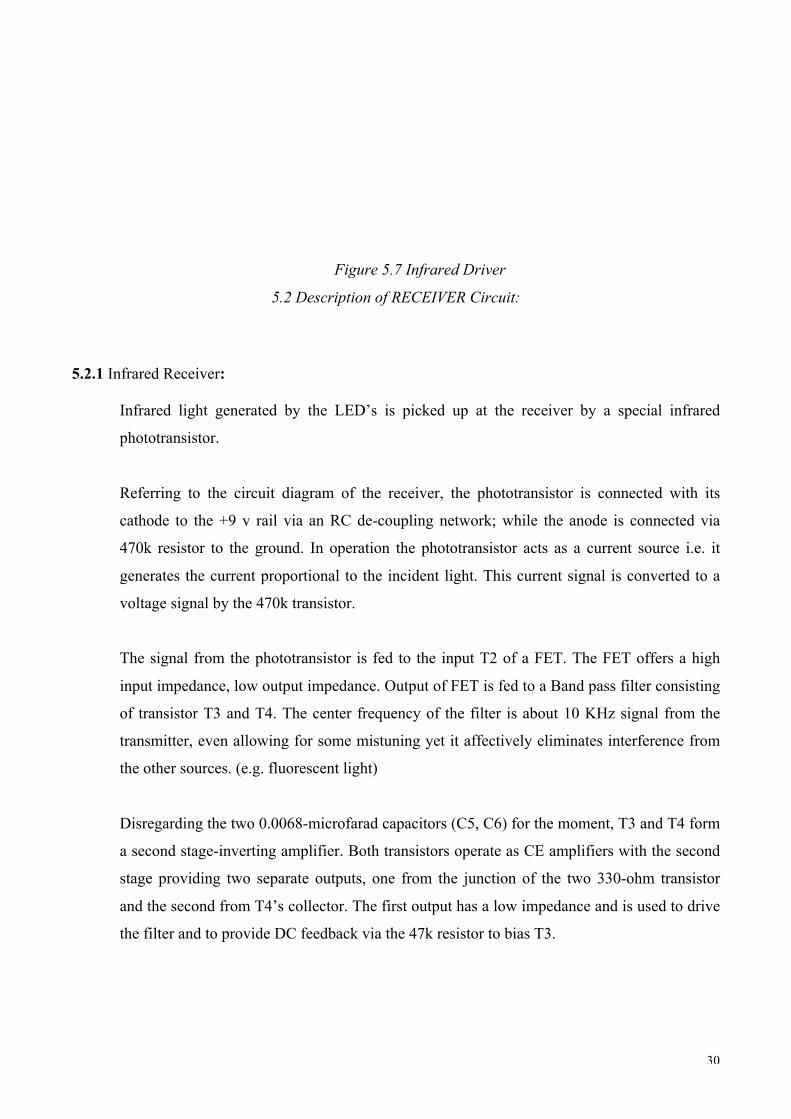
The CD4046BC micro power phase-locked loop (PLL) consists of a low power, linear,
voltage-controlled oscillator (VCO), a source follower, a zener diode, and two-phase
comparators. The two-phase comparators have a common signal input and a common
comparator input.
The signal input can be directly coupled for a large voltage signal, or capacitively coupled to
the self-biasing amplifier at the signal input for a small voltage signal. Phase comparator I, an
exclusive OR gate, provides a digital error signal (phase comp. I Out) and maintains 90°
phase shifts at the VCO center frequency. Between signal input and comparator input (both at
50% duty cycle), it may lock onto the signal input frequencies that are close to harmonics of
the VCO center frequency. Phase comparator II is an edge-controlled digital memory
network. It provides a digital error signal (phase comp. II Out) and lock-in signal (phase
pulses) to indicate a locked condition and maintains a 0° phase shift between signal input and
comparator input.
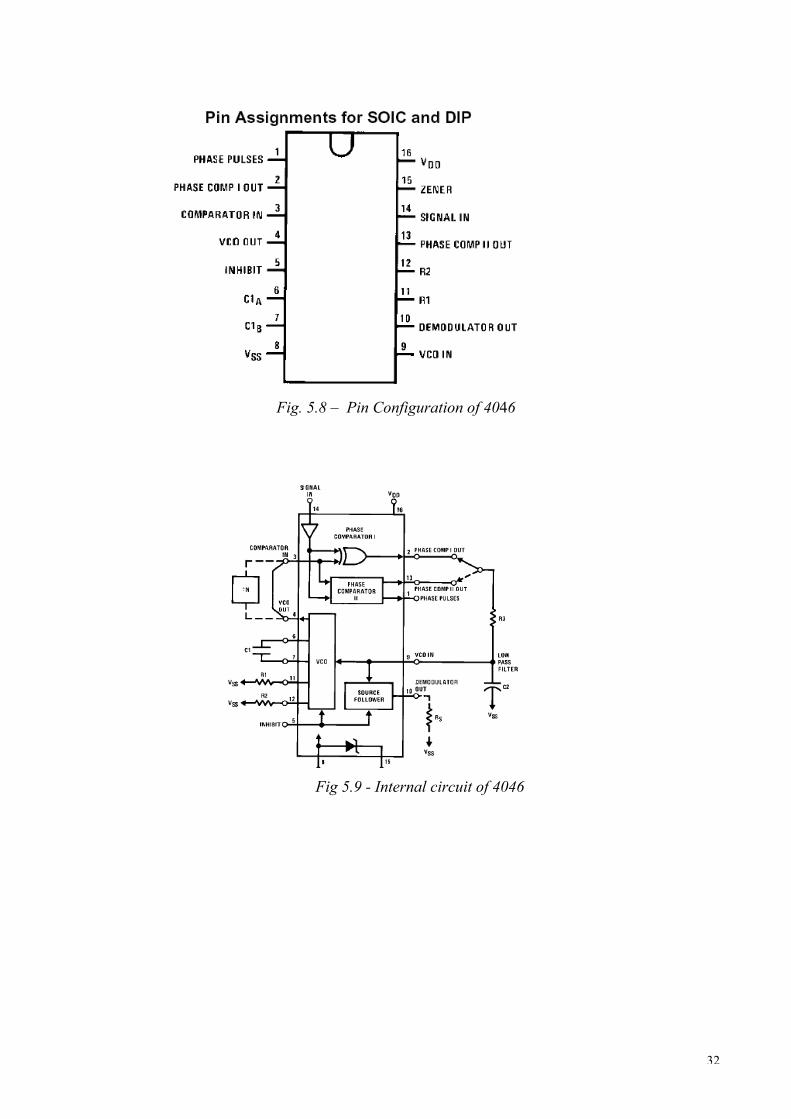
The linear voltage-controlled oscillator (VCO) produces an output signal (VCO Out) whose
frequency is determined by the voltage at the VCOIN input, and the capacitor and resistors
connected to pin C1A, C1B, R1 and R2. The source follower output of the VCOIN
(demodulator Out) is used with an external resistor of 10 kW or more. The INHIBIT input,
when high, disables the VCO and source follower to minimize standby power consumption.
The zener diode is provided for power supply regulation, if necessary.
32
Fig. 5.8 – Pin Configuration of 4046
Fig 5.9 - Internal circuit of 4046