descriptive statistics i - management by the numbers statistics i this module covers statistics...
TRANSCRIPT

Descriptive Statistics I
This module covers statistics commonly used to
describe or summarize a set of data, including
measures of central tendency (mean, median, mode)
and measures of variability (range, standard deviation,
variance).
Author: Phillip E. Pfeifer
© 2011 Phillip E. Pfeifer and Management by the Numbers, Inc.
TW
O K
IND
S O
F D
ES
CR
IPT
IVE S
TA
TIS
TIC
S
2
Two Kinds of Descriptive Statistics
MBTN | Management by the Numbers
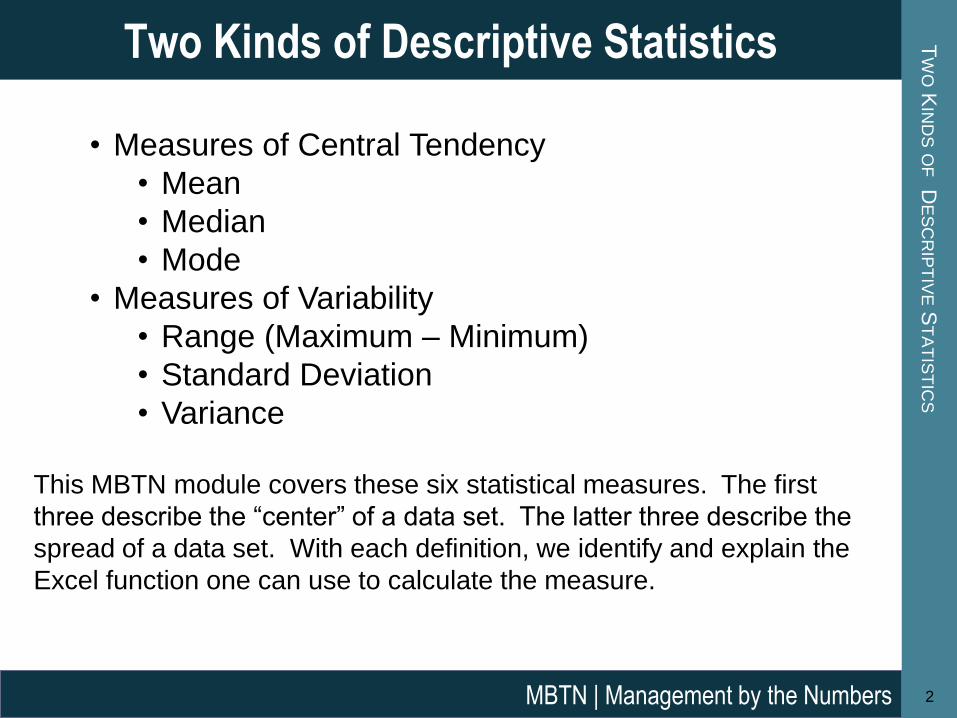
• Measures of Central Tendency
• Mean
• Median
• Mode
• Measures of Variability
• Range (Maximum – Minimum)
• Standard Deviation
• Variance
This MBTN module covers these six statistical measures. The first
three describe the “center” of a data set. The latter three describe the
spread of a data set. With each definition, we identify and explain the
Excel function one can use to calculate the measure.
TH
E S
AM
PL
E M
EA
N
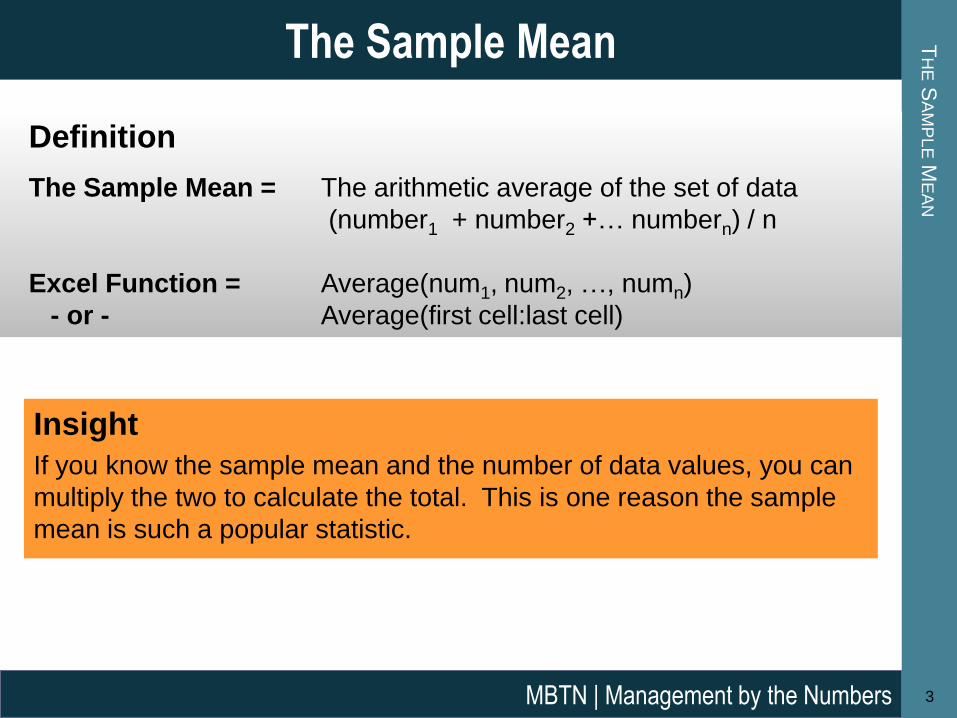
Definition
The Sample Mean = The arithmetic average of the set of data
(number1 + number2 +… numbern) / n
Excel Function = Average(num1, num2, …, numn)
- or - Average(first cell:last cell)
3
The Sample Mean
MBTN | Management by the Numbers
Insight
If you know the sample mean and the number of data values, you can
multiply the two to calculate the total. This is one reason the sample
mean is such a popular statistic.
TH
E S
AM
PL
E M
EA
N
4
The Sample Mean
MBTN | Management by the Numbers
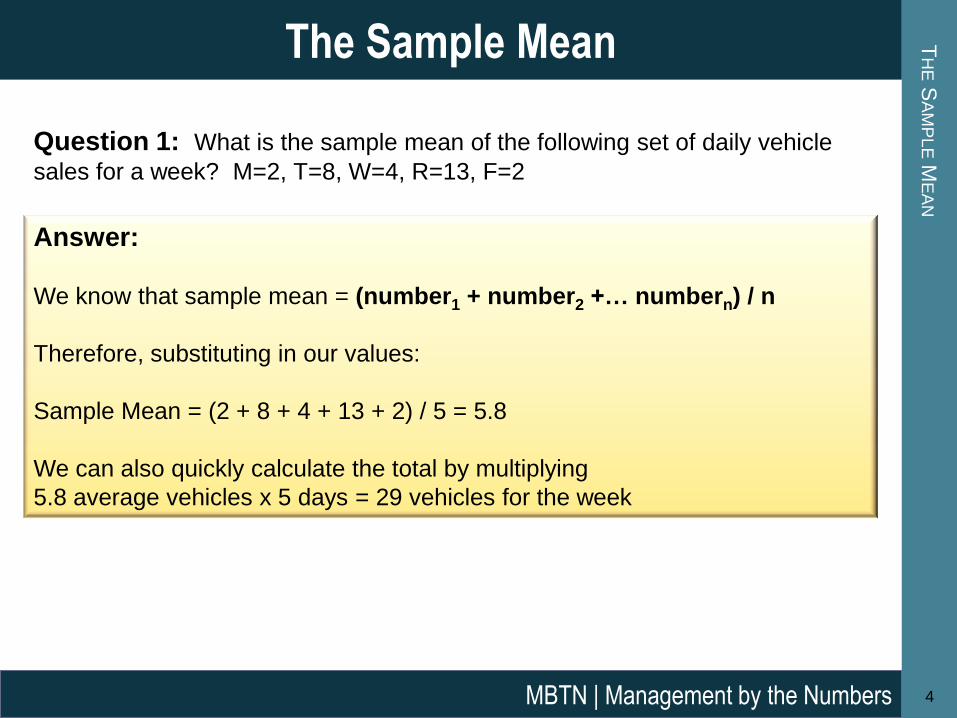
Question 1: What is the sample mean of the following set of daily vehicle
sales for a week? M=2, T=8, W=4, R=13, F=2
Answer:
We know that sample mean = (number1 + number2 +… numbern) / n
Therefore, substituting in our values:
Sample Mean = (2 + 8 + 4 + 13 + 2) / 5 = 5.8
We can also quickly calculate the total by multiplying
5.8 average vehicles x 5 days = 29 vehicles for the week
TH
E M
ED
IAN
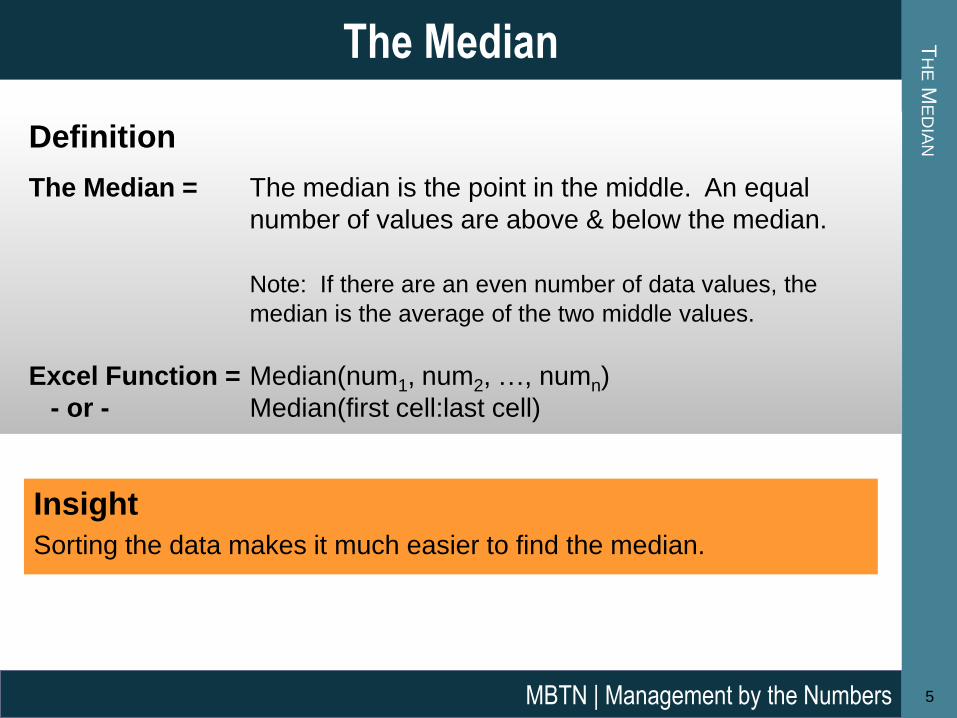
Definition
The Median = The median is the point in the middle. An equal
number of values are above & below the median.
Note: If there are an even number of data values, the
median is the average of the two middle values.
Excel Function = Median(num1, num2, …, numn)
- or - Median(first cell:last cell)
5
The Median
MBTN | Management by the Numbers
Insight
Sorting the data makes it much easier to find the median.

TH
E M
ED
IAN
6
The Median
MBTN | Management by the Numbers
Question 1: What is the median of the following set of daily vehicle sales for
a week? M=2, T=8, W=4, R=13, F=2
Answer:
We know that the median is the point in the middle of the sorted data set
Therefore, sorting our values:
Median = 2, 2, 4, 8, 13 = 4
Note that two values are below (2, 2) and two values are above (8, 13)
TH
E M
ED
IAN
7
The Median
MBTN | Management by the Numbers
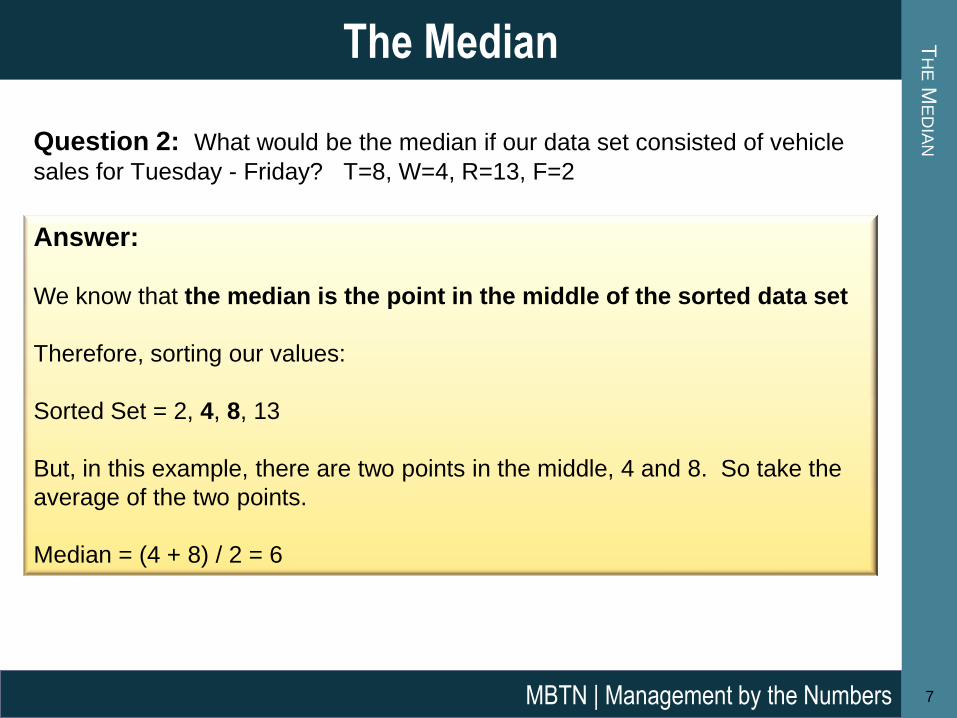
Question 2: What would be the median if our data set consisted of vehicle
sales for Tuesday - Friday? T=8, W=4, R=13, F=2
Answer:
We know that the median is the point in the middle of the sorted data set
Therefore, sorting our values:
Sorted Set = 2, 4, 8, 13
But, in this example, there are two points in the middle, 4 and 8. So take the
average of the two points.
Median = (4 + 8) / 2 = 6

TH
E M
OD
E Definition
The Mode = The Mode is the Value Occurring Most Often.
Note: If there are no repeated values, rather than say
all values “tie” for most occurring we say the data do
not have a mode.
Excel Function = Mode(num1, num2, …, numn)
- or - Mode(first cell:last cell)
8
The Mode
MBTN | Management by the Numbers
Definitions
Unimodal = Where only one value occurs most often
Bimodal = Where two values tie for occurring most often
TH
E M
OD
E
9
The Mode
MBTN | Management by the Numbers
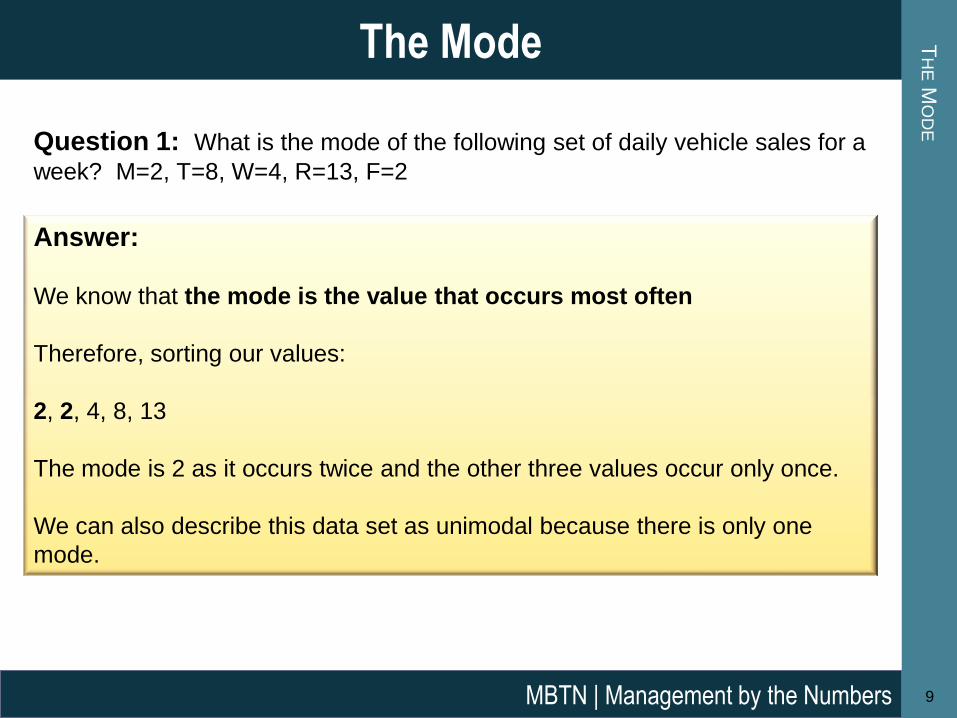
Question 1: What is the mode of the following set of daily vehicle sales for a
week? M=2, T=8, W=4, R=13, F=2
Answer:
We know that the mode is the value that occurs most often
Therefore, sorting our values:
2, 2, 4, 8, 13
The mode is 2 as it occurs twice and the other three values occur only once.
We can also describe this data set as unimodal because there is only one
mode.
TH
E M
OD
E
10
The Mode
MBTN | Management by the Numbers
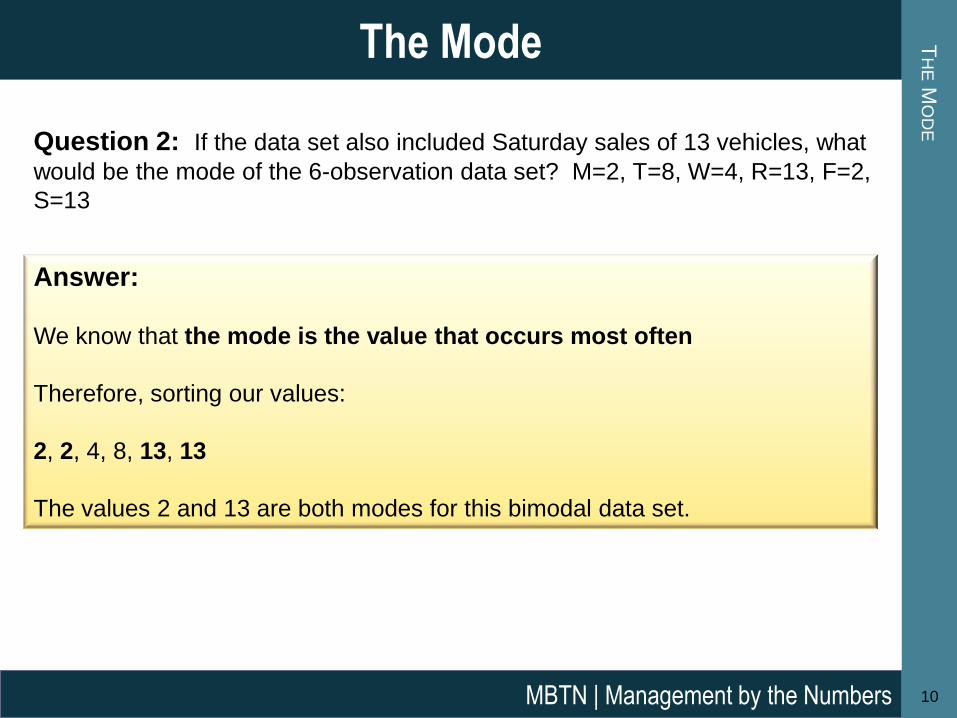
Question 2: If the data set also included Saturday sales of 13 vehicles, what
would be the mode of the 6-observation data set? M=2, T=8, W=4, R=13, F=2,
S=13
Answer:
We know that the mode is the value that occurs most often
Therefore, sorting our values:
2, 2, 4, 8, 13, 13
The values 2 and 13 are both modes for this bimodal data set.

ME
AS
UR
ES O
F C
EN
TR
AL T
EN
DE
NC
Y
11
Measures of Central Tendency
MBTN | Management by the Numbers
• Sample Mean
• The Arithmetic Average
• Median
• The Middle Value
• Mode
• The Value Occurring Most Often
The ensemble of sample mean, median, and mode can tell
you a lot about how the data values are distributed….as
we shall now see.

SY
MM
ET
RY A
ND
SK
EW
NE
SS
12
Symmetry and Skewness
MBTN | Management by the Numbers
Definitions
If the data are unimodal and the mean, median, and mode are all equal,
the data is said to be symmetric.
If the data are unimodal and the mean, median, and mode are all
different, the data is said to be asymmetric.
Data is said to be skewed to the right where the data is characterized
by a few large values and many small values. In this circumstance, the
sample mean is normally greater than the median.
Data is said to be skewed to the left where the data is characterized by
a few small values and many large values. In this circumstance, the
sample mean is normally less than the median.
SY
MM
ET
RY A
ND
SK
EW
NE
SS
13
Symmetry and Skewness
MBTN | Management by the Numbers
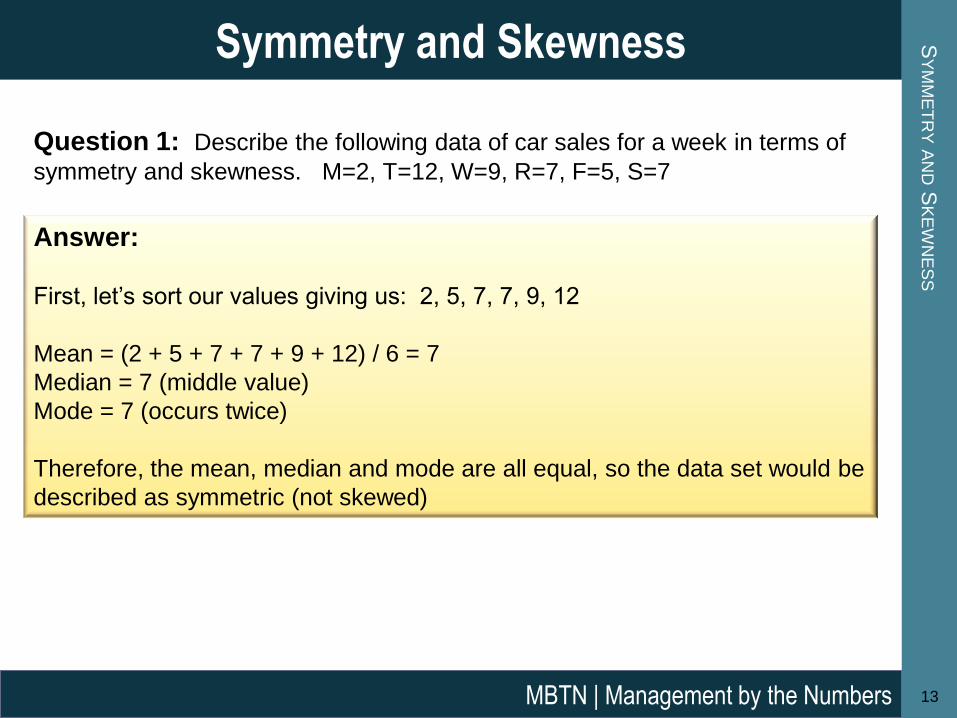
Question 1: Describe the following data of car sales for a week in terms of
symmetry and skewness. M=2, T=12, W=9, R=7, F=5, S=7
Answer:
First, let’s sort our values giving us: 2, 5, 7, 7, 9, 12
Mean = (2 + 5 + 7 + 7 + 9 + 12) / 6 = 7
Median = 7 (middle value)
Mode = 7 (occurs twice)
Therefore, the mean, median and mode are all equal, so the data set would be
described as symmetric (not skewed)

SY
MM
ET
RY A
ND
SK
EW
NE
SS
14
Symmetry and Skewness
MBTN | Management by the Numbers
Question 2: Describe the following data of car sales for a week in terms of
symmetry and skewness. M=2, T=21, W=9, R=2, F=3, S=5
Answer:
First, let’s sort our values giving us: 2, 2, 3, 5, 9, 21
Mean = (2 + 2 + 3 + 5 + 9 + 21) / 6 = 7
Median = (3 + 5) / 2 = 4 (average of two middle values)
Mode = 2 (occurs twice)
The mean, median and mode are not equal the data would be considered
asymmetric. Because the mean, median and mode are not equal with the
mode being less than the median which, in turn, is less than the sample mean-
--we say the data are skewed to the right.
Insight
Business data sets are often skewed to the right (think of salaries,
sales by customer, etc.)

ME
AS
UR
ES O
F V
AR
IAB
ILIT
Y
15
Measures of Variability
MBTN | Management by the Numbers
• Measures of Variability
• Range (Maximum – Minimum)
• Standard Deviation
• Variance
Many business decisions are based not only on
averages, but also on variability around the average.
Variability in temperature, for example, leads to higher
heating/cooling cost. We turn now to three statistics that
describe the spread of the data, e.g. measures of
variability.
TH
E R
AN
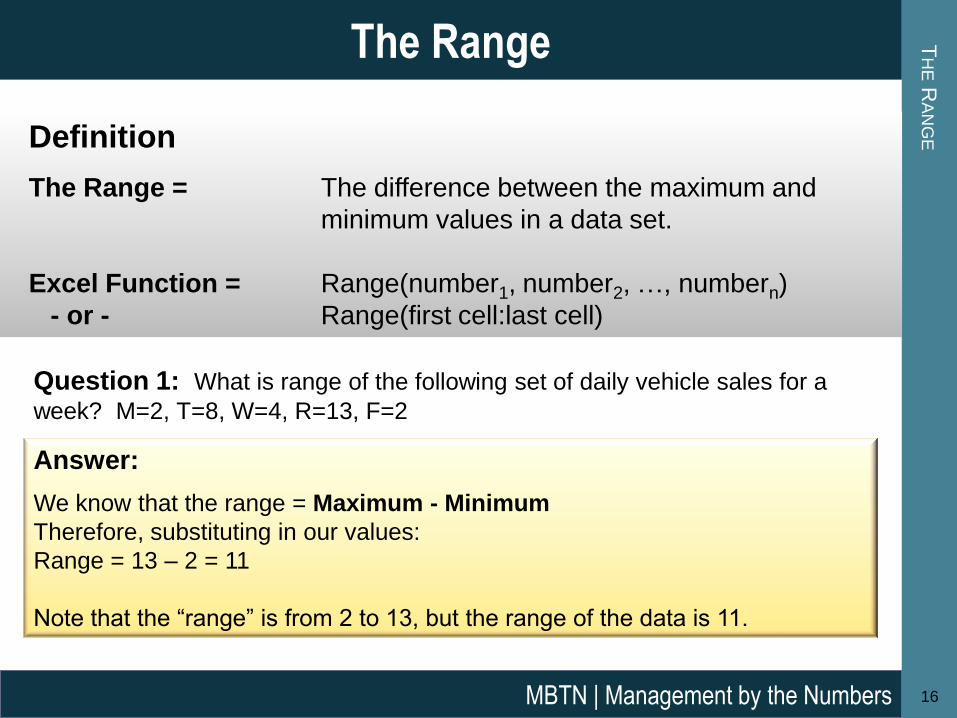
GE Definition
The Range = The difference between the maximum and
minimum values in a data set.
Excel Function = Range(number1, number2, …, numbern)
- or - Range(first cell:last cell)
16
The Range
MBTN | Management by the Numbers
Question 1: What is range of the following set of daily vehicle sales for a
week? M=2, T=8, W=4, R=13, F=2
Answer:
We know that the range = Maximum - Minimum
Therefore, substituting in our values:
Range = 13 – 2 = 11
Note that the “range” is from 2 to 13, but the range of the data is 11.

SA
MP
LE S
TA
ND
AR
D D
EV
IAT
ION
17
Sample Standard Deviation
MBTN | Management by the Numbers
Insight
Think of the sample standard deviation as a measure of how variable
the data are. If all the data take on the same value, the standard
deviation will be zero.
Definition
The Sample Standard Deviation is the square root of the “average”
squared distances of the points from the sample average.
(num1 – x )^2 + (num2 – x )^2 + … + (numn – x )^2 ^ (1/2)
StdDev =
n-1
Where x = sample average and n = number of data points in the data set
Excel 2010 Function = stdev.s(num1, num2, …, numn)
Excel 2007 Function = stdev(num1, num2, …, numn)
SA
MP
LE S
TA
ND
AR
D D
EV
IAT
ION
18
Sample Standard Deviation
MBTN | Management by the Numbers
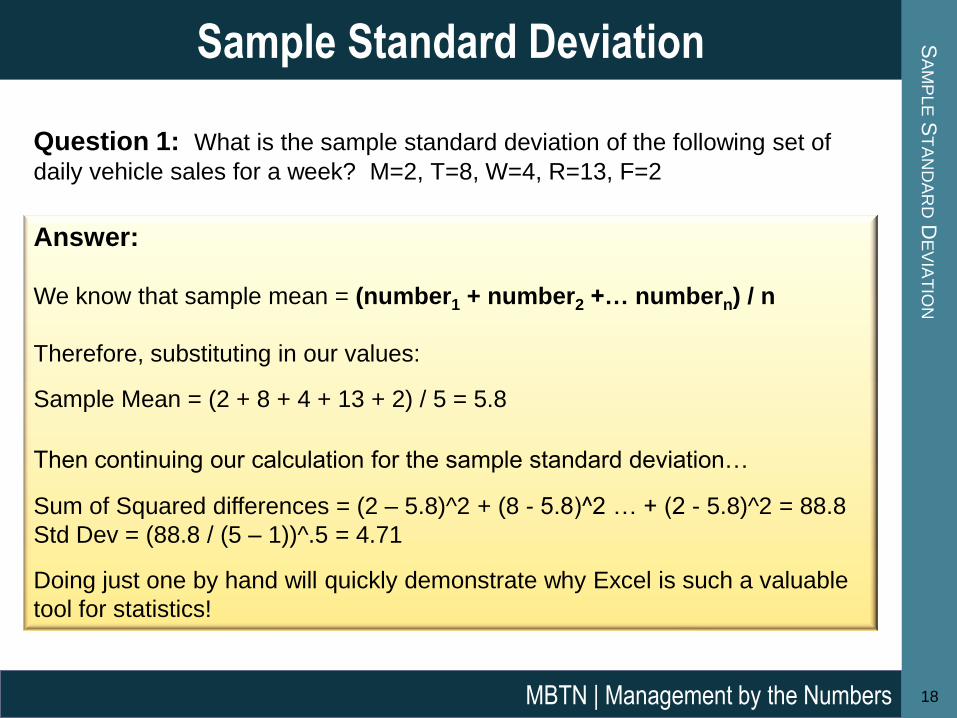
Question 1: What is the sample standard deviation of the following set of
daily vehicle sales for a week? M=2, T=8, W=4, R=13, F=2
Answer:
We know that sample mean = (number1 + number2 +… numbern) / n
Therefore, substituting in our values:
Sample Mean = (2 + 8 + 4 + 13 + 2) / 5 = 5.8
Then continuing our calculation for the sample standard deviation…
Sum of Squared differences = (2 – 5.8)^2 + (8 - 5.8)^2 … + (2 - 5.8)^2 = 88.8
Std Dev = (88.8 / (5 – 1))^.5 = 4.71
Doing just one by hand will quickly demonstrate why Excel is such a valuable
tool for statistics!

SA
MP
LE S
TA
ND
AR
D D
EV
IAT
ION
19
Sample Standard Deviation
MBTN | Management by the Numbers
Insight
The sample standard deviation is a better measure of variability than
the range because it uses all the data points (and for other technical
reasons we will not get into.)
To find a sample standard deviation, you will almost always use
Excel….even if there are few data points.
If there are lots of data points with a unimodal, symmetric (bell-shaped)
distribution, a rough rule of thumb says that 68% of the values will fall
within one standard deviation of the sample average.
Using our previous example where the sample average = 5.8 and the standard
deviation = 4.71 (and presuming a bell-shaped distribution – not the case), our
rule of thumb would then say that we would expect 68% of the values to fall
between 5.8 – 4.71 and 5.8 + 4.71 (or between approx. 1.1 and 10.5)
SA
MP
LE V
AR
IAN
CE
20
Sample Variance
MBTN | Management by the Numbers
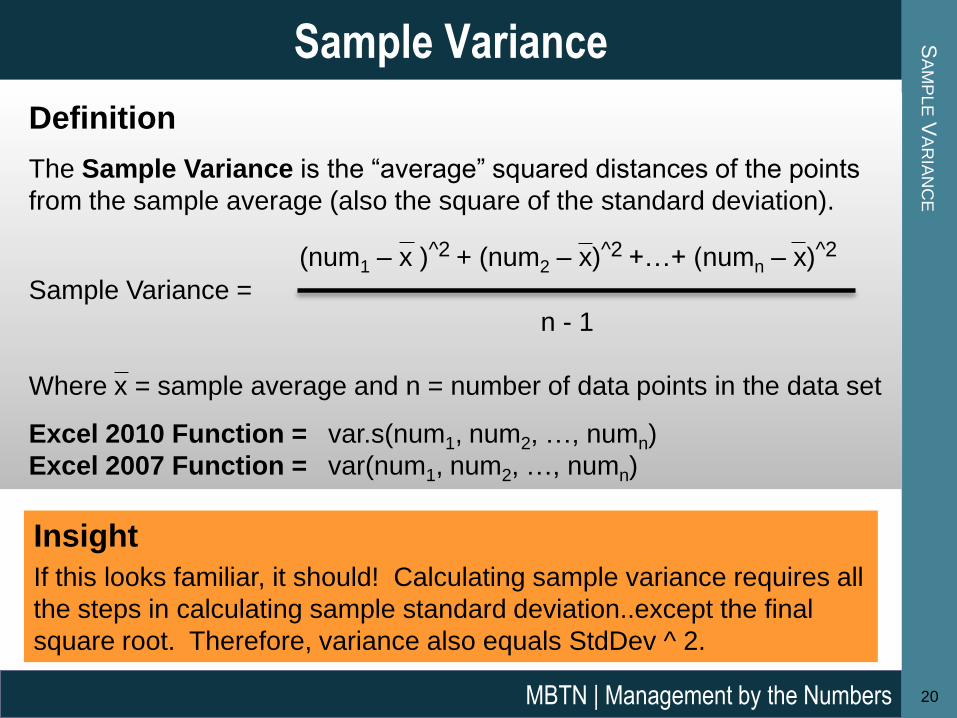
Insight
If this looks familiar, it should! Calculating sample variance requires all
the steps in calculating sample standard deviation..except the final
square root. Therefore, variance also equals StdDev ^ 2.
Definition
The Sample Variance is the “average” squared distances of the points
from the sample average (also the square of the standard deviation).
(num1 – x )^2 + (num2 – x)^2 +…+ (numn – x)^2 Sample Variance =
n - 1
Where x = sample average and n = number of data points in the data set
Excel 2010 Function = var.s(num1, num2, …, numn)
Excel 2007 Function = var(num1, num2, …, numn)
SA
MP
LE V
AR
IAN
CE
21
Sample Variance
MBTN | Management by the Numbers
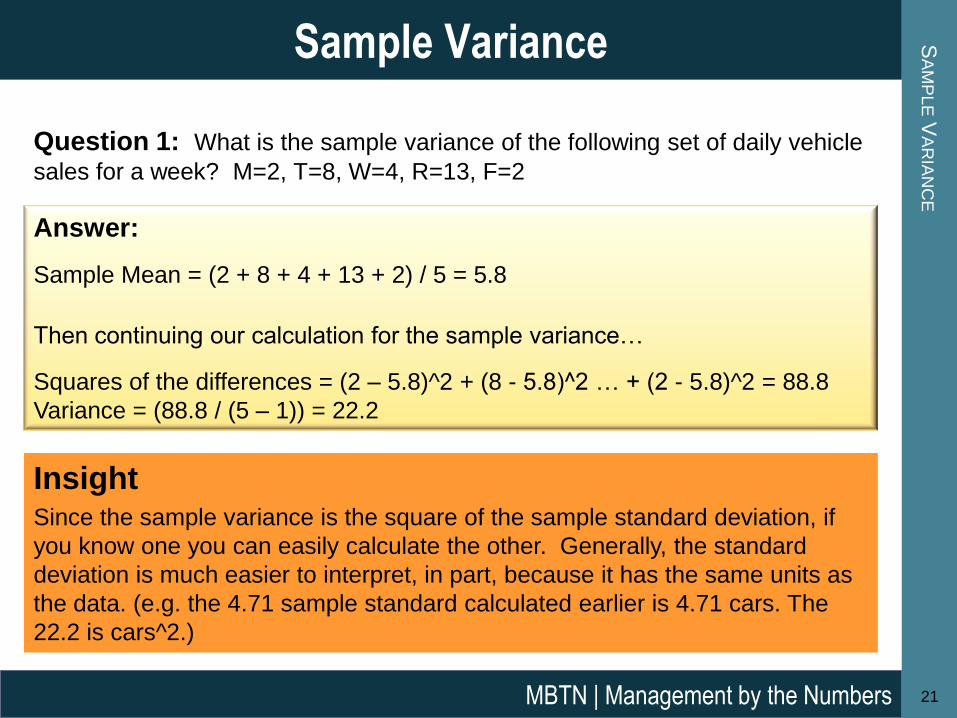
Question 1: What is the sample variance of the following set of daily vehicle
sales for a week? M=2, T=8, W=4, R=13, F=2
Answer:
Sample Mean = (2 + 8 + 4 + 13 + 2) / 5 = 5.8
Then continuing our calculation for the sample variance…
Squares of the differences = (2 – 5.8)^2 + (8 - 5.8)^2 … + (2 - 5.8)^2 = 88.8
Variance = (88.8 / (5 – 1)) = 22.2
Insight Since the sample variance is the square of the sample standard deviation, if
you know one you can easily calculate the other. Generally, the standard
deviation is much easier to interpret, in part, because it has the same units as
the data. (e.g. the 4.71 sample standard calculated earlier is 4.71 cars. The
22.2 is cars^2.)

DE
SC
RIP
TIV
E S
TA
TIS
TIC
S
22
Descriptive Statistics
MBTN | Management by the Numbers
• Measures of Central Tendency
• Mean
• Median
• Mode
• Measures of Variability
• Range (Maximum – Minimum)
• Standard Deviation
• Variance
This completes our introduction to the six descriptive statistics listed
above. What follows are a couple of slides that show how these
statistics behave if you multiply the data by a constant “b” and add
another constant “a”. This is called a linear transformation. The
transformations used to convert pounds to kilograms, feet to miles, and
millions to billions are all examples of linear transformations.
DE
SC
RIP
TIV
E S
TA
TIS
TIC
S F
OR
TR
AN
SF
OR
ME
D D
AT
A
23
Descriptive Statistics for Transformed Data
MBTN | Management by the Numbers
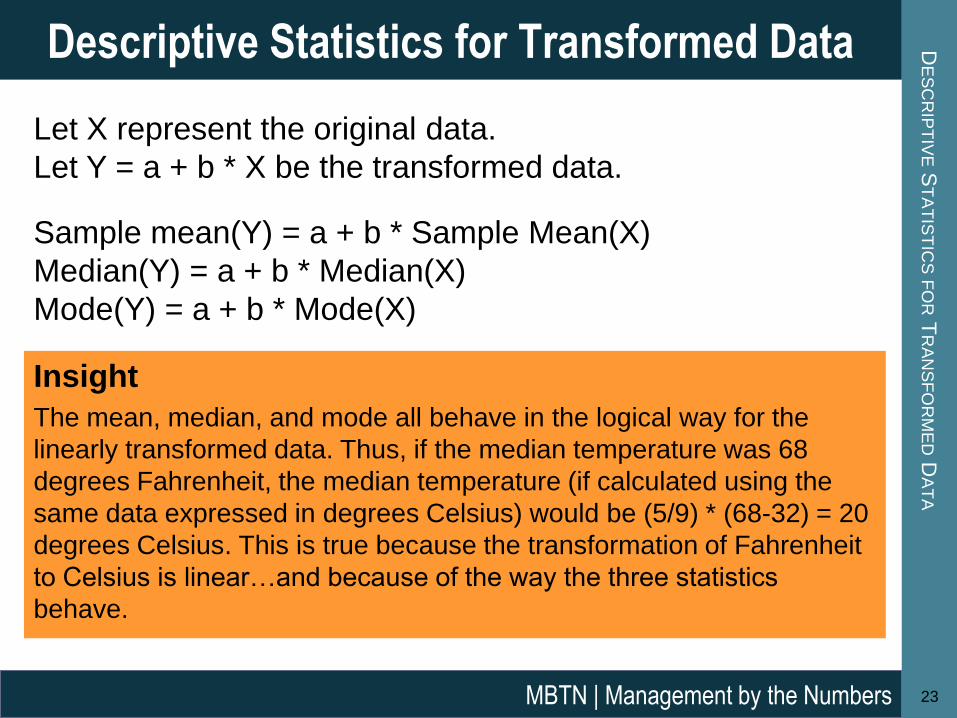
Let X represent the original data.
Let Y = a + b * X be the transformed data.
Sample mean(Y) = a + b * Sample Mean(X)
Median(Y) = a + b * Median(X)
Mode(Y) = a + b * Mode(X)
Insight
The mean, median, and mode all behave in the logical way for the
linearly transformed data. Thus, if the median temperature was 68
degrees Fahrenheit, the median temperature (if calculated using the
same data expressed in degrees Celsius) would be (5/9) * (68-32) = 20
degrees Celsius. This is true because the transformation of Fahrenheit
to Celsius is linear…and because of the way the three statistics
behave.
DE
SC
RIP
TIV
E S
TA
TIS
TIC
S F
OR
TR
AN
SF
OR
ME
D D
AT
A
24
Descriptive Statistics for Transformed Data
MBTN | Management by the Numbers
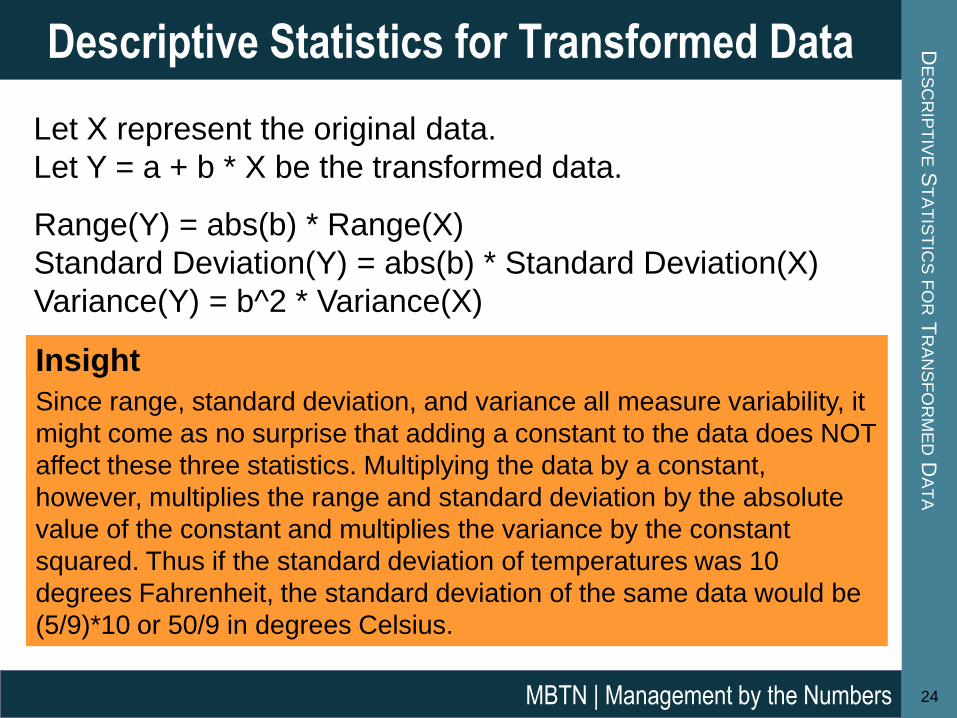
Let X represent the original data.
Let Y = a + b * X be the transformed data.
Range(Y) = abs(b) * Range(X)
Standard Deviation(Y) = abs(b) * Standard Deviation(X)
Variance(Y) = b^2 * Variance(X)
Insight
Since range, standard deviation, and variance all measure variability, it
might come as no surprise that adding a constant to the data does NOT
affect these three statistics. Multiplying the data by a constant,
however, multiplies the range and standard deviation by the absolute
value of the constant and multiplies the variance by the constant
squared. Thus if the standard deviation of temperatures was 10
degrees Fahrenheit, the standard deviation of the same data would be
(5/9)*10 or 50/9 in degrees Celsius.

Any Introductory Statistics Book such as Introductory
Statistics (9th Edition), Neil. A. Weiss, Pearson
Publishing, 2010.
Two-Variable Descriptive Statistics (advanced MBTN
module – coming soon). This module provides further
insight into statistics including correlation and regression.
DE
SC
RIP
TIV
E S
TA
TIS
TIC
S –
FU
RT
HE
R R
EF
ER
EN
CE
25
Descriptive Statistics - Further Reference
MBTN | Management by the Numbers