descriptive report · 2007-04-23 · noaa form 76-35a u.s. department of commerce national oceanic...
TRANSCRIPT

NOAA FORM 76-35A
U.S. DEPARTMENT OF COMMERCENATIONAL OCEANIC AND ATMOSPHERIC ADMINISTRATION
NATIONAL OCEAN SERVICE
DESCRIPTIVE REPORT
Type of Survey HYDROGRAPHIC
Field No.
Registry No. W00071 - W00078
LOCALITY
State Hawaii
General Locality Oahu
Sublocality Northeast Coast of Oahu
2000
CHIEF OF PARTYMaxim F. Van Norden
LIBRARY & ARCHIVES
DATE

U.S. DEPARTMENT OF COMMERCE REGISTER NO.(11-72) NATIONAL OCEANIC AND ATMOSPHERIC ADMINISTRATION
HYDROGRAPHIC TITLE SHEET W00071-W00078
NSTRUCTIONS The hydrographic sheet should be accompanied by this form, FIELD NO.filled in as completely as possible, when the sheet is forwarded to the office.
State Hawaii
General Locali Northeast Coast of Oahu
Sublocality Kahuka Bay to Kaneohe Bay
Scale 1:10,000 Date of Survey August 1 - December 20, 2000
Instructions Dated Project No.
Vessel LIDAR (SHOALS)
Chief of Party Maxim F. Van Norden
Surveyed by U.S. Naval Hydrographic Office
Soundings taken by echo sounder, hand lead, pole SHOALS 400 Lidar
Graphic record scaled by Fleet Survey Team
Graphic record checked by Fleet Survey Team
Evaluation by Bonnie Johnston Automated plo HP Designjet1050c
Verification byPhysical Scientist: B. Johnston, Cartographer: Russ Davies
Soundings in meters at MLLW
REMARKS: Revisions and annotations appearing as endnotes were
generated by the cartographer during office processing.
All depths listed in this report are referenced to
mean lower low water unless otherwise noted.
UTM Zone 04
NOAA FORM 77-28 SUPERSEDES FORM C&GS-537 U.S. GOVERNMENT PRINTING OFFICE: 1986 - 652-007/41215


Pacific Hydrographic Branch Document #:
PHB-QA-03 Rev.:
1
Title:
HYDROGRAPHIC SURVEY OUTSIDE SOURCE DATA QUALITY ASSURANCE CHECKLIST
Page #:
1 of 26
Document Owner: Hydrographic Team Leader Revision date: 1/17/2006
Registry No:
State:
General Locality:
Sub Locality:
Dates of Survey:
OSD Supplier:
OSD Project No:
Reviewer: Review Date:
I. DATA INVENTORY
A. Reports
Report Type Format Document Title Date Descriptive Report or equivalent
Data Acquisition and Processing Report or equivalent
Horizontal and Vertical Control Report or equivalent
System Certification Report or Equivalent
Other
B. Data Data Type Format Description (Raw, Processed) Smooth Sheet Sounding Plots
XYZ ASCII Files
Multibeam
Side Scan Sonar
LIDAR
Single Beam

Pacific Hydrographic Branch Document #:
PHB-QA-03 Rev.:
1
Title:
HYDROGRAPHIC SURVEY OUTSIDE SOURCE DATA QUALITY ASSURANCE CHECKLIST
Page #:
2 of 26
Document Owner: Hydrographic Team Leader Revision date: 1/18/2006
Data Type Format Description (Raw, Processed) Detached Position Point Feature
Kinematic / Static GPS
Sound Velocity
Water Levels
AWOIS
DtoN
Shoreline
Bottom Sample
_________ All data open correctly and without error (MBES lines, SSS lines, VBES, Crosslines,
Fieldsheets, Smooth Sheets, Sessions, DTM’s, BASE grids, Mosaics, and DP’s).
C. Sensors List all sensor(s) that were used to acquire data.
Sensor Manufacturer System Model Vessel / Platform
_________ Are all sensors listed above capable of meeting NOAA HSSDM accuracy and object
detection requirements? Provide information in the comments section.

Pacific Hydrographic Branch Document #:
PHB-QA-03 Rev.:
1
Title:
HYDROGRAPHIC SURVEY OUTSIDE SOURCE DATA QUALITY ASSURANCE CHECKLIST
Page #:
3 of 26
Document Owner: Hydrographic Team Leader Revision date: 2/16/2006
II. DATA ACQUISITION AND PROCESSING A. System Calibrations and/or Certifications _________ A sensor offset and alignment survey was conducted to NOAA HSSDM requirements ____ Offset values provided _________ Patch tests were conducted for shallow-water multibeam systems ____ Alignment bias and latency values provided _________ Draft measurements were conducted ____ Static Draft ____ Dynamic Draft ____ Loading
____ Draft values were provided
_________ Sensors were calibrated in accordance with manufacturer requirements and NOAA specifications ____ Calibration reports were provided.
B. Sound Velocity Corrections _________ Sound velocity sampling regimen is in accordance with NOAA HSSDM requirements _________ Sound velocity profiles were supplied
____ All profiles appear valid
C. Water Levels _________ Water level measuring equipment and methods are consistent with NOAA equipment
and methods and are capable of meeting specifications Equipment / method used: ________________________________________ _________ Tide corrector files were supplied
____ All tide correctors appear valid
_________ Water level correctors applied to sounding data ___ Verified ___ Observed ___ Predicted ___NOAA Zoning ___Other zoning _________ Water level error estimate provided by CO-OPS Water level / zoning error estimate: __________________

Pacific Hydrographic Branch Document #:
PHB-QA-03 Rev.:
1
Title:
HYDROGRAPHIC SURVEY OUTSIDE SOURCE DATA QUALITY ASSURANCE CHECKLIST
Page #:
4 of 26
Document Owner: Hydrographic Team Leader Revision date: 2/16/2006
E. Survey Methodology _________ The surveyor has conducted adequate quality control of horizontal positioning data
_________ DTM, BASE surface, and/or mosaics indicate that seafloor coverage requirements
(per NOAA HSSDM) were met and no significant coverage holidays exist. _________ All least depths over shoals, wrecks, rocks, obstructions, and other features have been
determined _________ The Hydrographer has conducted the required quantity of cross lines, or acquired
sufficient redundant data, in accordance with the HSSDM, to assess internal data consistency.
F. Data Processing and Quality Control _________ An adequate description of data processing and quality control methods is provided in
documentation. Processing software used: _____________________________________________ ____ Data processing methodology is robust enough and adequate to provide a
dataset suitable for charting.
_________ Data have been reviewed and are cleaned appropriately with no noise, fliers, or systematic errors noted.
_________ Crossline agreement or redundant data overlap has been visually inspected by the
hydrographer
____ Disagreements have been noted
_________ A Chart comparison was conducted by the hydrographer
____ Disagreements have been noted.
Pacific Hydrographic Branch Document #:
PHB-QA-03 Rev.:
1
Title:
HYDROGRAPHIC SURVEY OUTSIDE SOURCE DATA QUALITY ASSURANCE CHECKLIST
Page #:
5 of 26
Document Owner: Hydrographic Team Leader Revision date: 2/16/2006
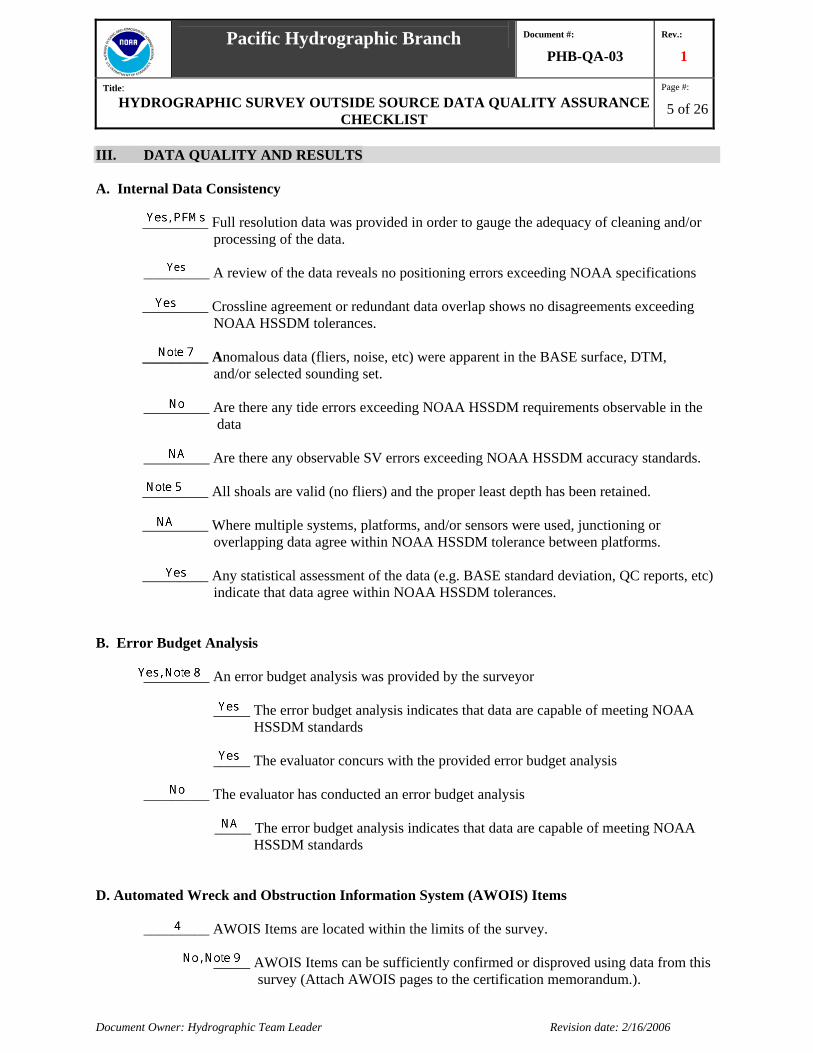
III. DATA QUALITY AND RESULTS A. Internal Data Consistency
_________ Full resolution data was provided in order to gauge the adequacy of cleaning and/or processing of the data. _________ A review of the data reveals no positioning errors exceeding NOAA specifications
_________ Crossline agreement or redundant data overlap shows no disagreements exceeding
NOAA HSSDM tolerances. _________ Anomalous data (fliers, noise, etc) were apparent in the BASE surface, DTM,
and/or selected sounding set. _________ Are there any tide errors exceeding NOAA HSSDM requirements observable in the
data
_________ Are there any observable SV errors exceeding NOAA HSSDM accuracy standards.
_________ All shoals are valid (no fliers) and the proper least depth has been retained. _________ Where multiple systems, platforms, and/or sensors were used, junctioning or
overlapping data agree within NOAA HSSDM tolerance between platforms. _________ Any statistical assessment of the data (e.g. BASE standard deviation, QC reports, etc)
indicate that data agree within NOAA HSSDM tolerances.
B. Error Budget Analysis _________ An error budget analysis was provided by the surveyor
_____ The error budget analysis indicates that data are capable of meeting NOAA HSSDM standards
_____ The evaluator concurs with the provided error budget analysis _________ The evaluator has conducted an error budget analysis _____ The error budget analysis indicates that data are capable of meeting NOAA
HSSDM standards D. Automated Wreck and Obstruction Information System (AWOIS) Items _________ AWOIS Items are located within the limits of the survey.
_____ AWOIS Items can be sufficiently confirmed or disproved using data from this survey (Attach AWOIS pages to the certification memorandum.).
Pacific Hydrographic Branch Document #:
PHB-QA-03 Rev.:
1
Title:
HYDROGRAPHIC SURVEY OUTSIDE SOURCE DATA QUALITY ASSURANCE CHECKLIST
Page #:
6 of 26
Document Owner: Hydrographic Team Leader Revision date: 2/16/2006
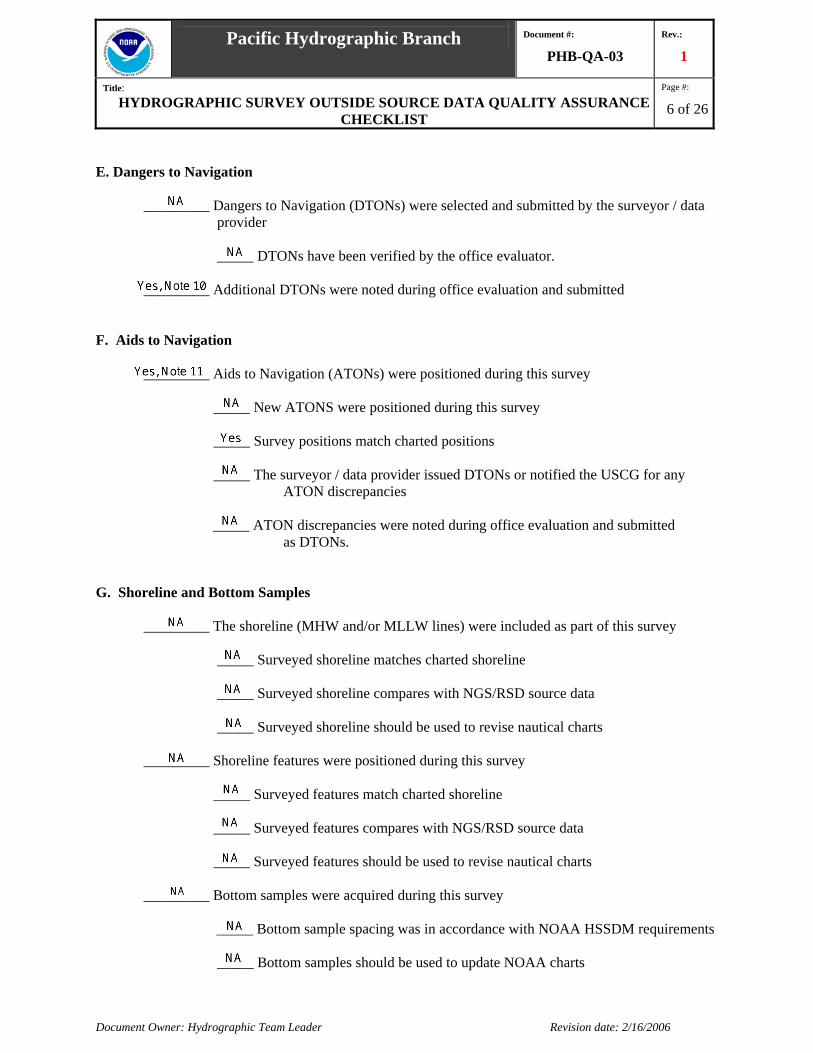
E. Dangers to Navigation
_________ Dangers to Navigation (DTONs) were selected and submitted by the surveyor / data provider
_____ DTONs have been verified by the office evaluator. _________ Additional DTONs were noted during office evaluation and submitted
F. Aids to Navigation _________ Aids to Navigation (ATONs) were positioned during this survey _____ New ATONS were positioned during this survey _____ Survey positions match charted positions _____ The surveyor / data provider issued DTONs or notified the USCG for any
ATON discrepancies _____ ATON discrepancies were noted during office evaluation and submitted
as DTONs. G. Shoreline and Bottom Samples _________ The shoreline (MHW and/or MLLW lines) were included as part of this survey _____ Surveyed shoreline matches charted shoreline _____ Surveyed shoreline compares with NGS/RSD source data _____ Surveyed shoreline should be used to revise nautical charts _________ Shoreline features were positioned during this survey _____ Surveyed features match charted shoreline _____ Surveyed features compares with NGS/RSD source data _____ Surveyed features should be used to revise nautical charts _________ Bottom samples were acquired during this survey _____ Bottom sample spacing was in accordance with NOAA HSSDM requirements _____ Bottom samples should be used to update NOAA charts
Pacific Hydrographic Branch Document #:
PHB-QA-03 Rev.:
1
Title:
HYDROGRAPHIC SURVEY OUTSIDE SOURCE DATA QUALITY ASSURANCE CHECKLIST
Page #:
7 of 26
Document Owner: Hydrographic Team Leader Revision date: 2/16/2006
IV. COMMENTS
Pacific Hydrographic Branch Document #:
PHB-QA-03 Rev.:
1
Title:
HYDROGRAPHIC SURVEY OUTSIDE SOURCE DATA QUALITY ASSURANCE CHECKLIST
Page #:
8 of 26
Document Owner: Hydrographic Team Leader Revision Date: 2/16/2006

Pacific Hydrographic Branch Document #:
PHB-QA-03 Rev.:
1
Title:
HYDROGRAPHIC SURVEY OUTSIDE SOURCE DATA QUALITY ASSURANCE CHECKLIST
Page #:
9 of 27
Figure 1. An overview of the area covered by NAVOCEANO Lidar surveys W00071 through W00078. The surveys cover the Northeast coast of Oahu, HI, spanning from Kahuku Point to Mokapu Peninsula. Digital terrain models (DTMs) from each survey area are overlain on NOAA chart 19357.

Pacific Hydrographic Branch Document #:
PHB-QA-03 Rev.:
1
Title:
HYDROGRAPHIC SURVEY OUTSIDE SOURCE DATA QUALITY ASSURANCE CHECKLIST
Page #:
10 of 27
Figure 2. (a) A DTM from survey W00074 displaying gaps in data coverage. (b) A DTM from survey W00075 displaying gaps in data coverage. The large data gaps observed in surveys W00074 and 75 primarily correspond with the deepest portions of the survey area. This is most likely a product of the lower resolution spot density (8 x 8 m) that was used to acquire Lidar data for the US Army Corps of Engineer specific surveys. Both images feature chart 19357 in the background. DTMs were colored by depth. 1
Figure 3. A DTM of survey W00077 colored by depth displaying the sparse coverage obtained over the majority of the main channel traversing Kane’ohe Bay. NAVOCEANO claimed coverage was limited in this area due to water clarity issues. NOAA chart 19359 is featured in the back ground.
a b

Pacific Hydrographic Branch Document #:
PHB-QA-03 Rev.:
1
Title:
HYDROGRAPHIC SURVEY OUTSIDE SOURCE DATA QUALITY ASSURANCE CHECKLIST
Page #:
11 of 27
Figure 4. Image depicting Lidar coverage for Oahu. Areas surveyed by the US Navy and USGS were surveyed with 4x4 meter spot density and 200 % coverage. Areas surveyed by the USACE were surveyed with 8x8 meter spot density and 100 % coverage. The image was submitted in Appendix A of the Hawaii Lidar ROS. 2
Figure 5. (a) Image of Lidar point data collected for survey W00073 flown at 4x4 meter spot density with a minimum of 200% data redundancy. (b) Image of Lidar point data collected for survey W00074 flown at 8x8 meter spot density with a minimum of 100% data redundancy. The data density observed in Image A is representative of the surveys flown for the US Navy, which is significantly higher than the data density of surveys W00074 and W00075 flown for the USACE. Data points were colored by line.
a
b

Pacific Hydrographic Branch Document #:
PHB-QA-03 Rev.:
1
Title:
HYDROGRAPHIC SURVEY OUTSIDE SOURCE DATA QUALITY ASSURANCE CHECKLIST
Page #:
12 of 27
V. CHART COMPARISON Chart comparisons were conducted for surveys W00071 through W00078. All surveys were compared to Chart 19357; surveys W00076, W00077 and W00078 were also compared to Chart 19359.3 In general, smooth sheet depths agree with the charted soundings within 1 to 2 fathoms, with the smooth sheet depths being shoaler than the charted soundings when slight discrepancies occurred. Numerous new shoals were detected with the LIDAR data. Shoaler surveyed depths should supersede deeper charted soundings, with exceptions noted below. All charted wrecks, rocks, obstructions and shoals should be retained due to the absence of item investigations in the survey area and the unproven object detection capability of LIDAR systems for use in chart disprovals. 4 A number of channels were visible in the sounding data for surveys W00073 through W00076. The channels are carved through a labyrinth of rocks and reefs; some are charted and some are not. NAVOCEANO noted the channels in their review of chart 19357 (Appendix C, Hawaii Lidar ROS) 5 and concluded that navigation would be hazardous to any vessel including shallow draft boats. The reviewer agrees with this assessment due to the numerous shoals, rocks and reefs in this area and the narrowness of the channels. The uncharted channels should remain uncharted and navigation left to local knowledge. 6 The following sections highlight NAVOCEANO reported obstructions, new features and updates to charted features specific to individual surveys. Only the surveys with significant discrepancies or updates were included.
Pacific Hydrographic Branch Document #:
PHB-QA-03 Rev.:
1
Title:
HYDROGRAPHIC SURVEY OUTSIDE SOURCE DATA QUALITY ASSURANCE CHECKLIST
Page #:
13 of 27
SURVEY W00073
Affected Charts Chart Scale Edition Date Units 19357 1:80,000 23rd Jul 1, 2006 Fathoms Reported Obstructions No obstructions were reported by NAVOCEANO for this survey. Charted Features
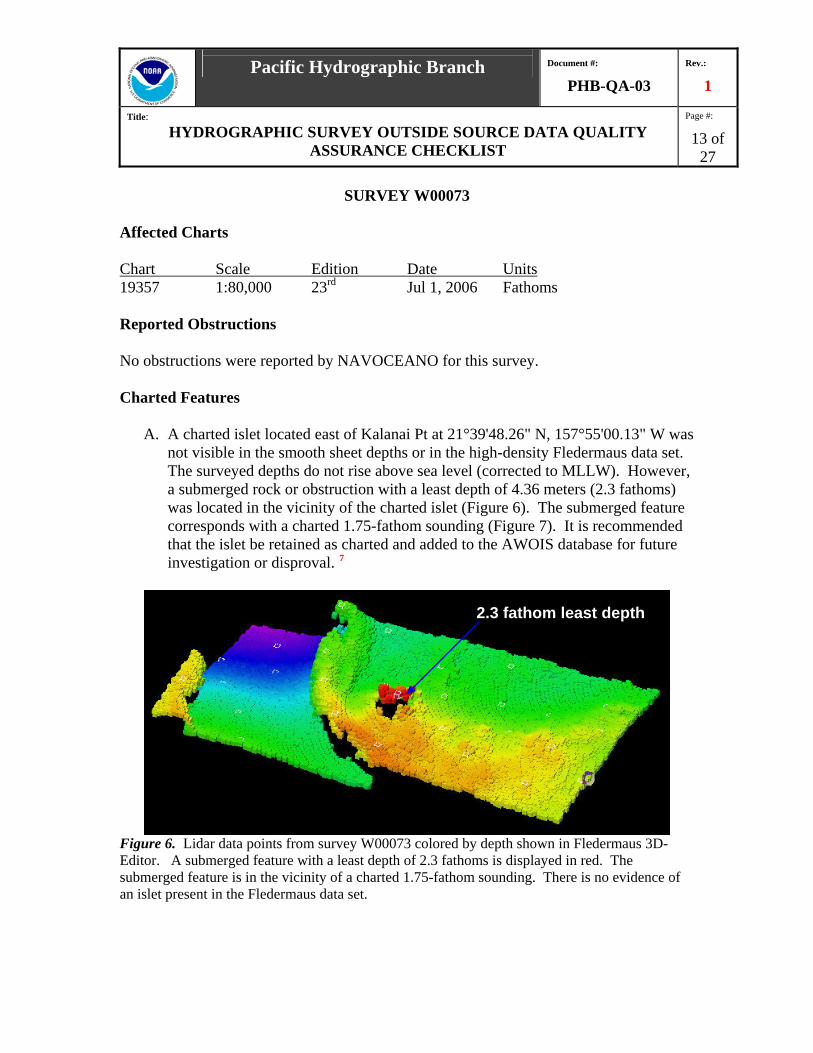
A. A charted islet located east of Kalanai Pt at 21°39'48.26" N, 157°55'00.13" W was not visible in the smooth sheet depths or in the high-density Fledermaus data set. The surveyed depths do not rise above sea level (corrected to MLLW). However, a submerged rock or obstruction with a least depth of 4.36 meters (2.3 fathoms) was located in the vicinity of the charted islet (Figure 6). The submerged feature corresponds with a charted 1.75-fathom sounding (Figure 7). It is recommended that the islet be retained as charted and added to the AWOIS database for future investigation or disproval. 7
Figure 6. Lidar data points from survey W00073 colored by depth shown in Fledermaus 3D-Editor. A submerged feature with a least depth of 2.3 fathoms is displayed in red. The submerged feature is in the vicinity of a charted 1.75-fathom sounding. There is no evidence of an islet present in the Fledermaus data set.
2.3 fathom least depth

Pacific Hydrographic Branch Document #:
PHB-QA-03 Rev.:
1
Title:
HYDROGRAPHIC SURVEY OUTSIDE SOURCE DATA QUALITY ASSURANCE CHECKLIST
Page #:
14 of 27
Figure7. Image depicting the survey outline and location of noted features for survey W00073; Chart 19357 is displayed in the background.
SURVEY W00074
Affected Charts Chart Scale Edition Date Units 19357 1:80,000 23rd Jul 1, 2006 Fathoms Reported Obstructions No obstructions were reported by NAVOCEANO for this survey. 8
Pacific Hydrographic Branch Document #:
PHB-QA-03 Rev.:
1
Title:
HYDROGRAPHIC SURVEY OUTSIDE SOURCE DATA QUALITY ASSURANCE CHECKLIST
Page #:
15 of 27
Charted Features
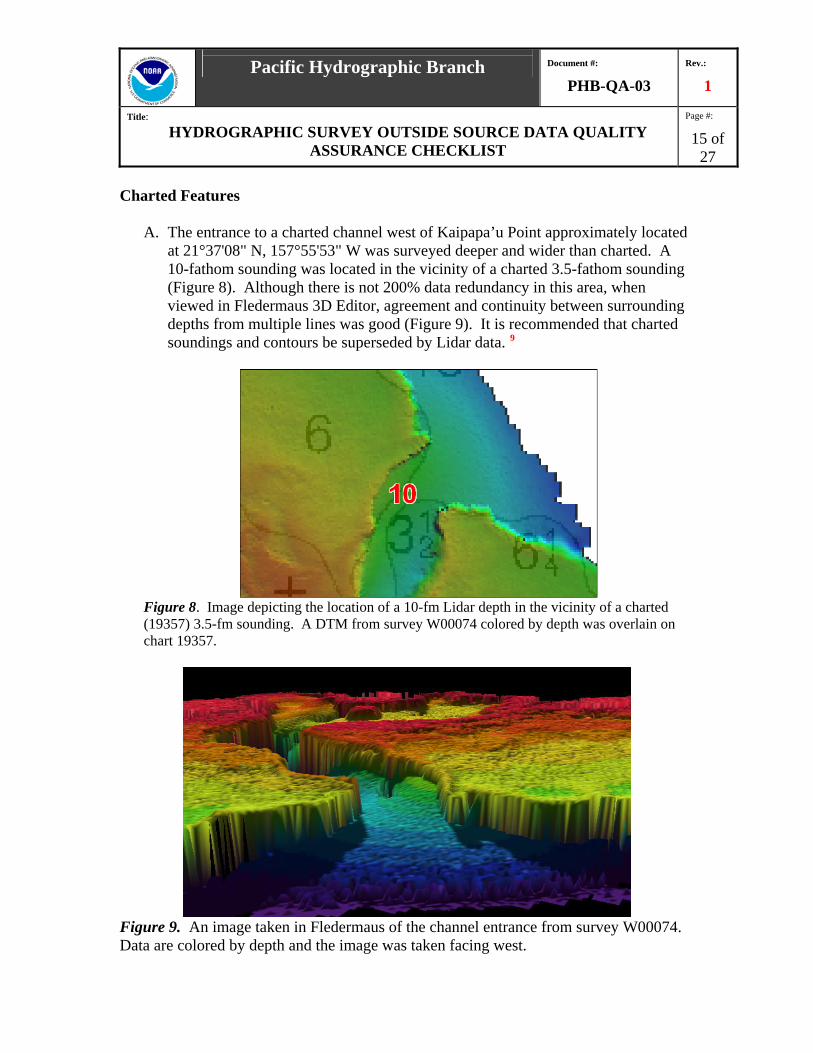
A. The entrance to a charted channel west of Kaipapa’u Point approximately located at 21°37'08" N, 157°55'53" W was surveyed deeper and wider than charted. A 10-fathom sounding was located in the vicinity of a charted 3.5-fathom sounding (Figure 8). Although there is not 200% data redundancy in this area, when viewed in Fledermaus 3D Editor, agreement and continuity between surrounding depths from multiple lines was good (Figure 9). It is recommended that charted soundings and contours be superseded by Lidar data. 9
Figure 8. Image depicting the location of a 10-fm Lidar depth in the vicinity of a charted (19357) 3.5-fm sounding. A DTM from survey W00074 colored by depth was overlain on chart 19357.
Figure 9. An image taken in Fledermaus of the channel entrance from survey W00074. Data are colored by depth and the image was taken facing west.
Pacific Hydrographic Branch Document #:
PHB-QA-03 Rev.:
1
Title:
HYDROGRAPHIC SURVEY OUTSIDE SOURCE DATA QUALITY ASSURANCE CHECKLIST
Page #:
16 of 27
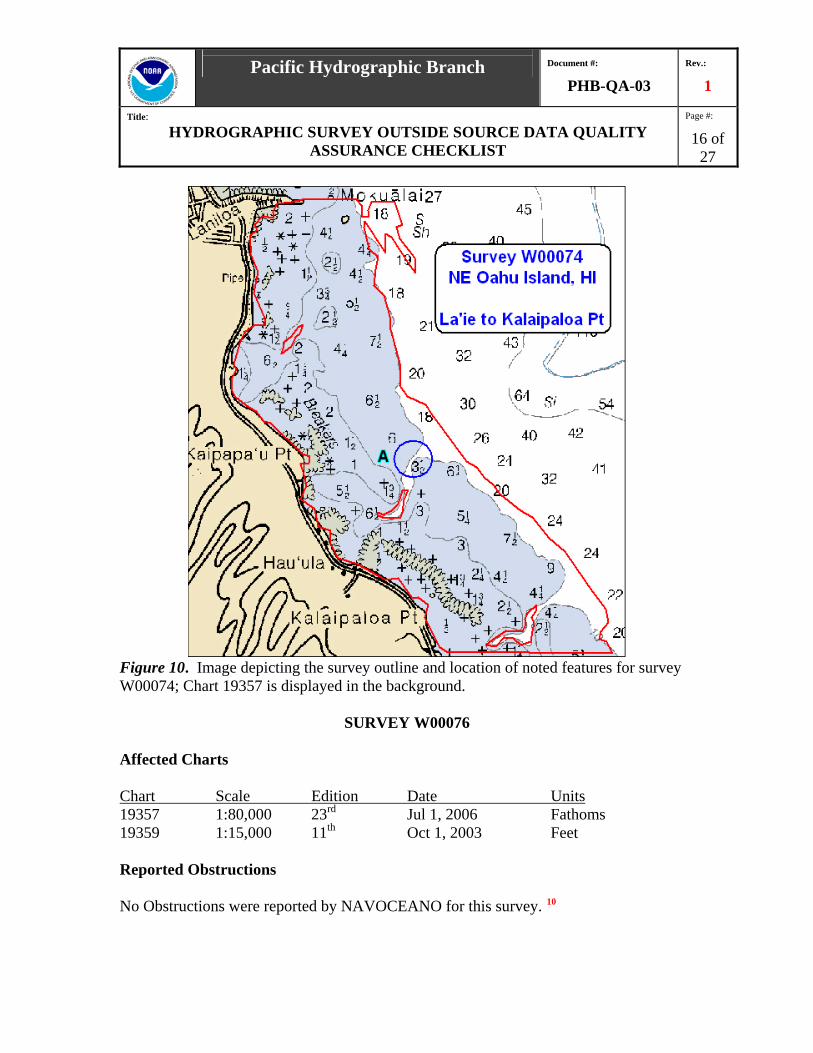
Figure 10. Image depicting the survey outline and location of noted features for survey W00074; Chart 19357 is displayed in the background.
SURVEY W00076
Affected Charts Chart Scale Edition Date Units 19357 1:80,000 23rd Jul 1, 2006 Fathoms 19359 1:15,000 11th Oct 1, 2003 Feet Reported Obstructions No Obstructions were reported by NAVOCEANO for this survey. 10

Pacific Hydrographic Branch Document #:
PHB-QA-03 Rev.:
1
Title:
HYDROGRAPHIC SURVEY OUTSIDE SOURCE DATA QUALITY ASSURANCE CHECKLIST
Page #:
17 of 27
Charted Features Chart 19357
A. A 17-fm depth was found in the vicinity of a charted 10-fm sounding. The charted sounding is located at 21°30'13.23" N, 157°47'40.3" W. The Lidar data was reviewed in Fledermaus 3DEditor and all surveyed depths in the vicinity were consistent with the 17 fathom depth. The surveyed depth appears valid and it is recommended that the charted depth be superseded.11
Chart 19359
A. A 103-foot depth was found in the vicinity of a charted 60-foot sounding. The charted (19359) depth corresponds with the charted (19357) 10-fm depth described in the above paragraph. It is recommended that the charted depth be superseded. 12
New Features
Chart 19359
B. A19-ft Lidar depth positioned at 21°30'43.64" N, 157°49'4.752" W was located in the vicinity of a charted 30-ft contour. The surveyed depth was reviewed in Fledermaus 3DEditor and appears to be the least depth of a new shoal (Figure11). The shoal is located near the Northeast entrance to the main channel that traverses Kane’ohe Bay. It is recommended that the charted depths and contours be superseded by the Lidar data. 13
Figure 11. A new shoal from W00076 displayed in Fledermaus; data is colored by depth.
19 ft Least Depth

Pacific Hydrographic Branch Document #:
PHB-QA-03 Rev.:
1
Title:
HYDROGRAPHIC SURVEY OUTSIDE SOURCE DATA QUALITY ASSURANCE CHECKLIST
Page #:
18 of 27
Figure 12. Image depicting the survey outline and location of noted features for survey W00076; Chart 19357 is displayed in the background.
SURVEY W00077
Affected Charts Chart Scale Edition Date Units 19357 1:80,000 23rd Jul 1, 2006 Fathoms 19359 1:15,000 11th Oct 1, 2003 Feet Smooth Sheet Soundings
A. Two 1-foot Lidar depths were plotted on the NAVOCEANO smooth sheet in the vicinity of a small harbor with charted depths of 36 -38 feet. The depths were positioned at 21°27'31.5" N, 157°49'33.05" W and 21°27'24.49" N, 157°49'29.02" W. Upon review in Fledermaus 3D-Editor, the 1-foot depths appear to be un-rejected data fliers that do not represent true features (Figure 13). The surrounding Lidar depths do not support these values and are consistent with the

Pacific Hydrographic Branch Document #:
PHB-QA-03 Rev.:
1
Title:
HYDROGRAPHIC SURVEY OUTSIDE SOURCE DATA QUALITY ASSURANCE CHECKLIST
Page #:
19 of 27
charted depths. The outliers are located in an area of patchy Lidar coverage caused by poor water clarity, increasing the likelihood of bad soundings to appear in the data set.
Figure 13. An image taken in Fledermaus 3D Editor displaying the position of the suspected fliers in relation to the surrounding Lidar depths. The depths outlined in white are plotted on the smooth sheet.
Surveyed depths were compared to singlebeam echosounder data from a NOAA survey conducted in 1976 (H09593). The singlebeam survey obtained good coverage in the vicinity of the questioned Lidar depths with what appears to be 50 meter survey line spacing (Figure 15). The singlebeam soundings agree with the charted depths and do not indicate the presence of any submerged features in the small harbor.
Figure 14. The location and depth (feet) of the suspect Lidar depths are shown in red, while the singlebeam echosounder depths (meters) from NOAA survey H09593 are shown in blue. Chart 19359 is displayed in the background.
Plotted Fliers

Pacific Hydrographic Branch Document #:
PHB-QA-03 Rev.:
1
Title:
HYDROGRAPHIC SURVEY OUTSIDE SOURCE DATA QUALITY ASSURANCE CHECKLIST
Page #:
20 of 27
NAVOCEANO did not include these depths in Appendix D: Targets, Obstructions, Wrecks of the Hawaii Lidar ROS, which implies that their inclusion in the smoothsheet was overlooked. Charting the 1-foot Lidar depths would serve to close off the small harbor as a potential anchorage. The reviewer believes that these depths are fliers and should not be applied to the chart.14
Reported Obstructions No Obstructions were reported by NAVOCEANO for this survey. 15 Charted Features
B. A 9 -foot sounding was found in the vicinity of a charted 21-foot sounding. The 9 foot sounding is located at 21°29'24.03" N, 157°50'18.25" W in the center of a narrow channel (100 m) connecting to the main channel of Kane’ohe bay. The 9 foot sounding is a least depth representing an overall shoaling trend in the channel. Due to the narrowness of the channel, it is unlikely that large draft vessels would enter; therefore, the difference in depth is not critical to navigation. The surveyed depths should supersede charted depths. 16
C. An overall shoaling trend was observed in a small cove located in the vicinity of
21°28'30.23" N, 157°48'48.36" W. Surveyed depths ranged between 12 to 14 feet and were on average 15 to 20 feet shoaler than charted depths (Figure 15). The surveyed soundings should supersede the charted depths. 17
Figure 15. Several Lidar depths (feet) displayed in red were selected from the smooth sheet to show the large depth discrepancy between the charted (19359) and surveyed depths.

Pacific Hydrographic Branch Document #:
PHB-QA-03 Rev.:
1
Title:
HYDROGRAPHIC SURVEY OUTSIDE SOURCE DATA QUALITY ASSURANCE CHECKLIST
Page #:
21 of 27
D. A 22-foot sounding was located at 21°28'23.30" N, 157°49'33.66" W in the
vicinity of a charted 42-foot sounding. The surveyed depth was reviewed in Fledermaus 3D Editor, and despite the patchy coverage appears to be valid. The difference in depth does not pose a critical danger to navigation. The Lidar depth should supersede the charted soundings. 18
E. A 2-foot sounding positioned at 21°27'7.452" N, 157°47'42.19" W was located in
the vicinity of a charted (19359) 10-foot sounding located on a small reef. The Lidar depth was reviewed in Fledermaus, and appears valid. The charted depth should be superseded. 19
Dangers to Navigation Eight dangers to navigation (DTON) were found during the review of survey W00077. 20 The DTONs are located in Kane’ohe Bay, along side the charted (19359) channel bounded by reefs and rocks to the east and west. The DTONs represent least depth soundings found in secondary channels and small harbors located to the west of the channel. F. Surveyed depths of 19 and 20 feet were located in the vicinity of charted 34 and 37 foot soundings. The DTONs were located approximately 100 meters west of a charted (19359) shoal designated with a light (Q R 22ft) (Figure 16). The depths were reviewed in Fledermaus 3D-Editor and appear to be valid despite the low sounding density. There is good depth agreement within the sounding cluster from which the dtons were extracted and there were hits from multiple lines (Figure 17).
Figure 16. The positions and depths of the DTONs are shown in red with chart 19359 displayed in the background. All depths are in feet.

Pacific Hydrographic Branch Document #:
PHB-QA-03 Rev.:
1
Title:
HYDROGRAPHIC SURVEY OUTSIDE SOURCE DATA QUALITY ASSURANCE CHECKLIST
Page #:
22 of 27
Figure 17. (a) This image was taken in Fledermaus 3D Editor with the Lidar data colored by depth. Two DTONs were selected from the cluster of Lidar depths to the west of the charted (19359) shoal. Note that there is good agreement between the surrounding depths. (b) The same subset of the Lidar data displayed in Fledermaus 3D Editor colored by survey line. This image shows that multiple Lidar passes obtained hits on the new shoal yielding similar depth values.
G. Three soundings of 17, 18 and 15 feet were selected to represent the shoaling
trend evident in a small harbor located in the vicinity of 21°28'35.77" N, 157°50'05.71" W. Depths surveyed in the cove were up to 20 feet shoaler than the charted depths that ranged between 25 and 37 feet. A review of the surveyed soundings in Fledermaus 3D Editor confirmed the validity of the smooth sheet depths and revealed an overall shoaling of the harbor (Figure 18). The surveyed shoaling could pose a danger to vessels attempting to anchor in the cove.
Figure 18. An image of the Lidar depths measured in the small cove displayed in Fledermaus 3D Editor. Lidar data is colored by depth. An overall shoaling trend was observed in the cove, which is surrounded by coral reefs, visible in red.
a bDTONs
Chd Shoal

Pacific Hydrographic Branch Document #:
PHB-QA-03 Rev.:
1
Title:
HYDROGRAPHIC SURVEY OUTSIDE SOURCE DATA QUALITY ASSURANCE CHECKLIST
Page #:
23 of 27
H. Several Lidar least depths were selected to represent a shoaling trend noted in a
secondary channel located to the west of the primary channel transecting Kane’ohe Bay. A 5 and 11 foot sounding were found in the vicinity of a charted 35 foot sounding (21°28'13.97" N, 157°49'52.09" W). Also, a 16 foot sounding was located in the vicinity of a charted 36-foot sounding (21°28'20.16" N, 157°49'57.45" W). The sounding density for this region was very sparse; however, there was good agreement between sounding depths and there did not appear to be any fliers (Figure 19). Lidar data was reviewed in Fledermaus 3D Editor and the surveyed depths appear valid and should supersede the charted soundings. The large depth discrepancy between surveyed and charted depths and the close proximity of this region to the main channel poses a critical danger to navigation.
Figure 19. An image from Fledermaus 3D Editor with the Lidar data colored by depth. The depths outlined in white are plotted on the smooth sheet.
Feature Depth
(ft) Latitude
N (D/M/S) Longitude W (D/M/S)
Sounding 19 21 21/29/44.78 157/50/01.85
Sounding 19 21/29/42.56 157/50/00.77
Sounding 17 22 21/28/34.45 157/50/2.088
Sounding 18 21/28/37.97 157/50/5.352
Sounding 15 21/28/36.20 157/50/9.852
Sounding 5 21/28/12.49 157/49/50.86
Sounding 11 21/28/15.27 157/49/53.16
Sounding 15 21/28/20.16 157/49/57.45
Table 1. Dangers to Navigation from NAVOCEANO Survey W00077.

Pacific Hydrographic Branch Document #:
PHB-QA-03 Rev.:
1
Title:
HYDROGRAPHIC SURVEY OUTSIDE SOURCE DATA QUALITY ASSURANCE CHECKLIST
Page #:
24 of 27
Figure 20. Image depicting the survey outline and location of noted features for survey W00077; Chart 19359 is displayed in the background.
SURVEY W00078
Affected Charts Chart Scale Edition Date Units 19357 1:80,000 23rd Jul 1, 2006 Fathoms 19359 1:15,000 11th Oct 1, 2003 Feet Reported Obstructions No Obstructions were reported by NAVOCEANO for this survey. 23 Charted Features
A. A PD charted wreck located approximately at 21°27'43" N, 157°45'38" W was reported as not seen in the data by NAVOCEANO. They report in the Chart Review (Appendix C, Hawaii Lidar ROS) that there is no local knowledge of the
Pacific Hydrographic Branch Document #:
PHB-QA-03 Rev.:
1
Title:
HYDROGRAPHIC SURVEY OUTSIDE SOURCE DATA QUALITY ASSURANCE CHECKLIST
Page #:
25 of 27
wreck and due to the surf and seas in the area, its existence is doubtful. It is recommended that the charted wreck be retained and added to the AWOIS database for future investigation or disproval. 24
New Features
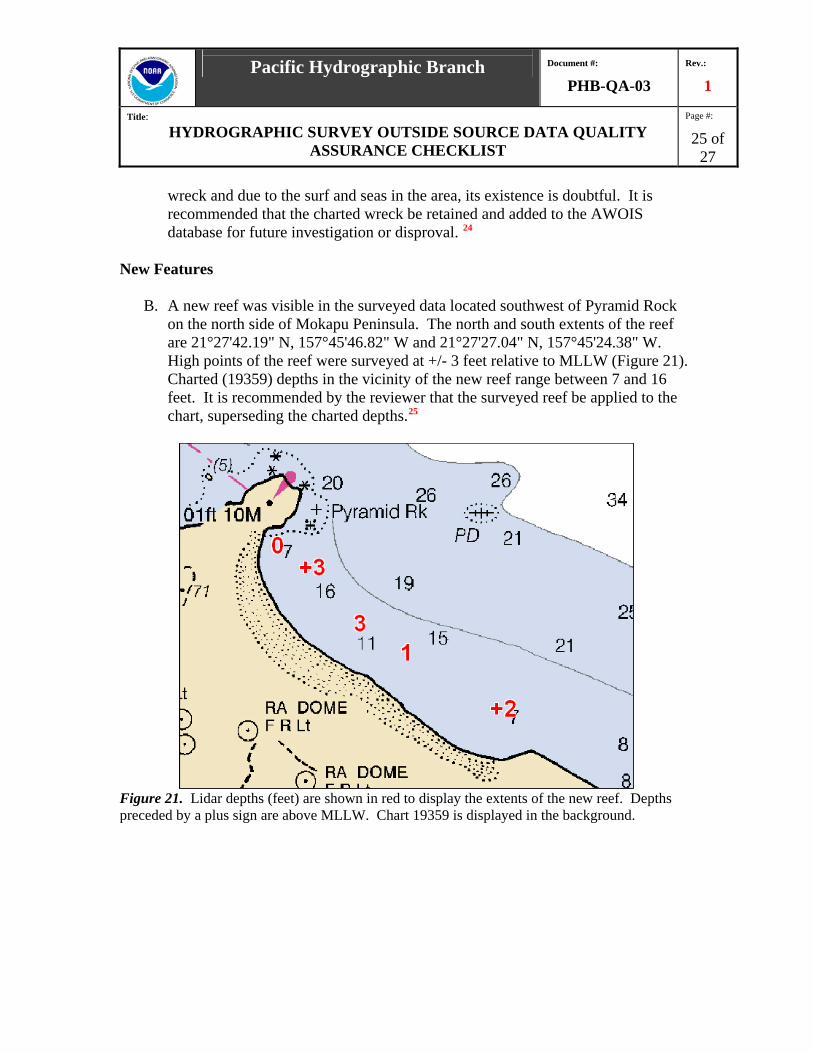
B. A new reef was visible in the surveyed data located southwest of Pyramid Rock on the north side of Mokapu Peninsula. The north and south extents of the reef are 21°27'42.19" N, 157°45'46.82" W and 21°27'27.04" N, 157°45'24.38" W. High points of the reef were surveyed at +/- 3 feet relative to MLLW (Figure 21). Charted (19359) depths in the vicinity of the new reef range between 7 and 16 feet. It is recommended by the reviewer that the surveyed reef be applied to the chart, superseding the charted depths.25
Figure 21. Lidar depths (feet) are shown in red to display the extents of the new reef. Depths preceded by a plus sign are above MLLW. Chart 19359 is displayed in the background.

Pacific Hydrographic Branch Document #:
PHB-QA-03 Rev.:
1
Title:
HYDROGRAPHIC SURVEY OUTSIDE SOURCE DATA QUALITY ASSURANCE CHECKLIST
Page #:
26 of 27
Figure 22. Image depicting the survey outline and location of noted features for survey W00078; Charts 19359 and 19357 are displayed in the background.
a

Pacific Hydrographic Branch Document #:
PHB-QA-03 Rev.:
1
Title:
HYDROGRAPHIC SURVEY OUTSIDE SOURCE DATA QUALITY ASSURANCE CHECKLIST
Page #:
27 of 27
Revisions compiled during office processing by the cartographer 1 In the area of these gaps, sounding and features should be retained as charted. 2 Attached to this report. 3 Chart 19357, 23rd edition and chart 19359, 11th edition were used for comparison with the present surveys. 4 Concur with clarification, LIDAR does not meet NOAA HSSDM object detection requirements. Charted shoal soundings have not been superseded by LIDAR data. 5 Attached to this survey. 6 Do not concur, chart according to these surveys. It is recommended that a caution note be charted in the vicinity of these surveys warning the mariner that local knowledge is advised when transiting these areas. 7 Concur with clarification, retain islet and 1 3/4 Rk as charted 8 Concur 9 Do not concur, see endnote 4. 10 Concur 11 Do not concur, see endnote 4 12 Do not concur, see end note 4 13 Concur 14 Concur, do not chart these features, these two soundings have been annotated in ink by hand on the smooth sheet.. 15 Concur 16 Concur 17 Concur 18 Concur 19 Concur 20 The danger to navigation letter is attached to this report. 21 Corrected depths for charting 22 Picked 16 at latitude 21/28/35.4N, longitude 157/50/3.9W 23 Concur 24 Concur 25 Concur


W00077 Danger to Navigation Report
Pacific Hydrographic Branch Danger to Navigation Report
Hydrographic Survey Registry Number: W00077 Survey Title: State: Hawaii Locality: Northeast Oahu Island Sub-locality: Kaneohe Bay Survey Dates: LIDAR – August 1 – December 20, 2000 LIDAR depths are reduced to Mean Lower Low Water using verified tides. Positions are based on the WGS84 horizontal datum. CHARTS AFFECTED: Chart Scale Edition Date
19359 1:15,000 11th Oct, 2003 19357 1:80,000 23rd Jul, 2006 DANGERS:
Feature Depth (ft) Latitude
N (D/M/S) Longitude W (D/M/S)
Sounding 20 21/29/44.78 157/50/01.85
Sounding 19 21/29/42.56 157/50/00.77
Sounding 17 21/28/34.45 157/50/2.088
Sounding 18 21/28/37.97 157/50/5.352
Sounding 15 21/28/36.20 157/50/9.852
Sounding 5 21/28/12.49 157/49/50.86
Sounding 11 21/28/15.27 157/49/53.16
Sounding 16 21/28/20.16 157/49/57.45
COMMENTS: Eight dangers to navigation (DTON) were found during review of survey W00077 submitted by the U.S. Naval Oceanographic Office.
1

W00077 Danger to Navigation Report
The DTONs are located in Kaneohe Bay, along side a charted (19359) channel that transects a coral reef. They represent least depth soundings found in secondary channels and small harbors located to the west of the channel. Questions concerning this report should be directed to the Chief, Pacific Hydrographic Branch at (206) 526-6835.
Figure 1. A chartlet depicting the location of the dangers to navigation reported for Survey W00077 with NOAA Chart 19359 as the background. Soundings are in feet.
2