descriptions and illustrative examples of systems ...assets.panda.org/downloads/5s-v2-2.pdf · use...
TRANSCRIPT

▼B-1
This appendix provides additional information on selecting and defining focal conservation targets
for site planning. Its primary emphasis is on conservation targets at functional landscapes, but
concepts and examples should be useful across all conservation sites.
The appendix is divided into four sections:
1. a framework for viewing conservation targets at multiple spatial scales (with examples),
2. examples of multi-scale targets from several functional landscapes,
3. worksheets to help determine conservation targets at functional landscapes,
4. a worksheet for documenting ecoregional conservation targets or other elements of
biodiversity that are nested within or subsumed by each focal conservation target, and for
specifying the parameters of a monitoring program for each focal target.
The first section (pages B2-B6) summarizes a framework for viewing conservation targets at multiple
spatial scales, as presented in Poiani et al. 19991. Species and terrestrial, aquatic, and marine ecological
communities and systems all occur across a variety of spatial or geographic scales. As described in
Chapter IV (Systems), spatial scales include fine, intermediate, coarse, and regional. For species, the
framework is applicable to individual populations, not to the species across its entire range, nor to
single organisms. For communities and ecological systems, the framework is applicable to natural (or
historic) individual occurrences. When using the framework, it is important to realize that nature is
not easily assigned to discrete boxes. Species, communities, and ecological systems occur across a
continuous gradient of spatial scales and it may be difficult to place a particular target in a specific
category. General guidance is provided in terms of acreage and stream miles, but keep in mind that the
size of occurrences of species, communities, and ecological systems will vary greatly across sites and
ecoregions. These values may need to be adjusted for your site.
The second section (pages B7-B9) presents several examples of focal conservation targets identified
at functional landscapes, with respect to spatial scale. You will notice that the selected targets often do
not fall within discrete categories, and may encompass both terrestrial and aquatic systems. This reflects
the dynamic and complex nature of ecological systems and species. The examples illustrate how targets
can be defined and selected across multiple spatial and biological scales at conservation sites.
The third section (pages B10-B14) provides a series of worksheets to assist with choosing focal
conservation targets for site conservation planning. The worksheets are intended to serve as “scratch
paper,” and should help make spatial and biodiversity scale more explicit in your thinking. Obviously,
use only those sheets appro-priate to the potential targets at your site. And do not be afraid to place
1 Poiani, K., B. Richter, M. Anderson, and H. Richter. 1999. Biodiversity conservation at multiple scales.BioScience: in press.
Descriptions and Illustrative Examples of Systems(Conservation Targets)
Appendix B
▼ ▼ ▼ ▼ ▼ ▼ ▼ ▼ ▼ ▼ ▼ ▼ ▼ ▼ ▼ ▼ ▼ ▼ ▼ ▼ ▼ ▼ ▼ ▼ ▼ ▼ ▼ ▼ ▼ ▼ ▼ ▼ ▼ ▼ ▼ ▼ ▼ ▼ ▼ ▼ ▼ ▼ ▼ ▼ ▼ ▼ ▼ ▼ ▼ ▼ ▼ ▼ ▼

The Five-S Framework for Site Conservation—Appendices
B-2▼
targets between discrete categories (we recommend using a pencil for this exercise!). Keep in mind
the worksheets were developed to help with the “Top Down” approach outlined in Chapter IV
(Systems), although they may also be useful in the “Bottom Up” approach. Feel free to adjust worksheet
headings as needed (e.g., matrix, large patch, and small patch framework for terrestrial communities/
ecological systems may not apply to your site or ecoregion). Remember—do not get bogged down
in assigning targets to categories. Use the worksheets to help identify and select a subset of conservation
targets that best represent the important biodiversity within your conservation site.
The fourth section (pages B15-B16) provides a worksheet template for documenting the
ecoregional conservation targets and other elements of biodiversity that are nested within or subsumed
by a focal conservation target. The template also allows the parameters of a monitoring program for
the focal target to be documented. An illustrative example is provided.

Appendix B
▼B-3
SPECIES
EXAMPLES
Regional Scale Species• Caribou, moose, elk, pronghorn• Wolves, jaguar, grizzly bear• Migrating waterfowl, shorebirds• American eel, Chinook salmon, Colorado pikeminnow
Coarse Scale Species• Prairie chicken, red cockaded woodpecker, pine marten• Black bear, bobcat, fox, badger• Lake sturgeon, paddlefish, blue sucker
Intermediate Scale Species• Prairie dog, black-footed ferret• Timber rattlesnake, marbled salamander• Bigmouth buffalo fish• Dwarf wedge mussel
Local Scale Species• Bay checkerspot butterfly• Sandplain gerardia• Burrowing mayflies, water striders• Desert pupfish
LocalScale
Species
IntermediateScale Species
CoarseScale Species
RegionalScale Species
REGIONAL> 1,000,000 acres,migrate long distances
COARSE20,000 - 1,000,000 acres,4th order & larger rivernetwork, > 2500 acre lake
INTERMEDIATE1,000 - 50,000 acres,1st - 3rd order stream network,250 - 2500 acre lake
LOCAL< 2,000 acres,< 10 river miles,< 250 acre lake
Geo
grap
hic
Scal
eLevels of Biodiversity and Spatial Scale

The Five-S Framework for Site Conservation—Appendices
B-4▼
Small PatchCommunities& Systems
Large PatchCommunities& Systems
Matrix Communities& Systems
COARSE20,000 - 1,000,000 acres
INTERMEDIATE1,000 - 50,000 acres
LOCAL< 2,000 acres
Geo
grap
hic
Scal
e
TERRESTRIAL COMMUNITIES AND SYSTEMS
EXAMPLES
Matrix• Spruce fir forest, longleaf pine forest, ponderosa pine forest• Chaparral, tallgrass prairie, shortgrass prairie• Sagebrush steppe, coastal sand plain
Large Patch• Salt marsh, western emergent marsh• Red maple swamp, bottomland wetland• Desert annual grassland, pine barren• Riparian complex, prairie-savanna complex• Coastal beaches and dunes
Small Patch• Fen, bog, seep, playa• Glade, alpine summit, cliff• Cave, serpentine grassland

Appendix B
▼B-5
AQUATIC COMMUNITIES AND SYSTEMS
AquaticMacro-habitats
Stream Systems& Medium Lake
Systems
Medium to Large RiverSystems & Large Lake
Systems
COARSE4th order & larger riversand their tributaries;> 2500 acre lakes
INTERMEDIATE1st - 3rd order streamsand their tributaries;250 - 2500 acre lakes
LOCAL< 10 river miles;< 250 acre lakes
Geo
grap
hic
Scal
e
EXAMPLES
Medium–Large River Systems & Large Lake Systems• Sixth order, warm water, low gradient river and its tributaries• Series of connected, glacially-scoured, cold water, oligotrophic lakes• Fifth order, snowmelt- and groundwater-fed mountain valley river in an alluvial valley, and its
tributaries• Five thousand acre, debris dam, groundwater-fed, mesotrophic lake
Stream Systems & Medium Lake Systems• Third order, warm water, low gradient coastal plain stream and its tributaries• Groundwater-fed headwater complex of small lakes, wetlands, and streams• Thousand acre, fishless, alkaline desert playa lake
Aquatic Macrohabitats• Alpine cirque lake• First order, cold water, high gradient, groundwater-fed stream• Four mile segment of a sixth order, warm water, low gradient river
The Five-S Framework for Site Conservation—Appendices
B-6▼
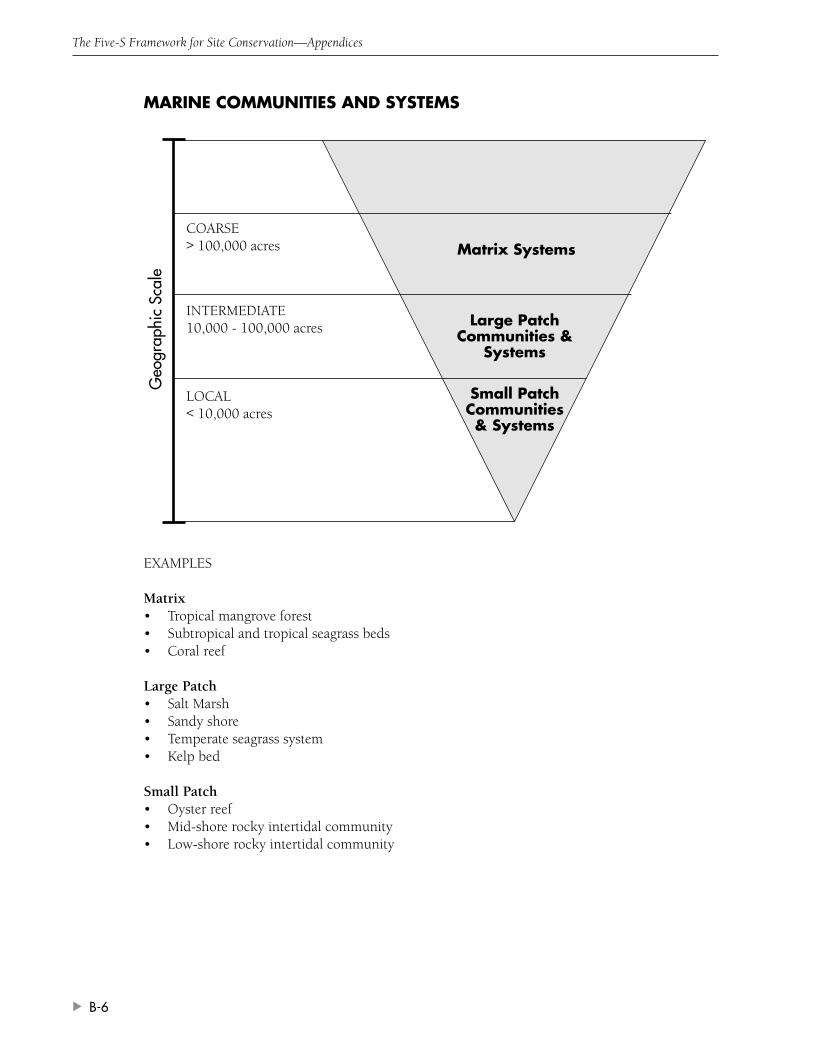
MARINE COMMUNITIES AND SYSTEMS
Large PatchCommunities &
Systems
Matrix SystemsCOARSE> 100,000 acres
INTERMEDIATE10,000 - 100,000 acres
LOCAL< 10,000 acres
Geo
grap
hic
Scal
e
Small PatchCommunities& Systems
EXAMPLES
Matrix• Tropical mangrove forest• Subtropical and tropical seagrass beds• Coral reef
Large Patch• Salt Marsh• Sandy shore• Temperate seagrass system• Kelp bed
Small Patch• Oyster reef• Mid-shore rocky intertidal community• Low-shore rocky intertidal community

Appendix B
▼B-7
Illustrative Examples of Focal Conservation Targets
MOSES COULEE, E. WASHINGTON
Regional
Coarse
Intermediate
Local
SpeciesTerrestrialSystems
AquaticSystems
Breeding colony ofspotted bats
Sage grouse
Pygmy rabbit
Shrub-steppe matrix(i.e., assemblage of big
sagebrush& bunchgrasscommunities
Cliffs and talushabitats
Riparianvegetationcomplex
Seeps and springs
GREATER EGLIN AIR FORCE BASE, FLORIDA*
Regional
Coarse
Intermediate
Local
SpeciesTerrestrialSystems
AquaticSystems
Florida black bear
Florida bogfrog
Longleaf pine sandhillforest matrix;
Longleaf pine-mixedhardwood forest
matrix
Pitcherplant bogs-sandhill ponds
* Excluding coastal, marine, and large river systems which are considered unique sites
Red-cockadedwoodpecker
Flatwoodssalamander
Seepage stream/slope forest complex(including 7 communities & 35 G1-
G3 plant & animal species

The Five-S Framework for Site Conservation—Appendices
B-8▼
CANAAN VALLEY/DOLLY SODS, WEST VIRGINIA
Regional
Coarse
Intermediate
Local
SpeciesTerrestrialSystems
AquaticSystems
Sub-alpine conifermatrix forest;N. hardwoodmatrix forest
MigratingNeotropical birds
HUACHUCA MOUNTAINS, ARIZONA
Regional
Coarse
Intermediate
Local
SpeciesTerrestrialSystems
AquaticSystems
Mixed conifer forestsat high elevations
Grass balds/heath barrens
Madrean oak and oak-pine woodlands
Large, lowgradient, highelevation river
Acidicwetlands
Circum-neutralwetlands
Ramsey Canyon& Chiracahualeopard frog
Globally rare (G1-G3)plant species
Mesic canyons with perennialwater and associated ripariancommunities, seeps, springs,
cienegas

Appendix B
▼B-9
MADRE DE LAS AGUAS, DOMINICAN REPUBLIC
Regional
Coarse
Intermediate
Local
SpeciesTerrestrialSystems
AquaticSystems
Dense pine forest;Open pine forest;
Humid and semi-humidbroadleaf forests;
Montane cloud forest
Sabana de Pajón (Pajónsavannas/balds)
RÍA LAGARTOS AND RÍA CELESTÚN, YUCATAN PENINSULA
Regional
Coarse
Intermediate
Local
SpeciesTerrestrialSystems
AquaticSystems
Savannah
Petenes(hummocks)
Riparian forestcomplex
Groundwater fed, 3rdorder stream systemover erosive soil in
Nizao Ecological Group
First order, high-gradient streams overnon-erosive rock in
Bao Ecological Group
Seasonally floodeddry tropical forest
Mangroves
CoastalStrand
CoastalLagoons
Barrier DuneCommunities
The Five-S Framework for Site Conservation—Appendices
B-10▼
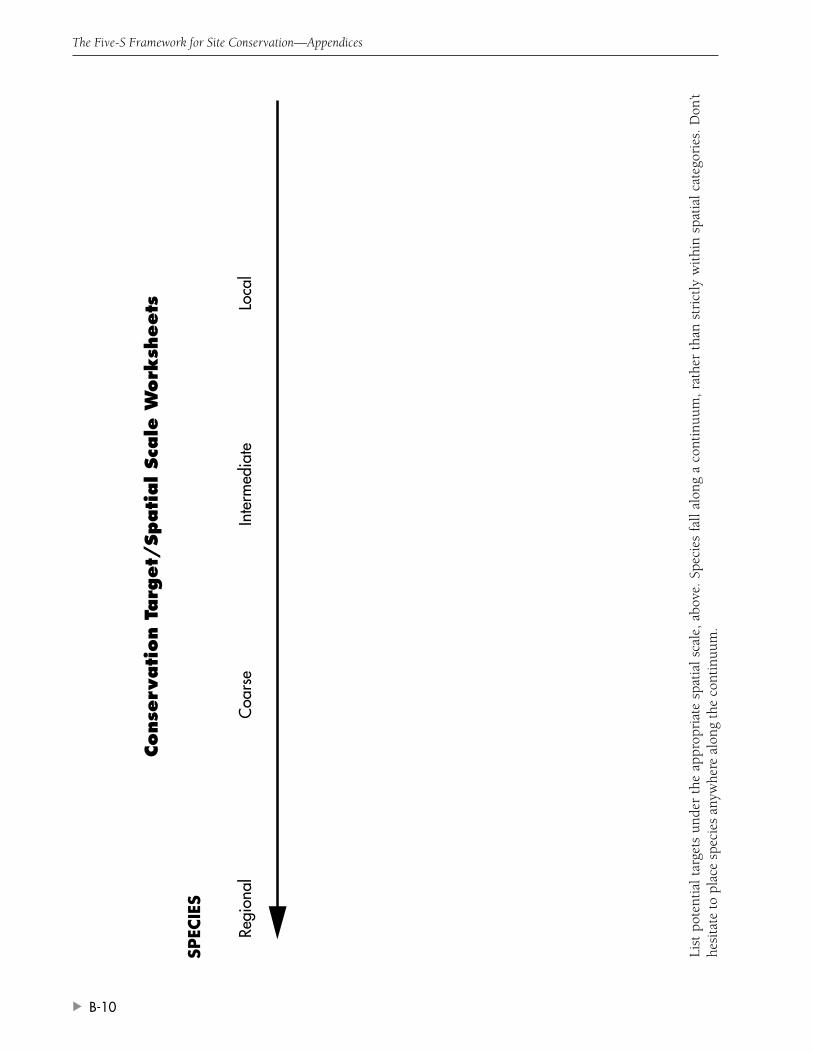
Conse
rvation T
arg
et/
Spatial Sca
le W
ork
sheets
SPEC
IES
Regi
onal
Coa
rse
Inte
rmed
iate
Loca
l
List
pot
enti
al t
arge
ts u
nder
the
app
ropr
iate
spa
tial
sca
le,
abov
e. S
peci
es f
all
alon
g a
cont
inuu
m,
rath
er t
han
stri
ctly
wit
hin
spat
ial
cate
gori
es.
Don
’the
sita
te t
o pl
ace
spec
ies
anyw
her e
alo
ng t
he c
onti
nuum
.

Appendix B
▼B-11
TERRES
TRIA
L EC
OLO
GIC
AL
SYST
EMS
Mat
rixLa
rge
Patc
hSm
all P
atch
List
ter
rest
rial
eco
logi
cal
syst
ems
unde
r th
e ap
prop
riat
e sp
atia
l sc
ale,
abo
ve.
Terr
estr
ial
syst
ems
fall
alon
g a
cont
inuu
m,
rath
er t
han
stri
ctly
wit
hin
spat
ial c
ateg
orie
s. D
on’t
hesi
tate
to
plac
e te
rres
tria
l sys
tem
s an
ywhe
re a
long
the
con
tinu
um.

The Five-S Framework for Site Conservation—Appendices
B-12▼
AQ
UA
TIC E
CO
LOG
ICA
L SY
STEM
S
Med
ium
-Lar
ge R
iver
Sys
tem
s,La
rge
Lake
Sys
tem
sSt
ream
Sys
tem
s,M
ediu
m L
ake
Syste
ms
Aqu
atic
Mac
roha
bita
ts
List
all
aqua
tic
ecol
ogic
al s
yste
ms
unde
r th
e ap
prop
riat
e sp
atia
l sca
le, a
bove
. Aqu
atic
sys
tem
s fa
ll al
ong
a co
ntin
uum
, rat
her
than
str
ictl
y w
ithi
n sp
atia
lca
tego
ries
. Don
’t he
sita
te t
o pl
ace
aqua
tic
syst
ems
anyw
her e
alo
ng t
he c
onti
nuum
.

Appendix B
▼B-13
MA
RIN
E EC
OLO
GIC
AL
SYST
EMS
Coa
rse
Inte
rmed
iate
Loca
l
List
all
mar
ine
ecol
ogic
al s
yste
ms
unde
r th
e ap
prop
riat
e sp
atia
l sc
ale,
abo
ve.
Mor
e de
scri
ptiv
e sp
atia
l ca
tego
ries
will
be
adde
d in
the
nea
r fu
ture
.M
arin
e sy
stem
s fa
ll al
ong
a co
ntin
uum
, ra
ther
tha
n st
rict
ly w
ithi
n sp
atia
l ca
tego
ries
. D
on’t
hesi
tate
to
plac
e m
arin
e sy
stem
s an
ywhe
re a
long
the
cont
inuu
m.

Final Li
st o
f Pla
nnin
g T
arg
ets
From
the
pre
viou
s w
orks
heet
s, s
elec
t a
subs
et o
f no
mor
e th
an e
igh
t co
nser
vati
on t
arge
ts t
hat
repr
esen
t th
e bi
odiv
ersi
ty o
f the
con
serv
atio
n si
te.
Regi
onal
Coa
rse
Inte
rmed
iate
Loca
l
Spec
ies
Terr
estri
alSy
stem
sA
quat
icSy
stem
s
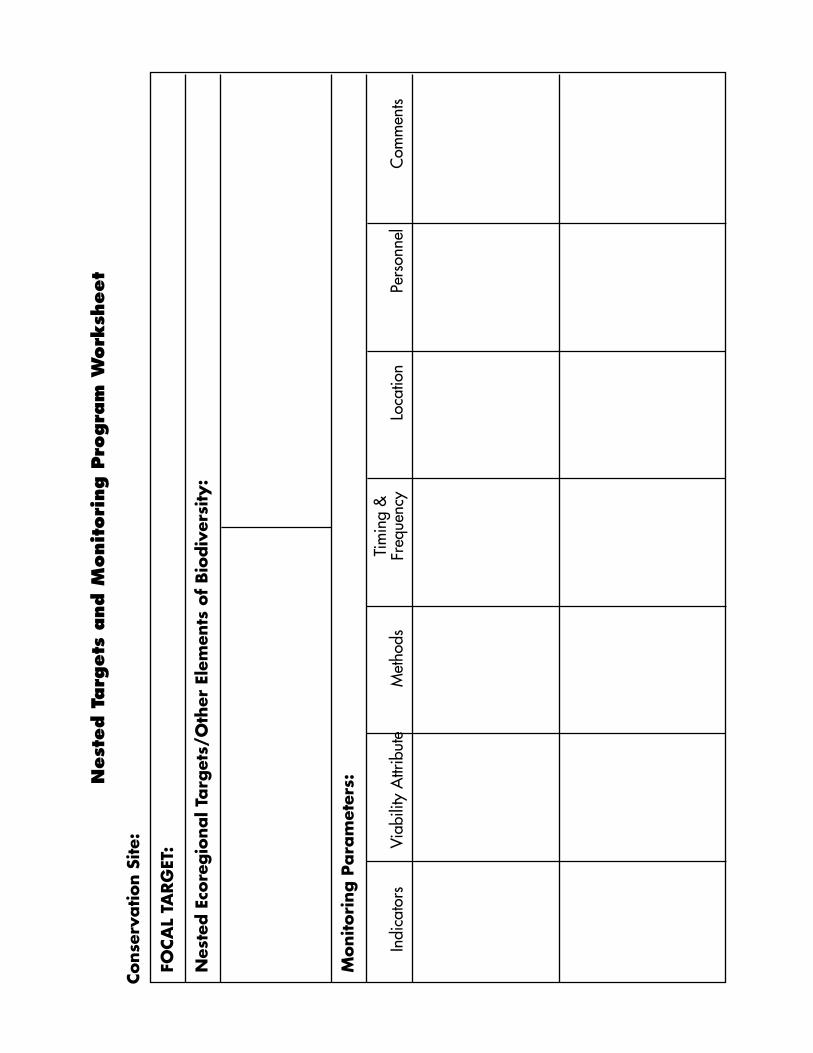
FOCA
L TA
RG
ET:
Nes
ted E
core
gio
nal T
arg
ets/
Oth
er E
lem
ents
of
Bio
div
ersi
ty:
Monitori
ng P
ara
met
ers:
Indi
cato
rsVi
abili
ty A
ttrib
ute
Met
hods
Tim
ing
&Fr
eque
ncy
Loca
tion
Pers
onne
lC
omm
ents
Nest
ed T
arg
ets
and M
onitori
ng P
rogra
m W
ork
sheet
Conse
rvation S
ite:
The Five-S Framework for Site Conservation—Appendices
B-16▼
Con
diti
on:
Com
posi
tion
FOCA
L TA
RG
ET:
Nes
ted E
core
gio
nal T
arg
ets/
Oth
er E
lem
ents
of
Bio
div
ersi
ty:
Monitori
ng P
ara
met
ers:
Indi
cato
rsVi
abili
ty A
ttrib
ute
Met
hods
Tim
ing
&Fr
eque
ncy
Loca
tion
Pers
onne
lC
omm
ents
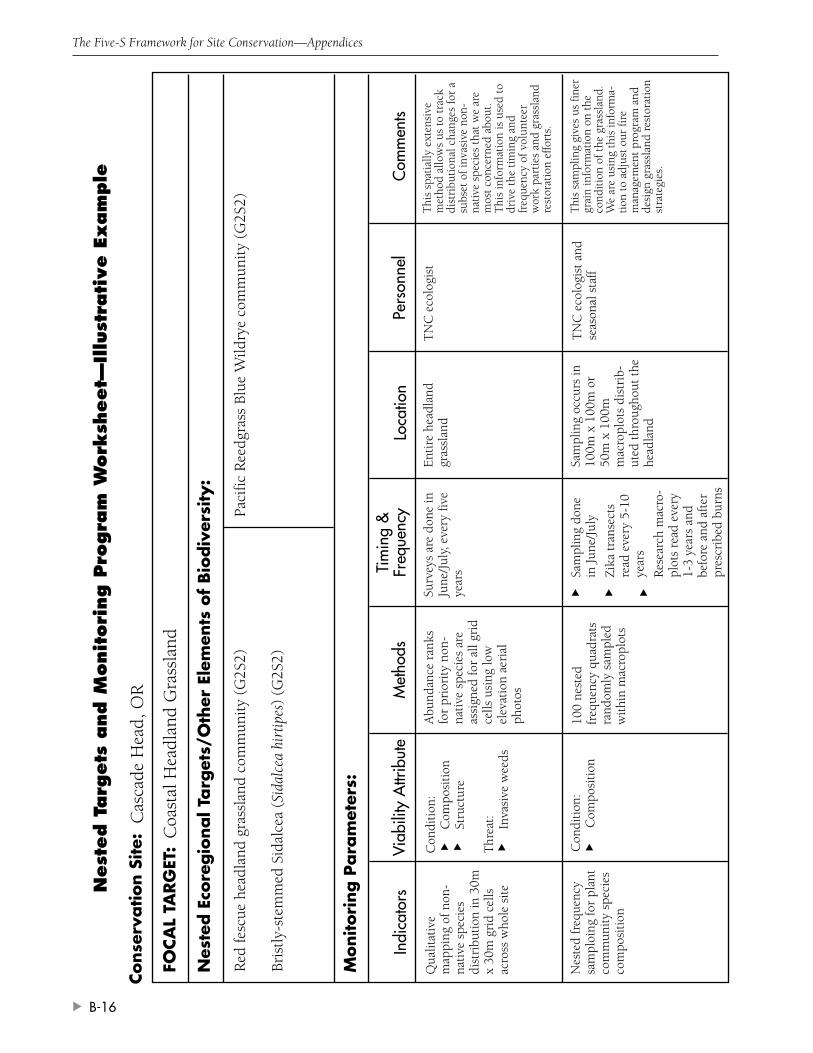
Nest
ed T
arg
ets
and M
onitori
ng P
rogra
m W
ork
sheet—
Illu
stra
tive E
xam
ple
Conse
rvation S
ite:
Cas
cade
Hea
d, O
R
Coa
stal
Hea
dlan
d G
rass
land
Red
fesc
ue h
eadl
and
gras
slan
d co
mm
unit
y (G
2S2)
Bris
tly-
stem
med
Sid
alce
a (S
idal
cea
hirt
ipes
) (G
2S2)
Paci
fic R
eedg
rass
Blu
e W
ildry
e co
mm
unit
y (G
2S2)
Qua
litat
ive
map
ping
of n
on-
nati
ve s
peci
esdi
stri
buti
on in
30m
x 30
m g
rid
cells
acro
ss w
hole
sit
e
Nes
ted
freq
uenc
ysa
mpl
oing
for
plan
tco
mm
unit
y sp
ecie
sco
mpo
siti
on
Con
diti
on:
Com
posi
tion
Stru
ctur
e
Thr
eat: Inva
sive
wee
ds
▼ ▼ ▼ ▼
Abu
ndan
ce r
anks
for
prio
rity
non
-na
tive
spe
cies
are
assi
gned
for
all g
rid
cells
usi
ng lo
wel
evat
ion
aeri
alph
otos
100
nest
edfr
eque
ncy
quad
rats
rand
omly
sam
pled
wit
hin
mac
ropl
ots
Surv
eys
are
done
inJu
ne/J
uly,
eve
ry fi
veye
ars Sa
mpl
ing
done
in J
une/
July
Zik
a tr
anse
cts
read
eve
ry 5
-10
year
s
Res
earc
h m
acro
-pl
ots
read
eve
ry1-
3 ye
ars
and
befo
re a
nd a
fter
pres
crib
ed b
urns
▼ ▼ ▼
Ent
ire
head
land
gras
slan
d
Sam
plin
g oc
curs
in10
0m x
100
m o
r50
m x
100
mm
acro
plot
s di
stri
b-ut
ed t
hrou
ghou
t th
ehe
adla
nd
TN
C e
colo
gist
TN
C e
colo
gist
and
seas
onal
sta
ff
Thi
s sp
atia
lly e
xten
sive
met
hod
allo
ws
us t
o tr
ack
dist
ribu
tion
al c
hang
es fo
r a
subs
et o
f inv
asiv
e no
n-na
tive
spe
cies
tha
t w
e ar
em
ost
conc
erne
d ab
out.
Thi
s in
form
atio
n is
use
d to
driv
e th
e ti
min
g an
dfr
eque
ncy
of v
olun
teer
wor
k pa
rtie
s an
d gr
assl
and
rest
orat
ion
effo
rts.
Thi
s sa
mpl
ing
give
s us
fine
rgr
ain
info
rmat
ion
on t
heco
ndit
ion
of t
he g
rass
land
.W
e ar
e us
ing
this
info
rma-
tion
to
adju
st o
ur fi
rem
anag
emen
t pr
ogra
m a
ndde
sign
gra
ssla
nd r
esto
rati
onst
rate
gies
.

▼C-1
Illustrative List of Stresses
Habitat destruction or conversion
Habitat fragmentation
Habitat disturbance
Alteration of natural fire regimes
Nutrient loading
Sedimentation
Toxins/contaminants
Extraordinary predation/parasitism/disease
Modification of water levels; changes in naturalflow patterns
Thermal alteration
Salinity alteration
Groundwater depletion
Resource depletion
Extraordinary competition for resources
Excessive herbivory
Altered composition/structure
Agricultural and ForestryIncompatible crop production practicesIncompatible livestock production practicesIncompatible grazing practicesIncompatible forestry practices
Land DevelopmentIncompatible primary home developmentIncompatible second home / resort
developmentIncompatible commercial / industrial
developmentIncompatible development of roads or
utilitiesConversion to agriculture or silviculture
Water ManagementDam constructionConstruction of ditches, dikes, drainage or
diversion systemsChannelization of rivers or streamsIncompatible operation of dams or reservoirsIncompatible operation of drainage or
diversion systemsExcessive groundwater withdrawalShoreline stabilization
Point Source PollutionIndustrial dischargeLivestock feedlotIncompatible wastewater treatmentMarina developmentLandfill construction or operation
Resource ExtractionIncompatible mining practicesIncompatible oil or gas drillingOverfishing or overhuntingPoaching or commercial collecting
RecreationIncompatible recreational useRecreational vehicles
Land/Resource ManagementFire suppressionIncompatible management of/for certain
species
BiologicalParasites/pathogensInvasive/alien species
Illustrative List of Sources of Stress
Illustrative List of Stresses and Sources
Appendix C
▼ ▼ ▼ ▼ ▼ ▼ ▼ ▼ ▼ ▼ ▼ ▼ ▼ ▼ ▼ ▼ ▼ ▼ ▼ ▼ ▼ ▼ ▼ ▼ ▼ ▼ ▼ ▼ ▼ ▼ ▼ ▼ ▼ ▼ ▼ ▼ ▼ ▼ ▼ ▼ ▼ ▼ ▼ ▼ ▼ ▼ ▼ ▼ ▼ ▼ ▼ ▼ ▼

The Five-S Framework for Site Conservation—Appendices
C-2▼
Examples of Threat Scenarios
This appendix includes six examples of different threat scenarios. In each case, stresses and sources of
stress are listed along with their respective ranking factors. Overall Stress Ranks, Source Ranks, Threat
Ranks (shown to the right of the divider next to the Contribution, Irreversibility, and Source Ranks),
and the overall Threat-to-System rank are shown based on the scoring tables listed in Appendix A.
Explanations are provided describing the basis of stress and source selection, the stress ranking, and
the source ranking.
Explanation:Stress and Source selection: The conversion of forest to homes completely destroys habitat for
the birds in areas where the conversion occurs. It also creates stress on the birds in the remainingforest fragments by increasing predation and nest parasitism rates, altering vegetation compositionand structure, and changing the demographics and genetics of the bird populations.
Stress ranking: “Habitat destruction” is the most severe stress that could occur. The scope of thisstress is “Medium” because it is projected to occur at only about 30% of the site. Because “Habitatfragmentation” causes less severe stress than “Habitat destruction”, severity was ranked as “High”instead of “Very High”. However, fragmentation will affect nesting birds throughout the site, so thescope is “Very High”.
Source ranking: “Primary home development” is the sole cause of “habitat destruction” and“habitat fragmentation”. It is unlikely to be effectively reversed once in place.
Very High
High
Stresses
Habitat destruction orconversion
Habitat fragmentation
Severity Scope Stress Rank
Medium
Very High
Medium
High
EXAMPLE 1: Home Development in a Forested SiteThreat Scenario: A forested landscape is being developed for single family homes. The system isthe assemblage of neotropical migratory birds that nest in the forest. The homes are being built intwo areas, which will fragment the forest into three small patches.
Sources ofStress
Contribution
Irreversibility
Source
Contribution
Irreversibility
Source
Primary homedevelopment
Habitat Destruction/Conversion
HabitatFragmentation
Threat-to-SystemRank
Very High
Very High
Very High
Very High
Very High
Very High
Medium High High
Medium High

Appendix C
▼C-3
Very High
Stresses
Extraordinary competitionfor resources
Severity Scope Stress Rank
Medium Very High
EXAMPLE 2: Invasive Plant Species in a WetlandThreat Scenario: A graminoid-dominated wetland plant community is threatened by the invasionof an invasive non-native grass species that typically converts this type of wetland to a monocultureof the non-native grass. The conservation target is the natural plant community.
Sources ofStress
Contribution
Irreversibility
Source
Contribution
Irreversibility
Source
Invasive/alienspecies
Altered composition/structure
Very High
Medium
High
High High
High
Threat-to-SystemRank
Explanation:Stress and Source Selection: The “Extraordinary competition for resources” stress category is designed
to capture the numerous more specific stresses inflicted by invasive/alien species such as competitionfor light (shading), soil resources, germination or vegetative growth space, and pollinators. Even thoughthe non-native plant will alter species composition, an “Altered composition/structure” stress was notincluded since this stress would be largely redundant to the “Extraordinary competition for resourcesstress”. Had the non-native species been an invasive tree or shrub predicted to alter the structure of thegrassland, we would have also included a separate “Altered composition/structure” stress.
Stress Ranking: A Severity rank of “Very High” was assigned given the aggressive invasive natureof the non-native species that will eventually lead to a monoculture of the alien species. We assumedthat at least some portion of the wetland area would be converted to such a monoculture standduring the next 10 years. Even though the invasive species is not now widespread, nor likely to beso within the next 10 years, the Scope was given a rank of “Very High” because within the next 10years its distribution is likely to grow to a point that it will effectively be uncontrollable.
Source Ranking: The “Very High” Contribution rank was assigned because the invasive/alien speciesis the only source causing the competition for resources stress. The cost of reducing the stress inflictedby the invasive/alien species is going to be quite expensive, leading to the “High” Irreversibility rank.

The Five-S Framework for Site Conservation—Appendices
C-4▼
High
Stresses
Altered composition/structure
Severity Scope Stress Rank
High High
EXAMPLE 3: Fire Suppression in a GrasslandThreat Scenario: A grassland community is threatened by fire suppression. The community evolvedwith a regular fire return interval of 5-10 years. Natural ignition sources included lightening (mainlyvia strikes that hit the adjacent forested area and then spread to the grassland) and Native Americans,who used fire as part of their wildlife management and agricultural practices. Fire has not occurredin the grassland during the last 100 years because of active fire suppression efforts and the absenceof Native American ignition. The absence of fire has led to the invasion of many trees and shrubsinto the grassland. The conservation target is the grassland system.
Sources ofStress
Contribution
Irreversibility
Source
Contribution
Irreversibility
Source
Lack of Fire
Competition forResources
Very High
Medium
High
HighVeryHigh
High
Threat-to-SystemRank
Explanation:Stress and Source Selection: The primary stress to the grassland system is the altered composition
and structure caused by the encroachment and spread of native trees and shrubs. The absence ofburning has also undoubtedly impacted various aspects of soil condition (e.g., carbon/nitrogenratios) but the potential impacts of this stress are poorly understood and suspected to be less significantthan the structural changes to the plant community. The source of stress is both the active suppressionof wildfires and the lack of Native American ignition sources which were combined into “Lack ofFire”.
Stress Ranking: This habitat alteration is a steady but relatively slow process that will seriouslydegrade (Severity = “High”) the grassland system throughout most of the grassland system (Scope =“High”).
Source Ranking: There is only a single listed source of stress so the Contribution is ranked“Very High”. The prospects of abating this threat through a prescribed burning program are fairlygood with a reasonable commitment of additional resources leading to an Irreversibility ranking of“Medium”.

Appendix C
▼C-5
Explanation:Stress and Source selection: Grasses at the site are stressed by “Excessive herbivory” and by
“Extraordinary competition” for light, space, and nutrients. The stress of “Altered composition/structure” refers to the reduced grass height, which alters the habitat structure for plants, invertebrates,small mammals, birds, and lizards. “Grazing practices” directly cause the stresses of “Excessiveherbivory” and “Altered composition/structure”. Invasive grasses are the source of the stress of“Extraordinary competition for resources”. However, the current grazing practices create soildisturbance, which allows the invasive grasses to proliferate more abundantly at the site. Therefore,the current grazing regime is an indirect source of “Extraordinary competition for resources”.
Stress ranking: The severity of “Excessive herbivory” was ranked “High” because plants areunable to reproduce and the stress is therefore seriously degrading, but not completely destroying,the target. The structure of the site has changed dramatically, and is not providing habitat for manyspecies. However, the community has not been destroyed by the change in structure. The scope forall of the stresses is “High”, because the grazing is widespread, but does not occur in all areas.
Source ranking: “Grazing practices” have been nearly the sole contributor to the stresses. Nativeherbivores are rare at the site. It is possible to reverse the stresses caused by the current grazingpractices, but it will take a reasonable commitment of additional time and resources. Thus weranked Irreversibility as “Medium”.
High
High
High
Stresses
Extraordinary competitionfor resources
Excessive herbivory
Altered composition/structure
Severity Scope Stress Rank
High
High
High
High
High
High
EXAMPLE 4: Cattle Grazing in a GrasslandThreat Scenario: A grassland community is threatened by season-long cattle grazing where thestubble heights at the end of the season average only 1cm. About 20% of the site is inaccessible tocattle. There’s no evidence that native ungulates were ever very abundant in the area. The system isthe entire grassland community.
Sources ofStress
Contribution
Irreversibility
Source
Contribution
Irreversibility
Source
Grazing Practices
Extraordinarycompetition for
resources
High
Medium
Medium
High
Medium
Medium
Very High
Medium
Very High
Medium High High
High High
Invasive/Alienspecies
Threat-to-SystemRank
Excessive herbivoryAltered
composition/structure
High
Medium
Very High
Medium
Very High
High
Medium

The Five-S Framework for Site Conservation—Appendices
C-6▼
Very High
VeryHigh
Stresses
Habitat destruction
Modification of water levels
Severity Scope Stress Rank
High
Very High
High
Very High
EXAMPLE 5: Excessive Groundwater WithdrawalThreat Scenario: Residential home development is threatening a Mesquite bosque riparian system.In addition to the outright habitat destruction associated with this development, residential wellsare depleting the ground water supply. In the past 10 years, the average water table level has droppedto 10 m below ground level and is dropping at a rate of 2 m per year. Once the average water tablelevel drops to more than 5 m below ground, declines in vegetation height and foliage abundanceoccur and seedling survivorship is reduced. Lowering of the water table below 15 m results in deathof riparian mequite trees or conversion to shrub forms.
Sources ofStress
Contribution
Irreversibility
Source
Contribution
Irreversibility
Source
Incompatibleprimary homedevelopment
Excessivegroundwaterwithdrawal
Habitat Destruction
Very High
Very High
Very High
High
High
High
Very High Very HighVeryHigh
Very High High
Modification ofwater levels
Threat-to-SystemRank
Very High
High
Very High
Very HighVeryHigh
ExplanationStress and Source Selection: Even though the construction and operation of groundwater wells
is part of the incompatible primary home development source of stress, the impact of the loweredgroundwater level on the riparian system clearly warrants the differentiation of two separate stressesand two separate sources of stress.
Stress Ranking: The Severity of the “Habitat destruction stress” receives a “Very High” rankgiven the projected type of housing development (i.e., removal of all native vegetation, extensivepaving and planted lawn areas). There is a strip of habitat immediately adjacent to the river channelthat cannot be developed under current zoning restrictions, so the Scope of this stress is given a“High” rather than a “Very High” rank. With the water table already at 10 m below the surface anddropping at a rate of 2 m per year, the projected impact of the “Modification of water level” stresswithin the next 10 years is quite severe, leading to the projected large scale mortality of mature treesthroughout the riparian system. Thus, both Severity and Scope are given “Very High” ranks.
Source Ranking: “Incompatible primary home development” is the primary source behind the“Habitat destruction” stress so it received a “Very High” Contribution rank. For all intents andpurposes, the construction of new residential homes is not reversible (i.e., Irreversibility=“Very High”).The “Incompatible primary home development” source is also a contributor to the “Modification ofwater levels” stress although it is given a lower Contribution rank (“High” instead of “Very High”)given the more direct influence of “Excessive groundwater withdrawal” from both existing andprojected new wells. There’s a chance that residential wells could be eliminated through the extensionof a municipal water supply line but the high cost of this solution led to Irreversibility ranks of“High” being assigned to both sources of stress.

Appendix C
▼C-7
Very High
Stresses
Habitat Destruction
Severity Scope Stress Rank
Medium Very High
EXAMPLE 6: Filling a WetlandThreat Scenario: A 100 acre wetland represents the only known occurrence of a high-ranked plantcommunity. The wetland is in private ownership and threatened by the dumping of fill. Assume thatthe entire wetland area is considered necessary for maintaining the viability of this target occurrence.Thus, if dumping of fill takes place, we’ll need to restore the impacted portion of the wetland byremoving the fill and replanting with native species to achieve our conservation goals at this site.The conservation target is the wetland plant community.
Sources ofStress
Contribution
Irreversibility
Source
Contribution
Irreversibility
Source
Dumping of Fill
Habitat Destruction
Very High
Jigh
Very High
Very HighVeryHigh
Very High
Threat-to-SystemRank
Explanation:Stress and Source Selection: The wetland habitat is destroyed when buried under several feet
of fill so the stress is listed as “Habitat destruction”. None of the sources on the Illustrative List ofSources of Stress fit this threat situation very well so a new source of stress, “Dumping of fill” wasentered. Under the stated threat scenario, the “Dumping of fill” source of stress would be consideredan active source as long as some potential exists for additional dumping of fill during the next 10years. If all future dumping of fill is stopped, but some portion of the wetland area has been buriedunder fill, the “Dumping of fill” threat would change classification to a historical source. This historicalsource will continue to deliver stress to the filled wetland area until the fill is removed and the areais replanted with native wetland species.
Stress Ranking: Burial under several feet of fill is given a “Very High” Severity Rank and sincethe entire wetland area is threatened by filling, the stress also receives a “Very High” Scope Rank.
Source Ranking: The “Dumping of fill” source is the only identified source of the habitatdestruction so it receives a “Very High” Contribution rank. The stress caused by the fill is reversible,but the high cost of removing the fill warrants a “High” Irreversibility rank.
