deriving allowable properties of lumber the astm standards for establishing clear wood mechanical...
TRANSCRIPT


ABSTRACT
The ASTM standards for establishing clear wood mechanical properties and for deriving structural grades and related allowable properties for visually graded lumber can be confusing and difficult for the uninitiated to interpret. standards for individuals not familiar with their application. stress derivations are presented to supplement the text.
This report provides a practical guide to using these Sample

TABLE OF CONTENTS
Page
Introduction . . . . . . . . . . . . . . . . . . . . . . 1
Derivation of Allowable Properties . . . . . . . . . . . . . 2 Basic Clear Wood Mechanical Property Statistics
and Timber Volume Estimates . . . . . . . . . . . . Species Combinations and Weighting Factors. . . . . . Clear Wood Stresses . . . . . . . . . . . . . . . . . Clear Wood Property Summary . . . . . . . . . . . . . Allowable Unit Stresses for Clear,
Straight-Grained Lumber . . . . . . . . . . . . . . Allowable Unit Stresses for Lumber Grades . . . . . .
Bibliography . . . . . . . . . . . . . . . . . . . . . . .
Appendix A--Growing Stock Volume. . . . . . . . . . . . . .
Appendix B--A Computer Program for Calculating Exclusion Limit for a Combination of Species . . . . .
Appendix C--Development of Strength Ratio Factors and Strength Ratios for Grading Rules. . . . . .
-i-
3 3 5
10
10 13
17
18
21
27
PREFACE
Allowable properties are assigned to lumber to achieve proper recognition of structural capability and to provide for uniformity in design appli- cation. The long tradition of successful structural use of lumber in the United States is based on an orderly development of key national standards for both grading and assignment of properties to grades.
The assignment of properties to visually graded lumber follows precepts developed by technical personnel in lumber research and manufacture. Since 1927, these have been recorded as standards of the American Society for Testing and Materials (ASTM). The most common use of the standards is by grading agencies preparing grading rules and grade descriptions for approval under the American Lumber Standard (PS 20-70). The proce- dures have other users, however, including consultants, research labora- tories, and universities. While the lumber rules-writing agencies have extensive experience with these documents, the more uninitiated user often finds some frustration in the somewhat torturous path one must follow through the procedures. through the procedures in the sequence and manner in which these standards are commonly interpreted.
This report takes the user step by step
-ii-

DERIVING ALLOWABLE PROPERTIES OF LUMBER
(A Practical Guide for Interpretation of ASTM Standards)
ALAN BENDTSEN Forest Products Technologist and
WILLIAM L. GALLIGAN, Engineer
Forest Products Laboratory,1/ Forest Service U.S. Department of Agriculture
----
INTRODUCTION
The visual lumber grading system employed in the United States and Canada is based on two key ASTM Standards, ASTM D 2555-76, "Standard
Methods for Establishing Clear Wood Strength Values" ( 3 )– 2/ and ASTM D 245-74, "Standard Methods for Establishing Structural Grades and Related Allowable Properties for Visually Graded Lumber" ( 2 ). These standards function in sequence, with clear wood properties cataloged and grouped by D 2555 and the adjustments for design derived from D 245.
These ASTM standards are equally applicable to hardwoods and to softwoods, although they have been applied much more generally to softwoods. This report was prepared as a part of a cooperative effort with the National Bureau of Standards, in which hardwoods for trenching were the target. Consequently, the examples in this report employ hardwood data. I
In application of D 245 under American Lumber Standard PS 20-70 ( 7 ), lumber nominally 2 to 4 inches thick (termed "dimension") is governed by the National Grading Rule, a document that standardizes many features of lumber grading across the United States. followed uniformly between agencies is the minimum strength ratio in bending applicable to a grade. Strength ratios for other properties also are consistent because the National Grading Rule also specifies knots and other characteristics permitted in dimension lumber.
One feature that must be
1 / Maintained at Madison, Wis. in cooperation with the University of Wisconsin.
2 / Underlined numbers in parentheses refer to publications in the Bibliography near the end of this report.
By

It is recognized that this report does not cover all possible aspects of the derivation process. (In fact, the ASTM standards also fail to do that.) When these procedures become "institutionalized" through repeti- tive use by a lumber rules-writing agency, key decisions must be made that relate practical concerns for uniformity and standardization to the procedures permitted by ASTM. agencies for specific lumber grade-size combinations sometimes exceed those nominally assigned to a grade because the critical defect (for uniformity or efficiency) is more limiting (smaller) than required by the National Grading Rule (see appendix C).
There are no specific strength ratio requirements under PS 20-70 for sizes other than dimension. Consequently, a grade of timber (Beams and Stringers or Posts and Timbers) defined by one grading agency may differ slightly from that of another. In southern pine, for example, timber is graded uniformly along the length; by contrast, some western timber has particular restrictions on the middle third of the piece, corresponding to the presumed region of maximum bending moment in end use. Such differences are permitted under PS 20-70. Similar interpretations of ASTM standards are important, but all cannot be chronicled here. This report emphasizes standard procedures and interpretations.
For example, the strength ratios used by
DERIVATION OF ALLOWABLE PROPERTIES
Allowable properties for visually graded lumber are based on clear wood properties as cataloged in D 2555 ( 3 ). D 2555 also provides rules and procedures for developing clear wood properties of species grouped for marketing purposes. Once clear wood properties of a species or market group are established, the steps necessary for allowable property deriva- tion are found in D 245.
Several sample property derivations (tables 1-10) illustrate application of these standards. Yellow-poplar demonstrates the derivation of stresses for a single species; the "aspen" group demonstrates a combination (marketing group) where the composite dispersion factor (CDF) for the group is not limiting; the "maple" group illustrates a combination for which the CDF is controlling; and "cottonwood" illustrates a combination involving both a method A and a method B species. The aspen, maple, and cottonwood groupings are not intended as official marketing groups but were selected arbitrarily to illustrate various possible combination procedures.
2
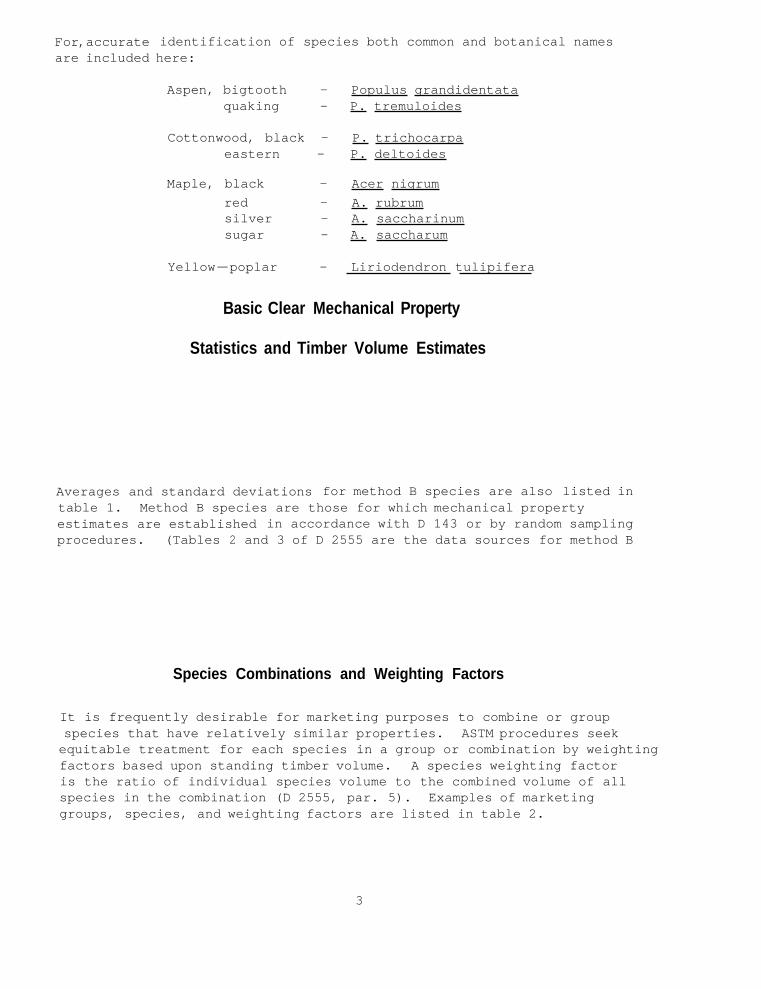
For ,accurate identification of species both common and botanical names are included here:
Averages and standard deviations for method B species are also listed in table 1. Method B species are those for which mechanical property estimates are established in accordance with D 143 or by random sampling procedures. (Tables 2 and 3 of D 2555 are the data sources for method B
Aspen, bigtooth - Populus grandidentata quaking - P. tremuloides
Cottonwood, black - P. trichocarpa eastern - P. deltoides
Maple, black - Acer nigrum red - A. rubrum silver - A. saccharinum sugar - A. saccharum
Yellow-poplar - Liriodendron tulipifera
Basic Clear Mechanical Property
Statistics and Timber Volume Estimates
Species Combinations and Weighting Factors
It is frequently desirable for marketing purposes to combine or group
equitable treatment for each species in a group or combination by weighting factors based upon standing timber volume. is the ratio of individual species volume to the combined volume of all species in the combination (D 2555, par. 5). Examples of marketing groups, species, and weighting factors are listed in table 2.
species that have relatively similar properties. ASTM procedures seek
A species weighting factor
3

Species
or
region
Cottonwood,
black
Aspen
Bigtooth
Quaking
Maple
Black
Red
Silver
Sugar
Yellow
- poplar
Cottonwood,
Eastern
Table
1.--Clear
wood m
echanical
property m
eans and
measurer of v
ariability a
nd ti
mber
vo
lume
Modulus
of r
upture
Var.
Standard
Aver
a ge
index
deviation
4,890
1.00
951
5,400
864
5,130
821
7,920
7,690
5,820
9,420
1,267
1,230
931
1,507
5,950
952
5,260
842
Campression
parallel
Modulus
of elasticity
Var.
Standard
index
deviation
1,083
1.00
197
1,120
246
860
189
1,328
1,386
943
1,546
292
305
207
340
1,222
269
1,013
223
METHOD A
SPECIES
2,200
1.00
METHOD B
SPECIES
2,500
2,140
3,270
3,280
2,490
4,020
2,660
2,280
360
450
385
589
590
448
724
479
410
Comp
ress
ion
perp
endi
cula
r Sh
ear
Stan
dard
in
dex
devi
atio
n Av
erag
e de
viat
ion
Average
Var.
St
anda
rd
612
1.00
92
732
102
656
92
1,128
1,151
1,053
1,465
158
161
147
205
792
111
682
95
165
46
206
58
181
51
601
168
405
113
369
103
645
181
269
75
196
55
Volu
me
Mill
ion
ft3 39
4
2,97
0 11
,093
1,80
1 6,
037
5.50
7 8,
566
6,75
3
1 / 5,0
00
1 / T
imber
volume estimates
for
eastern
cottonwood are
not
available.
A fictitious estimate is a
ssumed in
ord
er to
de
mons
trat
e sp
ecie
s co
mbin
atio
ns
and
property d
erivation
procedures in subsequent tables.
- - - - - - - - - - - - - - - - - - - - - - - - - - - - - - - - - - - - - - - - - - - - - - - - - - - - - - - - - - - - - - - - - - - - - - - - - - - - - - - - - - - - - - - - - - - - - - - - - - - - - - - - - - - - - - - -
2 2
2 Lb/in.
Lb/in.
Average
Var.
index
Standard
deviation
1,000
lb/in.
1,000
lb/in. 2
Average
Lb/in. 2
Lb/in. 2
Lb/in.
Lb/i
n.
2 2
Lb/i
n.
Lb/i
n.
2 2

Table 2.--Combinations and combination weighting fact or s
Combination Species Volume Weighting factor
Aspen Bigtooth 2,970 0.2112 Quaking 11,093 .7888
Maple Black 1,801 .0822 Red 6,037 .2755 Silver 5,507 .2513 Sugar 8,566 .3909
Eastern 5,000 .9270 Cottonwood Black 394 .0730
Clear Wood Stresses
This section shows how stresses are assigned for clear, unseasoned wood for individual species and for marketing groups. compression parallel to grain (C ||), and shear strength are near minimum property values (5 pct exclusion limits) ; compression perpendicular to grain (C|) and modulus of elasticity (E) are average values. Tables 3 to 6 summarize procedures for assigning c1ear wood stresses. Further application of procedures for assigning clear wood values to combina- tions as outlined below and in tables 3 to 6 are given in D 2555, 5.5.
Modulus of rupture,
Exclusion Limits
Exclusion limits (EL) for individual species are calculated as
where x - and s are estimates of species averages and standard deviations from table 1.
5
-------------------------------------------------------------------------------------- Million ft3

Table 3.--Assigned exclusion limits for modulus of rupture, 2 compression parallel, and shear (lb/in.)
Exclusion limit or CDF
Species or Species x VI s weighted CDF check Assigned combination exclusion value value
limit ------------------------------------------------------------------------------------------------------------------
MODULUS OF RUPTURE
Aspen
Maple
Yellow- poplar
Cottonwood
Aspen
Map le
Yellow- poplar
Cottonwood
Asper
Maple
Yellow- poplar
Cottonwood
Bigtooth 5,400 Quaking 5,130
3,814 1.84 NA 3,814 1.60 821
Black 7,920 1,267 2.33 2.22
931 4,963 .92 4,442 Red 7,690
Sugar 9,420 1,507 2.96
4,442
5,950 952 4,384 4,384
Black 4,890 1.00 951 3,820 1.13 3,768 3,768 Eastern 5,260 842 1.71
Bigtooth 2,500 Quaking 2,140
COMPRESSION PARALLEL
1,538 2.14 NA 450 1,538 1.56 385
Black 3,270 589 2.06 1,827 2.07 Red 3,280
Sugar 4,020 724 2.71 .97 1,827 2,056 Silver 2,490 448
2,660 479 1,872 1,872
1,606 Black 2,200 1.00 360 1.65 NA Eastern 2,280 410 1,6O6 1.64
SHEAR
512 Bigtooth 732 102 2.15 NA Quaking 656 92 512 1.56
Black 1,128 158 1.55 Red 1,151 161 1.67 Silver 1,053 147 1.16 835 Sugar 1,465 205 2.84
835
792 111 609 609
Black 612 1.00 92 1.02 503 503 Eastern 682 95
518 1.73
6
1,230 Silver
864
5,820
833
590
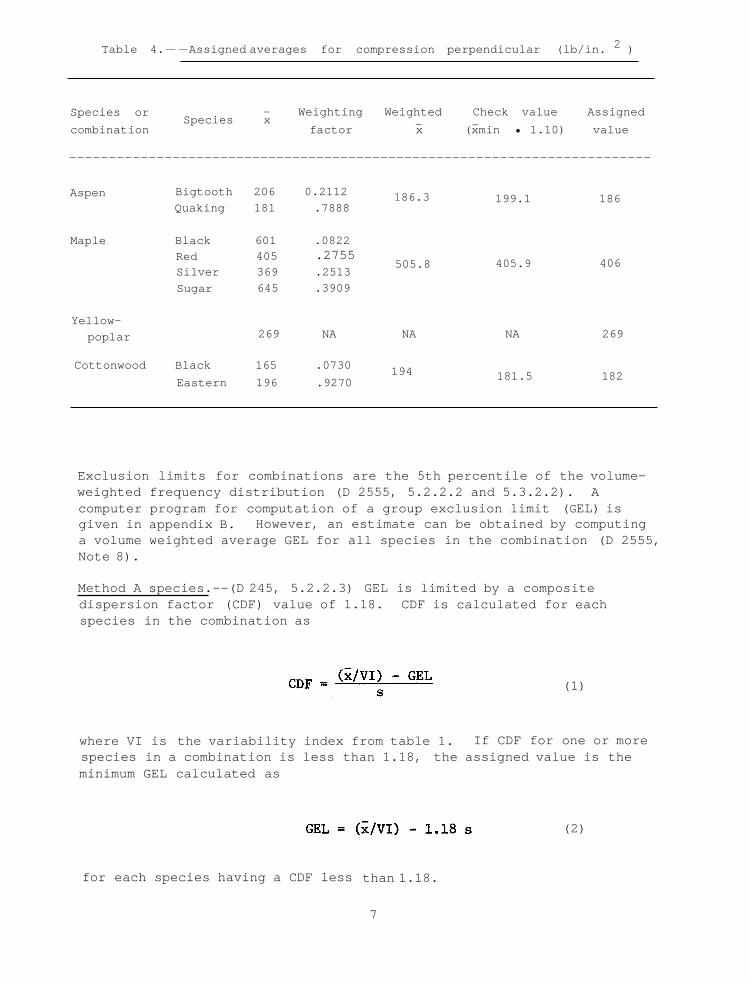
Table 4.--Assigned averages for compression perpendicular (lb/in. 2 )
- Weighting Weighted Check value Assigned Species or combination factor x (xmin • 1.10) value
Species x
Aspen Bigtooth 206 0.2112 186.3 Quaking 181 .7888
Maple Black 601 .0822
505.8 Red 405 Silver 369 .2513 Sugar 645 .3909
Yellow- poplar
199.1
405.9
186
406
269 NA NA NA 269
181.5 182 Cottonwood Black 165 .0730 194
Eastern 196 .9270
Exclusion limits for combinations are the 5th percentile of the volume- weighted frequency distribution (D 2555, 5.2.2.2 and 5.3.2.2). A computer program for computation of a group exclusion limit (GEL) is given in appendix B. a volume weighted average GEL for all species in the combination (D 2555, Note 8).
However, an estimate can be obtained by computing
Method A species.--(D 245, 5.2.2.3) GEL is limited by a composite dispersion factor (CDF) value of 1.18. CDF is calculated for each species in the combination as
(1)
where VI is the variability index from table 1. species in a combination is less than 1.18, the assigned value is the minimum GEL calculated as
If CDF for one or more
for each species having a CDF less than 1.18.
7
- -
-------------------------------------------------------------------------
.2755
(2)

Table 5.--Assigned averages for modulus of elasticity (1,000 lb/in.2)
Method A Method B Species or Species - Weighting Weighted VI x/VImin check check Assigned combination factor x (1.16 • x/VImin) (xmin • 1.10) value
Aspen Bigtooth 1,120 0.2112 914.9 Quaking 860 .7888
Maple Black 1,328 .0822 Red 1,386 .2775 Silver 943 .2513 1,335.1 Sugar 1,546 .3909
Yellow- poplar 1,222
915 946.0
1,037 1,037.3
1,222
1,018 Cottonwood Black 1,083 .0730 1,018 1.00 1,083 1,256 Eastern 1,013 .9270 1,114
1 / Table 6.--A sample property derivation (E) when D 2555 tables A1 and A2 ratios are limiting
Allowable unit
2/ factor x19 or x15 B check value clear lumber 3 /
Species - or Green x Seasoning x19 or Weighting - Method Assigned stress for x 15 factor- combination
----------------------------------------------------------------------------- 1,000 1,000 1,000 1,000 1,000 1,000
lb/in. 2 lb/in.2 lb/in.2 lb/in.2 lb/in.2 2 lb/in.
19 PERCENT MC
Black 1,328 1.14 1,514 0.0822
Red 1,386 1.133 1,570 .2755
Silver 94 3 1.14 1,075 .2513 1,182
Sugar 1,546 1.126 1,741 .3909
1,508 1,182
15 PERCENT MC
1,257
Black 1,328 1.20 1,594 .0822
Red 1,386 1.19 1,649 .2755
Silver 943 1.20 1,132 .2513 1,245
Sugar 1,546 1.18 1,824 .3909
1,582 1,245 1,324
1 / This table applies only to modulus of elasticity because it is the lone instance in this paper where D 2555 table A1 or A2 ratios are limiting. upon whether method A or B species are used or which mechanical property is involved.
The format of the table will vary depending
2 / The factor for 15 pct MC is the dry/green ratio (D 2555, table A-1) limited by the seasoning factor (D 245, table 11); for 19 pct MC the factor is calculated from the 15 pct MC factor according to D 245, 7.1.2 and is also limited by the seasoning factor (D 245, table 11).
3 / Assigned value ÷ 0.94. Enter in table 8.
8
--------------------------------------------------------------------------------------------------
x - -
- -
- Weighted - -

Method B species.--(D 245, 5.3.2.3) GEL is limited by a CDF value of 1.48. CDF is calculated for each species in the combination as
(3)
If CDF for one or more species in a combination is less than 1.48, the assigned value is the minimum GEL calculated as
(4)
for each species having a CDF less than 1.48.
Both A and B species.--CDF limits are applied to method A species as per equations (1) and (2); to method B species as per equations (3) and (4). If CDF limitations are involved, the lowest result of equations (2) and (4) is assumed for GEL (D 2555, 5.4.2.1).
Mean Values
C| and E values for combinations are volume-weighted averages calculated as
where
= x = volume-weighted average for a combination,
n = number of species in the combination, and
R = ratio of the volume of the ith species to the combined volume of all species in the combination (D 2555, 5.2.1, 5.3.1, and 5.4.1)
- x = average C| or E value of the ith species.
Method A species.--Assigned E values may not exceed the minimum
quantity, 1.16 (x/VI), calculated for each species (D 2555, 5.2.1.1, 5.2.2). C| is limited as for method B species.
9
–
(5)
–
-
–
Method B species.--The assigned C| and E values may not exceed
the minimum quantity, 1.10 x, in the combination (D 2555, 5.3.1.1).
Both A and B species.--For combinations containing both method A and method B species, the limitations of method A and method B are applied as appropriate.
Nonvolume Species
A species for which no volume estimates are available may be included in a combination. excluding the "nonvolume" species and for the "nonvolume" species as an individual. the combination values, the combination values are assumed. If not, the assigned values for the "nonvolume" species are assumed for the combination.
Assigned values are determined for the combination
If the assigned values for the "nonvolume" species exceed
Clear Wood Property Summary
Table 7 summarizes the clear wood property assignments for individual species and marketing combinations as derived in tables 3 to 6. of rupture values are assumed for clear wood tension values.
Modulus
Allowable Unit Stresses for Clear, Straight-Grained Lumber
Allowable unit stresses for clear straight-grained lumber are derived from the clear wood values in table 7 by adjustment factors and modifica- tions for seasoning effects and density (in our examples, modification
Fb for density is not applicable). values apply to lumber 2 inches wide only.
3/ The result is shown in table 8.-
Adjustment Factors (D 245, 6.2, 6.2.1, and table 9)
Fb, Ft, Fc, and Fv adjustment factors include a factor for normal
duration of load and a factor of safety.
The factor for E adjusts for span-depth ratio from 14 to 21 and from concentrated centerpoint loading to uniform loading.
3 / Allowable properties are symbolized by the notation Fb for
for compression parallel, F for shear,
for compression perpepdicular, and E for modulus of elasticity.
bending, Ft for tension, F C v F C|
10
– -
–

lb/in.2
Aspen 3,814 1,538 512 186 915
Map le 4 , 442 1,827 835 406 1,037
Yellow-poplar 4,384 1,872 609 269 1,222
Cottonwood 3,768 1,606 503 182 1,018
The factor for F
and a factor of safety.
includes adjustment for average ring position C|
F is derived as 0.55 Fb. (D 245, 4.2.5) t
Seasoning Modifications (D 245, table 11)
Table 8 contains unseasoned values which apply to lumber of all dimensions, except for Fb values which apply to 2-inch depth only.
Allowable stresses, reflecting increases for 19 and 15 percent maximum moisture content in use, are also given in table 8. seasoning are limited by the Dry/Green clear wood property ratios in D 2555, tables A1 and A2.
These increases for
Provisions for handling seasoning increases for instances where D 2555 ratios are limiting are given in D 245 (7.1.2) when stresses for a single species are being derived.
D 245 does not provide direction for handling seasoning increases when the D 2555 ratios are limiting for one or more species in a combination, However, the American Lumber Standards Committee (ALSC) Board of Review has approved a procedure that performs seasoning adjustments prior to forming a combination (WWPA Grading Rule, 3rd Edition effective July 1, 1974 ( 8 )). Seasoning adjustments are made to the averages and standard deviations tabulated in table 1 for all species in the combination. For individual species or properties controlled by D 2555 ratios (tables A1 and A2), the adjustments are as per D 245 (7.1.2); other adjustments are as normal (D 245, table ll), except that the seasoning factor is applied to both the average and standard deviation. Using the adjusted values,
11
-------------------------------------------------------------
Table 7.--Clear wood values summary
Species or
combination
Modulus of
rupture
C|| Shear C| Modulus of
elasticity
–
Lb/in.2 Lb/in.2 lb/in.2 Lb/in.2 1,000
–

1 / Table 8.--Allowable unit stresses for clear straight-grained lumber
Aspen 1,658 Maple 1,931 Yellow-poplar 1,906 Cottonwood 1,638
Aspen 2,072 Maple 2,414 Yellow-poplar 2,382 Cottonwood 2,048
Aspen 2,238 Maple 2,607 Yellow-poplar 2,573 Cottonwood 2,211
UNSEASONED
9 12 732 114 1,062 870 186 1,048 891 135 901 765 112
19 PERCENT MAXIMUM MC
1,140 1,098 12 3
1,310 1,336 146 1,328 1,305 201
1,126 1,148 121
15 PERCENT MAXIMUM MC
1,231 1,281 129
1,415 1,559 152 1,216 1,339 12 7
1,434 1,522 210
124 271 179 121
186 406 268 182
186 406 268 182
FOR SEASONED MATERIAL THICKER THAN 4 IN. 3 /
Aspen Maple Yellow-poplar Cottonwood
805 957 980 842
lb/in.2
973 1,103 1,300 1,083
1,109 2 / 1,257 1,482 1,235
1,168 2 / 1 , 324 1,560 1,300
992 1,125 1,326 1,105
1 / F values apply to 2-inch depth only. b
12
--------------------------------------------------------------------
Species or
combination
1 / F b F t
F C F
v F C| E
–
Lb/in.2 Lb/in.2 Lb/in.2 Lb/in.2 Lb/in.2 1,000
2 / Limited by dry-green ratio (table 6). 3 / F b , F t , F v , and F C| are the same as for unseasoned. –
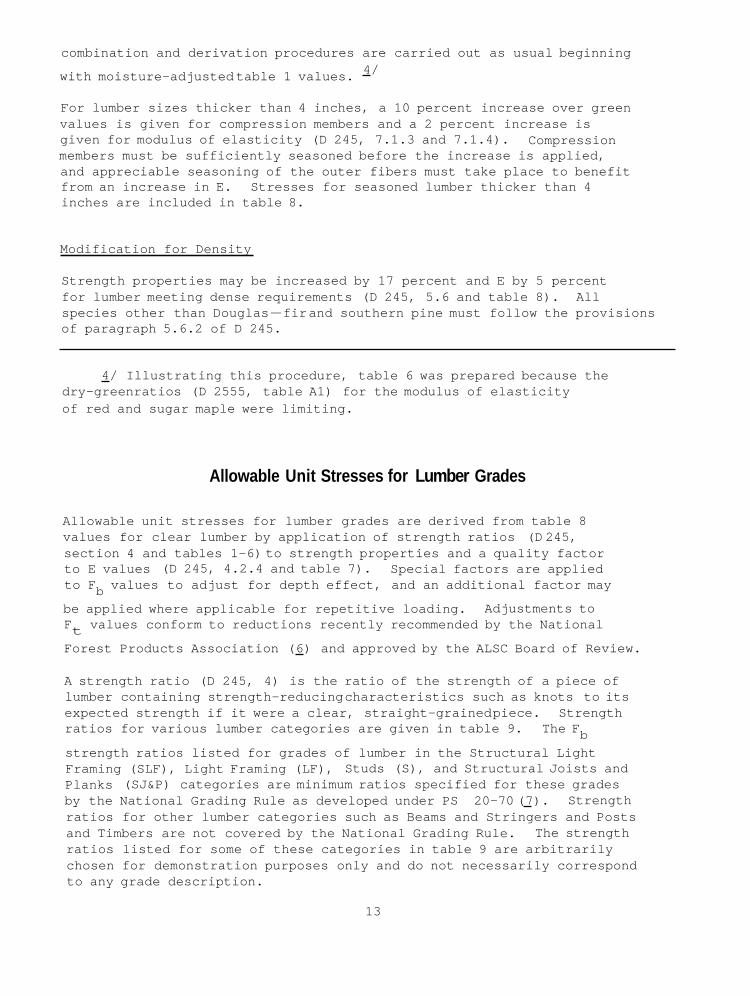
combination and derivation procedures are carried out as usual beginning 4 / with moisture-adjusted table 1 values.
For lumber sizes thicker than 4 inches, a 10 percent increase over green values is given for compression members and a 2 percent increase is given for modulus of elasticity (D 245, 7.1.3 and 7.1.4). members must be sufficiently seasoned before the increase is applied, and appreciable seasoning of the outer fibers must take place to benefit from an increase in E. Stresses for seasoned lumber thicker than 4 inches are included in table 8.
Compression
Modification for Density
Strength properties may be increased by 17 percent and E by 5 percent for lumber meeting dense requirements (D 245, 5.6 and table 8). All species other than Douglas-fir and southern pine must follow the provisions of paragraph 5.6.2 of D 245.
4 / Illustrating this procedure, table 6 was prepared because the dry-green ratios (D 2555, table A1) for the modulus of elasticity of red and sugar maple were limiting.
Allowable Unit Stresses for Lumber Grades
Allowable unit stresses for lumber grades are derived from table 8 values for clear lumber by application of strength ratios (D 245, section 4 and tables 1-6) to strength properties and a quality factor to E values (D 245, 4.2.4 and table 7). to Fb values to adjust for depth effect, and an additional factor may
be applied where applicable for repetitive loading. Ft values conform to reductions recently recommended by the National
Forest Products Association ( 6 ) and approved by the ALSC Board of Review.
Special factors are applied
Adjustments to
A strength ratio (D 245, 4) is the ratio of the strength of a piece of lumber containing strength-reducing characteristics such as knots to its expected strength if it were a clear, straight-grained piece. Strength ratios for various lumber categories are given in table 9.
strength ratios listed for grades of lumber in the Structural Light Framing (SLF), Light Framing (LF), Studs (S), and Structural Joists and Planks (SJ&P) categories are minimum ratios specified for these grades by the National Grading Rule as developed under PS 20-70 ( 7 ). Strength ratios for other lumber categories such as Beams and Stringers and Posts and Timbers are not covered by the National Grading Rule. The strength ratios listed for some of these categories in table 9 are arbitrarily chosen for demonstration purposes only and do not necessarily correspond to any grade description.
The Fb
13

Table 9 also lists quality factors to be applied to modulus of elasticity values, The quality factors are related to F strength ratios (D 245, 4.2.4, table 7). b
An example of stress-grade development comparable to the derivations outlined in tables 7 to 10 is given in D 245, 8 and table 13.
Size effect.--Fb values are adjusted for size effect by a multiplication
factor (2/d) 1/9 , where d is the net surfaced depth or width (D 245, 6.3.1). is commonly applied to members 5 to 12 inches in nominal width and a 3.5-inch depth factor (0.9397) is applied to nominal widths 4 inches and less in SLF and LP categories. only), we have assumed a 20-inch depth factor (0.7743) for grades of Beams and Stringers and Posts and Timbers for actual widths (depth) greater than 12 inches and 12-inch depth factor (0.8195) for nominal widths 12 inches and smaller.
For simplicity, a 11.25-inch depth adjustment factor (0.8254)
In this report (for demonstration
Strength ratio factor.--Rules-writing agencies commonly combine the depth adjustment with F
as a strength ratio factor (SRF). For consistency and simplicity a minimum SRF is applied to all sizes in a grade. Refer to appendix C for additional detail concerning SRF.
strength ratios and refer to the combination b
Contiguous members.--An increase in Fb of 15 percent is recommended
for design consideration for contiguous members because member inter- action provides greater load-carrying capacity than expected from predicted individual member performance (D 245, 7.8.1).
Lumber grades.--Allowable unit stresses for lumber grades (table 10) are obtained by application of strength ratios and other adjustments given in table 9 to clear lumber values given in table 8.
Rounding.--For publication, allowable unit stresses are rounded as per D 245, 6.1.1. Rounded values are included in table 10.
14

Table 9.--Strength ratios, quality factors. and special adjustments
Strength ratios Quality factor F t F 1 /, 2 /
E 4 / ratio ratio reduction
Category Grade Strength Depth
3 / Strength Special F C F
v F C|
Structural Select structural 67 x 0.9397 light No. 1 55 x .9397 framing No. 2 45 x .9397
No. 3 26 x .9397
Light Construction 34 x .9397 framing Standard 19 x .9397
Utility 9 x .9397
67 55 45 26
34 19 9
78 50 100 62 50 100 49 50 100 30 50 100
56 50 100 46 50 100 30 50 100
Studs Studs (2-4 in. wide) .9397
Studs (5-6 in. wide) .8937 26 x 26
0.80 30 50 100
Structural Select structural 65 x .8254 joists No. 1 55 x .8254 and No. 2 45 x .8254 planks No. 3 26 x .8254
5 / Beams and Strength ratio 86 86 x stringers Strength ratio 72 72 x .8195
Select structural 65 x .7743 No. 1 55 x
Posts and Strength ratio 86 86 5 / x
timbers Strength ratio 72 72 x .8195 Select structural 65 x .7743
No. 1 55 x
65 1.00 55 1.00 45 .80 26 .80
86 NA 72 NA 65 NA 55 NA
86 NA 72 NA 65 NA 55 NA
69 50 100 62 50 100 52 50 100 33 50 100
90 50 100 80 50 100 75 50 100 62 50 100
90 50 100 80 50 100 75 50 100 62 50 100
100 100 90 80
80 80 80
80
100 100 90 80
100 100 100 100
100 100 100 100
1 / For multiple member use, see "Allowable Unit Stresses for Lumber Grades." 2 / The strength ratios shown are the minimum ratios specified by the Natural Grading Rule for each
grade category; the depth factor reflects adjustment for maximum width. deviates from this simplified presentation (see appendix C).
Where a factor is given, it applies to 5- and 6-in. nominal widths only. For 8-in. width, the factors are 0.90 for select structural, 0.80 for No. 1, and 0.64 for Nos. 2 and 3. For 10-in. and wider, use 0.80 for select structural, 0.60 for No, 1, and 0.48 for Nos. 2 and 3.
Actual practice most commonly
3 / These depth adjustments assume dry ALS sizes, except as noted. 4 / No adjustment required for 2- to 4-in. width.
5 / 0.8195 applies to actual widths 12 in. and less; 0.7743 applies to actual widths 12 to 20 in.
-------------------------------------------------------------------------------
15
b
–

Table 10.--Sample allowable unit stresses: Beam and stringers category; Select Structural
grade; members greater than 12-inch nominal width 1 /
F E F b
F t C F v
Aspen 834 825 Maple 972 975 Yellow-poplar 959 950 Cottonwood 824 825
Aspen 834 825 Maple 972 975 Yellow-poplar 959 950 Cottonwood 824 825
2 Lb/in.
593 600 690 700 681 675 586 575
593 600 690 700 681 675 586 575
UNSEASONED
549 550 57 55 652 650 93 95 668 675 68 70 574 575 56 55
SEASONED 2/
604 600 57 55 718 725 93 95 735 725 68 70 632 625 56 55
2 Lb/ in.
124 125 271 270 179 180 121 120
124 125 271 270 179 180 121 120
2 1,000 Lb/in.
lb/in. 2
973 1,000,000 1,103 1,100,000 1,300 1,300,000 1,083 1,100,000
992 1,000,000 1,125 1,100,000 1,326 1,300,000 1,105 1,100,000
1 / The first column for each property is unrounded.
2 / D 245, 7.1.3 and 7.1.4.
The second is rounded according to D 245; 6.1.1.
16
-----------------------------------------------------------------------------
Lb/in. 2
Lb/in. 2
Lb/in. 2
F C| –

BIBLIOGRAPHY
17

APPENDIX A--GROWING STOCK VOLUME
Timber growing stock volume data are used as weighting factors in the derivation of allowable design properties for marketing combinations consisting of two or more species. Volume data for many species are presented in D 2555, tables 4 and 5. those in the tables are used in structural applications. Volume data for additional species was obtained from Resources Evaluation, Forest Service, U.S. Department of Agriculture, by species and State where available. This information is summarized in table A-1 by four major geographic regions: North Central, Northeast, Southeast, and Midsouth. The States or portions of States in each region are as follows:
North Central -- Illinois, Indiana, Iowa, Kentucky, Michigan, Minnesota, Missouri, and Wisconsin.
But timber of species other than
Northeast -- Connecticut, Delaware, Maine, Massachusetts, New Hampshire, New Jersey, New York, Ohio, Pennsylvania, Rhode Island, Vermont, and West Virginia.
Southeast -- Florida, Georgia, North Carolina, South Carolina, and Virginia .
Midsouth -- Alabama, Arkansas, Louisiana, Mississippi, East Oklahoma, Tennessee, and East Texas.
For many of the species listed in table A-1, volume data have not yet been tabulated by Resources Evaluation in every region. species, total species volume estimates are not listed. Nevertheless, the data should still be useful for making combinations within a region or between two or more regions. For example, there may be interest in developing design properties for a combination of all red oaks, all white oaks, or all oaks in the Midsouth region, the Southeast region, or the two regions combined.
The volume estimates in table A-1 should not be considered official in the context of National timber inventories normally published by Resources Evaluation of the Forest Service. in the data, we believe they are sufficiently accurate for use as weighting factors for developing species combinations.
These discrepancies exist because the data received from Resources Evaluation contained volume estimates for an "Other Hardwoods" category in each major region. If the volume was not tabulated for a particular species in a region, we could not be certain whether the region contained no volume for that species or whether the species was included in the "Other Hardwoods" category. However, a species included in this category is likely to be of minor importance (low volume) in the region. Also, a volume estimate mag contain more than one species; e.g., "basswoodf" estimates may contain American and white basswood.
Thus, for these
Although there may be small discrepancies
In this case,
18

however, white basswood most likely does not make a significant contri- bution to the total basswood volume. ably also apply where other species estimates are combined.
A similar conclusion would prob-
Table A-1.--Growing stock volume for certain hardwood species by major geographic regions (million ft 3 )
Species North North- Mid- South- Total central east south east
---------------------------------------------------------------------
Ash (Fraxinus) : Green (F. pennsylvanica) 1 / - White (F. americana) -
Balsam poplar (Populus balsami f era) 637
Basswood (Tilia sp.) 1,606
Birch (Betula) : Gray (B. populifolia) ---
River (B. nigra) 95
Boxelder (Acer negrundo) 20
Paper (B. papyrifera) 2,114
Cherry (Prunus sp.) 331
Cottonwood, eastern (Populus deltoides) 457
Cucumber (Magnolia acuminata) 1
Elm (Ulmus): American (U. americana) - Rock (U. thomasii) - Slippery (U. rubra)
Holly (Ilex opaca) ---
Locust: Black locust (Robinia
Honeylocust (Gleditsia psuedoacacia) 92
triacanthos) 30
- -
-
995
10 1,658
21
-
2,404
-
125
- - -
3
365
---
1,282 575
2 / ---
164
--- --- 160
193
-
472
49
884 4
161
118
15 3
136
-
2,771
10 3,773
275
-
256
931
178
1 of 2)
19
-
- - - -
---
202
--- --- ---
25 -
118 -
91
81
- - - - - -
68 189
321
12
(Page
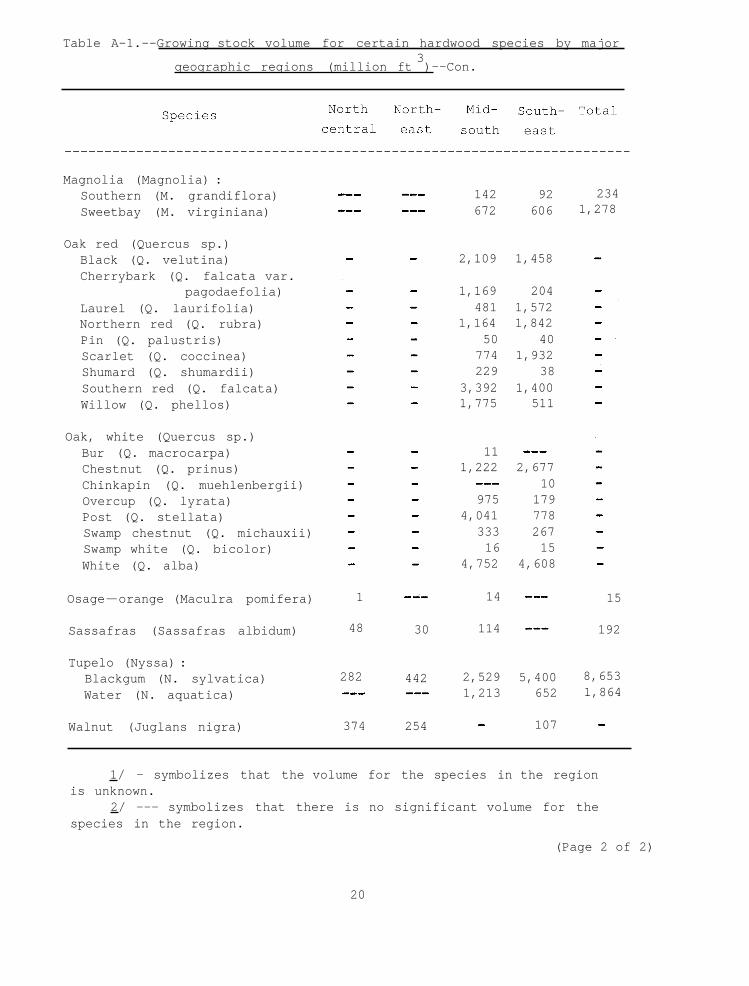
Table A-1.--Growing stock volume for certain hardwood species by major 3
geographic regions (million ft )--Con.
Magnolia (Magnolia) : Southern (M. grandiflora) Sweetbay (M. virginiana)
Oak red (Quercus sp.) Black (Q. velutina) Cherrybark (Q. falcata var.
Laurel (Q. laurifolia) Northern red (Q. rubra) Pin (Q. palustris) Scarlet (Q. coccinea) Shumard (Q. shumardii) Southern red (Q. falcata) Willow (Q. phellos)
pagodaefolia)
Oak, white (Quercus sp.) Bur (Q. macrocarpa) Chestnut (Q. prinus) Chinkapin (Q. muehlenbergii) Overcup (Q. lyrata) Post (Q. stellata) Swamp chestnut (Q. michauxii) Swamp white (Q. bicolor) White (Q. alba)
Osage-orange (Maculra pomifera)
Sassafras (Sassafras albidum)
Tupelo (Nyssa) : Blackgum (N. sylvatica) Water (N. aquatica)
Walnut (Juglans nigra)
142 92 672 606
2,109 1,458
1,169 204 481 1,572
1,164 1,842 50 40
774 1,932 229 38
3,392 1,400 1,775 511
11 1,222 2,677
10 975 179
4,041 778 333 267 16 15
4,752 4,608
14
114
2,529 5,400 1,213 652
107
1 / - symbolizes that the volume for the species in the region
2 / --- symbolizes that there is no significant volume for the is unknown.
species in the region.
(Page 2 of 2)
20
234 1,278
30
442
254 374
282
48
1 15
192
8,653 1,864

APPENDIX B--A COMPUTER PROGRAM FOR CALCULATING
EXCLUSION LIMIT FOR A COMBINATION OF SPECIES
ASTM D 2555, Section 5.2.2.2 and others, require calculation of a 5 percent exclusion limit for modulus of rupture, maximum crushing strength parallel to grain, and shear by adding the areas under volume-weighted frequency distributions of each species at success-ively higher levels of strength until a value is obtained below which 5 percent of the area under the combined frequency distribution will fall.
This appendix presents a computer program for calculating the 5 percent exclusion limit for three mechanical properties. in Fortran V and has been executed on the Univac 1110. It should be easily adaptable to other computers.
The program is written
Numerical Procedure
The frequency distribution of a mechanical property for a combination of species is, in general, a heterogeneous distribution. The numerical procedure assumes the heterogeneous distribution is made up of two or more component normal distributions, having sample estimates of the property mean and standard deviations as listed in table 1, with each component distribution weighted according to the volume estimates in that table. These normal distributions overlap one another, and a value of the property is sought such that 95 percent of the wood in the entire combination will exceed it.
The property axis of the combined frequency distribution is subdivided into a set of uniform classes of width ( w ). Each component normal frequency distribution is integrated from -∞ to an upper class limit (x i ) selected to be below the exclusion limit of the heterogeneous
distribution. These integration results are weighted to reflect the timber volume of the species represented by each component distribution. Successive classes are then integrated, the results weighted and accumulatively summed until the summation exceeds 0.05. integrated contains the 5 percent exclusion limit, which is then obtained by straightline interpolation between sumnations of inte- grations to the lower and upper limits of the last class.
For successful operation of the program, x
exclusion limit of the combined distribution. accurate interpolation of the exclusion limit in the last class. Arbitrarily chosen dimensionless factors are entered as input: to calculate
x and w as a proportion of the lowest species property average (x) in
the combination.
The last class
must be below the 5 percent i Also, w must be small for
i We have found factors of 0.5 and 0.005 appropriate
21
– –

for calculating x i
Additional details concerning the numerical procedures can be obtained from the Forest Products Laboratory.
Program Input
There are two kinds of card inputs: (1) Species statistics and (2) factors for calculating x i and w . Type (1) cards each describe one
species and are limited a set of cards for four species and the type (2) card.
statistics card includes estimates of the mean ( x ) and standard deviation ( s ) for modulus of rupture, maximum crushing strength parallel to grain, and shear; a volume estimate; and any convenient species designation code.
50 in number. Figure B-1 is an example of A species
Figure B -1. --Sample input cards
22
and w , respecitvely.
-

Program Output
The program output shown in table B-1 is self-explanatory.
Table B-1.--Program output
Combined Species Average Standard Exclusion Relative exclusion
property deviation limit weight limit
MODULUS OF RUPTURE
1 7920. 1267. 5836. .0822 2 7 690 . 3 5820.
1230. 931 . 4963. 5667. .2755
4289. .2513 4 9420. 1507. 6941. .3909
COMPRESSION PARALLEL
1 3270. 589. 2301. .0822 2 3280. 3 2490.
590. 448. 2056. 2309. .2755
1753. .2513 4 4020 . 724. 2829. .3909
SHEAR
1 1128. 158. 868. .0822 2 1151. 3 1053.
161. 147.
886. .2755 811. .2513
4 1465. 205. 1128. .3909
883.
23
------------------------------------------------------------
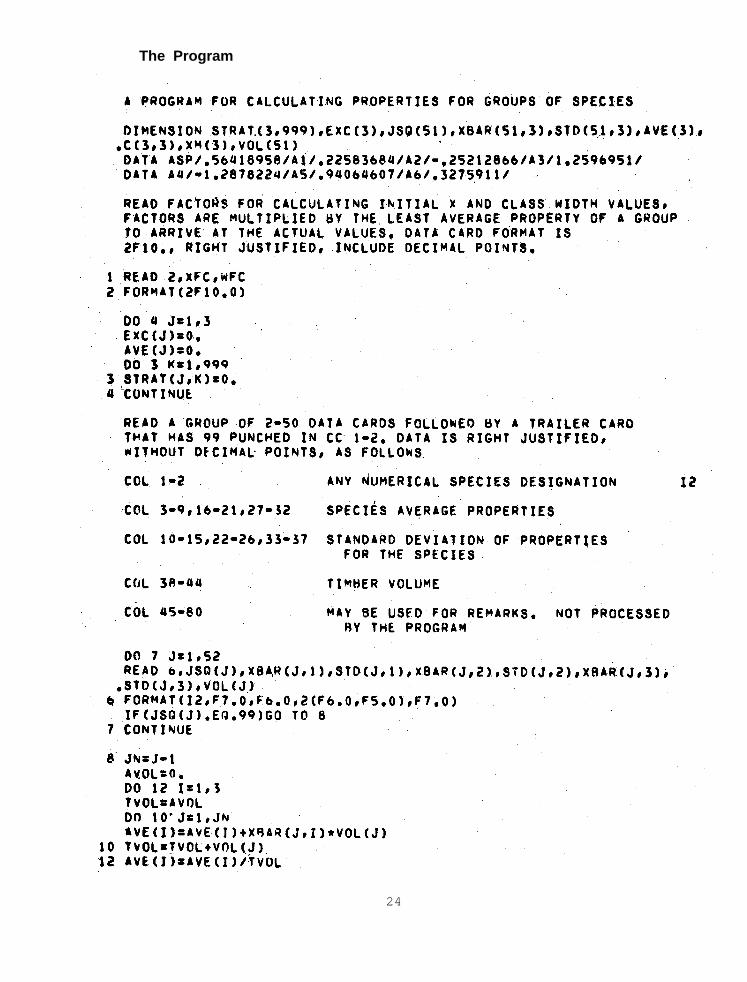
The Program
24

25
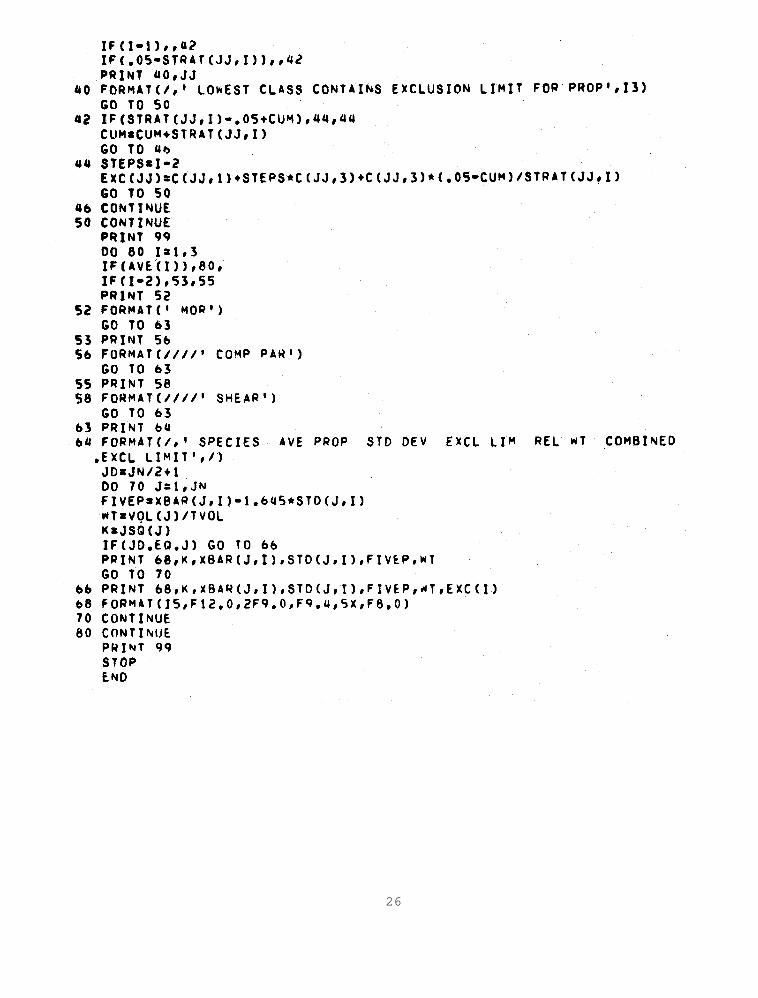
26

APPENDIX C--DEVELOPMENT OF STRENGTH RATIO FACTORS
AND STRENGTH RATIOS FOR GRADING RULES
Strength Ratio Factor
Allowable design properties for structural lumber grades are derived from clear wood lumber properties through application of strength ratios (SR). Fb SR for each lumber grade.
Planks lumber category, the minimum acceptable F SR's for various grades
are Select Structural, 65 percent; No. 1, 55 percent; No. 2, 45 percent; and No. 3, 26 percent. Grade descriptions are written which detail the maximum permissible defects, staying within limitations defined by these minimum F strength ratios. Strength ratios for other properties commonly
are controlled by the defect limitations pertaining to F
The Fb SR of a grade may exceed the minimum acceptable SR, depending
upon the SR associated with critical or limiting defects in the grade description. The SR may also vary between sizes within a grade, again depending upon the limiting defect of the grade description.
Basic to this derivation is the concept of a minimum acceptable For example, in the Structural Joists and
b
b
b .
For simplicity in derivation procedures and for consistency in allowable properties between sizes within a grade, a minimum F strength ratio
factor (SRF) is commonly applied to all sizes within a grade. The SRF is the product of the SR corresponding to the limiting defect for a size
and grade and the depth factor 5 / for each size. all sizes in a grade to determine the minimum value. An example is shown in table C-1 for No. 2 Joists and Planks:
b
The SRF is calculated for
The minimum or controlling SRF is 0.3771 (14-in. nominal width and 4-1/8 knot) which is applied to clear lumber stresses to obtain Fb for these widths of No. 2 grade. It is noted that only edge knots
are shown in this sample SRF derivation for F because knots in other
locations (centerline and narrow face knots) are less critical for this particular grade description.
b
5 / Reference ( 2 ), paragraph 6.3.1.
27

Strength Ratios
The SRF applies only to Fb because depth adjustment (D 245 6.3.1) is
not required for other properties. Rather, a minimum SR is determined for F t and F which is applied to all
defect for F t is frequently the same as
the 4-1/8-inch edge knot in combination width is limiting for Fb (SRF = 0.3771)
(10 in. width) is limiting for F t (SR =
most commonly the critical defect in F C and F t for a grade are determined by con
C|| sizes in a grade.
for Fb.
with depth adjustment for 14 inch while the 3-1/4-inch edge knot
0.4502). Centerline knots are
The critical
In table C-1, however,
C|| . The minimum SR for F
structing tables similar to table C-1
showing the SR's for limiting defects for all widths in the lumber category.
An SR of 50 percent is commonly assigned to Fv for most grades and
sizes although higher values may be permitted depending on shake and split limitations.
100 percent strength ratio is assigned to all grades.
F C| is assumed to be grade independent, and a
28 3.5-33-9-78
– –
|| – – – –
–

Table C-1.--Example of calculating SRF for No. 2 Joists and Planks
5 1-5/8 Edge 0.4559 0.9138 0.4166
6 1-7/8 Edge .4733 .8937 .4230
8 2-1/2 Edge .4662 .8667 .4041
10 3-1/4 Edge .4502 .8435 .3797
12 3-3/4 Edge .4684 .8254 .3866
14 4-1/8 Edge .4653 .8105 .3771
SRF for 1:8 slope of grain is 0.53 x 0.8105 = 0.4296.
U.S. GOVERNMENT PRINTING OFFICE: 1976-750126/20 29
--------------------------------------------------- In. In.
Nominal Knot width size
Knot SR location factor
Depth SRF
