deputation report of training opd two new spurt cars · (v) sh. rs. bharti, sre/engg./tm 8.0 the...
TRANSCRIPT

,/. -
..........
GOVERNMENT OF INDIA MINISTRY OF RAILWAYS ....._.
DEPUTATION REPORT OF TRAINING OPd TWO NEW SPURT
CARS AT
MIS Scan Masters Systems (IRT) 5 Hanagar Street,
Neve Nemanb, HOD Hasharon-458000, Israel
and DB Germany
From 13.02.05 to 04.03.05
Report No. TM-86
June 2005
Track Machine & Monitoring Directorate Research Designs & Standards Organisation
Lucknow

Page No. S.N.
1. 1 1 1.2 1.3 1.4 1.5
Topic
2. 2.1 2.2
Introduction Basic Principle of USFD System Overview System Operating Concepts SFB-100/NT-hardware overview SW Modules
3. 3.1 3.2 3.3
1-24 1 2 2 12 18
Initialisation of System Starting of System Basic troubleshooting Procedures
4. Processing 35-39 4.1 Overview 3 5
25-27 25 26
Scanning Overview Scan Procedures Client-Scan Screen
4.2 4.3 4.4 4.4
7. I Visit to High Speed SPURT Car in German Rly. 1 50-54
28-34 28 28 34
ScanDat, Process Screen La S w
5. 5.1 5.2 5.3 5.4
Scan Data Operations Process Screen Layout Search & Identify
35 3 7 3 8
Setup Overview US Channel Setup Setup of Scan Plans US Files
40-44 40 40 41 42

6.0 Shri Sandeep Kumar, JRE-IIITM declined to give the requisite bond before proceeding for foreign deputation and therefore, did not visit Israel for the training.
7.0 Out of the total team of 8 officials who proceeded for training the following team of 5 officials also camed out the inspection ofthe Ultrasonic system in Israel.
(i) Sh. Pradeep Kumar GargDirectorEM '(ii) Sh. Delip Kumar, Section Engineer/Engg./TM (iii) Sh. S.Bhattacharya, Section Engineer/Engg./TM (iv) Sh. Ranjeet Singh, J R E m (v) Sh. RS. Bharti, SRE/Engg./TM
8.0 The details of the training imparted by the firm is enclosed in the deputation report. The details of the inspection of ultrasonic system carried out by RDSO officials has been issued separately.

DEPUTATION REPORT
Training for operation and inspection of two high speed self propelled ultrasonic rail testing cars kom MIS ScanMaster System (IRT), Israel.
1.0 The work of procurement of two high speed self propelled ultrasonic rail testing cars was included in the works programme 1998 - 1999 and 1999 - 2000 at a cost of Rs.17.89 crore and 16.62 crore respectively.
2.0 Global tenders were floated for procurement of the cars by two packet system and purchase order was placed on M/s ScanMaster, Israel vide P.O. No.SP3/0001RM/GT/99-20011145 dated 19.12.2003.
3.0 As per clause 1.19.1 of the technical specifications of the system being part of the contract, M/s ScanMaster, Israel was to provide training at their premises in operation and maintenance of the system. The firm was also required to arrange visit and impart training on the railway system where the similar car is already being used.
4.0 As per para 14.1 of technical specifications, the system was required to be inspected for its performance. Since the ultrasonic system was at Israel and the camer vehicles on which the system was to be mounted was under manufacture at ICF, Chennai, it was decided to inspect the ultrasonic system of the car at firm's premises at Israel by the RDSO officials visiting Israel for training.
5.0 Railway Board vide their letter No.E(Trg) 2004(6)/5 dt.27.01.2005 approved the deputation of the following 9 RDSO oficials as per following details.
Group-I : 10 working days training in Israel and 5 working days training in Germany w.e.f 13.2.05.
(i) Sh. Pradeep Kumar GargDirectormM (ii) Sh. Delip Kumar, Section EngineerEngg./TM (iii) Sh. S.Bhattacharya, Section Engineer/Engg.RiW (iv) Sh. Ram Lakhan, JRE-IRM (v) Sh. Ranjeet Singh, JRE/TM
Group-IT : 10 working days training in Israel w.e.f 13.02.05
(i) Sh. Narender Kumar/Director/TM (ii) Sh. Ramesh Jain, SRE/Engg./TM (iii) Sh. R S . Bhar!i, SRE/Engg./TM (iv) Sh. Sandeep KumarIJRE-IIITM

List of abbreviations (Bold entries: Sml Master proprieta~ terms)
CCW Counter clockwise RPP Remote Pulser Preamp
CW Clockwise SFB Super-fast B-scan
LMB Left-mouse-button UPR Ultrasonic Programmable receiver
OCC Old Comm Converter US Ultrasound
RMB Right-mouse-button USC Ultrasonic System Computer

1. Introduction
1.1 Basic Principle of USFD
Ultrasonic waves are vibrational sound waves of frequency of more than 20,000 cycles per sec. Their unique properties have been applied to industry medicine, for underwater signaling, ultrasonic drill~ng etc There is wide application of ultrasonic for non-destructive testing of materials It is used for detection of cavities, inclusions, cracks corrosion, wall thickness, porosity
In Railway Ultrasonic Flaw Detection Techniques are used for detection of internal flaw in rails such as inherent cracks, bolt hole cracks etc.
There are three types of sound waves
I . Longitudinal waves or compression wave 2. Shear waves or transverse wave 3. Surface waves
We make use of longitudinal waves and transverse waves for rail flaw detection in ultrasonic inspection (PULSE - ECHO) technique. The properties of reflection and refraction of sound waves are used in the process. The characteristics that determine the amount of reflection is known as accoustic impedance of the material and is a product of density of the material and velocity of the waves in it. High frequency sound waves are introduced into a material and they are reflected back from surfaces or flaws. Reflected sound energy is displayed at various time and operator can visualize a cross-section of the specimen showing the depth of features that reflect sound. The energy is also lost in scattering and absorption, the combined effect of which is known as attenuation. The size of the flaw detected is approximately half the wavelength.
CT! The conversion of electrical pulses to mechanical vibration and the conversion
of returned mechanical vibrations back into electrical energy is the basis for ultrasonic CJ c.;; testing. The active elements, which convert the electrical energy to acoustic energy 0
and vise versa is called piezo -electric crystals or piezo- electric transducer.
Probes are the metallic housings containing the piezo-electric crystal, damping material ( to control the vibrations of the crystal), electric leads and a Perspex face. Probes can be normal probes or angle probes. We generally use oO, 70°, 35', 55O, 45' and 70' skew probes for scanning of rails.
For ultrasonic testing the following points are important.
1 . The contact between the probe and test specimen should be proper i.e. no particles, foreign matter should remain between the two.
2. Selection of couplant - suitable couplant between the probe and the probing surface serves as a medium that is important for effective transmission of ultrasonic energy from the transducer into the material.

To assess the performance of an "Ultrasonic Flaw Detector" the following characteristics are studied by ultrasonic method only.
i) Linearity of time base. ii) Linearity of amplification. iii) Dead zone iv) Resolution v) Maximum penetration power vi) Probe index vii) Probe angle
1.2 System Overview
M/s Scan Master, Israel will supply two ultrasonic rail testing systems fitted in ICF DETC coaches The system is named as SFB-100/NT. The new Spurt cars are intended as an in-situ, high-speed, rail defect inspection system. The cars include the signal generation and detection hardware, the data-acquisition hardware, the Operator Workstation and the software to perform the tests, or Scan Operations, the real-time display and analysis, the offline display and analysis and reporting functions. The system is housed in a dedicated enclosure and mounted in a specially prepared rail car which also incorporates a dedicated carriage for mounting and maintaining the transducers in contact with the rail during the inspection.
The system is run by a single operator which controls the system from a dedicated workstation. The operator is provided with a set of five display screens to monitor the central data acquisition and signal quality of the system in real time. A keyboard and a mouse are provided for access to all the system setup and reporting functions. Sixth screen show the video provided by cameras to show the position of sled in real time.
The SFB-100/NT includes several phases of operation. On a day to day basis the system is required to collect data along the rail ("Scan") from ultrasonic sensors
w provide a real-time display of the collected data including a rough processing to a3 identify flaws and operate the real-time functions (including a rail continuity sensors, 0
CL) paint spray guns etc.), and provide for off-line processing and high-resolution analysis 0
of the stored data off-line to generate detailed reports of the inspected rail sections In addition the system provides for a full range of calibration and setup features that permit definition of a wide set of operating parameters for use during the data acquisition. As such the system can be setup differently for operation on different rail dimensions and conditions.
1.3 System Operating Concepts
The system is based on the concept of high-speed scanning and offline analysis. As with other rail inspection systems, following the analysis and the report of suspected defects and their location, a team is sent to perform manual verification on site. This approach offers many operational advantages, of which the most important are listed below:

o The inspection speed offers the possibility for inspecting the track without shutting it down for long periods Inspection speeds of up to 70Kmfhr are possible.
o The offline inspection allows for collection of data close to the noise level without risking a high false-positive error rate In this way small indications, and in some situations even smaller than surrounding noise or spurious signals can be detected, reducing the false-negative error-rate accordingly, thereby the overall reliability of the inspection is increased.
o The offline analysis permits the categorizing of defects into different classes, recording also sub-critical defects.
o The recording of the inspection results for offline analysis also provides for establishing a historical perspective: changes in the rail between inspection runs can now be extracted for a more reliable detection of developing flaws. Furthermore, over time this data can provide for a better understanding of defect development rates and a tighter criteria for identifying critical defects.
To accomplish these significant advantages the SFB-IOO/NT system will do the:
(i) large data volumes will be acquired at high speed, (ii) The data will be coordinated well to the physical location on the track, (iii) Transducers capable of riding the tracks at high speed while maintaining a good ultrasonic signal will be used.
1.3.1 Data Acquisition
In order to cope with the large volume of data, the data acquisition system is divided into separate stations, the USC-100 (Ultrasonic channel), operating in parallel to allow data acquisition speeds of up to 100MB for each channel. The immense data volume is reduced by the upr-100 (Ultrasonic Programmable Receiver) hardware to a set of values representing the ultrasonic signal in predefined regions along the time- signal called gates. The number of gates in each channel is setup, typically between 10 and 32 gates for each measurement point. For each gate the USC-100 instrument is setup to record several parameters derived from the signal waveform throughout this gate: the maximum or minimum signal amplitude, the time signature of this value and a logic state of the signal with reference to several criteria. The amplitude and time information is stored on the data disk of the instrument for use in the offline analysis. The logic information and time information for one of the gates in each measurement point (also referred to as "Pixel"). Each USC-100 controls up to four ultrasonic channels; the information in each gate for all the channels is stored locally on the USC-100's data disk during the real-time operation and is downloaded to the server at the end of the scan. The logic information for each gate and one time value are transmitted over a LAN to the server in real time to affect the real-time display and decisions.
1.3.2 Pixel Size Vs. Speed
The SFB-1001NT is designed for high-speed operation on the one-hand, yet it is also required to provide for a high-resolution scan along the tracks to ensure a high

probability of detection critical flaws in a noise environment on the other hand. Test speed and measurement resolution, or pixel size, are a tradeoff in the system as they are related by the minimal time required for the ultrasound to travel in the rail; one cannot generate the next ultrasonic pulse before echoes from the previous one have died down. Figure 1.1 shows this tradeoff graphically. For example for a 220mm rail height and 90Kmlher the limiting pixel size is approx. 6mm; for the same rail at 60Km/hr, the limiting pixel size is 3.5mm. The SFB-100M allows for setup of any different pixel size for each scan.
1.3.3 Synchronization
The SFB-IOOINT is required to generate reports with the accurate location of suspected flaws, and provide an accurate location with good repeatability to allow for comparison of results between different inspection runs of the same track. For this purpose the SFB-100/NT includes several means of positioning the inspection data with real positions along the track The basic synchronization of the inspections data derives from an encoder that travels along the track. This forms the fine resolution of the scan, defining the pixel size along the track.
Pixel Size Vs. Speed
0.0 20 40 60 80 100
Speed [Kmlhr]
Figure 1.1: P i e l Size Vs. Speed, for several rail heights. Calculation here for a dead-time of 40psec, and PRF limited by the 3S0 channel.
The encoder signal also serves to trigger all the ultrasonic instruments so that all the ultrasonic channels are fired simultaneously. This ensures that there will be no interference between ultrasonic channels and minimizes the potential for multiple ultrasonic echoes from entering the data receiving window. The encoder serves also as the basic measurement of the traveled distance along the track. Since, however, the

encoder pulse-per-length ratio is not accurate, and since mechanical slippage occurs, over long travel distances the encoder reading may slip. Furthermore, for assistance to the verification teams that need to locate the suspected defect in the field, physical reference points are added along the scan results. In the SFB-100/NT there are five different reference points.
mile st ones: the occurrence of a milestone, is entered and the event transferred to the SFB-100/NT via the internal communications. This reference occurs simultaneously for the Left and the Right rail.
oThe Km reading is corrected at every milestone on the fly. The inspection itself is driven by the encoder readings and progresses at the rate of the encoder pixel generation. On screen display includes the Km reading at every measurement point, and the distance to the nearest milestone. The offline process screen displays the location along the track in a similar manner. The defect report includes the nearest distance and direction to all the relevant reference points for the rail.
1.3.4 Real-time monitoriizg
As the data analysis is performed mostly off-line, the main requirement from the operator relates to monitoring the quality of the data acquisition to ensure that the data is suitable for the analysis. In addition the SFB-100/NT has the capability of identifying flaws in real-time and marking their position with paint sprayed directly on the suspect rail in the vicinity of the detected flaw. Both of these processes rely on the gated logic information which is generated in the USC-100 instruments and transferred in real-time to the Server. The server is responsible to collect the data fiom all the clients and generate a coarse-resolution display of the signals detected from the rail - this is called a pseudo-B-scan where each measurement point along the rail is represented by a vertical column; in the coarse pseudo-B-scan each set of gates is represented by a rectangle of width corresponding to the pixel width on the rail, and a r-
03 depth roughly related to the location of these set of gates in the depth of the rail. The 0
CO logic status of that gate combination is represented with a color code. For example a 0 set of gates in which ail amplitude thresholds have been exceeded is colored red. Complete loss of signal is colored black etc.
The SFB-100/NT definition of a flaw is programmable both in its distribution between the gates of the different channels, and in the persistence duration of the flaw along the track. For example a critical flaw is expected to extend over a long distance along the rail and therefore should persist for several pixels. To assist the operator, until the flaw does not exceed its persistence indication requirement, it is given one color code, and once it has exceeded this length it is given another. This same concept serves to reduce the false-positive indications for the real-time detection and the paint spray operation. To further assist the operator to identify measurement problems, special color codes are provided for loss of signal (typically due to loss of ultrasonic coupling or damage to the transducer), high levels of spurious noise, for example due to a high quality rail which necessitates reduction in the channel's gain etc. The

operator is expected to take corrective action on-the-fly to minimize the extent of poor data collection
1.3.5 Real-time Setup Chat~ge
The SFB-IOO/NT is intended to run at high speeds. It is possible that different rail sizes may be incorporated into the same track. These sizes may require a different ultrasonic setup of the measurement channels. The SFB-100/NT monitors the height of the rail continuously, and once the rail height has changed (as a safety measure the change must persist for a predefined number of measurement pixels), the setup for the new rail size is loaded into all the instruments and the scan continues essentially uninterrupted.
1.3.6 Additional Hardware Devices
The SFB-100NI installation, includes a set of four rail fog-detectors, four paint guns, Rail Cleaning system.
1.3.6. I , Painting System:
The system's aim is to mark the rail with paint (gauge side). The operation of the system is done by the PLC gets the signal !+om the server). The pain gun squirts71 cc of paint on gauge face flange of the rail on getting a signal from the server. The server can be programmed to give a signal at the desired event (size of defect). Four units are included at the system. Schematic drawing of the paint spray is shown at Fieure 1.2.
Figure 1.2 - Schematic sketch of painting system

I The paint spray is connected to a paint reservoir.
i Figurel. 2.1 - Sub-system of the paint gun
1.3.6.2 Frog Detector
I The aim of the frog detector is to sense a horizontal gap between the rails for
i example at rail junction. The minimal gap is 20 cm. The sensing distance is 15 mm. Four sensors are mounted as far as possible from the sled. When there is gap between the rails it automatically lifts up the sled. Signals are wired to PLC. PLC controls the , raising and lowering of the sleds and generates sled-status signals to the US system. Firmre 1.3 describes a schematic drawine of the froe detector.
a 43
C 0 CD 0
r i i- C
Figure 1.3 Schematic drawing of Frog Detector
- 7 -

the sled is permissible. The trolley can be lowered or lifted pneumatically and there is a locking arrangement in lifted position for running the car in testing mode. Four pneumatic jacks have been provided for lifting and locking of testing trolley and two electric motors have been provided to facilitate longitudinal and lateral moment of probe holding beams. The carriage wheels have been flanged and skid has been provided in testing camage for centralization of probes during the run. The testing trolley consist of two numbers of probe holding beam for left and right rails. The probe holding beams support four numbers of probe holders for each rail where 08 probes are fitted. It is possible to lift the probe holders independent of the camage without stopping the car. It is also possible to adjust the probe holding beam vertically and laterally from inside the car when the car is in operation. The following probes have been used for scanning the rail.
1. 0' robe L? 2. 35 forward and backward probe.
3. 70' forward and backward probe. 4. 70' skew forward and backward. 5. 55Oprobe
The area of scanning by each probe is given in figures 1.6 a, b, c, d
Beam W& - 12 lnm
35 deg
Top Dend ZME (rw 3 "y"
nnrnonnend o n e (sop 8 rnm
Figure 1.6 (a) & (b)

70 deg
70 deg skew
I ............. , __-- '.._. .,_-.' ..*. -. .-.. . .-- ' ... .... .. . . ._-.I ,__.r-.-
I.. , ,_. .._- __--- . - <_-.. ... -.. . --II T I ..... _. _.- I TDZ +..,, /
I '
Figure 1.6 (c) & (d)

The arrangement of probes in the probe holders is given in figure 1.7 a & b
< - ' .: , -
' Probe &lder 70' & 70°:skiw , . ? - :-. . . : ,:<
Figure 1.7 (a)
Figure 1.7 @)

To keep 35' probe at proper sway distance, one of the 35' probe can be moved longitudinally by electrically controlled motors. A view of the sled is given in figure 1.8.
OVER VIEW OF SLED
Figure 1.8 (a)
. I . . ~.
' Sled View
Figure 1.8 (b)
1.3.8 Malfunction recovery
The SFB-100/NT includes several measures to ensure that the software recovers from a malfunction on-the-fly. This is important as test runs are scheduled well in advance and even if the inspection run fails, it is impossible to repeat the run
- 11 -

without rescheduling a different date. Therefore it is important to attempt to minimize the down time of different software and hardware components on the fly
The distributed nature of the systems serves this issue well. Even if one of the measurement channels, or even a whole instrument fails altogether the other instruments continue to operate independently collecting data for offline analysis, and as long as the communications are not affected, transmitting the data for real-time monitoring and analysis to the server. The Clients are also arranged in a manner that allows a Client to shut down completely, then boot and synchronize back with the system to continue and record its data in synchronism with the rest of the system.
The data files and the communications protocols are also designed to ensure complete recovery after a total failure occurs. Data files are recorded in segments that are closed up and saved at the fust occurrence of either a new milestone trigger, or a predefined distance (say 300m). This means that even when a milestone is missed, the data file is closed. At this point a new file is initialized so that even if the instrument fails, the previous data will be saved up to the last milestone. As the milestone signal is received by all stations, and the absolute number of the milestone is coded into each new tile packet, the overall system data will remain synchronized even if one of the channel misses several data points, or an instrument fails, or after any other occurrence, as the system becomes operational all the components are re- synchronized at the new milestone signal.
1.3.9 Processing m7d Reports
At the end of a scan, the data fiom all the Clients of the SFB-100/NT is collected over the LAN to the Server's disk. Although the data is segmented into several different files it is arranged in a structure that appears to the operator as a single file. Processing of the data can be performed directly on the Server, or preferably be loaded to a CD and transferred to another processing station,
The data is processed offline and verified by the processing operator. On detecting a suspected flaw the operator can add that flaw and its location to the flaw list generated during the process operation. This list generates the defect report of the particular scan. Some of the flaws may be identified using the Search & Identify tools of the Process, but in every case the operator has the capability and the responsibility to over-ride the automatic flaw identification.
1.4 SFB-100N - hardware overview
The SFB-IOO/NT includes the signal generation and detection hardware, the data-acquisition hardware, the Operator Workstation and the software to perform the tests, or Scan Operations, the real-time display and analysis, the offline display and analysis and reporting functions. The SFB-100hT system is housed in a dedicated enclosure and mounted in a dedicated rail-car which also incorporates a special carriage for mounting and maintaining the transducers in contact with the rail during the inspection. A diagram of the electric cabinet and a RPP cabinet is given below.

Figure 1.9 View of Electrical Cabinet
Figure 1.10 View of client computer and server cabinet
- 13 -

Figure 1.1 1 View of RPP Cabinet
1.4.1 System Blocks
Figure 1.12 shows a general block diagram of the SFB-I O O N . The hardware comprises an array of four four-channel ultrasonic instruments: the USC-100. The USC's are responsible to transmit and then receive the ultrasonic echoes with the aid f-
m of suitable ultrasonic transducers or probes. The USC's are interconnected with 0
hardware synchronization pulses and a LAN, and include a multiplexed buses of VGA CD 0
data and Mouse and Keyboard lines for the screen display of each instrument, and the keyboard and mouse control of the units. The entire array of instruments is controlled and coordinated from the central processor of the systems - the server. In terms of the software the USC's are defined as Clients. The server also provides the interface to the peripheral devices (printer, archival storage etc.), the system sensors and actuators (operating the paint guns and the rail break sensor), the system encoder for synchronizing the scan with a physical rail position.
1.4.2 Operator Workrtalio~t
The user operates the system with a set of controls provided in the Operator Work Station which includes, a mouse and a keyboard, some control buttons and six display screen. The Keyboard and Mouse are multiplexed on a dedicated line and can
- 14-

be accessed by the user through multiplexing the systems Keyboard and Mouse to each station Figure 1 . I 3 shows the general layout of the Operator Workstation The central screen continuously displays the status of the Sever The left and right screens are multiplexed to display the screen of any of the USC-100 instruments associated with the Left or the Right Rail The mouse are used at real time the keyboard is used mostly for setup and offline processing operations (Figure 1 14)
Figure 1.12: System Block Diagram.
. . .. . . . . . 4
, ~ - workstation Layout . ' , ; * .
, , . . M SIde Transducer Rlght Side
+7W -7@ +7W - 7 0
- - Figure 1.13 Work station layout

Figure 1.14: View of the Operator Workstation cansale.
Figure 1.15 shows the main blocks of a USC-100 Client: in addition to the central processor there are two upr-100 data acquisition boards, two hard disks (one
0 for software and one for data) and a floppy drive for maintenance operations. The Client software is protected with a security code installed with the Hasp hardware component on the printer port.

Transducer Carrlage - - - - - - - - - - - - - - I
- Pixel. Milestone
U h r a ~ o ~ n d Processor Boa:d
Single Board CPU
mn, l,Rai,W.,2.m
Note: Disks mounted on shock absorben USClm block.disgmm
SFB 100 A 00 I I SconMost~r
Figure 1.15: Block diagram of a USC-100 instrument.
Figure 1.16 shows the blocks of the Server: in addition to the central processor there are two hard disks (one for software and one for data), an OCC Board for encoder synchronization and I/0 operations, floppy and CD drives for maintenance operations. The Server's software is protected with a security code installed with the Hasp hardware component on the printer port.

PatnlOUn Ermr. RigM
'1 8 n D#g#;al ou: (Fast)
men (milestone) Palnl" 4 W. MICommand
1 5 , M M . Z . l O . M
L * d l . 4 . W . 25.301
L*anlJ,Rm#, 12.2.m
Drsfll2,Rmd.B.l m Note: Disks mourned on shock absorbers L*anl.l,Fm4,W.42.W
SFBlCU NT lor D B , Semi block-diagram Note: Rail Sensor signal feeds dire* to DB PLC SFB 200 A 00 I 1 ScanM~ster
Figure 1.16: Block diagram of a Server.
1.5 SW Modules
The software modules are provided as separate entities that are located on different hardware components and perform dedicated tasks. The following lists the main software modules; further detail is provided in the following Sections. --I
0 o Instrument / Client Modules (see also Figure 1.15 & 1.17): --I
(0 Driver interface to upr-100 ultrasonic data - to interface directly to two 0
upr-100 ultrasonic data acquisition boards
upr-100 software module - to perform all of the upr-100 instrument functions
SFB-100 Client Module - to run and coordinate the data storage and transfer to the LAN
SFB-100 Client Sender Module - to buffer and control the transmission of the data over the LAN to and from the Server.
o Sewer Modules (figure 1.18)
Driver interface to OCC and counter boards ( 110 boards)

a SFB-100 Real-time Process Module - to run and coordinate the data storage, and analysis in the Server
SFB-100 Real-time Monitor Module - to process and display the real-time data
SFB-100 Client Receiver Module - to buffer and control the reception of the data over the LAN to and from the Client
o Offline Process Module
o Setup and Configuration routines both on Client and Server
o Maintenance routines
instrument m
Figure 1.17: Client block diagram.
I Drivers W Real-Tlm Monitor
. ".
Receiver Real-Time Process
Figure 1.18: Server block diagram.
- 19-

1.6 The Client Modules
The Client modules are built around the standard upi-100/2000 instrument package. This package includes all the controls and functions. In the SFB-100DJT this package is responsible for:
o Driver interface to ultrasonic hardware
o Input and control of 2 x upr-100-2, (4 AID), four-channel board
o Display the A-scan and the gate positions in each of the four channels
o Accept US scanning parameters fiom US Setup tables (files)
o Transfer Amp, ToF and logic data per gate to the Client module
o Detect and acquire the synchronization pulses for trigger, and milestone
In addition to the standard Instrument package, the Client incorporates the following SFB-100 software modules:
o Synchronization with milestone signals
o Initialize and control a cyclic memory buffer for the instrument module to generate the ToF and Amp dat% per gate.
o Receive Amp, ToF and logic data per gate from the hardware package through the USDA module.
o Run length compression of data
o Store Amp, ToF and logic data on a local disk
o Transfer logic data to the Server over the LAN (Sender Module)
o Generate the Pseudo-B-scan display - this is a graphic presentation of the logic state and significant ultrasonic data. It is continuously updated and represents a concise version of the status of all four channels within the Client station.
o Generate the Status Display on the Client's screen - including the Km value, scan speed etc.
1.7 The Server Modules
The Sever modules are built as independent programs on the platform The programs are grouped in three categories: real-time data and monitoring operation, offline processing and reporting and various setup and maintenance routines.
o Real-time operation:
Start Scan - Initiate Client machines automatically
Manage the synchronization of the PRF, Pixels and Milestones (or the input files)
Collect and process logic data from the clients detect faults
Collect and store positioddistance information
Activate and control the paint spray and rail sensors
Display the real-time logic status of the channels

Manage auto-recovery from various system failures
Monitor system integrity
o Ofline processing:
Functions to collect data from all Client's to central station
Interactive processing of data
Connect to external software report program
o Manage configuration, files, and setups & monitor system integrity
1.8 Operator controls
The following controls are provided for the operator at the workstation:
Initiate Client machines automatically
Manage the synchronization of the PRF, Pixels and Milestones
Collect and process logic data from the clients detect faults
Collect and store positionldistance information
o Buttons
Power On/ Off
o KB /Mouse:
Logon 1 logoff, enter scan data
Setup of channels - full control of Instrument's setup parameters
Setup of scan parameters - full control of scan setup parameters
Transfer of data for processing
Perform processinglreporting functions
Start 1 Stop scan
1.9 Data Files T t
The SFB-100N generates a set of dedicated data files and file structures 0 --i
which serve to store the setup information for the definition of a scan and store the c-13
data for real-time and offline monitoring and processing. Figure 1.19 and the 0
following sections outline some of the important features of these files. In principle the operator should not need to be concerned with the detail of these file structures, but the following information provides important insight as to the operation and fault recovery features of the system.

Scan Plan
Chl ET; gic laws -- rail'heighy
Client Server !
Chh. Amp & ToF Files ! Chh. Logic A I D data
Figure 1.19: Schematic representation of the SFB-100/NT file structure
As shown schematically at the top of Figure 1.19, the Scan Plan structure engulfs all the setup information for defining the parameters of a specific scan.
0 0 r-(
The Scan-Plan includes reference to the US setup of all the active channels. (D
These are the standard setup files used for setup of the upi-100 instrument. The 0
fundamental difference here is that this data is stored on the server and transferred to the clients at the beginning of the scan, either directly or as pointers to the files that are stored on each client. These setups include all the information as to the gain and gate setup of each channel; this information also serves the real-time and off-line analysis functions and therefore all the data here is carried on to the scan data files and stored with it.
The Scan-Plan also includes dedicated files that define the system level setup, including the configuration of the hardware, geometrical information, options of the display and the definition of the real-time and offline logic routines that server for the real-time flaw identification routines.

1.9.2 Client Files
As shown schematically on the lower leR of Figure 1 19, the Cllent Flles comprise a stream of data files for every channel - a total of four files for each Client There is also a lookup table for each channel which relates the sequential data stored on the sequential files to real events - location of milestones etc
The sequential files store all ToF, amplitude and logic values from each channel, for each measurement point The storage is in binary form There is also a run-length compression so that the most probable occurrence of "no indication" occupies only two data words for each string of occurrences The data stream files are terminated and restarted every occurrence of a Milestone (or milestone signal time- out) so that even if the sequential file falls out of step for any reason, it recovered and resynchronizes on the next Milestone signal
At the end of the scan the entire set of sequential files and lookup tables for each channel are transferred to the Server for compiling into one data structure that servers the offline evaluation procedure
1.9.3 Sewer Files
As shown schematically on the lower right of Figure 1.19, the Server Files comprise a stream of data files for every channel -four files for each Client and up to 24 US files. There is also a lookup table which relates the sequential data stored on the sequential files to real events - location of milestones etc. In addition there is a possibility of including another sequential data file for recording values off the A/D channels of the OCC board within the Server.
The sequential files store logic values from each channel, for each measurement point. The storage is in binary form. There is also a run-length compression so that the most probable occurrence of "no indication" occupies only two data words for each string of occurrences. The data stream files are terminated and restarted every occurrence of a Milestone (or milestone signal time-out) so that even if the sequential file falls out of step for any reason, it recovered and resynchronizes on the next Milestone signal. The server is designed to tolerate loss of CD any number of Client data streams; such loss leads to missing information from the 0 + real-time display and the real-time analysis, but these processes are not halted and co recover when the data stream resumes
0
At the end of the scan the entire set of sequential files and lookup table for each channel are compiled into one data structure that servers the offline evaluation procedure.
1.10 Real-Time System Operations
The SFB-100/NT performs several different processes in real time As described briefly above, the Client processors serve to acquire data, display the data on screen, store them locally and transfer a compressed version of the data, in the form of gate logic, to the Server for processing. Similarly the Server receives the logic data from all the channels, collects system status data from the HW (milestones,
- 23 -

fishplate indications, sled status etc.), operates the real-time feedback on Paint Spray, and Probe raising, displays the data on screen for real-time monitoring and performs the real-time analysis.
There are two additional functions performed in real-time by the Server - these are the monitoring of the rail height for automatic control of the setup and the real-time detection of flaws.
1.11 Offline Processing and Reporting
Once the scan is complete the operator may collect all the data &om all the Clients to one data structure stored on the Server's data disk. Although this operation involves collecting a whole range of data files and file types, the tools allow the operator to perform this as if calling up a single file from a specific directory.
Once stored on the Sewer the scanned data may be inspected on the server, or copied on to the I-Omega storage device and transferred to another processing station.
The process package itself allows the operator to view the scan data on screen as a Pseudo-B-scan format. This view can be zoomed in or out to display different rail length son screen. It is also possible, after defining the extent and form of a defect to run the display from one indication cluster that meets the defect definition, to the next, with manual approval/disapproval of the detected cluster as a defect. A report is ten generated including the time ad extent of the defect, and the absolute position and relative positions with respect to various reference point on the rail.
1.12 Auxiliary modules
1.12.1 The interface to the HW
The dedicated hardware of the SFB-100/NT is interfaced through several ports:
The encoder - directly to the OCC encoder input (on Server)
The Rail Sensor (also called Frog Detector) - to the parallel 110 bus on the Server (four sensors) - Inputs r--
0 The Paint Spray -to the parallel I10 bus on the Server (four units) - Outputs Y
cg Sled status indications - to the parallel I/0 bus on the Server (two devices) - 0
Inputs
Fishplate Sensors - to the parallel I10 bus on the Server (two devices) - Inputs
1. 12.2 Scat7 file names
The scan name will be define with RDSO during the installation and we be set

2. Initialization of system
2.1 Starting the system
To start the SFB-100/NT, turn the main ON-OFF key CCW (to the left) and hold it in that position for two seconds. This is a momentary key which will spring back to the center once released.
Once started, the "ON" indicator in the control panel is lit and the system processors boot automatically, including the server and all the clients. The operator control is provided within the central console.
After the splash window, the system displays the log-on dialog box On successful log-on, the software completes its loading and opens the Main
Menu Window with the options listed below. Note that only options that are allowed to the access level of the active user are permitted; these are displayed with blue background buttons. Functions which cannot be accessed by the active user are grayed out. The level of operator for each function is indicated in the list below 0 , E, and S indicate the Operator, Engineer and Supervisor user levels.
Figure 2.1 : The Main Menu.
Scan - to start a new scan (0, E, S) - refer to Chapter 4. Process - to analyze a scan offline (0, E, S) - refer to Chapter 5. Reports -to generate various reports (0, E, S) - refer to Chapter 6.
Setup/Plans - to setup a scan plan (E, S) - refer to Chapter 7.
Config. -to configure the system parameters (E, S) -refer to Chapter 8
Maintenance - to manage the scan data (E, S) -refer to Chapter 9.

Users - to edit the access list of users and their levels (S) - refer to Chapter 10.
Exit to system - to exit to the Windows System (S) - this is used for operating system maintenance and can be accessed only by ScanMaster's service personnel or a Supervisor level user. Log-off - to logoff the program and allow a new user to log on (0 , E, S) - this function returns to the log-on dialog window as described above Help - to activate the on-line help I manual (0 , E, S). Shut Down -to shutdown the system (see below) (0 , E, S).
User can navigate between the various functions listed in the Main Menu according to their needs. It is clear, however, that certain functions must be completed before others can commence: the scan setup must be programmed before a scan can be initiated; and Process can only run when scan data is available.
2.2 Basic trouble-shooting procedures
2.2.1 Overheating
If for any reason the system overheats, the "OverHeat" indicator lights up. This requires the immediate intervention of the operator who must shut down the system to allow it to cool down. If this situation recurs, and the temperature in the car is within the normal range, call for service to the system.
2.2.2 Recoverii?gfrom a client software ma&inction
If for any reason a software malfunction is observed in one of the clients such that the software application is no longer active, switch the keyboard control to that client and perform the following procedure:
Open the task manager by RMB click at the command bar at the bottom of the screen, or by <AltxCtrl><Del>. 0.
0 Select the "Processes" Tab
Verify that the Client and Instrument applications are no longer active. 0
These are labled "Client.exen and "lnstrumentV3.exe" respectively
If any of these processes is active, end the process by selecting it with the mouse and clicking on the "End Process Button".
Verify that the Client and Instrument applications are no longer active in the Task Manager. If it is, end the Instrument process.
Double click on the SFB-1001NT icon to restart the program
Note that this operation can also be performed during a scan - once the software of the client is active, the system automatically integrates it back into the data-acquisition routine; data is lost only during the time the client was not running

3.1 Overview
Once all the SFB-100/NT parameters are setup, the SFB-IOOiNT is ready for scanning. The scan procedure itself requires several definitive user actions as listed below. All other operations are performed automatically by the software.
Initiate a scan - select the Scan Menu Option Select a pre-programmed scan plan and enter scan documentary data
Activate the scan, actual scanning begins once the car is in motion Monitor the scan process during the scan for correct operation and perform
any corrective actions to rectify system or setup deficiencies during the scan
Exit and terminate a scan to complete the data acquisition and close the data files of the scan.
Note users of all levels are allowed to access the Scan routines.
The following sections describe these steps in detail and lists the various real- time scan operations. Section 4.2 describes the scan operating procedures. Section 4.3 provides a detailed reference for the Scan-time screens and the function of all the buttons.
3.2 Scan Procedures
3.2.1 Start Scaiz
To start a scan, click on the Scan Button in the Main Menu (see Figure 2.1)
This opens the Scan Parameter entry Dialog box (Figure 3.1). Several of the entries are automatic including the date and programmer of the setup and the date and * time of initializing the scan. These cannot be altered and are grayed out. Other --I
parameters should be entered manually as listed below. Parameters that can be left r-l CO
undefined are indicated with a t: 0
Plan Name - this is the name of the entire scan plan setup. The operator must select the correct plan for the scan from the list of available plans. To access the list use the combo-box control to the right of the entry field. File Number - this is the name of output data. This name will be used to
identify the results for this scan for processing and should be selected . judiciously. Enter any Windows acceptable character string as a name. t Note: In certain installation the file name is read automatically over
the net. In these installation there is no need to enter a file name. Any

file name that is entered is overwritten automatically before the scan starts Description t - an optional field for user notes. These notes can later be seen in the offline process. Start Km -this is the starting milestone Km value. Enter the Km value of the first milestone expected in the scan. 7 Note: In certain installation the first milestone Km value is read automatically over the net. In these installation there is no need to enter a Km value. Any Km value that is entered is overwritten automatically before the scan starts.
Plan Name: hnput Logic QA
, .
File Numbec
Test DatelTirne:
& . ..:*.'v r*.a Operala .,.. , -
Figure 3. I : Scan Parameter entry dialog box
Once the scan parameters are defined, click the Continue button to start the scan. At this point the system loads all the setup of the clients and the server and opens the files for storing the data in the scan. This operation takes several seconds after which there is a message "Scan Ready".
Note: in installations where the file name and the first milestone Km are transferred over the net, data is downloaded immediately after the "Continue" button is clicked.

1 - -,<d & 1 Pseudo B-scan I,, I Monitor, \ 5:
Right rail n*nl.n
*"E - . . 1
3 - 1,- I .
. . "%P_1 3 2-2 ,
7,- 1 - . . , , , . , , , . , , . - >.,o a n 3 C % 0.- 7 2 8 , 3 s 3 2 3.0 2.3 > * >.a a d a 3 3.5 3,s . 2 "' 1
5- om- R O N
. . . . . . . . . . - ....
f d j q j , , 4 / u I ~ I ' m l
Reference point icon key Point Entry
. . 1
: tr-> 1 ( 4 4 1 sz I IM I1 .,.I 1 11711 1.111.1 1 "3. I r*-. .... s e . , m m - ~ u n - ,,Jgm ' a:mm
I
Control Figure 3.2: Console screen display during Scan
3.2.2 Real-time scan operatioizs
I C3
3.2.2.1 Real Time Screen Layout Y
I Y Figures 3.2, 3.3 and 3.4 show the screen layout during the Scan. Below is a (D
0 general outline of the real-time display - refer to the following sections for details on
I the operations described below.
The central console - where the combined data from all the ultrasonic channels, the Km values and the reference points are displayed and updated in real time. The client screens - where individual ultrasonic channels can be monitored for both real-time A-scan and B-scan displays. These serve to assist in any corrective action that the operator should take in case a fault is identified.
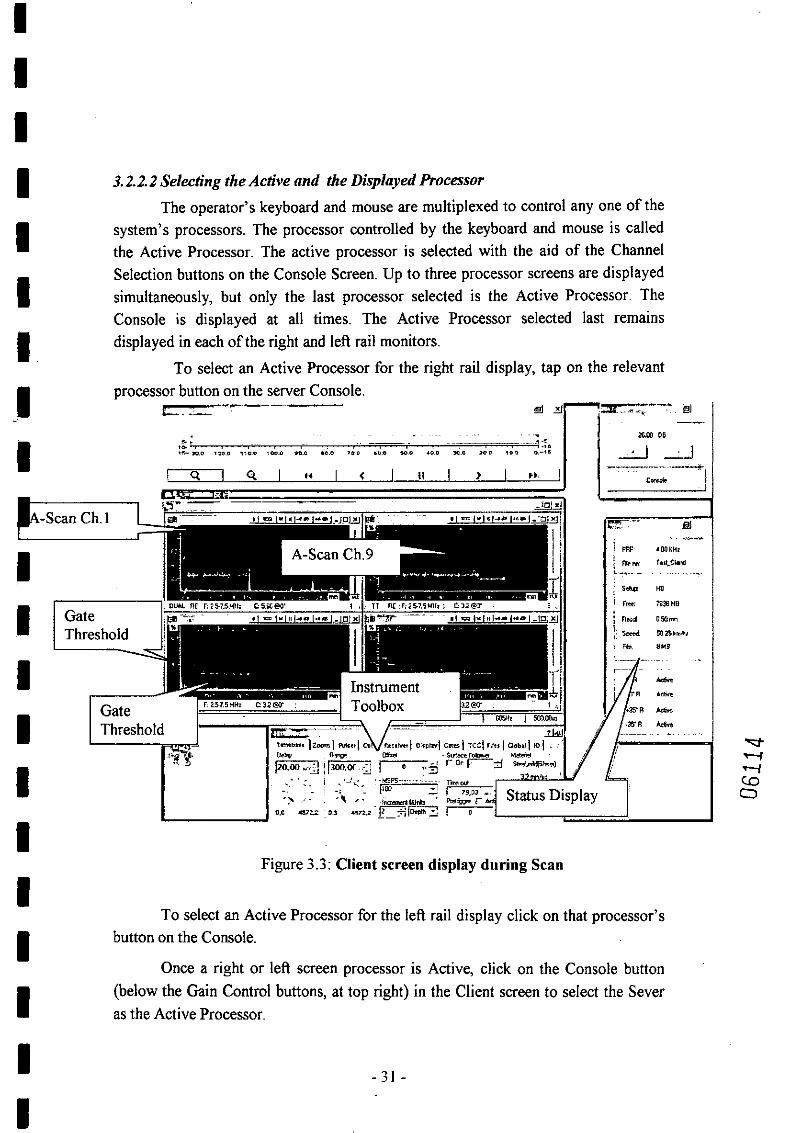
I 3.2.2.2 Selecting the Active and the Displayed Processor
The operator's keyboard and mouse are multiplexed to control any one of the
I system's processors. The processor controlled by the keyboard and mouse is called the Active Processor. The active processor is selected with the aid of the Channel
I Selection buttons on the Console Screen. Up to three processor screens are displayed simultaneously, but only the last processor selected is the Active Processor. The - Console is displayed at all times. The Active Processor selected last remains
I. displayed in each of the right and left rail monitors.
To select an Active Processor for the right rail display, tap on the relevant
I processor button on the server Console EL.-----
-Scan Ch. 1
Threshold L
Figure 3.3: Client screen display during Scan
To select an Active Processor for the left rail display click on that processor's
I button on the Console.
Once a right or left screen processor is Active, click on the Console button
I (below the Gain Control buttons, at top right) in the Client screen to select the Sever as the Active Processor.

3.2.2.3 Changing ultrasound channel display
The ultrasonic channel display is multiplexed - for each rail there is one monitor. Up to four ultrasonic channels, residing on the same client can be displayed on each. Each such display (Figure 3.3) provides for the A-scan display, and the pseudo-B-scan display for each channel. The operator can switch between clients to display the channels of a different client by selecting that client as the active processor. The operator may also change the format of the display on each client's screen.
Manual windows layout: tap on the monitor select button (Figure 3.2) to select the desired client as the Active Processor. Using the mouse, drag and resize any of the display windows to your preferences. Alternatively use the standard Microsoft Icons located at the upper right corner of each window for resizing the A-scan or B- scan windows.
3.2.2.4 Changing gain
Gain can be changed at any time during the scan There are several methods to change the gain: Coarse Gain Change from the Client Gain Control buttons, fine gain change with the Gain Slider to the right of each A-scan Window, and the standaid gain control from with in the Instrument Toolbox (under the Gain Tab). The Gain Control Methods for real-time operation.
To change the Gain in a certain channel, select the channel with the aid of the Channel Buttons the Channel Bunons on the Console. Once the relevant channel is displayed and in focus (as verified by the A-scan frame header colored blue), click on the Gain Control buttons on the Client's Screen.
3.2.2.5 Entering reference points
Reference points are used to identify the actual position of a suspect ,defect. Typically all reference points are entered automatically. Nevertheless, should the Operator need to addlcorrect the automatic process, reference points can also be entered manually.
To enter a reference point flag at the Current Location, click on the relevant reference point bunon.
To enter a milestone at the current position, click on the Milestone Button. The system loads the default milestone Km value according to the standard milestone increment and opens a dialog box with this value displayed. The operator may accept this value by clicking OK, hitting Enter or waiting the timeout time of approx. 30 seconds. Alternatively the user may manually overwrite the Km value to enter a different figure, then click OK or hit Enter.
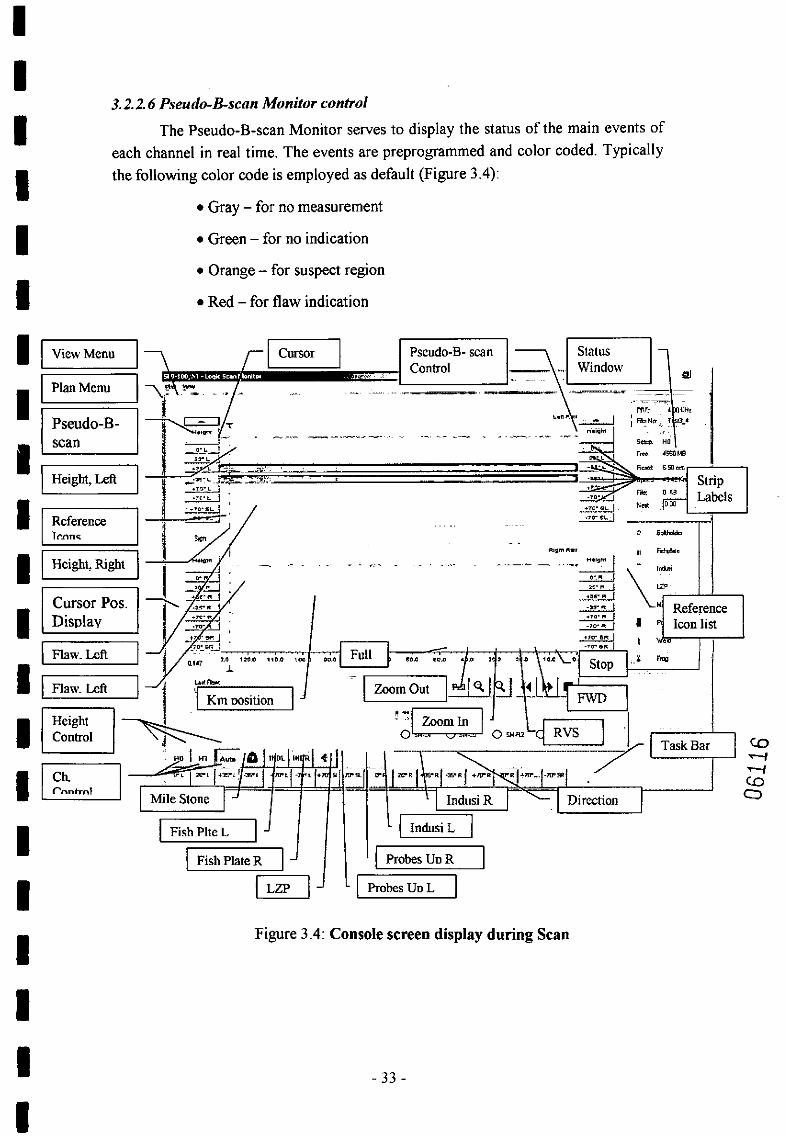
3.2.2.6 R~eurlo-Bscan Monitor control
I The Pseudo-B-scan Monitor serves to display the status of the main events of each channel in real time. The events are preprogrammed and color coded. Typically
I the following color code is employed as default (Figure 3.4):
Gray - for no measurement
I Green -for no indication
Orange - for suspect region
Red - for flaw indication
I Figure 3.4: Console screen display during Scan

3.3 Client - Scan Screen
Figure 3.5 shows the controls and displays of the Scan-time Client screen
I- I T I Frame RVS
I
Figure 3.5: Client screen display during Scan

4. Processing
4.1 Overview
Once a scan is complete, the operator is required to transfer all data files to the SFB-100/NT server. From the server the data can either be transferred onto the zip drive for archiving and transfer to a second process station, or the process can be run from the Operator Workstation directly.
The following section describes the operation of transfer of scan data to the server and its transfer onto the Zip drive. Subsequent sections are devoted to the Process hnctions themselves. The Process hnctionality is divided into several different operations:
Open scan-data ("file") for processing
Visualize the scan results - scrolling through the length of the scan either manually or automatically. This function also includes control of the viewing features: zoom, elimination of certain probe data, and hiding or displaying each of the toolbars and icon keys.
Visualization of the Pseudo-A-scan - is possible at any point along the scan.
Search for a fault automatically - automatically locate all occurrences of a predefined pattern to be listed as a suspect flaw. This generates a report of the suspected regions that can then be scanned and verified manually.
Generate a report - from the scanned list above, both in hard-copy format as well as in a DDE over-the-net format.
Exit and terminate the Process to complete the data analysis and reporting operations
Setup various Process parameters
Note that users of all levels are allowed to access all the Process routines, except for the Process Parameter setup which cannot be accessed by an Operator level.
The following sections describe these steps in detail
4.2 Scan Data Operations
4.2.1 Tratlsferring Scat1 Data
To transfer the scan data to the server at the end of a scan, Click on the maintenance button to activate the file maintenance window with a list of all completed scans that are available on the system. Select a scan run for transfer to the

server by clicking on its record (line). Right mouse button click on the selected scan entry to open the command dialog box (See Figure 5-1). Note that while the operation appears similar to file manipulation operations under standard Windows software structure, in fact the operation involves the transfer of several different setup and data files as defined in the particular Scan Plan in question. See also Section 9.2 for a more detailed description of file transfer operations.
The following lists various commands related to the data transfer operations:
Copy - to transfer all the data and setup components of the selected Scan Run into the server. Zip -to compress all the data and setup components of the selected Scan Run on the Server. Delete - to erase the data of a specified Scan Run
Copy - to transfer all the data and setup components of the selected Scan Run into the server. Copy all on this date - to transfer all the data and setup components of all the Scan Runs performed on the date of the selected scan run into the server.
Figure 4.1: Scan Run data transfer dialog window
1.2.2 Errors and error niessages
The manipulation of the Scan Data involves several different file types that must be collected over LAN from the different data-acquisition stations. Consequently the process is prone to error; an error message indicates warns the operator of incomplete data transfer. The message lists the files that are missing and the server from which they are expected. Should such a message be activated:
Verify that the relevant upi-lOO/NT is running and that it is actually connected over the network to the server Verify that the relevant files actually exist on the relevant client.
Once the problem is corrected, repeat the file transfer action, and ensure that no error message occurs.

....... . -
I Figure 4.2: Process screen display - normal view
I 4.3 Process Screen Layout
0 Figures 5.2 show the Process screen layout for normal viewing and for N
d
Pseudo-A-Scan viewing, respectively. If run directly on the SFB-100/NT this display
I is on the central console. Alternatively the Process may run on a dedicated, off-line process station. The following describe the main areas and hnctions offered in these
I screens; detail on operations is offered in subsequent sections
In general the Process display incorporates two pseudo-B-scan images of the
I data collected for the two rails (left rail on top, and right rail on bottom). In each section the indications of each of the active gates of each of the channels is displayed. Similar to the real-time display, the horizontal axis of the Pseudo-B-scan display
I corresponds to the position along the track. In this dimension the indications are essentially plotted at the representative width of the measurement interval (as
determined by the Plan of the scan). Unlike the real-time display, the vertical extent of each gate is related o the time-of-flight measurement in that gate, and so a finer vertical resolution is effected.
Above each Pseudo-B-scan rail display, there is a plot of automatic flaw indications derived by the real-time processor, and the measured height of the rail at every point. The height information derives from a the ToF of a preset gate in one of the channels, typically this is the back-wall ToF measurements of the 0" channel.
4.3.1 Pseud+Rscan Monitor control
The PseudoB-scan Monitor serves to display the status of the main events of each channel in real time. The events are preprogrammed and color coded. Typically the following color code is employed as default:
Gray - for no measurement
Green - for no indication
Orange - for suspect region
Red - for flaw indication
In addition to a logic status for each channel, there is a continuous display for the measured rail height for either rail, and a continuous display for the output of the flaw analysis as it is used to feed the paint guns on either channel.
The operator can control the viewing parameters of the continuous monitor display using the buttons in the task bar. These serve to zoom-in and zoom-out to view different portions of the rail length. The zoom buttons increase or decrease the display length by a factor of approximately 1.5. The operator can also scroll along the scan length using the scroll buttons.
Use the "mL" button to display the entire rail display buffer, which typically corresponds to a length of approx. 2 Km.
.-i
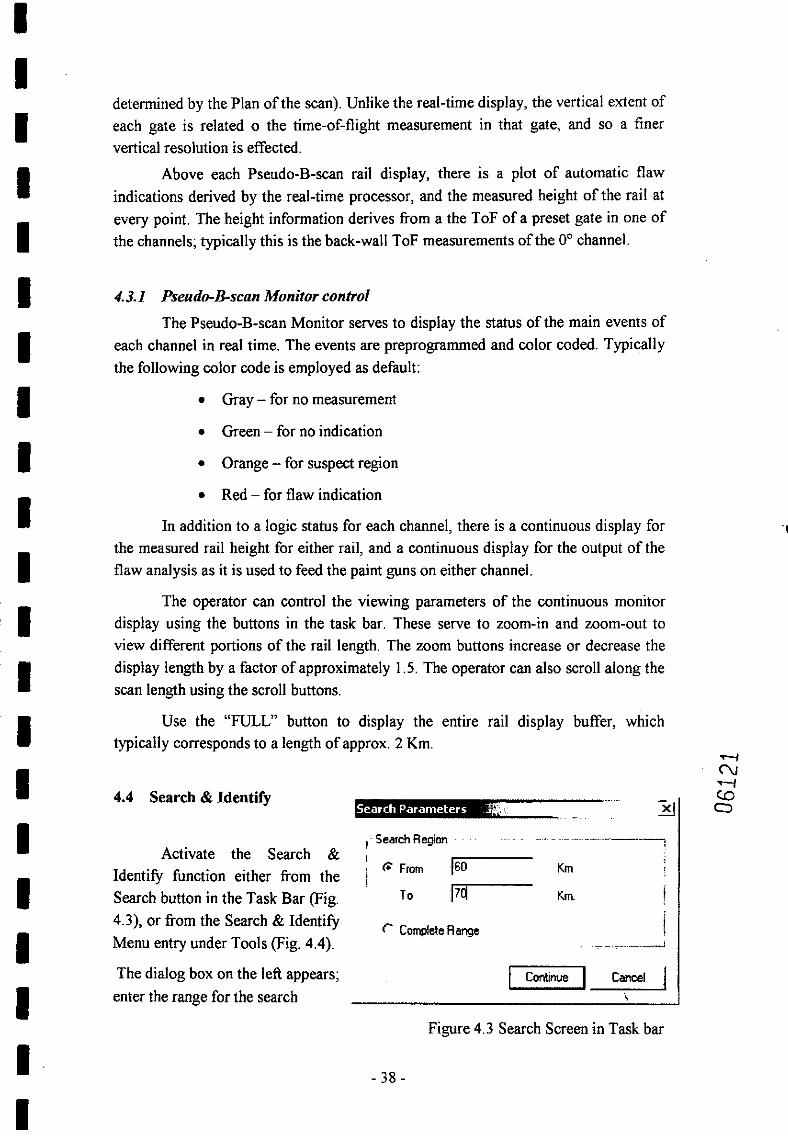
4.4 Search & Identify
Activate the Search & -
, (;. From lzr--- Km Identify function either from the ; Search button in the Task Bar (Fig To 17CI ~m I 4.3), or from the Search & Identify
CompldeRange Menu entry under Tools (Fig. 4.4). . .
1 - - ..~ -~d
The dialog box on the left appears; p G q 1-1 I enter the range for the search +
Figure 4.3 Search Screen in Task b a ~

operation (thru entering the search limits in Km), or select the entire scan range (using the radio button).
.. . -"-- -.- I: Current Km: i10.83 Total Number Of Defects: 50 / I
- - -'- I Wwk Progess:
,~ I> ~~ . . , , L. - - ., . ,. , . . . .- . . ,. . . ...... . . .. . . .., i 0% L.
100%
Click "Continue" to reach the next Search dialog box. Here the operator can choose to move one suspect indication at a time (click "Find Next Defect"), or allow the routine to search over the entire selected range CFind all defects"). The dialog monitors the progress of the search operation, displaying a progress bar, the current location of the search routine and the number of indications located.
:
The search itself generates a list of suspect indications; On completing the Search, this list is displayed. The list numbers the suspect indications sequentially, and provides for each indication the critical parameters (its location in Km, the track, the depth and extent of the defect, the rail height at that location, and the location of the nearest milestone and any reference points (figure 5.5).
75012.25 Right 47.58 39.00 0.82 6468.72
75012.58 Right 185.31 -. .~ .. 39.00 , - - - - - . 0.82 6644.53
75013.36 R$M 147.58 1456.00 0.82 t
7056.78 i
Mmber Meter I Track I W(r@ IWLJth(mn) I Heipht(rnm) I Wefesto ... I Bolt(rn) IRstph ... I WeWrn)
I m . 3 0 ~ a j r r 47.58 39.00 0.82 2264.35
2 -
m . 6 0 F$$k "85.31 39.W 0.82 2425.01
L I Figure 4.5 A typical view of suspect indications
3 - 4 - 5 - 6 -
.- .w - 750E.63 RlgM 47.58 32.50 0.82 2970.64
75(105.82 Ri$'k 86.13 P .50 0.82 Jo70.67
75m5.86 Rig* .066.13 33.00 0.82 3091.89
75012.16 Rajrr 86.13 32.50 0.82 6420.22

5. Setup
5.1 Overview The Setup functions of the SFB-100/NT serve to define the operating
parameters during scan. The Setup procedure comprises several definitive user actions as listed below. The operations can be performed in any arbitrary order, and can be redefined at any stage. The following sequence is recommended.
Setup all individual channels - define all US parameters and both A-scan and B-scan display options Define a scan plan - either a new plan, or editing an existing plan Assign US setups for each of the channels for each height
Define the input logic Define the logical treatment of the gates in each channel for real-time display Define the rail-height tolerances
Define the paint-spray parameters Exit and save the scan plan settings.
Note: only Engineer or Supervisor level users are allowed to access the Setup routines.
5.2 US Channel setup
5.2. I US Files Setup
The setup of the individual channel for scanning is a prerequisite to all the setup operation. This is done using the standard instrument tools (cf "Instrument Setup" in the instrument manual) and must be repeated for each channel, and for each channel height. All channels setups must be recorded under different channel setup names. These names serve to reference the setup when assigning setups to each rail C3
cy height; therefore it is recommended that names with meanings are chosen for these --i
setups. CC 0
5.2.2 B-scan Monitor Settip
Once all the channels within a client are setup, one should define the parameters for the pseudo-B-Scan window on the same client. In general this window automatically generates a continuous line for each active gate. These lines span across the distance of the rail and provide an indication for the status of the gate thresholds according to a color code.

5.3 Setup of scan plans 5.3.1 On hitting the "Setup" button on the Main Menu, the setup dialog widow . appears Figure 5.1). This window is divided in three areas: the list of available, preprogramrned plans (listed by name in a tree arrangement), a plan-setup field-entry for the Plan Parameters, and all the setup hnction arranged in tab form.
rlan Tree ~ n h G.GZr Plan
&dm -pbn ~ d h i w r ~ 1 ~ 5 l J Parameters to-*
I la-, BF jrrm w
S W O ~ E * J J -- - Figure 5.1: Scan Plan entry window.
5.3.2 Scan Plan Parameter Enhy t-ields
The Scan Plan Parameter entry field lists the setup parameters of the active plan. These are displayed in the fields to the right of the Scan Plan Tree. Parameters in white-background can be modified by standard MS methods: w
Plan Name - the name of the plan; overtype to modify. CV --I
Pixel Size - defines the measurement interval along the track. The smaller the CD 0
pixel size the higher the resolution. This value remains fixed during the scan. It needs to be selected in consideration of the scan speed -the following graph defines the absolute maximum pixel size as a function of scan speed. In general two values are used: 6 and 4.5 mm. To assist the entry of these values two buttons are provided; LMB click on one of the buttons to define set one of the standard pixel sizes. From the graph in Fig. 5.2, the 4.5 mrn pixel is suitable for inspection speeds up to about 65 Kmlhr, and the 6 mm pixel is suitable for inspection speeds up to about 90 Kmlhr.

0 20 40 60 80 100
Speed [Kmlhr] - -
Figure 5.2: Minimal Allowed Pixel Size as a function of inspection speed Values calculated assuming maximal US range is 230ps. Typically a larger Pixel Size is recommended with at least 15% margin above the values above
Note that the Pixel Size cannot be changed during the scan. PRF - this value sets the PFS of all the US channels in the system. PRF should be set as high as possible, the limiting factor being the maximal US
range. For a 230ps maximal range the PFS should be set to 4.3KH.z. Note that the PRF cannot be changed during the scan. Date, Time - these are entered automatically the first time the plan is called.
These fields cannot be modified by the user, as indicated by the gray background. Programmer, Version - these fields identify the programmer and any version
control numbering that is chosen (version is entered as text) Notes -this filed is for entry of arbitrary data for use of the programmer and the operator calling the plan up for scanning (notes are entered as text)
5.4. US files Co
The US Files Tab (Fig. 5.3). serves to assign predefined US setups to each o channel for each channel height.
RMB click on the entry field generates a list of all setup files available for the channel in question to assist the entry of setups and avoid errors due to mistyping the correct setup name or use of a setup that does not exist.
Note that the presence of all setup files are checked at the onset of a scan

Figure 5.3: Plans - US Files Tab
US. setup concept
- n - . > - * ' . M A l t K I I I H A W
........ .I-:- .. STATE
- I THICKNRESS
.-, Lt..= > FAULT STATE . . ........................................................... . .
Figure 5.4 US Setup Concept

5 .4 1 Height Tolerance
The Height Tolerance Tab (Fig. 5.5) serves to define the tolerance for switching setups on detection of a change in the rail height. The height is defined using the height table on the left. Additional parameters are defined in the parameter fields on the right.
PrnlE* I cmd I
Figure 5.5: Plans - Height Tolerance Tab.
To define the rail height tolerance, fill the minimal and maximal values of each rail height setups. Overlaps are suggested. For example for two rail heights, HI extending from 160 to 170 mm and H2 extending from 170 mm to 180 mm it is recommended that the minimal and maximal height values be programmed as 158,172 for HI and 168,182 for H2. In this manner a border-line value of 170 mm will not cause repeated setup changes; rather the switch from HI to H2 will occur only when the height reaches 172 mm, and the switch back 6om H2 to H1 will occur only when the height reaches 168 mm.
Rail height setup concept . : ..
Figure 5.6 Rail height set up concept
..........................

6. Single Rail Ultrasonic Tester (SRUT)
6.1 Overview
Ten numbers follow-up testing equipments were supplied by MIS ScanMaster Israel as oer the contract. A multi channel i-100 vortable ultrasonic instrument is offerei in this tester. The instrument is bait& operated and is capable of detecting flaws in rail tracks based on A-scan pulse echo technique. Dual threshold can be set in the each ultrasonic gate in each channel for alarm and coupling monitoring purpose. Each equipment consists of manual testing trolley, 20 litres capacity water container, 4 different type of probes and window NT base ultrasonic testing equipment i-100 (multi channel) with RPP and battery pack
6.2 Technical Data
Operating ambient temperature range 5' - 45' C. Frequency range - the instrument bandwidth is 1 to 35 MHz at - 3dB. Test Range - Timbers (depth) range is 640 us (equivalent to about 2 meter in steel). Sweep Linearity is max 1 dB at all ranges. Linearity of amplification - max & dB all ranges. Dead zone of the unit is 3mm. Resolution is better than 2.5 mm Signal to noise ratio - baseline noise is less than 10% under the imposed test conditions. Drift - smaller than +1% of range at constant voltage. Adequate earthling and insulation - The unit is RFVEMI protected, approved to CE forms. Display area - A 12" built in TFT screen Resistance to vibration - the unit can withstand vibrations of i g in the range of 10 to 100 Hz for 30mm

6.3 Manual Testing Trolley
Testing caniage made of MS Squaretrectangle pipes with pushing/pulling handle and steel platform with locking screw for holding UT equipment. Wheel of SRUT is spring-loaded flange adjustable to accommodate railhead width. For defect detection one small sled mounted between both wheels to accommodate 4 different types of probes with water flow channel. There is one hand lever provided for lifting/lowering the probe sled. From probe to RPP and RPP to UT equipment cables are provided through pipe & channels. There is also one platform for water container and one water jacket through which water can flow from the container to the probes to work as a couplant. The frame of SRUT is robust, made out of light material and easy to operate on track.
6.4 Water Container
There is a 20 litres capacity water container, which is required to work as couplant in between probes and rail for the detection of the defects.
6.5 Probes
System consists of four different type of probes, which is kept in the probe holder. The probe holder was designed for easis replacement and adjustment of each probes.
The sliding shoes ensures a small clearance between the probe faces and rail table.
The purposes of the probes are as below:
0' Probe - for horizontal defect for scanning of the central portion of the head QI or in the web or in the foot, some star cracks and volumetric defect in the head CU and in the web. w
C.?, 0
35' probe - To defect horizontal and volumetric defect in the head and in the web, star cracks and back surface defect.
70' probe - To defect vertical transverse horizontal and volumetric defect in the central portion of the head and web.
70' Skew probe - To defect vertical transverse horizontal and volumetric defect in the gauge side portion of the head.

:- -
Fig 6.2 Probe holder sled
Two numbers 6 volts (2 x 3.8 Amp.hour) internal batteries are provided. These are rechargeable which can work up to 2 hours continuously after charging.
6.7 Ultrasonic testing eaui~ment (i-100)
The ultrasonic portable instrument 1-100 includes 4 channels, 16 gates per channel and is capable to operate for 2 hours. Two batteries (with hot swift replacement) will ensure continuous operation for 8 hours and more.
The inspection equipment utilized digital hardware technology intended for massive data collection, analysis and storage of large volumes of input ultrasonic (UT) signals.
During-on-line inspection, A-scan image of each channel is displayed on the monitor. This A-scan image may capture and store as and when required.
The system is PC-based with a large measurement capability, of built-in flexibility for expansion in the number of inspection channels.
The technical specification of the i-100 is detailed below:
Ultrasonic Instrument i-100 - Technicat Specification
OveraN Analog Performance
Analog bandwidth Calibrated gain Gain step size Equivalent input noise Linearity

Channels
Number of channels Channel expansion capability Channel triggering
Pulser characteristics
W P 3 ) Excitation Amplitude Max pulse amplitude, 50Qload PRF per channel Damping Stability Flatness Mode Pulse fall time Single pulse width Pulse width resolution Burst mode pulse width Isolation (PERT)
Pream~lifier characteristics Programmable gain
Freauencv filters Number and type of filters
Time base Range
Delay Resolution ')
Hardware gates Number per channel Range Delay and range Resolution ') Peak detection Alarm threshold Dynamic gate
D AC Dynamic range Amplitude resolution Range Time base resolution Position resolution Slew rate Interpolation
' " , '.,' 1 t 3 <-.,
?. Up to 8 channels. . , I. . + .
Internal or external s/\ .+
Square wave 8 levels 350V + 10% 1 to 10,000Hz 8 settings + - 2% FSH +0.5dB FE, TT <5nsec 10-500nsec 1 nsec 120-500nsec <65dB @ 5MHz
7 fixed, 1 variable
0 to 640 pec 1 Onsec
4, expandable to 32 60nsec to 640 pec 120nsec to 640 pec lOnsec Positive, negative or absolute Positive or negative going Back wall echo tracking in last gate
5OdB 0.2dB 160nsec - lmsec '
160nex IOnsec (first step) 20dB/160nsec Linear between calibration points

Lost gate attenuator To 50dB
Analog. to digital conversion Resolution Sampling rates High speed buffer
8 bit 12.5,25, 50, 100 msps, single shot IMbyte
Data awuisition speed Peak amplitude and time of flight Up to 10M measurementdsec Peak amplitude and time of flight Up to 10M measurementdsec
Data storage and display Hard disc drive 6Gbyte Built-in display (standard) 10.4" high brightness TFT color Control device Keyboard, mouse or trackball
Interfaces Hardware External VGA
USB Parallel Ethernet Dual VO
Software To extend mass-storage services
General Power requirements 115V or 230V + 10%
48-63% 250VA Operating temperature range 5 to 45Oc Humidity <95% non-condensing
The software is identical to the SFB-100 software
6.8 Alarm monitor
The unit is provided with a built in monitor, alarm display and audible sound for detection of flaws by each channel. Any drop of back wall echo for individual rails is indicated by the alarms as well.

Visit to H i ~ h Speed SPURT car in German Railwavs
A team of five RDSO officials visited Germany to have first hand experience to see the testing and post testing analysis of data collected during SPURT car run in connection with the ultrasonic flaw detection by the High Speed SPURT Car SFB/lOO/NT. The SPURT car to German Railways has been supplied by M/s Scanblaster (IRT), Israel.
Two days were spent by the team at DB processing center in Minden where mainly the post processing work of the testing by the High Speed SPURT Car is done. There are five processing computers and one receiver data computer dedicated for the post-processing work.
0 Day to day testing report is sent by the chief supervisor of the supervisor
through E-mail and the data received in DB ~rocessine center with File No. - u
mentioning year, month, day and incrementingdecrementing kilometer. In the DB processing center, post- processing work is done for about 80 kilometer in one day.
DB is using all the probes except 55' probe. DB is not resorting to any online reporting and on-line paint marking at defect locations. They detect the defects by offline processing. The reports of tested track stretch is sent within eleven days to the field after post processing in the center. The filed unit then takes up follow up testing to confirm and classify defects.

For marking the distance to correlate the defects on the ground, an optical encoder has been provided. The km and hectometer locations can be punched through event marker. Also, the various track features such as level crossing, point and crossing, station buildings, bridge locations, curve locations etc. can be fed during the run.
Figure 7.2 Event & distance marking instrument of DB railway
There is one repairing workshop also in DB processing center. In the workshop, these are probe repairing workshop, electronic module repairs shop and electrical repair workshop. During testing, the probes with wear and tear as well as damaged probes having electrical/electronic defects are repaired in the workshop There is also a procurement section. The material is processed in the DB processing center against the demand given by the testing incharge in the high speed SPURT Car
The SPURT Car goes to the rail test piece for calibration once in approximately six months. The rails with created standard defects have been provided in between Nagdeburg - Burlin section in the station named 'Gerwisch'. All the defects in the rail piece are protected by the clamps etc.
The frequency of testing in DB depends on the speed of the train and G.M.T. The table given below gives the frequency of testing based upon speed criterion.

We accompanied the test run on DB's SPURT car in stuttgurt - Maunheim Hbf and Maunteim Hbf - Frankfurt sections. There were four persons in the SPURT Car and one driver. There was no guard. In the DB Netq there were both side Driver cabin. There were three seats in each cabin. One for the driver, one for the chief supervisor and another for the milestone man There is central cabinet where the operator seats along with a fitter.
Speed
80kmph 80 - 120 kmph 120 - 160 kmph 160 - 230 kmph More than 230 kmph
DB are using the probes oO, 35' forward and backward and 70' forward & backward and 70' skew to defect the horizontal flaws, bolt-hole cracks and transverse cracks and gauge face corner defect respectively. In the workstation, DB has provided Front Camera and Rear Camera.
Frequency of testing
24 months. 72 months 6 months 4 months 2 months.

Figre 7.4 over view of DB railway probe repair shop at Minden
In the transducer camera, when the system is perfect for testing it shows green colour along with the code 01 02, where 01 represents the system is on and 02 is the day. When any problem arises during testing and the car is required to stop for adjustment, the colour turns to red with the code of 02 02, where 02 represents requirements to stop and 02 is the day. The same monitor has also been kept in the driver's cabin. The driver will stop the car accordingly.
The work station is just fitted above the sled. In the floor of work station, these are glasses fitted on either side of operator just above the sled. Therefore, the operator can seen directly the sled through the glass. The other activities in the car are:
- Repair of probes - Filling water - Pulling the probes in the probe holder of the beam - The system is kept ready for testing
The post-testing works are:
- Save the data. - Probes are taken out - Send the report by e-mail
DB are not using the paint system. Thus no paint is sprayed on flaw locations during testing. They are also not using the frog detector system. Water storage capacity is 8000 Its which suffices for 200 km of testing. The fuel tank capacity is 2 nos. tanks 800 Its each and 1 tank of 300 its.

We also observed the working sled. The testing carriage is housed at the under frame of the coach. The sled consists of testing trolley which are lowered and lifted pneumatically and there is a locking arrangement in upward position. The testing trolley consists of 2 nos probe holding beams for left and right rails. The probe holding beam consists of probe holders where the probes are fitted. The probe beam is lowered during testing and lifted during non-testing pneumatically and lateral movement of the probe - beam is controlled electrically. This arrangement are required to keep the probe on the center of the rail axis at the time of testing. To keep the 35' probes at proper sway distance one of the 35' probes can be moved longitudinally which is controlled electrically.
Two cameras were fitted in the front and rear of the car and two cameras were fitted to take the left and right view ofthe sled.