depositors behaviour during the recent crisis · pdf filehow did depositors react to the...
TRANSCRIPT
How did depositors react to the recent crisis?
Evidence from the Central European banking industry1
Iftekhar Hasan Fordham University, New York, e-mail: [email protected]
Krzysztof Jackowicz2
Kozminski University, Warsaw, e-mail [email protected]
Oskar Kowalewski, Warsaw School of Economics, Warsaw, e-mail: [email protected]
Łukasz Kozłowski
BGŻ SA, Warsaw, e-mail: [email protected]
This version: May 2012
Abstract The Central European banking industry is dominated by foreign-owned banks. During the recent crisis, for the first time since the transition, foreign parent companies were frequently in worse financial conditions than their subsidiaries. This situation created a unique opportunity to study new aspects of depositor discipline. In this article, we investigate whether depositors flexibly accommodated to the changing sources of risk. We also analyse the informational foundations of depositors’ decisions. Using a comprehensive data set, we find that in Central European countries, the recent crisis did not change the sensitivity of deposit growth rates to accounting risk measures. Additionally, we establish that depositors’ actions are much more strongly influenced by press rumours concerning parent companies than by fundamentals and that public aid announcements are interpreted primarily as confirmation of a parent company’s financial distress. Our results have policy implications and illustrate the importance of reputational capital during periods of crisis.
JEL classification: G21, G28
Keywords: depositor behaviour, market discipline, crisis, emerging markets
1 This research project was supported by Narodowe Centrum Nauki (project N N113 360040, contract 3600/B/H03/2011/40). 2 Corresponding author: Kozminski University, Department of Banking and Finance, Jagiellońska 57/59, 03-301 Warsaw, Poland, email: [email protected]; phone number +48602510995
2
1. Introduction
Banking systems in Central European (CE) countries are dominated by foreign-owned
banks (Allen et al., 2006). As a result, during the recent financial crisis, which originated in
developed economies, financial instability was largely imported to the CE banking industry
from abroad. This phenomenon, which was unprecedented in the history of Central Europe
since the fall of Communism, created a unique opportunity to study new aspects of market
discipline in banking. More specifically, we are able to address important research questions
in the described context, such as whether depositors flexibly react to changing sources of risk,
whether they base decisions on fundamentals or rumours, and whether depositors’ decisions
are affected by the public aid received by certain foreign parent companies.
Our study uses a large data set on the commercial banks operating in 11 CE countries
and their parent companies during the 1994-2009 time period. This data set includes not only
financial statements for each firm but also information regarding parent companies, mass-
media rumours, capital injections, bad loan removals, and emergency loans. The estimation of
dynamic panel models explaining deposit growth rates allows us to reach several interesting
conclusions. In particular, we find that the recent crisis did not change the sensitivity of
deposit growth rates to accounting risk measures. We also establish that depositors’ decisions
are much more strongly influenced by press rumours regarding a parent company’s condition
than by the fundamentals. In addition, we document that public aid is principally interpreted
by depositors as a confirmation of the financial distress of the parent company. More
generally, our study supports, to an extent, the view that depositors monitor banks’ situations
and react to changes in the economic environment. However, our results also illustrate a crude
character of depositor discipline that is in accordance with the previous research of Oliveira et
al. (2011).

3
The article complements the existing empirical evidence on market discipline in banking
in three ways. First, we provide a more comprehensive analysis of depositor discipline in CE
countries than exists in previous studies (Mondschean and Opiela, 1999; Jackowicz, 2004;
Kraft and Galac, 2007). Second, we extend the traditional test of the existence of market
discipline to the direct verification of whether deposit growth rates are affected by factors
connected to a parent company. Third, in the context of developing economies, we provide a
novel assessment of the significance of variables such as market rumours, parent company
fundamentals, and the public aid received by parent companies for depositors’ decisions.
The remainder of the article is organised as follows. Section 2 reviews the literature with
a specific focus on market discipline in emerging markets. Section 3 presents our hypotheses
and econometric model. Section 4 characterises the data set and other sources of information
utilised in this study. In Section 5, we describe and discuss the empirical results. Section 6
provides some robustness checks and Section 7 contains concluding remarks.
2. Literature review
The vast majority of existing studies on depositor discipline address this topic in the
context of mature economies. These studies can be divided into two main categories. The first
category includes research that explores the relationship between bank risk and either deposit
interest rates or interest costs. Hannan and Hanweck (1988), Cargill (1989), Ellis and
Flannery (1992), Kutner (1992), Brewer and Mondschean (1994), Hess and Feng (2007), and
Uchida and Satake (2009) all established that deposit interest rates and interest costs were
connected, in the expected manner, to measures of bank risk or manifestations of risk in bank
activities. In particular, they documented that the deposit interest rates increased as the capital
base of a bank worsened, the standard deviation of bank performance augmented, and the
assets interest rate risk rose. Additionally, they observed that banks with lower ratings and

4
higher shares of speculative financial instruments in their assets were forced to pay higher
interest rate costs. The second category of depositor discipline studies analyses the
disciplinary effect of reduced deposit availability. Billet et al. (1998), Park and Peristiani
(1998), Jordan (2000), Jagtiani and Lemieux (2000), Goldberg and Hudgins (2002), Maechler
and McDill (2006), and Shimizu (2009) demonstrated that banks that were in danger of
bankruptcy did not manage to attract uninsured deposits and that weak banks actively
substituted insured deposits for lost uninsured liabilities. Moreover, these studies found
evidence that signals generated by uninsured depositors pertaining to the critical financial
condition of certain banks could occur as early as two years prior to the actual failure of these
banks.
Though the aforementioned research is certainly important, studies using data from
emerging markets are more relevant to the current investigation. Hosono (2005) demonstrated
that a solid capital base and high profitability lowered deposit interest costs paid by Korean,
Indonesian, Malaysian, and Thai banks. Somewhat surprisingly, however, the same
independent variables were insignificant in regression models explaining the growth of
deposit volumes. Hadad et al. (2011) also found evidence of market discipline in Indonesia,
where higher deposit rates were associated with higher default and liquidity risks. The
mechanisms of depositor discipline in Latin American countries were studied by several
authors. Barajas and Steiner (2000), in contrast to Hosono (2005), established that Columbian
banks were disciplined by alterations in real deposit growth rates but not by interest costs. In
addition, they noticed that banks recording low inflows of deposits improved their capital
base and augmented their loan loss provisions in the next period. This last observation can be
interpreted as an indication of the effectiveness of depositor discipline. Peria and Schmukler
(2001) demonstrated that deposit volumes were negatively correlated and deposit interest cost
was positively correlated with accounting measures of bank risk in Argentina, Chile, and
5
Mexico. Interestingly, in these countries, disciplining signals were generated by both
uninsured and insured depositors. This phenomenon can be explained by the limited
credibility of the safety nets in those nations. Calomiris and Powell (2001) confirmed that
depositors monitored the risk-taking activities of private banks in Argentina during the last
years of the 20th century. Ioannidou and Penas (2010) established that the introduction of the
explicit deposit insurance system in Bolivia diminished the market discipline exercised by
large depositors. Prior to the introduction of this system, banks with a higher share of large
deposits took less risk, whereas after the introduction, this effect vanished.
In accordance with the conclusions reached by Ioannidou and Penas (2010),
Mondschean and Opiela (1999) observed that the introduction of an explicit deposit insurance
system weakened depositor discipline in Poland. In addition, Jackowicz (2004) showed that
banks in Poland were disciplined mainly by deposit interest costs, a similar conclusion to the
findings of Hosono (2005). Kraft and Galac (2007) provided evidence that in Croatia, banks
were able to increase deposit growth by raising interest rates in the period immediately
preceding the 1998-1999 crisis. Additionally, they showed that Croatian depositors were
relatively slow to link high deposit rates to increased portfolio risk. Önder and Özyildirim
(2008) found that depositors in Turkey reacted negatively to bank risks even after the
introduction of full coverage in 1994. Moreover, they documented that depositor discipline
did not discourage Turkish banks from pursuing moral hazard behaviours. The observation
that deposit insurance systems in developing countries are frequently seen as not fully
credible, made by Önder and Özyildrim (2008) and Peria and Schmukler (2001), is further
confirmed by Prean and Stix (2011), who analysed survey data to conclude that Croatian
depositors perceived the safety of their deposits to be relatively low during the 2007-2009
time period.

6
Another distinct group of studies investigate whether crisis and crisis experience
influence depositors’ behaviours. Opiela (2004) demonstrated that in the 18 month period
directly preceding the 1997 crisis in Thailand, depositors monitored banks and finance
companies more closely. Levy-Yeyati et al. (2004) established that during crisis periods in
Argentina and Uruguay, depositors’ sensitivity to macroeconomic risks increased. At the
same time, however, depositors’ sensitivity to bank-specific factors diminished. Kraft and
Galac (2007) demonstrated that during the 1998-1999 crisis in Croatia, the interest-rate
elasticity of deposits completely vanished, and the phenomenon of a flight to quality occurred.
Oliveira et al. (2011) found that during the recent crisis in Brazil, banks in that nation that
were viewed as systemically important components of the financial system recorded a
substantial increase in uninsured deposits, whereas the other Brazilian banks lost uninsured
deposits. Forssbaeck (2011) found, using a large sample of banks from developed and
emerging economies, that there was no proof of augmented market discipline during crisis
periods. The majority of reviewed studies concludes thus that during crises depositors
exhibited rather low sensitivity to banks fundamentals.
The existing evidence regarding medium- and long-term effects of crisis experience on
depositor discipline is inconclusive. Peria and Schmukler (2001) showed that in Latin
American countries, the sensitivity of deposit growth rates and deposit interest costs to bank
risk measures was augmented in the post-crisis periods. However, Hosono et al. (2005) did
not confirm the existence of this change, which is known as the wake-up-call effect. Instead,
they demonstrated that in Korea, Malaysia, and Thailand, the sensitivity of deposit volumes
and interest costs to bank fundamentals actually declined after 1998.
In summary, the existing literature confirms that market participants do monitor the risk-
taking activities of banks. In emerging economies, disciplining signals are generated by both
insured and uninsured depositors, likely as a result of the limited credibility of safety nets.
7
However, the existing literature does not answer the fundamental question of whether
strengthened market discipline would be sufficient to maintain the stability of the banking
system. Furthermore, the functioning of market discipline during periods of crisis is still
relatively poorly understood.
3. Hypotheses and empirical strategy
We build an empirical strategy based upon the existing evidence and the specific
situation in CE countries during the recent crisis. We start our analysis with a traditional test
of depositor discipline existence. More specifically, we verify hypothesis H1.
H1: In the CE countries, bank risk measures are negatively related to the growth of deposit
volumes.
The recent crisis could seriously alter the functioning of depositor discipline. On the one
hand, increased risk may result in augmented sensitivity of deposit volume and interest costs
to accounting risk measures. On the other hand, however, the response to the crisis in the form
of extended or blanket guarantees (FSB 2009; FSB 2010) should considerably diminish the
disciplining role of depositors’ actions. Based on purely theoretical grounds, it is difficult to
forecast which of the two effects identified above is stronger. As a consequence, we test
hypothesis H2 in the following form.
H2: During the recent crisis, the sensitivity of deposit volume to accounting measures of bank
risks in the CE countries was different than it was during the other periods studied.
From 2007 onward, the instability in the CE banking industry was mainly imported
from developed countries. Therefore, if market discipline reacts flexibly to changing market
conditions (as its proponents claim), the competitive position of foreign-owned banks
controlled by financially distressed owners should be negatively affected. This line of
reasoning produces the following hypothesis H3 for testing:

8
H3: During the recent crisis in the CE countries, foreign-owned banks controlled by
distressed owners had difficulties in attracting new deposits.
The anxiety regarding the financial health of foreign-owned banks might encourage
certain depositors to withdraw their funds and search for safer investment opportunities. In the
CE countries, one source for such opportunities was the offers of state-owned banks. In the
majority of cases, these banks maintained a traditional banking business model. As a result,
these institutions were relatively unaffected by the recent crisis. This reasoning leads us to the
formulation of hypothesis H4.
H4: The uncertain financial conditions of foreign banks enabled state-owned banks in the CE
countries to record higher deposit growth than other banks during the recent crisis.
Depositors are usually unsophisticated investors. We can therefore assume that their
investment decisions are influenced more by mass-media rumours than by bank fundamentals.
Even the small group of sophisticated depositors is forced to take mass-media rumours into
account because this group is aware of the simple decision-making processes applied by the
majority of bank depositors. In the context of the recent crisis and the CE banking industry,
these arguments permit us to formulate hypothesis H5.
H5: During the recent crisis, depositors’ behaviour was more strongly influenced by rumours
concerning the financial health of foreign parent companies than by the financial
fundamentals of these foreign parent companies.
Many parent companies of banks operating in the CE countries received state aid during
the recent period of crisis. On the one hand, this aid should stabilise the situation of the parent
company and its subsidiaries. On the other hand, negative press coverage accompanying
capital injections and other forms of public assistance may damage the reputation of a bank
and thereby sap the confidence of its depositors. The net impact of public aid on depositors’
9
decisions is thus an open question. Hypothesis H6 assumes that the two effects offset each
other perfectly or near perfectly.
H6: Public aid received by parent companies does not significantly influence the deposit
dynamics recorded by the CE banking subsidiaries.
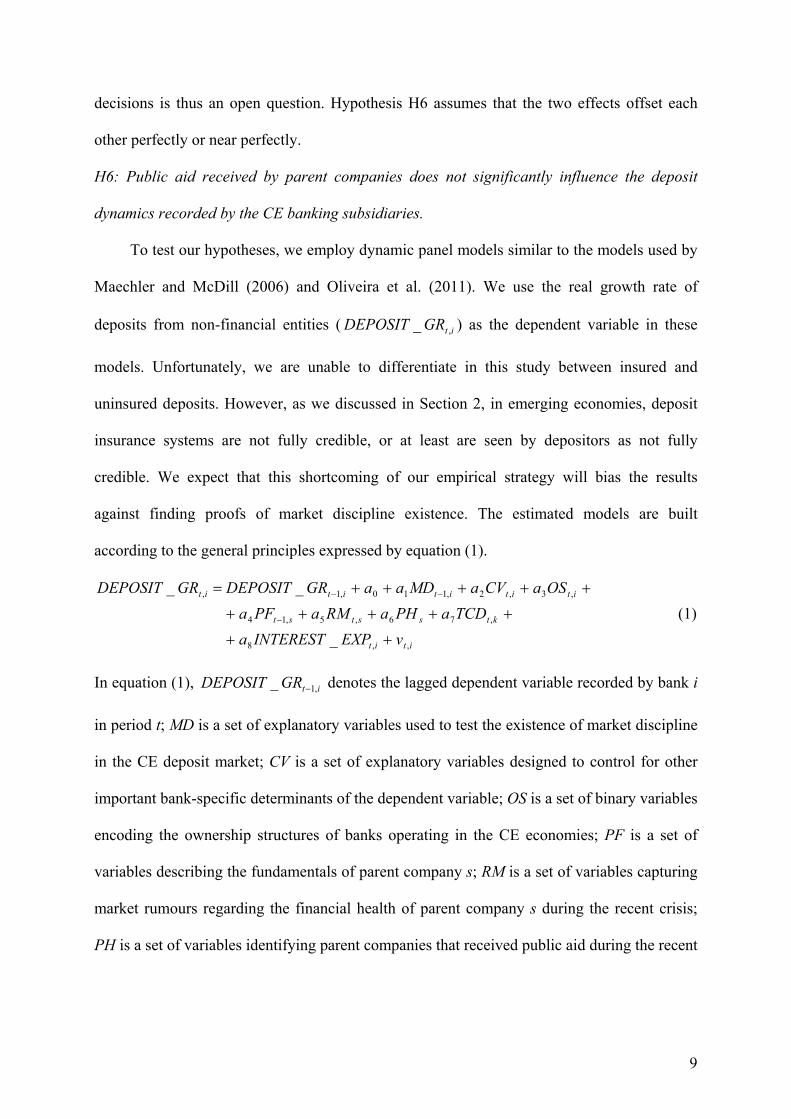
To test our hypotheses, we employ dynamic panel models similar to the models used by
Maechler and McDill (2006) and Oliveira et al. (2011). We use the real growth rate of
deposits from non-financial entities ( itGRDEPOSIT ,_ ) as the dependent variable in these
models. Unfortunately, we are unable to differentiate in this study between insured and
uninsured deposits. However, as we discussed in Section 2, in emerging economies, deposit
insurance systems are not fully credible, or at least are seen by depositors as not fully
credible. We expect that this shortcoming of our empirical strategy will bias the results
against finding proofs of market discipline existence. The estimated models are built
according to the general principles expressed by equation (1).
itit
ktsstst
ititititit
vEXPINTERESTaTCDaPHaRMaPFa
OSaCVaMDaaGRDEPOSITGRDEPOSIT
,,8
,76,5,14
,3,2,110,1,
_
__
++
+++++
+++++=
−
−−
(1)
In equation (1), itGRDEPOSIT ,1_ − denotes the lagged dependent variable recorded by bank i
in period t; MD is a set of explanatory variables used to test the existence of market discipline
in the CE deposit market; CV is a set of explanatory variables designed to control for other
important bank-specific determinants of the dependent variable; OS is a set of binary variables
encoding the ownership structures of banks operating in the CE economies; PF is a set of
variables describing the fundamentals of parent company s; RM is a set of variables capturing
market rumours regarding the financial health of parent company s during the recent crisis;
PH is a set of variables identifying parent companies that received public aid during the recent
10
crisis; and itEXPINTEREST ,_ is a variable reflecting bank interest costs. Model (1) also
includes dummies controlling for specific conditions in year t in country k (TCD).
The model parameters are estimated using the Generalised Method of Moments (GMM-
SYS) procedure proposed by Blundell and Bond (1998). This method was previously used in
the context of market discipline testing, such as that conducted by Hadad et al. (2011) and
Oliveira et al. (2011). In contrast to other panel model estimators (such as the fixed effects or
random effects estimators), the GMM-SYS enables us to remove the strict exogeneity
assumption for regressors and thus to include the lagged dependent variable among these
regressors. In our research, we assume that most of the bank fundamentals are correlated with
the past shocks to the dependent variable. Because the removal of the strict exogeneity
assumption implies that the feedback effect running from the dependent variable to the other
variables is allowed, we permit the regressors mentioned above to be only sequentially
exogenous. We therefore use suitably lagged values of these regressors as instrumental
variables in the equations in first differences and the first differences of these regressors in the
equations in levels. Other regressors, including binary variables encoding the ownership
structures, variables describing the fundamentals of the parent company, variables capturing
market rumours concerning the parent company, variables identifying parent companies that
received public aid, and time and country dummy variables, are treated as strictly exogenous.
We base our statistical inferences regarding the significance of parameters on the one-
step estimator, as simulations performed by Arellano and Bond (1991) and Blundell and Bond
(1998) suggest that the asymptotic standard errors for the two-step estimator can be a poor
guide for hypothesis testing, especially in case of heteroscedastic error components. The
appropriateness of a set of instruments we use is formally evaluated by the Sargan test of
overidentifying restrictions and the Arellano-Bond test for error autocorrelation. We compute
the Sargan test using the two-step GMM-SYS estimator, as the Sargan test based on the one-

11
step estimator is not heteroscedasticity-consistent (Arellano and Bond, 1991; Doornik and
Hendry, 2009).
Table 1 presents the construction of the independent variables in detail. Hence, we will
concentrate our analysis on two topics: the expected influence of these variables and their
connection with the hypotheses. We use three bank-specific variables to test H1. If depositors
observe bank risk, high profitability (OROA) and solid capital base (EQUITY) should increase
deposit growth rates. In contrast, an elevated share of risky assets (LOANS) should have a
negative impact on the dependent variable. To check whether deposit volume sensitivity
changed during the recent crisis (i.e., to verify H2), we examine interactions of the OROA,
EQUITY, and LOANS variables with the binary variable CRISIS that encodes the years from
2007 to 2009.
The quality of our depositor discipline tests depends critically on the composition of the
set of variables controlling for other important deposit growth rate determinants. This set is
composed of three elements. First, as equation (1) indicates, we introduce the lagged
dependent variable (DEPOSIT_GR) and the variable reflecting contemporaneous interest
costs (INTEREST_EXP). We assume that inertia in deposit inflows and moral hazard will
result in positive signs of the coefficients estimated for these variables. Second, we control for
bank characteristics, such as the quality of management (CIR), the dominating retail or
wholesale component of activities (NCI_SHARE and RELAT_FIXED_ASSETS) and the scale
of operations (ASSETS). We expect positive signs of parameters for ASSETS and
RELAT_FIXED_ASSETS, and a negative sign of the coefficient for NCI_SHARE because
large and retail banks usually report more rapid deposit growth rates than other banks. The
lack of strict control of non-interest costs (i.e., high CIR values) is a trait of bad management
and thus should be negatively correlated with the dependent variable. Third, the literature on
privatisation and on ownership significance in developing economies suggests that foreign-

12
owned banks follow more aggressive growth strategies and that government-owned banks
suffer from corporate governance problems (Shleifer, 1998; Haas and van Lelyveld, 2006;
Haselman, 2006). Therefore, we forecast that, ceteris paribus, foreign-owned banks (FGN)
should attract more deposits than private domestic banks, whereas government-controlled
banks (GOV) should attract fewer deposits than private domestic banks. In addition, the
interactions of the ownership dummy variables with the CRISIS variable provide us with an
opportunity to test H4.
As we mentioned earlier, CE banking systems, which are dominated by foreign-owned
entities, constitute an ideal laboratory for the study of the impact of parent companies’
financial conditions on subsidiaries’ chances to successfully compete in deposit markets. The
market discipline theory implies that subsidiaries controlled by parent companies with a solid
capital base (PAR_EQUITY), high profitability (PAR_ROA), and low share of risky assets
(PAR_LOANS) should enjoy more favourable deposit growth rates. Similarly, growth in
profitability (PAR_ROA_GROTWH) or in a capital base (PAR_EQUITY_GROWTH) should
produce higher deposit inflows. Because parent company fundamentals are most likely
directly observed only by a very limited number of depositors, we include in our regressions
three variables describing mass-media rumours regarding the financial health of parent
companies. The first variable is based on the percentage of negative pieces of information out
of the total media coverage (PAR_NEG_COV). The second (PAR_NEG_COV_50) and third
(PAR_NUM_NEG_50) are binary variables identifying the parent companies that rank among
the 50% of parent companies with the highest proportion of negative coverage and among the
50% of parent companies with the highest number of negative pieces of information,
respectively. We expect that all the variables based on rumours will affect deposit dynamics
negatively. The use of several variables indicating the condition of parent companies allows
us to thoroughly test H3 and H5.
13
As we explained earlier, the influence of the state aid received by certain foreign parent
companies on depositors’ decisions is theoretically ambiguous in CE countries. H6 claims that
the positive and negative effects of state aid will offset. To fully investigate the role of state
aid, we define three binary variables. These variables identify the parent companies that
received public help, but they differ in the assumed time frames of the public aid effects. For
the group of parent companies that received public aid, the first variable (PAR_HELP1)
equals one for all years of the recent crisis, the second (PAR_HELP2) equals one for the year
in which the public aid occurred and all subsequent years, and the third (PAR_HELP3) equals
one only for the year in which the aid occurred.
[Table 1 here]
4. Data set
Our study spans the period from 1994 to 2009 and addresses the commercial banks
operating in Bulgaria, Croatia, the Czech Republic, Estonia, Hungary, Latvia, Lithuania,
Poland, Romania, Slovakia, and Slovenia. We use the abbreviation “banks” for these entities.
All of the bank-specific financial information was obtained from the BankScope database.
Based on these data, we constructed a panel of 4125 bank-year observations for 416 banks.
With regard to the information on bank ownership structures we updated previous findings by
Bonin et al. (2005), Fristch et al. (2007), and Jackowicz et al. (2011) using the annual reports
of banks, official publications of regulatory bodies, and articles in various newspapers. In the
final data set, we have 2136 bank-year observations for banks controlled by foreign investors,
754 observations for government-owned banks, and 1235 observations for banks owned by
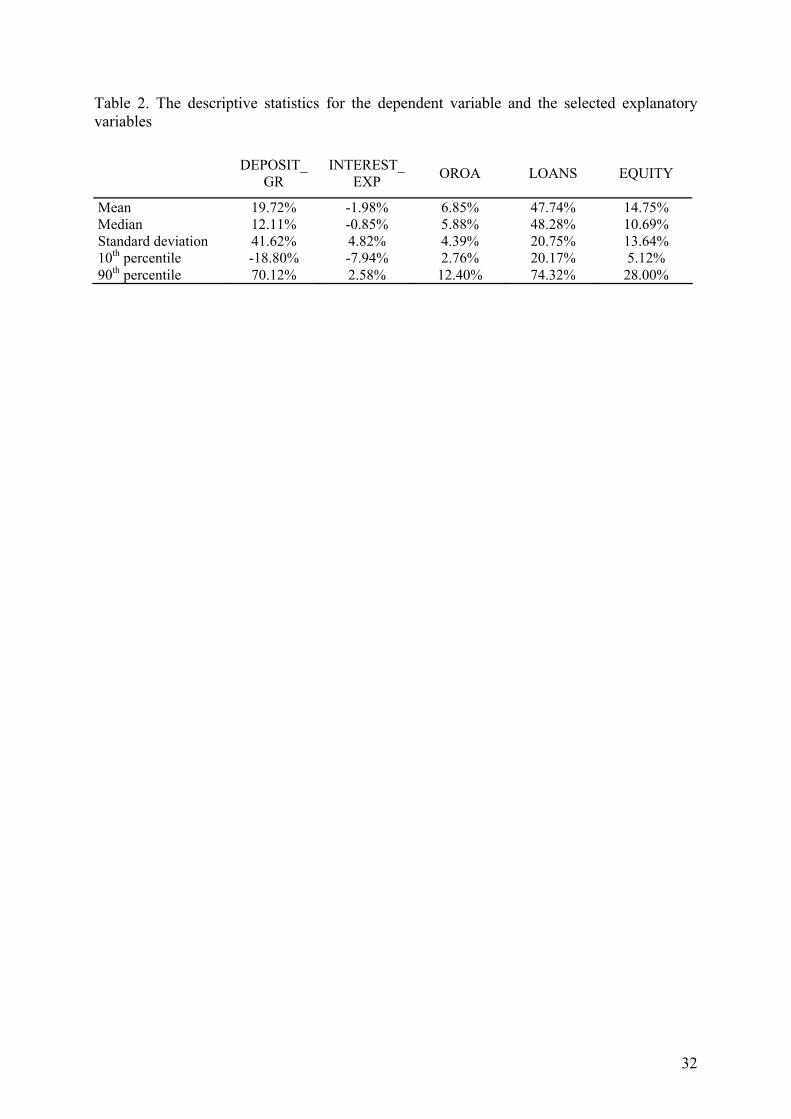
private domestic investors. Table 2 presents the descriptive statistics for the dependent
variable and selected explanatory variables.
[Table 2 here]

14
The mean and median values of the real deposit growth rate are equal to 19.27% and
12.11%, respectively. The distribution of the real deposit growth rate is also characterised by
a high standard deviation. For a majority of banks, the interest cost ratios expressed in real
terms are negative, which means that bank deposits in the CE countries offered only weak
protection against inflation. The average share of the loans to non-financial companies
amounts to 48%. The median value of the LOANS variable is almost identical. The mean and
median returns on assets measured on the level of operating income are equal to 6.85% and
5.88%, respectively. The standard deviation calculated for OROA is relatively small, in
contrast to the standard deviation for real deposit growth rates. The median bank in our
sample financed 10.69% of its assets with equity capital.
For the foreign-owned banks, we identified the majority shareholders. We concentrated
our analysis on financial parent companies for two reasons. First, financial owners are by far
the most important category of foreign owners in CE countries. Second, this group of owners
was the most severely impacted by the recent financial crisis. We managed to identify 93
financial parent companies. Because many parent companies exercised control over multiple
subsidiaries for prolonged periods, we have at our disposal 1893 parent-subsidiary-year
observations. The remainder of the observations for the foreign-owned banks concerns banks
possessed by non-financial companies, banks with dispersed shareholders, banks owned by
wealthy individuals or banks with missing detailed data on ownership structure. The figure 1
shows the number of parent companies with an average yearly number of controlled
subsidiaries comprised within a given range. We find that the number of parent companies
controlling more than three subsidiaries in the CE countries each year is quite limited.
[Figure 1 here]
We retrieved the financial statements of parent companies also from the BankScope
database. Table 3 provides the descriptive statistics for the parent companies. The owners are

15
characterised by significantly lower equity levels than the banks operating in CE countries.
By contrast, the mean and median shares of loans in parent company assets are higher and
exceed 53%. The average long-term profitability for the parent companies is low. The mean
and median returns on assets, as measured on the level of net income, do not surpass 1%.
[Table 3 here]
To test H3 and H5, we needed information regarding market rumours. We accessed and
utilised the Reuters news service for this purpose. First, we identified the total number of
pieces of information concerning a given parent company during each year of the recent
crisis. Next, we determined the number and share of negative pieces of information. We
classified a piece of information as negative when it contained at least one of the following
key words or phrases: loss, capital injection, state aid, restructuring or emergency. We
acknowledge that our automated procedures may lead to erroneous classifications. However,
we manually verified the quality of classifications for a small subsample of parent companies,
for which the automated procedures described above worked quite well.
We compiled the information on public aid received by parent companies from several
sources. Our main sources were the reports prepared by the Bank for International Settlements
(2009) and the Office of the Special Inspector General for the Troubled Asset Relief Program
(2009). These sources were verified and complemented by articles from The Banker and
information contained in parent companies’ annual reports. We considered several different
forms of public aid, namely, stock purchases, troubled asset removals, and the granting of
emergency loans.
The information on changes in safety net arrangements in CE countries was derived
from the Financial Stability Board publications (2009; 2010). These sources were verified
and complemented by information available on the Internet.
16
In Sections 5 and 6, the actual number of bank-year observations drops below 3000.
There are three reasons for this decrease. First, our econometric approach relies on lagged
variables and instruments. As a result, banks with only a short time series are eliminated.
Second, certain values of the explanatory variables are missing due to shortcomings of the
BankScope database. Third, clearly erroneous values of the explanatory variables were
eliminated from the sample, such as values of the ASSETS variable that were higher than the
ratio of banking system assets to GDP in a given country.
5. Empirical results
In Table 4, we investigate the question of whether the fundamentals of banks and
foreign parent companies affect the growth of deposits. As Table 1 documents, our models
possess good econometric properties. In all specifications in the Sargan test, we cannot reject
the null hypothesis regarding the validity of the instruments. The critical assumption of no
serial correlation in the disturbances ( itv , ) is fulfilled in this study. As required by this
assumption, we find significant negative first order serial correlation in the differenced
residuals (the AR(1) test), and no evidence of second order serial correlation in the
differenced residuals (the AR(2) test). Independent variables (excluding time and country
dummies) are jointly statistically significant at the level lower than 1%. In addition, usually at
least five variables are individually significant.
The bank-specific control variables only partially influence the deposit growth in the
expected directions. The poorly managed banks with high values of the CIR variable record
lower deposit dynamics by a statistically significant margin. The large banks attract more
deposits but this effect is not statistically significant in all specifications presented in Table 1.
Interestingly, the deposit growth is also slower for retail banks, as the estimated coefficient
for the RELAT_FIXED_ASSETS variable is negative and significant. This outcome can be

17
explained by the more cautious growth strategies followed by retail banks in comparison with
wholesale banks and banks with more balanced structures of activities. The lagged dependent
variable and the contemporaneous interest cost ratio, as forecasted, positively impact the
deposit growth. However, this influence is not statistically significant. Therefore, contrary to
Kraft and Galac (2007), we do not find evidence that banks in CE countries are able to fund
rapid expansion by offering high deposit rates.
The results of H1 verification are mixed. Two observations support the hypothesis that
depositors discipline banks’ decisions in the CE countries. First, the equity levels are
positively related to the growth of deposits. Moreover, the coefficients obtained for EQUITY
variable are stable and significant at the levels lower than 1%. Second, there is some evidence
that more profitable banks report higher deposit growth rates. The OROA variable is
significant at the conventional levels only in two out of nine specifications in Table 1, but in
the remaining specifications, the p-values are close to the 10% threshold. Contrary to the
expectations based on the market discipline theory, the share of loans in assets influences the
dependent variable positively and significantly. This relationship can be interpreted as proof
of weakness in market discipline. Alternatively, the positive parameter for the LOANS
variable can be explained by the fact that banks that adhere to more aggressive investment
policies also pursue more aggressive growth strategies. Summarizing, we establish that traces
of depositor discipline are detectable in emerging markets even when the vast majority of
depositors is formally insured. This result is similar to those obtained by Peria and Schmukler
(2001), Jackowicz (2004), and Önder and Özyildrim (2008).
The relationships between bank fundamentals and deposit growth rates remain
unchanged when we introduce (in specification 2) the following interaction terms:
EQUITY_x_CRISIS, OROA_x_CRISIS, and LOANS_x_CRISIS. All the coefficients estimated
for the interaction terms are insignificant. This outcome falsifies H2 and suggests that the

18
recent crisis did not alter the sensitivity of deposit growth ratios to accounting bank risk
measures.
The coefficients obtained for the GOV variable are negative and for the FGN variable
positive in all specifications. However, in the entire sample the ownership structure does not
influence deposit growth statistically significantly. The results, therefore, do not support the
view that foreign-owned banks enjoy a reputational advantage in CE countries (Kraft and
Galac, 2007). Our conclusions are the same when we allow the coefficients for the GOV and
FGN variables to take different values during the recent crisis, as the interaction terms
GOV_x_CRISIS and FGN_x_CRISIS are also insignificant (specification 3). This evidence
proves that the recent crisis did not indiscriminately worsen the situation of foreign-owned
banks and improve the situation of state-owned banks. The empirical results thus contradict
H4.
Specifications (4), (5), and (6) in Table 4 demonstrate that in the CE countries, foreign
parent company fundamentals generally do not influence depositors’ decisions. During the
recent crisis, this outcome changes only slightly. In specifications (7), the parent company
equity level starts to influence positively and significantly deposit growth recorded by a
subsidiary. The remainder of the variables illustrating parent company financial health remain
insignificant. The evidence that during the recent crisis foreign-owned banks controlled by
distressed owners had difficulties in attracting new deposits (as stated in H3) is therefore very
weak when we use fundamentals to identify distressed parent companies.
[Table 4 here]
In Table 5, we turn our attention to the role of rumours concerning the parent company’s
financial situation. As Table 5 documents, our models again possess good econometric
properties, thus implying that the estimates create a good base from which to draw inferences.

19
In this table, the variables pertaining to banks operating in the CE countries change neither
their directions of influence nor their strength of impact on deposit growth ratios. We observe
only three minor differences in this table in comparison with Table 4. First, the OROA
variable more frequently significantly augments the deposit growth ratios. Second, the
variable measuring banks’ scale of operations is statistically significant in all specifications.
Third, in specifications (11) and (12), we find that foreign-owned banks in general are
characterised by higher deposit growth rates.
During non-crisis periods, parent companies’ fundamentals remain insignificant. By
contrast, in the last three years of the studied period, as specifications (16) – (18) document,
the capital base and profitability of a parent company are statistically significantly related to
subsidiaries’ deposits growth when we control for the influence of rumours. Although the
PAR_EQUITY_x_CRISIS variable influences the dependent variable in the expected direction,
the sign of the coefficient for PAR_ROA_x_CRISIS variable is at odds with that predicted by
the traditional market discipline theory. The latter variable is, however, statistically significant
only at the 10% level.
In Table 5, we establish that rumours regarding the conditions of foreign parent
companies played an important role during the recent crisis. Regardless of the methods we use
to measure rumours, the independent variables based on rumours are significant at the 1%
level. The significance of these variables does not diminish when we control for parent
companies’ fundamentals in the entire sample (specifications (13) - (15)), nor is it affected
when we allow parent companies’ fundamentals to influence deposit growth rates in a
different manner during the recent crisis (specifications (16) - (18)). The impact of rumours
on deposit dynamics is also economically significant. Ceteris paribus, a ten percentage points
rise in the negative coverage results in a deposit growth rate that is almost three percentage
points lower. Having a parent company classified among the 50% of parent companies with

20
the highest negative coverage percentages or the highest number of negative pieces of
information translates, again, ceteris paribus, into deposit growth rates that are reduced by
almost 18 percentage points and 15 percentage points, respectively.
Thus, we conclude that rumours pertaining to the conditions of foreign-parent
companies possess a significant autonomous role in explaining depositors’ behaviour.
Moreover, during the crisis, the negative influence of rumours is stronger and more stable
than the impact of parent companies’ fundamentals. In summary, our evidence supports H5
and H3 when we utilise a rumour-based definition of distressed parent companies. Our results
therefore corroborate previous findings by Levy-Yeyati et al. (2004) and Forssbaeck (2011).
[Table 5 here]
Table 6 presents the empirical results regarding the importance of public aid received by
certain parent companies included in our sample. The econometric properties of the estimated
models as well as the coefficient signs and significance levels for bank-specific variables
remain unchanged.
In general terms, public help is interpreted by depositors as a confirmation that the
parent company is encountering financial difficulties. The coefficients estimated for the
PAR_HELP1, PAR_HELP2, and PAR_HELP3 variables are always negative. However, these
coefficients are statistically significant only in five out of nine cases. The results in Table 6, in
contrast to the evidence concerning market rumours, therefore display a sensitivity to the
method by which we encode public aid and construct models. According to specifications
(20) and (21), ceteris paribus, public aid received by the parent company lowers the deposit
growth rates recorded by a subsidiary by approximately 13 percentage points in the year of
public aid announcements and for subsequent years. The inclusion of variables illustrating
parent company fundamentals in specification (23) and (24) does not modify this outcome.
However, interesting changes to our results occur when we allow parent company
21
fundamentals to influence the dependent variable differently for the groups of entities that
received and did not receive public help (specifications (25)-(27)). Under these conditions, the
variable PAR_HELP1 gains statistical significance, whereas the variables PAR_HELP2 and
PAR_HELP3 lose their significance. At the same time, we establish that a relatively healthy
capital base of parent companies that received public aid has a significant positive influence
on the deposit growth rates reported by its subsidiaries operating in the CE countries
(specifications (25) and (27)).
The empirical evidence contained in Table 6 therefore contradicts H6. Public aid
received by a parent company constitutes a negative piece of information, at least as far as the
deposit growth rates recorded by its subsidiaries are concerned. Moreover, our results suggest
that when we control for parent companies’ fundamentals during the recent crisis, mass-media
rumours provide more incremental information than do public aid announcements.
[Table 6 here]
6. Robustness checks
We perform three robustness checks. First, we verify whether our results are sensitive to
the estimation procedure. For this purpose, we estimate random effects versions of our
dynamic panel models. Table 7 shows that our results exhibit moderate sensitivity to the
choice of estimation procedure. The results confirm previous findings that deposit growth is
strongly negatively affected by mass media rumours about the financial health of parent
companies. The same applies to the informational content of public help announcements
because the coefficients estimated for the variables PAR_HELP1, PAR_HELP2, and
PAR_HELP3 are negative and statistically significant, as in Section 5. Parent companies’
fundamentals remain unimportant for depositors’ decisions in CE countries. The most
noticeable changes concern bank-specific variables. The outcome of the traditional market

22
discipline test is less ambiguous. According to the results in Table 7, banks with a stronger
capital base and higher profitability have statistically significantly easier access to the deposit
market. When we substitute static panel models for dynamic models, the variables describing
deposit interest costs and lagged deposit growth gain statistical significance. Moreover, these
variables impact the dependent variable in the expected directions.
[Table 7 here]
Second, in Table 8, we replace the lagged variables describing the risk of parent
companies and banks with contemporaneous variables. This exercise does not change our
conclusion concerning the role of mass media rumours and public aid announcements. Parent
companies’ fundamentals still do not play an important role in depositors’ decision-making
processes. However, in Table 8, there is an indication (specification 36) that during the recent
crisis, a strong capital base of a parent company, as in specification (7), was positively
correlated with the deposit growth ratios recorded by its subsidiaries. Similar to the first
robustness check, the most interesting changes occur with regard to bank-specific variables.
As predicted by the market discipline theory, banks with riskier assets and lower profitability
attract fewer deposits. The change in the coefficients estimated for the variable EQUITY can
be easily explained by the mechanical balance sheet relationship between the deposit growth
rates and the equity share at the end of a fiscal year. Altogether, the empirical evidence in
Table 8 is more supportive of H1 than is the evidence in Section 5. In contrast to the cases
when we use the lagged variables, the coefficient estimated for the variable INTEREST_EXP
is now positive and statistically significant. This suggests that depositors’ actions in CE
countries are affected by moral hazard.
[Table 8 here]
Third, public authorities in CE countries reacted to the first stage of the recent crisis in a
partially uncoordinated manner. Hence, there is a possibility that differences in safety net
23
changes distort our empirical findings. To account for this factor, we introduce two additional
variables. The variable NONFULLGUAR equals one for countries that did not provide blanket
guarantees for bank liabilities after 2007 and zero otherwise. The binary variable
LOWCOVMULTP identifies countries that were characterised after 2007 by a below-median
increase in deposit insurance limits. We measure the mentioned increase using a coverage
multiplier calculated as a quotient of the coverage limit in a given year to the coverage limit
binding in 2007. To retest the hypotheses, we interact the variables NONFULLGUAR and
LOWCOVMULTP with the variables describing the risk of banks and their ownership
structures. For the sake of brevity, Table 9 presents only selected models controlling for
differences in safety net modifications. The results of the H1, H3, H5, and H6 verifications
remain unchanged. In contrast, the tests of H2 and H4 are fine-tuned by the new empirical
evidence. As specification (43) demonstrates, in the entire sample, the recent crisis did not
increase depositors’ sensitivity to the fundamentals of banks. However, in the sub-group of
countries with low increases in deposit coverage limits, a solid capital base of a bank begins
to play a more important role. As specification (44) indicates, government-owned banks did
not benefit from the uncertainty pertaining to the financial conditions of foreign-owned banks,
with one exception. In countries with low increases in coverage limits, government-controlled
banks reported statistically and economically significant higher deposit growth rates during
the recent crisis.
[Table 9 here]
7. Concluding remarks
In CE countries, depositor discipline is the only potentially viable and universal source
of market discipline in banking, for two reasons. First, the market for banks’ subordinated
debt is virtually nonexistent. Second, only selected banks are listed on regional stock
24
exchanges. In addition, shareholders’ goals do not have to coincide with the interests of either
the public as a whole or depositors in particular (Bliss and Flannery, 2001; Park and
Peristiani, 2001; Gropp and Vesala, 2001). Unfortunately, at least from the perspective of
supplementing regulatory discipline with market discipline, our study shows more weaknesses
than strengths of depositor discipline in CE countries. The evidence that bank accounting risk
measures influence deposit growth rates in socially desired ways is weak. Moreover, the
sensitivity of deposit growth rates to the fundamentals of banks did not augment during the
recent crisis, and the sensitivity to parent companies’ fundamentals increased only marginally.
By contrast, depositors’ decisions during the recent crisis were strongly affected by rumours
spread by the press. Government-owned banks benefited from the uncertainty concerning
foreign-owned banks and their parent companies only in countries with relatively low
increases in deposit insurance limits. Our research results have implications not only for
policymakers, but also for bank managers. These results provide an important reminder that
rumours related to a parent company’s financial situation or the public aid received by a
parent company can seriously reduce deposit growth rates, even for financially healthy
subsidiaries.

25
References
Allen, F., Bartiloro L., Kowalewski, O. (2006), The financial system of the EU 25, in:
Liebscher, K., Christl, J., Mooslechner, P. (Eds.), Financial development, integration
and stability in Central, Eastern and South-Eastern Europe. Edward Elgar, Cheltenham,
p. 80-104.
Arellano M.., Bond S. R. (1991), Some tests of specifications for panel data: Monte Carlo
evidence and an application to employment equations, “Review of Economic Studies”,
Vol. 58, p. 277-297.
Bank for International Settlements (2009), An Assessment of financial sector rescue
programmes, BIS Papers, No. 48.
Barajas A., Steiner R. (2000), Depositor behavior and market discipline in Colombia, IMF
Working Paper, No. WP/00/214.
Billett M.T., Garfinkel J.A., O’Neal E.S. (1998): The cost of market versus regulatory
discipline in banking, “Journal of Financial Economics”, Vol. 48, No. 3, p. 333-358.
Bliss R.R., Flannery M.J. (2001), Market discipline in the governance of U.S. bank holding
companies: Monitorig vs. influencing, p. 107-143 in: F. S. Mishkin, (ed), Prudential
supervision. What works and what doesn’t, The University of Chicago Press, Chicago,
London.
Blundell R.W., Bond S.R. (1998), Initial conditions and moment restrictions in dynamic
panel data models, “Journal of Econometrics”, Vol. 87, p. 115-143.
Bonin, J.P., Hasan, I., Wachtel P. (2005), Bank performance, efficiency and ownership in
transition countries, “Journal of Banking and Finance”, Vol. 29, p. 31–53.
Brewer III E., Mondschean T.H. (1994), An empirical test of the incentive effects of deposit
insurance. The case of junk bonds at savings and loan associations, “Journal of Money,
Credit, and Banking”, Vol. 26, p. 146-164.

26
Calomiris C.W., Powell A. (2001), Can emerging market bank regulators establish credible
discipline? The case of Argentina, 1992-1999, s. 147-191, in: F. S. Mishkin (ed.),
Prudential supervision. What works and what doesn’t, National Bureau of Economic
Research, The University of Chicago Press, Chicago and London.
Cargill T.F. (1989), CAMEL ratings and the CD market, “Journal of Financial Services
Research”, Vol. 3, p. 347-358.
Doornik J.A., Hendry D. F. (2009), Econometric modelling. PcGive 13, Timberlake
Consultants Ltd.
Ellis D.M., Flannery M.J. (1992), Does the debt market assess large banks’ risk? Time series
evidence from money center CDs, “Journal of Monetary Economics”, Vol. 30, p. 481-
502.
Financial Stability Board – FSB (2009), Exit form extraordinary financial sector support
measures. Note for G20 Ministers and Governors meeting 6-7 November 2009.
Financial Stability Board – FSB (2010), Update on unwinding temporary deposit insurance
arrangements. Note by the Staffs of the International Association of Deposit Insurers
and the International Monetary Fund.
Forssbaeck J. (2011), Ownership structure, market discipline, and banks’ risk-taking
incentives under deposit insurance, Journal of Banking and Finance, Vol. 35, p. 266-
2678.
Fritsch, M., Gleisner, F., Holzhäuser, M. (2007), Bank M&A in Central and Eastern Europe,
Working Paper. Available at SSRN: http://ssrn.com/abstract=966294.
Goldberg L.G., Hudgins S.C. (2002), Depositor discipline and changing strategies for
regulating thrift institutions, “Journal of Financial Economics”, Vol. 63, Is. 1, p. 263-
274.

27
Gropp R., Vesala J. (2001), Deposit Insurance and moral hazard: Does the counterfactual
matter ?, European Central Bank, Working Paper Series, No. 47.
Haas de R., van Lelyveld, I. (2006), Foreign banks and credit stability in Central and
Eastern Europe. A panel data analysis, “Journal of Banking and Finance”, Vol. 30, p.
1927-1952.
Hadad M.D., Agusman A., Monroe G. S, Gasbarro D. (2011), Market discipline, financial
crisis and regulatory changes: Evidence from Indonesian banks, “Journal of Banking
and Finance”, Vol. 35, p. 1552-1562.
Hannan T.H., Hanweck G.A. (1988), Bank insolvency risk and the market for large
certificates of deposit, “Journal of Money, Credit and Banking”, Vol. 20, p. 203-211.
Haselmann, R. (2006), Strategies of foreign banks in transition economies, “Emerging
Markets Review”, Vol. 7, p. 283-299.
Hess K., Feng G. (2007), Is there market discipline for New Zealand non-bank financial
institutions, “Journal of International Financial Markets, Institutions & Money”, Vol.
17, p. 326-340.
Hosono K. (2005), Market discipline to banks in Indonesia, the Republic of Korea, Malaysia
and Thailand, Asian Development Bank Institute Conference, Corporate Governance of
Banks in Asia, January 20-21.
Ioannidou V.P., Penas M. F. (2010), Deposit insurance and bank risk-taking: Evidence from
internal loan rating, “Journal of Financial Intermediation”, Vol. 19, p. 95-115.
Jackowicz K. (2004), Dyscyplina rynkowa w bankowości. Rodzaje i możliwości zastosowania
[Market discipline in banking. Types and applications], Wydawnictwo Wyższej Szkoły
Przedsiębiorczości i Zarządzania im. L. Koźmińskiego, Warszawa.
Jackowicz K, Kowalewski O., Kozłowski Ł. (2011), The impact of electoral factors on
commercial banks in CEE countries, Wharton Financial Institutions Center Working

28
Paper No. 11-02. Available at SSRN: http://ssrn.com/abstract=1736289 or
http://dx.doi.org/10.2139/ssrn.1736289
Jagtiani J., Lemieux C. (2000), Stumbling blocks to increasing market discipline in the
banking sector: a note on bond pricing and funding strategy prior to failure, “Emerging
Issues Series”, Supervision and Regulation Department, Federal Reserve Bank of
Chicago, S&R-99-8R.
Jordan J.S. (2000), Depositor discipline at failing banks, “New England Economic Review”,
Federal Reserve Bank of Boston, p. 15-28.
Kraft E., Galac T. (2007), Deposit interest rates, asset risk and bank failure in Croatia,
“Journal of Financial Stability, Vol. 2, p. 312-336.
Kutner G.W. (1992), CD Market response to continental Illinois’ liquidity crisis and its
subsequent bailout, “The Mid-Atlantic Journal of Business”, p. 133-146.
Levy-Yeyati E., Peria M.S.M., Schmukler S. L.. (2004), Market discipline under systemic
risk: Evidence from bank runs in emerging economies, The World Bank Group,
Working Paper No. 3440, October.
Maechler A.M., McDill, K.M. (2006), Dynamic depositor discipline in US banks, “Journal of
Banking & Finance”, Vol. 30, p. 1871-1898.
Mondschean T.S., Opiela T.P. (1999), Bank time deposit rates and market discipline in
Poland: The impact of state ownership and deposit insurance reform, “Journal of
Financial Services Research”, Vol. 15, p. 179-196.
Office of the Special Inspector General for the Troubled Asset Relief Program (2009),
Emergency capital injections provided to support the viability of Bank of America, other
major banks, and the U.S. Financial System, SIGTARP-10-001.

29
Oliveira R.F., Schiozer R.F., Barros L.A.B. (2011), Financial crisis and cross-border too big
to fail perception, Midwest Finance Association 2012 Annual Meetings Paper.
Available at SSRN: http://ssrn.com/abstract=1787661 or http://dx.doi.org/10.2139/ssrn.1787661.
Önder Z., Özyildirim S. (2008), Market Reaction to risky banks: Did generous deposit
guarantee change it ?, “World Developments”, Vol. 36, p. 1415-1435.
Opiela T. (2004), Was there an implicit full guarantee at financial institutions in Thailand ?
Evidence of risk pricing by depositors, “Journal of Comparative Economics”, Vol. 32, p.
519-541.
Park S., Peristiani S. (1998), Market discipline by thrift depositors, “Journal of Money,
Credit, and Banking”, Vol. 30, Is. 3, p. 347-364.
Park S., Peristiani S. (2001) , Are bank shareholders enemies of regulators or a potential
source of market discipline ?, Federal Reserve Bank of New York, Staff Reports, No.
138.
Peria M.S.M., Schmukler S.L. (2001), Do depositors punish banks for bad behavior? Market
discipline, Deposit insurance, and banking crisis, “The Journal of Finance”, Vol. 56, p.
1029-1051.
Prean N., Stix H. (2011), The effect of raising deposit insurance coverage in times of financial
crisis – Evidence from Croatia microdata, “Economic Systems”, doi:
10.1016/j.ecosys.2011.01.004.
Shimizu K. (2009), Is the information produced in the stock market useful for depositors?,
”Finance Research Letters”, Vol. 6, p. 34-39.
Shleifer, A. (1998), State versus private ownership, “Journal of Economic Perspectives”,
Vol. 12, p. 133-150.
Uchida H, Satake M. (2009), Market discipline and bank efficiency, “Journal of International
Financial Markets, Institutions & Money”, Vol. 19, p. 792-802.

30
Table 1. Explanatory variables and their definitions
Explanatory variable Definition Type Lag
DEPOSIT_GR The real growth rate of deposits from non-financial entities SE L
INTEREST_EXP A ratio of interest costs and liabilities SE C
OROA The return on assets, measured on the level of operating income SE L
EQUITY A ratio of equity capital and assets SE L LOANS A share of loans in total assets SE L
CIR Cost to income ratio SE C
NCI_SHARE A share of net commission and fee incomes in operating income SE C
ASSETS A ratio of a given bank's assets and the GDP of the country in which the bank is licensed SE C
RELAT_FIXED_ASSETS
A variable equal to one for the bank with the biggest fixed assets in a given year and country. For the other banks, the variable shows the relative scale of fixed assets.
E C
GOV A binary variable identifying banks that were directly or indirectly controlled by the government in a given year
E C
FGN A binary variable identifying banks that were owned by foreign investors in a given year E C
CRISIS A binary variable equal to one for the years from 2007 to 2009 and equal to zero for the other years E C
PAR_EQUITY A ratio of equity capital and assets calculated for parent companies E L
PAR_ROA The return on assets calculated for parent companies E L
PAR_LOANS A share of loans in total assets calculated for parent companies E L
PAR_ROA_GROTWH A growth ratio for the PAR_ROA variable E PAR_EQUITY_GROWTH A growth ratio for the PAR_EQUITY variable E
PAR_NEG_COV A percentage of negative pieces of information out of total number of press coverage for a given parent company in a given year
E C
PAR_NEG_COV_50 A binary variable identifying the 50% of parent companies with the highest values of PAR_NEG_COV variable values in a given year
E C
PAR_NUM_NEG_50 A binary variable identifying the 50% of parent companies in a given year with the highest number of negative pieces of information
E C
PAR_HELP1 For the group of parent companies that received public aid, this binary variable is equal to one in all years of the recent crisis
E C

31
PAR_HELP2
For the group of parent companies that received public aid, this binary variable is equal to one for the year in which the public aid occurred and subsequent years
E C
PAR_HELP3 For the group of parent companies that received public aid this binary variable is equal to one only in the year in which the public aid occurred
E C
Note: The symbol SE denotes sequentially exogenous variables, whereas E denotes strictly exogenous variables, L denotes lagged variables, and C denotes contemporaneous variables.
32
Table 2. The descriptive statistics for the dependent variable and the selected explanatory variables
DEPOSIT_ GR
INTEREST_EXP OROA LOANS EQUITY
Mean 19.72% -1.98% 6.85% 47.74% 14.75% Median 12.11% -0.85% 5.88% 48.28% 10.69% Standard deviation 41.62% 4.82% 4.39% 20.75% 13.64% 10th percentile -18.80% -7.94% 2.76% 20.17% 5.12% 90th percentile 70.12% 2.58% 12.40% 74.32% 28.00%

33
Figure 1. The number of financial parent companies with a given average yearly number of subsidiaries
0
5
10
15
20
25
30
35
40
1 (1;2> (2;3> (3;4> (4;5> (5;6> more than 6
average yearly number of subsidiaries
num
ber o
f par
ent c
ompa
nies
34
Table 3. The descriptive statistics for parent companies
PAR_EQUITY PAR_LOANS PAR_ROA
Mean 6.35% 53.04% 0.62% Median 4.81% 53.01% 0.49% Standard deviation 5.51% 17.22% 1.60% 10th percentile 2.68% 33.32% 0.00% 90th percentile 11.24% 75.66% 1.59%

Table 4. The impact of bank and parent company fundamentals on deposit growth rates 1 2 3 4 5 6 7 8 9
Ddeposit_gr 0.019 0.018 0.019 0.015 0.027 0.025 0.014 0.027 0.023
0.025 0.025 0.025 0.024 0.025 0.026 0.025 0.026 0.025
Dinterest_exp 1.432 1.367 1.442 1.477 0.941 1.213 1.366 0.941 1.154
1.176 1.190 1.178 1.178 1.131 1.153 1.183 1.131 1.139
Doroa 1.043 1.064 1.041 1.170 * 1.123 1.025 1.174 * 1.120 1.067
0.671 0.752 0.670 0.688 0.688 0.673 0.692 0.687 0.675
Dloans 0.327 ** 0.238 * 0.330 *** 0.311 ** 0.307 ** 0.314 ** 0.318 ** 0.306 ** 0.319 **
0.129 0.128 0.128 0.128 0.133 0.131 0.125 0.132 0.130
Dequity 0.943 *** 0.883 *** 0.941 *** 0.940 *** 1.001 *** 1.015 *** 0.930 *** 1.001 *** 1.012 ***
0.249 0.259 0.248 0.247 0.257 0.256 0.248 0.257 0.254
Dloans _x_crisis 0.213
0.177
Dequity_x_crisis 0.133
0.378
Doroa_x_crisis 0.089
1.509
Dcir -0.182 ** -0.186 *** -0.181 ** -0.169 ** -0.192 *** -0.188 ** -0.178 ** -0.192 *** -0.184 **
0.073 0.069 0.073 0.074 0.075 0.075 0.073 0.075 0.076
Dnci_share 0.228 0.240 0.227 0.192 0.214 0.252 0.214 0.216 0.251
0.188 0.178 0.189 0.189 0.180 0.189 0.188 0.180 0.189
Drelat_fixed_assets -0.168 *** -0.167 *** -0.169 *** -0.181 *** -0.101 * -0.169 *** -0.187 *** -0.102 * -0.171 ***
0.061 0.059 0.061 0.061 0.059 0.062 0.061 0.059 0.062
Dassets 0.636 * 0.589 0.643 * 0.737 ** 0.241 0.612 * 0.768 ** 0.244 0.626 *
0.366 0.361 0.365 0.365 0.348 0.363 0.367 0.348 0.367
Dgov -0.029 -0.029 -0.032 -0.030 -0.021 -0.024 -0.032 -0.021 -0.023
0.033 0.032 0.034 0.033 0.033 0.034 0.033 0.033 0.034
Dfgn 0.031 0.031 0.030 0.006 0.027 0.033 0.005 0.027 0.035
0.024 0.024 0.028 0.034 0.024 0.025 0.033 0.024 0.025
Dgov_x_crisis 0.020
36
0.069
Dfgn_x_crisis 0.004
0.045
Dpar_equity 1.237 0.015
0.935 1.054
Dpar_loans -0.057 0.012
0.092 0.096
Dpar_roa -0.618 2.557
3.142 3.802
Dpar_equity_growth 0.068 0.065
0.057 0.067
Dpar_roa_growth 1.060 -1.209
2.292 3.612
Dpar_roa_growth_x_crisis 4.437
4.882
Dpar_equity_growth_x_crisis 0.012
0.137
Dpar_equity_x_crisis 3.141 **
1.524
Dpar_loans_x_crisis -0.208
0.134
Dpar_roa_x_crisis -7.647
4.859
Constant -0.144 -0.109 -0.143 -0.157 -0.190 -0.159 -0.144 -0.190 -0.164
0.120 0.120 0.121 0.121 0.128 0.124 0.123 0.127 0.125
no. of observations 2353 2353 2353 2351 2305 2333 2351 2305 2333
Wald (joint) 83.87 *** 94.28 *** 85.5 *** 88.89 *** 75.08 *** 81.57 *** 92.86 *** 74.94 *** 81.62 ***
Sargan test (two-step) 136.9 132.4 131.8 135.7 155.7 140.1 130.7 150.8 140.6
AR(1) test -8.816 *** -8.825 *** -8.811 *** -8.785 *** -8.561 *** -8.729 *** -8.785 *** -8.562 *** -8.738 ***
AR(2) test 0.4979 0.5016 0.4935 0.5742 0.3444 0.2368 0.5647 0.3424 0.2775
This table presents the one-step GMM-SYS estimates. The robust standard errors are given under the coefficients. ***, **, and * indicate significance at the 1%, 5%, and 10% levels, respectively.
37
Table 5. The impact of rumours concerning parent companies on deposit growth rates 10 11 12 13 14 15 16 17 18
Ddeposit_gr 0.017 0.015 0.016 0.013 0.011 0.013 0.011 0.010 0.011
0.025 0.025 0.025 0.024 0.024 0.025 0.025 0.025 0.025
Dinterest_exp 1.431 1.429 1.439 1.488 1.478 1.490 1.318 1.247 1.287
1.172 1.173 1.177 1.177 1.177 1.181 1.179 1.174 1.186
Doroa 1.051 1.077 1.082 1.183 * 1.191 * 1.199 * 1.190 * 1.192 * 1.205 *
0.669 0.669 0.667 0.685 0.686 0.684 0.689 0.688 0.686
Dloans 0.325 ** 0.321 ** 0.321 ** 0.306 ** 0.307 ** 0.306 ** 0.314 ** 0.317 ** 0.316 **
0.129 0.129 0.129 0.129 0.129 0.128 0.127 0.127 0.127
Dequity 0.952 *** 0.966 *** 0.962 *** 0.952 *** 0.963 *** 0.959 *** 0.940 *** 0.948 *** 0.945 ***
0.248 0.248 0.248 0.246 0.246 0.246 0.248 0.248 0.247
Dcir -0.183 ** -0.186 *** -0.184 ** -0.169 ** -0.172 ** -0.171 ** -0.177 ** -0.181 ** -0.179 **
0.074 0.072 0.072 0.075 0.073 0.073 0.073 0.071 0.071
Dnci_share 0.218 0.233 0.233 0.184 0.195 0.196 0.210 0.229 0.228
0.188 0.188 0.188 0.189 0.189 0.189 0.188 0.189 0.188
Drelat_fixed_assets -0.174 *** -0.171 *** -0.171 *** -0.188 *** -0.186 *** -0.185 *** -0.190 *** -0.183 *** -0.185 ***
0.062 0.062 0.062 0.062 0.062 0.062 0.062 0.063 0.062
Dassets 0.673 * 0.715 * 0.701 * 0.778 ** 0.830 ** 0.814 ** 0.773 ** 0.809 ** 0.806 **
0.369 0.374 0.372 0.369 0.375 0.373 0.371 0.380 0.378
Dgov -0.028 -0.029 -0.029 -0.029 -0.030 -0.030 -0.031 -0.034 -0.033
0.033 0.033 0.033 0.033 0.033 0.033 0.033 0.033 0.033
Dfgn 0.040 0.048 * 0.045 * 0.011 0.016 0.015 0.012 0.021 0.019
0.025 0.026 0.026 0.034 0.034 0.034 0.033 0.033 0.033
Dpar_equity 1.295 1.349 1.324 -0.043 0.000 0.001
0.938 0.949 0.945 1.058 1.053 1.052
Dpar_loans -0.047 -0.050 -0.052 0.007 -0.016 -0.011
0.091 0.091 0.091 0.096 0.095 0.095
Dpar_roa -0.934 -0.868 -0.817 2.667 2.753 2.713
3.193 3.185 3.172 3.785 3.770 3.773

38
Dpar_equity_x_crisis 3.070 ** 2.835 * 2.897 **
1.560 1.449 1.458
Dpar_loans_x_crisis -0.097 -0.001 -0.043
0.135 0.128 0.135
Dpar_roa_x_crisis -9.107 * -9.013 * -8.728 *
5.028 4.725 4.752
Dpar_neg_cov -0.209 *** -0.221 *** -0.279 ***
0.076 0.080 0.084
Dpar_neg_cov_50 -0.133 *** -0.135 *** -0.178 ***
0.042 0.043 0.045
Dpar_num_neg_50 -0.110 *** -0.112 *** -0.146 ***
0.039 0.040 0.045
Constant -0.146 -0.153 -0.153 -0.160 -0.166 -0.166 -0.147 -0.153 -0.154
0.119 0.118 0.119 0.121 0.120 0.120 0.122 0.121 0.122
no. of observations 2353 2353 2353 2351 2351 2351 2351 2351 2351
Wald (joint) 89.77 *** 94.13 *** 90.67 *** 96.63 *** 99.77 *** 95.64 *** 99.22 *** 107.5 *** 100.5 ***
Sargan test (two-step) 137.6 136.2 135.4 135.4 135.2 134.1 129.3 125.8 125.7
AR(1) test -8.79 *** -8.777 *** -8.768 *** -8.759 *** -8.742 *** -8.734 *** -8.769 *** -8.752 *** -8.739 ***
AR(2) test 0.5409 0.4987 0.4924 0.6092 0.5867 0.5785 0.617 0.5921 0.578
This table presents the one-step GMM-SYS estimates. The robust standard errors are given under the coefficients. ***, **, and * indicate significance at the 1%, 5%, and 10% levels, respectively.

39
Table 6. The public aid received by parent companies and deposit growth rates 19 20 21 22 23 24 25 26 27
Ddeposit_gr 0.018 0.019 0.020 0.014 0.016 0.016 0.009 0.015 0.014
0.025 0.024 0.025 0.024 0.024 0.024 0.024 0.024 0.024
Dinterest_exp 1.468 1.441 1.453 1.507 1.517 1.525 1.360 1.516 1.532
1.178 1.172 1.175 1.183 1.178 1.180 1.169 1.175 1.179
Doroa 1.054 1.088 1.082 1.181 * 1.206 * 1.207 * 1.211 * 1.222 * 1.219 *
0.669 0.668 0.670 0.685 0.684 0.686 0.683 0.690 0.691
Dloans 0.321 ** 0.313 ** 0.316 ** 0.306 ** 0.294 ** 0.296 ** 0.310 ** 0.297 ** 0.290 **
0.128 0.128 0.129 0.128 0.128 0.128 0.126 0.127 0.129
Dequity 0.953 *** 0.959 *** 0.954 *** 0.949 *** 0.960 *** 0.953 *** 0.946 *** 0.966 *** 0.958 ***
0.249 0.248 0.249 0.247 0.246 0.247 0.243 0.246 0.246
Dcir -0.182 ** -0.176 ** -0.179 ** -0.168 ** -0.164 ** -0.165 ** -0.174 ** -0.166 ** -0.172 **
0.074 0.073 0.073 0.075 0.074 0.074 0.071 0.074 0.073
Dnci_share 0.224 0.215 0.218 0.189 0.185 0.188 0.216 0.190 0.198
0.187 0.187 0.188 0.188 0.188 0.188 0.188 0.189 0.189
Drelat_fixed_assets -0.168 *** -0.169 *** -0.170 *** -0.181 *** -0.181 *** -0.183 *** -0.186 *** -0.181 *** -0.186 ***
0.062 0.062 0.063 0.062 0.063 0.063 0.061 0.062 0.063
Dassets 0.644 * 0.645 * 0.652 * 0.745 ** 0.748 ** 0.754 ** 0.738 ** 0.740 ** 0.759 **
0.368 0.375 0.376 0.367 0.373 0.374 0.365 0.374 0.375
Dgov -0.028 -0.028 -0.028 -0.029 -0.029 -0.029 -0.029 -0.028 -0.029
0.033 0.033 0.033 0.033 0.033 0.033 0.033 0.033 0.033
Dfgn 0.036 0.039 0.038 0.008 0.014 0.011 0.024 0.014 0.012
0.025 0.025 0.025 0.034 0.034 0.034 0.033 0.034 0.034
Dpar_equity 1.243 1.238 1.223 0.720 0.995 1.012
0.937 0.935 0.935 1.019 1.040 0.977
Dpar_loans -0.052 -0.047 -0.045 -0.058 -0.033 -0.033
0.091 0.090 0.090 0.094 0.094 0.093
Dpar_roa -0.731 -1.298 -1.163 0.626 -0.503 -0.517
3.188 3.405 3.334 3.766 3.885 3.584
Dpar_help1 -0.038 -0.035 -0.337 ***
0.036 0.037 0.091
Dpar_help2 -0.137 *** -0.132 *** -0.152
0.039 0.043 0.129
Dpar_help3 -0.133 *** -0.128 *** -0.184

40
0.035 0.039 0.139
Dpar_loans_x_par_help1 0.295
0.211
Dpar_equity_x_par_help1 4.001 *
2.293
Dpar_roa_x_par_help1 -6.215
5.102
Dpar_loans_x_par_help2 -0.127
0.331
Dpar_equity_x_par_help2 2.005
2.416
Dpar_roa_x_par_help2 -3.756
5.548
Dpar_loans_x_par_help3 -0.398
0.458
Dpar_equity_x_par_help3 5.945 *
3.474
Dpar_roa_x_par_help3 -6.331
6.212
Constant -0.146 -0.152 -0.149 -0.159 -0.164 -0.162 -0.159 -0.165 -0.157
0.120 0.119 0.119 0.121 0.120 0.120 0.121 0.121 0.121
no. of observations 2353 2353 2353 2351 2351 2351 2351 2351 2351
Wald (joint) 85.56 *** 104.6 *** 103.5 *** 90.47 *** 106.1 *** 106.6 *** 103.6 *** 108.3 *** 107.8 ***
Sargan test (two-step) 137 140.9 139.3 135.8 138 135.7 135.2 131 124.3
AR(1) test -8.803 *** -8.819 *** -8.825 *** -8.774 *** -8.788 *** -8.793 *** -8.765 *** -8.794 *** -8.791 ***
AR(2) test 0.5011 0.5278 0.5134 0.5768 0.5866 0.5712 0.5378 0.5823 0.5277
This table presents the one-step GMM-SYS estimates. The robust standard errors are given under the coefficients. ***, **, and * indicate significance at the 1%, 5%, and 10% levels, respectively.
Table 7. Research results when the random effects estimator is used
28 29 30 31 32 33 34
deposit_gr 0.104 *** 0.103 *** 0.104 *** 0.103 *** 0.101 *** 0.099 *** 0.100 ***
0.019 0.019 0.019 0.019 0.019 0.019 0.019
interest_exp 1.565 *** 1.607 *** 1.594 *** 1.612 *** 1.592 *** 1.582 *** 1.583 ***
0.455 0.456 0.455 0.456 0.456 0.455 0.455
oroa 0.614 ** 0.619 ** 0.614 ** 0.624 ** 0.606 ** 0.591 ** 0.608 **
0.275 0.275 0.275 0.275 0.275 0.275 0.275
loans 0.058 0.060 0.060 0.056 0.061 0.071 0.068
0.047 0.047 0.047 0.047 0.047 0.047 0.047
equity 0.465 *** 0.462 *** 0.454 *** 0.459 *** 0.454 *** 0.458 *** 0.458 ***
0.085 0.085 0.085 0.085 0.085 0.085 0.085
cir -0.053 * -0.049 -0.050 -0.049 -0.050 -0.055 * -0.054 *
0.032 0.032 0.032 0.032 0.032 0.032 0.032
nci_share -0.040 -0.043 -0.039 -0.044 -0.047 -0.033 -0.037
0.065 0.065 0.065 0.065 0.065 0.065 0.065
relat_fixed_assets -0.075 -0.075 -0.075 -0.076 -0.081 * -0.080 * -0.079
0.048 0.048 0.048 0.048 0.048 0.048 0.048
assets -0.153 -0.149 -0.154 -0.144 -0.129 -0.089 -0.101
0.222 0.222 0.222 0.222 0.222 0.222 0.223
gov -0.007 -0.006 -0.006 -0.006 -0.006 -0.008 -0.007
0.023 0.023 0.023 0.023 0.023 0.023 0.023
fgn 0.006 0.011 0.017 0.012 0.012 0.015 0.014
0.025 0.025 0.025 0.025 0.025 0.025 0.025
par_equity 0.838 0.865 0.900 0.845 0.969 0.935 0.913
0.626 0.627 0.626 0.626 0.629 0.626 0.627
par_loans 0.016 0.022 0.017 0.025 0.020 0.018 0.017
0.063 0.063 0.062 0.063 0.063 0.062 0.063
par_roa -0.568 -0.818 -1.399 -1.122 -1.052 -0.843 -0.780
1.779 1.785 1.791 1.786 1.790 1.778 1.779
par_neg_cov -0.198 **
0.084
par_neg_cov_50 -0.110 ***
0.032
par_num_neg_50 -0.089 ***
0.032
par_help1 -0.056 *
0.031
par_help2 -0.157 ***
0.044
par_help3 -0.142 ***
0.045
Constant -0.059 -0.064 -0.063 -0.062 -0.061 -0.064 -0.064
0.109 0.109 0.108 0.108 0.109 0.108 0.109
no. of observations 2351 2351 2351 2351 2351 2351 2351
Wald (joint) 171.5 *** 173.9 *** 184.3 *** 180.7 *** 176.4 *** 183 *** 178.6 ***
R2 0.285 0.286 0.289 0.288 0.286 0.288 0.287
This table presents the random effects estimates. The robust standard errors are given under the coefficients. ***, **, and * indicate significance at the 1%, 5%, and 10% levels, respectively.

Table 8. Research results when the risk of parent companies and banks is described by contemporaneous variables 35 36 37 38 39 40 41 42
Ddeposit_gr 0.025 0.024 0.024 0.023 0.024 0.025 0.026 0.027
0.025 0.026 0.026 0.026 0.026 0.026 0.025 0.025
Dinterest_exp 2.471 ** 2.277 * 2.281 ** 2.271 ** 2.282 ** 2.288 ** 2.299 ** 2.320 **
1.169 1.168 1.159 1.159 1.163 1.163 1.155 1.158
Doroac 1.551 2.330 ** 2.455 ** 2.500 ** 2.501 ** 2.444 ** 2.450 ** 2.444 **
1.080 1.190 1.192 1.195 1.199 1.200 1.192 1.194
Dloansc -0.291 ** -0.272 * -0.291 ** -0.288 ** -0.291 ** -0.292 ** -0.300 ** -0.299 **
0.142 0.144 0.143 0.144 0.145 0.144 0.143 0.143
Dequityc -0.596 * -0.711 ** -0.734 ** -0.725 ** -0.726 ** -0.730 ** -0.720 ** -0.729 **
0.327 0.323 0.323 0.323 0.323 0.323 0.320 0.323
Doroa_x_crisisc 1.387
1.374
Dloans_x_crisisc 0.182
0.164
Dequity_x_crisisc -0.018
0.499
Dcir -0.070 -0.052 -0.048 -0.048 -0.047 -0.046 -0.041 -0.044
0.089 0.095 0.096 0.094 0.094 0.097 0.095 0.095
Dnci_share 0.002 0.050 0.049 0.063 0.062 0.052 0.056 0.057
0.169 0.182 0.181 0.180 0.179 0.181 0.179 0.180
Drelat_fixed_assets -0.253 *** -0.292 *** -0.289 *** -0.287 *** -0.286 *** -0.281 *** -0.283 *** -0.285 ***
0.058 0.060 0.060 0.061 0.061 0.060 0.062 0.062
Dassets 0.738 ** 0.936 *** 0.899 *** 0.941 *** 0.926 *** 0.857 *** 0.882 *** 0.893 ***
0.321 0.330 0.329 0.334 0.333 0.329 0.338 0.340
Dgov -0.028 -0.026 -0.021 -0.022 -0.022 -0.022 -0.021 -0.021
0.031 0.033 0.033 0.033 0.033 0.033 0.033 0.033
Dfgn 0.046 * 0.014 0.015 0.019 0.018 0.010 0.019 0.015
0.026 0.039 0.039 0.039 0.038 0.039 0.039 0.039
Dpar_equityc -0.755 0.376 0.378 0.327 0.187 0.532 0.567
0.945 0.694 0.693 0.697 0.687 0.702 0.699
Dpar_loansc 0.103 0.061 0.060 0.061 0.069 0.048 0.053

43
0.105 0.099 0.098 0.099 0.099 0.098 0.098
Dpar_roac 2.147 0.206 0.176 0.333 0.721 -0.906 -1.056
2.107 1.606 1.637 1.639 1.603 1.765 1.764
Dpar_equity_x_crisisc 2.283 *
1.281
Dpar_loans_x_crisisc -0.151
0.132
Dpar_roa_x_crisisc -0.603
3.576
Dpar_neg_cov -0.204 ***
0.077
Dpar_neg_cov_50 -0.106 **
0.042
Dpar_num_neg_50 -0.083 **
0.041
Dpar_help1 -0.012
0.037
Dpar_help2 -0.151 ***
0.045
Dpar_help3 -0.155 ***
0.042
Constant 0.258 0.192 0.175 0.163 0.164 0.175 0.168 0.173
0.166 0.175 0.174 0.175 0.175 0.177 0.174 0.174
no. of observations 2351 2349 2349 2349 2349 2349 2349 2349
Wald (joint) 59.98 *** 74.18 *** 64.18 *** 67.98 *** 67.41 *** 58.23 *** 65.76 *** 66.51 ***
Sargan test (two-step) 140.7 132.8 132.2 135.2 135.1 137.4 138.8 138.4
AR(1) test -9.01 *** -8.93 *** -8.888 *** -8.881 *** -8.876 *** -8.903 *** -8.907 *** -8.915 ***
AR(2) test 0.4805 0.4082 0.4382 0.3988 0.3963 0.4051 0.4446 0.429
c identifies the contemporaneous variables used instead of the lagged variables. This table presents the one-step GMM-SYS estimates. The robust standard errors are given under the coefficients. ***, **, and * indicate significance at the 1%, 5%, and 10% levels, respectively.

Table 9. Research results and modifications in safety net arrangements 43 44 45 46 47 48 49
Ddeposit_gr 0,018 0,018 0,018 0,012 0,016 0,012 0,016
0,024 0,025 0,025 0,023 0,023 0,025 0,024
Dinterest_exp 1,202 1,493 1,423 1,348 1,389 1,512 1,565
1,167 1,177 1,177 1,154 1,155 1,191 1,193
Doroa 0,965 1,059 1,054 1,059 1,060 0,980 0,948
0,724 0,672 0,670 0,690 0,691 0,775 0,773
Dloans 0,232 * 0,322 ** 0,324 ** 0,271 ** 0,262 ** 0,263 ** 0,256 **
0,124 0,127 0,128 0,127 0,127 0,126 0,125
Dequity 0,935 *** 0,958 *** 0,948 *** 0,967 *** 0,955 *** 0,897 *** 0,889 ***
0,242 0,245 0,248 0,243 0,243 0,247 0,249
Doroa_x_crisis -0,295
1,302
Dloans _x_crisis 0,069
0,201
Dequity_x_crisis -0,149
0,390
Dcir -0,213 *** -0,185 ** -0,184 ** -0,209 *** -0,204 *** -0,156 ** -0,150 **
0,065 0,073 0,073 0,067 0,067 0,069 0,070
Dnci_share 0,230 0,234 0,234 0,183 0,175 0,133 0,124
0,177 0,188 0,187 0,179 0,179 0,198 0,198
Drelat_fixed_assets -0,179 *** -0,175 *** -0,172 *** -0,196 *** -0,193 *** -0,183 *** -0,179 ***
0,060 0,061 0,062 0,063 0,063 0,060 0,060
Dassets 0,651 * 0,682 * 0,662 * 0,876 ** 0,804 ** 0,807 ** 0,727 **
0,376 0,368 0,373 0,395 0,391 0,377 0,371
Dgov -0,032 -0,032 -0,031 -0,035 -0,033 -0,034 -0,032
0,032 0,034 0,034 0,033 0,033 0,032 0,032
Dfgn 0,030 0,031 0,032 0,022 0,016 0,014 0,011
0,024 0,028 0,028 0,032 0,032 0,034 0,034
Dgov_x_crisis -0,057 0,039
0,085 0,069
Dfgn_x_crisis -0,023 0,046
0,049 0,169
Dpar_equity 1,220 1,100 1,400 1,254
0,935 0,923 0,934 0,922
Dpar_loans -0,063 -0,058 -0,055 -0,050
0,090 0,089 0,090 0,089
Dpar_roa -0,613 -0,878 -1,020 -1,362
3,143 3,283 3,108 3,322
Dloans_x_lowcovmultp 0,406 0,456 * 0,453 *
0,303 0,263 0,269
Dequity_x_lowcovmultp 1,922 ** 1,488 * 1,530 *
0,945 0,862 0,925
Doroa_x_lovcowmultp 0,093 -0,204 0,074
3,792 3,700 3,715
Dloans_x_nonfullguar 0,196 0,136
0,186 0,185
Dequity_x_nonfullguar -0,009 0,027
0,394 0,384
Doroa_x_nonfullguar -0,019 0,405
1,428 1,480

45
Dgov_x_lowcovmultp 0,295 **
0,130
Dfgn_x_lowcovmultp 0,136
0,110
Dgov_x_nonfullguar -0,027
0,076
Dfgn_x_nonfullguar -0,052
0,174
Dpar_neg_cov_50 -0,128 *** -0,143 ***
0,042 0,038
Dpar_num_neg_50
Dpar_help2 -0,133 ***
0,042
Dpar_help3 -0,115 ***
0,043
Constant -0,081 -0,143 -0,143 -0,109 -0,102 -0,120 -0,113
0,119 0,121 0,121 0,117 0,117 0,123 0,122
no. of observations 2353 2353 2353 2351 2351 2351 2351
Wald (joint) 101,6 *** 88 *** 85,08 *** 107,5 *** 111,3 *** 107 *** 110,7 ***
Sargan test (two-step) 138,1 131,4 129,9 133,5 133,3 132,5 134,7
AR(1) test -8,893 *** -8,782 *** -8,808 *** -8,795 *** -8,857 *** -8,778 *** -8,828 ***
AR(2) test 0,4687 0,507 0,5072 0,5729 0,5515 0,6257 0,6068
This table presents the one-step GMM-SYS estimates. The robust standard errors are given under the coefficients. ***, **, and * indicate significance at the 1%, 5%, and 10% levels, respectively.