deposition of fine particles over a boreal forest
TRANSCRIPT
REPORT SERIES IN AEROSOL SCIENCE
N:o 135 (2012)
DEPOSITION OF FINE PARTICLES
OVER A BOREAL FOREST
TIIA GRONHOLM
Division of Atmospheric Sciences
Department of Physics
Faculty of Science
University of Helsinki
Helsinki, Finland
Academic dissertation
To be presented, with the permission of the Faculty of Science
of the University of Helsinki, for public criticism in auditorium D101,
Gustaf Hallstromin katu 2, on October 5th, 2012, at 12 o’clock.
Helsinki 2012

Author’s Address: Joensuu Science Park
Lansikatu 15
FI-80110 Joensuu
Supervisors: Professor Timo Vesala, Ph.D.
Department of Physics
University of Helsinki
Professor Markku Kulmala, Ph.D.
Department of Physics
University of Helsinki
Reviewers: Docent Hannele Korhonen, Ph.D.
Kuopio Unit
Finnish Meteorological Institute
Professor Jyrki Makela, Ph.D.
Department of Physics
Tampere University of Technology
Opponent: Professor Werner Eugster, Ph.D.
Institute of Agricultural Sciences
Swiss Federal Institute of Technology Zurich
ISBN 978-952-5822-62-5 (printed version)
ISSN 0784-3496
Helsinki 2012
Unigrafia Oy
ISBN 978-952-5822-63-2 (pdf version)
http://ethesis.helsinki.fi
Helsinki 2012
Helsingin yliopiston verkkojulkaisut

Acknowledgements
The research for this thesis was conducted at the Division of Atmospheric Sciences,
Department of Physics, University of Helsinki. I want to thank Prof. Juhani Keinonen,
Head of the Department for providing me the working facilities. I want to thank Prof.
Markku Kulmala, Head of the Division, for the possibility to do the work related and
mostly unrelated to this thesis. I want to thank Prof. Timo Vesala for valuable dis-
cussions and endless insinuation about that I should complete the thesis - and helping
me to realize it.
I want to thank Prof. Jyrki Makela and Dos. Hannele Korhonen for reviewing the
thesis and Dr. Samuli Launiainen for valuable comments.
I want to thank all my co-authors, especially Prof. Gaby Katul, the most enthusiastic
scientist that I know. Without Dr. Hc. Topi Pohja, M. Sc. (tech) Eki Siivola and M.
Sc. Veijo Hiltunen this thesis would have been only theoretic. I also want to thank
Dos. Janne Rinne, Dos. Ullar Rannik and Dr. Pasi Aalto who supported me in my
research.
I also want to thank my former colleagues at the Division of Atmospheric Sciences:
Jukka and Anca Hienola, Lauri Laakso, Sanna Sevanto, Tanja Suni, Hanna Vehkamaki,
Aki Virkkula, Miikka dal Maso, Tuukka Petaja, Mari Pihlatie, Sami Haapanala, Taina
Ruuskanen, Ella Kyro, John Backman and many others for being not only a fellow
workers but also my friends.
Special thanks go to my husband, Samuli, whose patient love and support enabled me
to complete this work.

Tiia Helena Gronholm
University of Helsinki, 2012
Abstract
Dry and wet deposition are removal mechanisms of atmospheric aerosol particles. Histori-
cally, there are very scarce scientific publications reporting experimentally determined dry
deposition values for the ultra-fine size range. The physics of deposition is studied both using
micrometeorological field measurements conducted at SMEAR II site in Hyytiala, Southern
Finland and by modeling approaches. Dry deposition velocity depends mainly on particle
size and magnitude of the atmospheric surface layer turbulence. We present experimentally
determined dry deposition velocity (vd) as a function of particle size for the ultra-fine aerosol
size range (10 - 150 nm) using relaxed eddy accumulation and eddy-covariance (EC) methods
accompanied by particle number size distribution measurements. The highest vd was found
for 10 nm particles and in all size classes vd increased with increasing friction velocity.
By combining two-layer (above and sub-canopy) EC measurements and a new multi-layer
canopy deposition model, we addressed how dry deposition is distributed within the forest
canopy and between the canopy and the underlying ground. According to the measurements,
about 20 - 30 % of particles penetrated the canopy and deposited on the forest floor. The
model results showed that turbophoresis, when accounted for at the leaf scale in vertically
resolved models, could increase vd for 0.1 - 2 µm particles and explain why the observations
over forests generally do not support the pronounced minimum of deposition velocity for
particles of that size. The developed multi-layer model was further used to study the effect
of canopy structure (leaf-area shape and density) on vd.
Scavenging coefficients for rain and snow deposition were calculated based on measurements
of particle size distribution and precipitation. Parameterizations for both rain and snow wet
deposition were derived for example to be applied in air quality and global models. Also a
model including both in-cloud and below cloud wet deposition was developed and compared
to the field measurements. Both snow and rain scavenging efficiency increased with increasing
precipitation intensity. We also found, that the effectiveness of snow scavenging depends on
the crystal or snow flake structure and the air relative humidity. Wet deposition was found
to be an order of magnitude more effective ”air cleaner” compared to dry deposition.
Keywords: aerosol particle removal, dry deposition, wet deposition, relaxed eddy accumula-
tion, eddy covariance, turbulent flux, scavenging, multi-layer model
Contents
1 Introduction 5
2 Background and theory 7
2.1 Turbulent flow . . . . . . . . . . . . . . . . . . . . . . . . . . . . . . . . 7
2.2 Dry deposition . . . . . . . . . . . . . . . . . . . . . . . . . . . . . . . 10
2.2.1 Phoretic effects . . . . . . . . . . . . . . . . . . . . . . . . . . . 10
2.2.2 Models . . . . . . . . . . . . . . . . . . . . . . . . . . . . . . . . 12
2.3 Wet deposition . . . . . . . . . . . . . . . . . . . . . . . . . . . . . . . 16
3 Experimental methods and measurements 19
3.1 SMEAR II measurement site . . . . . . . . . . . . . . . . . . . . . . . . 19
3.2 Eddy covariance . . . . . . . . . . . . . . . . . . . . . . . . . . . . . . . 20
3.3 Relaxed eddy accumulation . . . . . . . . . . . . . . . . . . . . . . . . 21
3.4 Scavenging coefficient determination . . . . . . . . . . . . . . . . . . . 23
4 Results and discussion 24
5 Review of papers and author’s contribution 29
6 Conclusions 31
References 32

List of publications
This thesis consists of an introductory review, followed by eight research articles. In
the introductory part, these papers are cited according to their roman numerals.
I Gronholm, T., Haapanala, S., Launiainen, S., Rinne, J., Vesala, T. and Ran-
nik, U.(2008). The dependence of β coefficient of REA system with dynamic
deadband on atmospheric conditions, Environ. Pollut., 152, 597–603.
II Gronholm, T., Aalto, P. P., Hiltunen, V., Rannik, U, Rinne, J., Laakso, L.,
Hyvonen, S., Vesala, T. and Kulmala, M. (2007). Measurements of aerosol parti-
cle dry deposition velocity using the relaxed eddy accumulation technique, Tellus,
59B, 381–386.
III Gronholm, T., Launiainen, S., Ahlm, L., Martensson, M., Kulmala, M., Vesala,
T. and Nilsson, E. D. (2008). Aerosol particle dry deposition to canopy and forest
floor measured by two-layer EC system, J. Geophys. Res., 113, D04202.
IV Katul, G. G., Gronholm, T., Launiainen, S. and Vesala, T. (2010). Predicting
the dry deposition of aerosol-sized particles using layer-resolved canopy and pipe
flow analogy models: The role of turbo-phoresis. J. Geophys. Res., 115, D12202,
doi:10.1029/JD012853.
V Katul, G. G., Gronholm, T., Launiainen, S. and Vesala, T. (2011). The effects of
the canopy medium on dry deposition velocities of aerosol particles in the canopy
sub-layer above forested ecosystems. Atm. Environ., 45, 1203–1212.
VI Laakso, L., Gronholm, T., Rannik, U., Kosmale, M., Fiedler, V. Vehkamaki,
H. and Kulmala, M. (2003). Ultrafine particle scavenging coefficients calculated
from six years field measurements . Atm. Environ., 37:25, 3605–3613.
VII Andronache, C., Gronholm, T., Laakso, L., Phillips, V. and Venalainen, A.
(2006). Ultrafine particles scavenging by rainfall at a boreal site: observations
and model estimations. Atmos. Chem. Phys., 6, 4739–4754.
VIII Kyro, E.-M., Gronhom, T., Vuollekoski, H., Virkkula, A., Kulmala, M. and
Laakso, L. (2009). Snow scavenging of ultrafine particles: field measurements
and parameterization. Boreal Env. Res., 14, 527–538.
1 Introduction
The removal of aerosol particles from the atmosphere occurs through two different
pathways, dry and wet deposition (Seinfeld and Pandis , 1998). Dry deposition is a
direct transfer of particulate species to the Earth’s surface without a help of precipita-
tion. Dry deposition is highly dependent on the particle size, strength of atmospheric
turbulence and the characteristics of the surface the deposition takes place. Deposi-
tion rate of aerosol particles are usually expressed as a deposition velocity, which is a
local particle flux normalized by a local particle concentration. Sign reversal will result
that the deposition velocity downwards is positive. Often, deposition velocity is also
normalized with friction velocity to enable comparison of data measured over different
surfaces.
Wet deposition is a process, where particles are removed from the air by aqueous scav-
engers. The main pathways are 1) activation of CCN to cloud or fog droplets and their
subsequent removal by precipitation formation and 2) removal of particles by collision
with a droplet or ice crystal in or below a cloud. Wet deposition is parameterized in
terms of scavenging coefficient, which is the exponential constant in an exponential
decay model for the physical removal of particles from the air by rainfall (Slinn, 1977;
Fenton et al., 1980; Scott , 1982). A variety of the scavenging coefficients, expressed as
a constant (bulk) value or as a function of precipitation intensity, are used to describe
the wet removal of pollutants (Mircea and Stefan, 1998).
The interest towards aerosol particle deposition started already 1915 when O’Gara
found that SO2 particle emission induced crop damage (Thomas , 1951). The first at-
mospheric particle deposition models commenced 1930’s when Bosanquet and Pearson
(1936) presented a point source plume dispersion equation for smoke emitted from
elevated chimneys, but this pioneering work did not consider surface effects. During
the last century, interest on particle removal processes has increased because of the
questions of air quality and impacts of aerosol particles on human health. The particle
deposition to vegetated surfaces has influenced nutrient or toxic loading to ecosys-
tems. During the last two decades, understanding the particle formation and removal
has gained in importance also due to the need to understand the processes leading
to and controlling the magnitude of the anthropogenic climate change. Hence, it is
not surprising that the dry and wet deposition have been intensively studied by field
experiments and modeling approaches. During the last decades, a large number of dry
5

and several wet deposition parameterizations have been proposed and developed for
vegetated surfaces - ranging from bulk deposition rates (Wesely et al., 1985; Wesely
and Hicks , 2000) to particle size-resolved approaches (Sehmel , 1980; Gallagher et al.,
1997; Pryor et al., 2007, 2008a).
This study, however, origins from a purely academic curiosity: to understand the
physics behind the atmospheric deposition of fine (particle diameter < 2.5 µm) and
mainly ultrafine (< 0.1 µm)particles above and below a boreal forest canopy. That
thought gradually gelled into a reality. By novel measurement methods and modeling,
our aims were to enlighten the common problems in the field of particle deposition over
a forest:
1. To conduct size-segregated particle flux measurements in the size-range below
few hundred nm due to lack of extensive data.
2. To understand partitioning of particle deposition between the vegetation and the
underlying ground.
3. To find out why observations over forests generally do not support the models
pronouncing a strong minimum of deposition velocity for particles 0.1− 2 µm.
4. To determine size-segregated scavenging coefficients for rain and snow from field
measurements, and explain the results by a model.
6

2 Background and theory
2.1 Turbulent flow
Close the ground, surface friction decelerates the flow, the shear force exceeds molecular
viscous force and a smooth laminar flow is perturbed generating random, irregular mo-
tions. The flow becomes turbulent. Turbulence is induced also in convective conditions
via temperature and density differences (Figure 1).
Turbulent flows can seldom be described analytically but instead by statistical proper-
ties. One statistical approach is Reynold’s decomposition (e.g. Stull , 1988) where wind
speed ui and scalar s is presented as a mean (x) and fluctuating (x′) part
ui(t) = ui + u′i (1)
s(t) = s+ s′. (2)
where ui is
ui(t) =1
t
∫ t+t/2
t−t/2ui(t
′)dt′ (3)
Figure 1: Turbulent transport during the prescribed burning in Juupajoki, Finland.
7

Figure 2: Mean (dash line) and fluctuation (difference between solid and dash line)
parts of vertical wind (W ) and temperature (T ).
Figure 2 demonstrates the decomposition of wind and temperature. A mean value
depends on the averaging time interval (t). Therefore, t need to be large enough to
include an adequate number of fluctuations, but not so large that important macro-
scopic features would be masked. The mean values are varying slowly (e.g. diurnal
cycle) while fluctuations have extreme temporal and spatial variations. However, the
viscosity of the fluid ensures that the smallest eddies are many orders of magnitude
larger than molecular dimensions and continuum mechanics remains applicable. The
largest scales of eddies are comparable with the dimensions of the flow and responsi-
ble for the most of the transport of momentum, heat and mass. Turbulent energy is
transferred from larger to smaller eddies, although a part of it is dissipated as heat.
In turbulent flows the conservation of compound c in a unit volume is (Finnigan, 2000)
∂c
∂t=
3∑i=1
ui∂c
∂xi+
3∑i=1
∂u′ic′
∂xi+∑
Sc (4)
8

where molecular and dispersive terms are neglected. u1,2,3 and x1,2,3 refer to wind u,
v and z and coordination directions x, y and z, respectively. Sc is a source or sink
of c. Assuming stationary conditions, horizontally homogeneous source or sink, flat
topography and incompressible fluid, it is justified to neglect the time dependence,
advection, and horizontal turbulent fluxes. Then, we have
∂w′c′
∂z= −
∑Sc(z) (5)
⇒ w′c′(zref ) = −∫ zref
0
Sc(z). (6)
In Paper IV we have used a common meteorological K-theory to approximate turbu-
lent transport
w′c′ = −Kc∂c
∂z, (7)
where Kc is a eddy diffusivity, a transport coefficient analogous to molecular diffusivity.
The K-theory assumes that the characteristic eddy length scale is smaller than length
scale of scalar concentration gradient, a valid assumption in the atmospheric surface
layer turbulence, but not necessarily inside plant canopies.
9
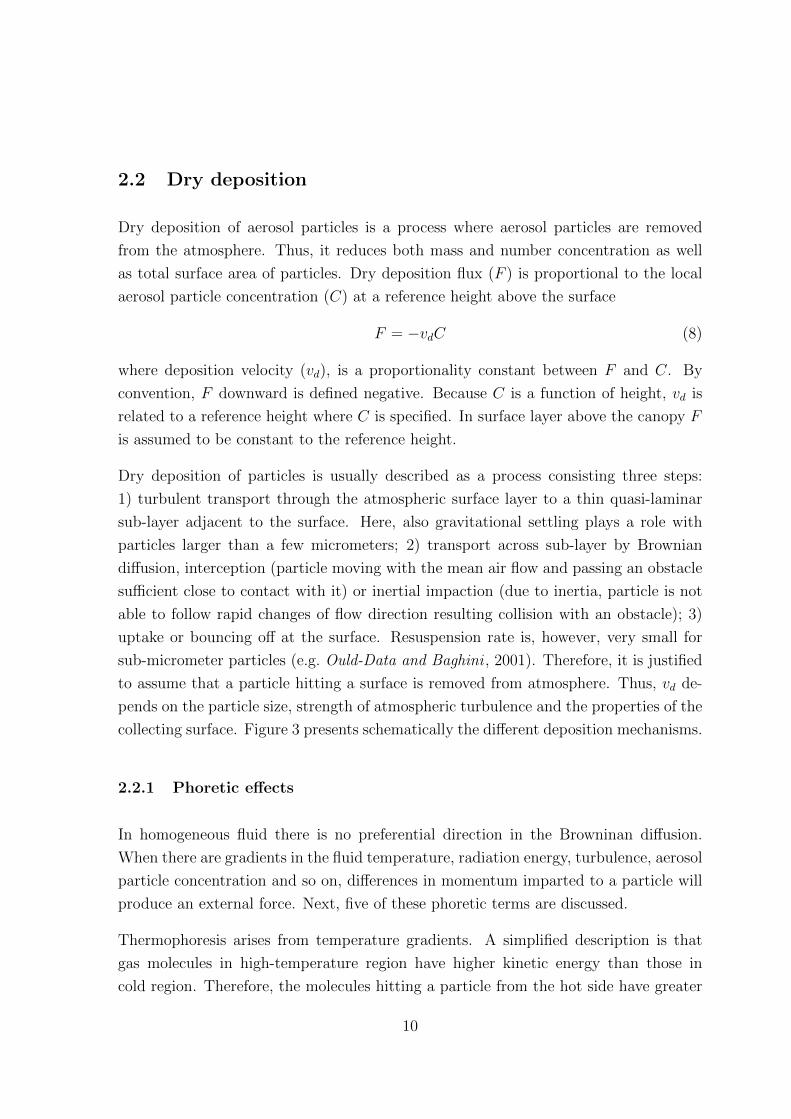
2.2 Dry deposition
Dry deposition of aerosol particles is a process where aerosol particles are removed
from the atmosphere. Thus, it reduces both mass and number concentration as well
as total surface area of particles. Dry deposition flux (F ) is proportional to the local
aerosol particle concentration (C) at a reference height above the surface
F = −vdC (8)
where deposition velocity (vd), is a proportionality constant between F and C. By
convention, F downward is defined negative. Because C is a function of height, vd is
related to a reference height where C is specified. In surface layer above the canopy F
is assumed to be constant to the reference height.
Dry deposition of particles is usually described as a process consisting three steps:
1) turbulent transport through the atmospheric surface layer to a thin quasi-laminar
sub-layer adjacent to the surface. Here, also gravitational settling plays a role with
particles larger than a few micrometers; 2) transport across sub-layer by Brownian
diffusion, interception (particle moving with the mean air flow and passing an obstacle
sufficient close to contact with it) or inertial impaction (due to inertia, particle is not
able to follow rapid changes of flow direction resulting collision with an obstacle); 3)
uptake or bouncing off at the surface. Resuspension rate is, however, very small for
sub-micrometer particles (e.g. Ould-Data and Baghini , 2001). Therefore, it is justified
to assume that a particle hitting a surface is removed from atmosphere. Thus, vd de-
pends on the particle size, strength of atmospheric turbulence and the properties of the
collecting surface. Figure 3 presents schematically the different deposition mechanisms.
2.2.1 Phoretic effects
In homogeneous fluid there is no preferential direction in the Browninan diffusion.
When there are gradients in the fluid temperature, radiation energy, turbulence, aerosol
particle concentration and so on, differences in momentum imparted to a particle will
produce an external force. Next, five of these phoretic terms are discussed.
Thermophoresis arises from temperature gradients. A simplified description is that
gas molecules in high-temperature region have higher kinetic energy than those in
cold region. Therefore, the molecules hitting a particle from the hot side have greater
10
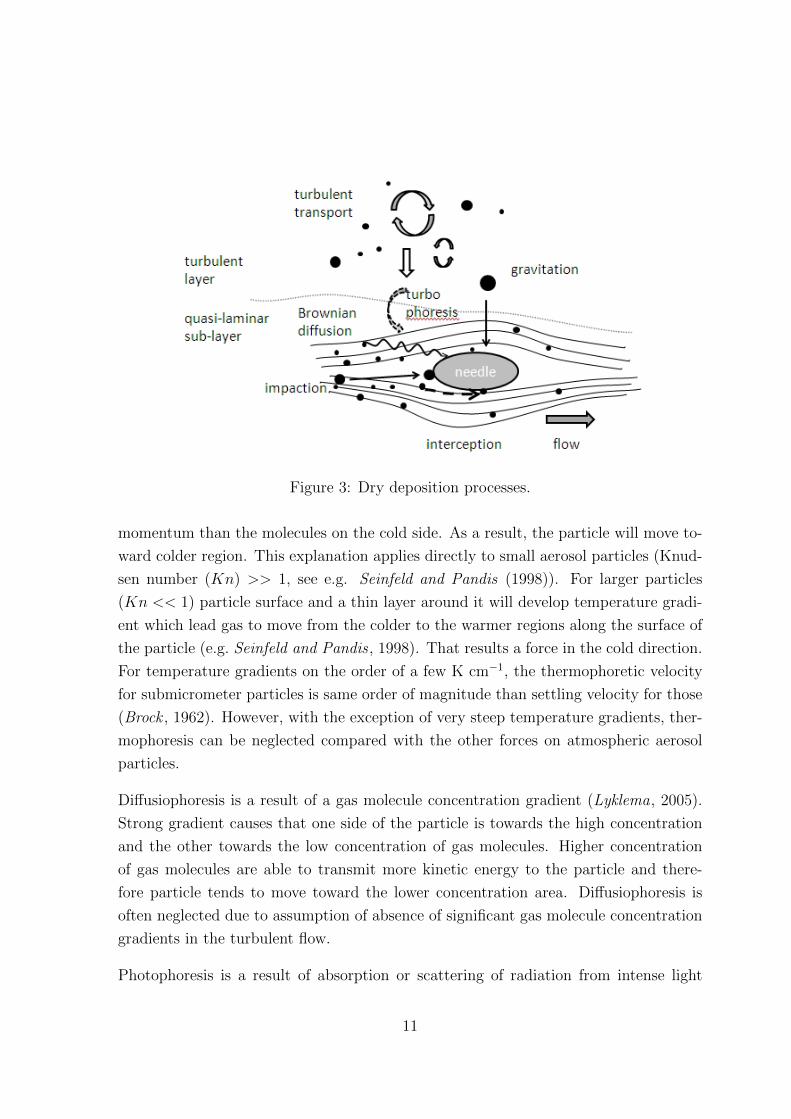
Figure 3: Dry deposition processes.
momentum than the molecules on the cold side. As a result, the particle will move to-
ward colder region. This explanation applies directly to small aerosol particles (Knud-
sen number (Kn) >> 1, see e.g. Seinfeld and Pandis (1998)). For larger particles
(Kn << 1) particle surface and a thin layer around it will develop temperature gradi-
ent which lead gas to move from the colder to the warmer regions along the surface of
the particle (e.g. Seinfeld and Pandis , 1998). That results a force in the cold direction.
For temperature gradients on the order of a few K cm−1, the thermophoretic velocity
for submicrometer particles is same order of magnitude than settling velocity for those
(Brock , 1962). However, with the exception of very steep temperature gradients, ther-
mophoresis can be neglected compared with the other forces on atmospheric aerosol
particles.
Diffusiophoresis is a result of a gas molecule concentration gradient (Lyklema, 2005).
Strong gradient causes that one side of the particle is towards the high concentration
and the other towards the low concentration of gas molecules. Higher concentration
of gas molecules are able to transmit more kinetic energy to the particle and there-
fore particle tends to move toward the lower concentration area. Diffusiophoresis is
often neglected due to assumption of absence of significant gas molecule concentration
gradients in the turbulent flow.
Photophoresis is a result of absorption or scattering of radiation from intense light
11

beam by a particle. Within the particle electromagnetic energy turns into thermal
energy and causes uneven heat distribution of molecules around the particle (Reed ,
1977; Li et al., 2010). The net force is either toward or away from the light depending
on optical characteristics of the particle (Li et al., 2010). Photophoresis doensn’t play
a role in atmospheric aerosol dynamics and it is neglected (Seinfeld and Pandis , 1998).
Electrophoresis is the motion of particles under the influence of an electric field. This
phenomenon is widely utilized in different equipment such as electrostatic filters and
analyzers. In atmospheric conditions, the electric field is weak, and also the aerosol
particles are weakly charged. Although electric forces might play a role in the particle
size range of 10 - 200 nm during low wind conditions and around sharp structures like
conifer needles (Tammet et al., 2001), electrophoresis related to particle deposition is
generally neglected.
Turbophoresis refers to the tendency of particles to move in the direction of decreasing
turbulent energy due the difference in momentum on the sides of a particle. Because
near a surface, the vertical gradients of turbulent energy are large, turbophoresis is
expected to enhance particle deposition rate onto the surface (Caporaloni et al., 1975;
Reeks , 1983; Guha, 1997; Young and Leeming , 1997, Paper IV).
2.2.2 Models
Based on the fundamentals of electronics, deposition process could be interpreted in
terms of an electrical resistance. There, aerodynamic transport (ra = f( Uu∗2 , L)), trans-
fer across quasi-laminar surface layer (rb = f( 1u∗)), and surface uptake (rc = f(surface
properties)) is assumed to be governed by resistances in series, and gravitational set-
tling (vg) by resistance in parallel (e.g. Zufall and Davidson, 1998)
vd(z) =1
ra(z) + rb + rc+ vg. (9)
Above, U refers to mean wind velocity, u∗ to friction velocity and L is a transport
length scale. Although very easy to follow, the resistance analogy is applicable only
in ’a class-room use’, due to its inconsistency with mass conservation (Kramm et al.,
1992; Venkatram and Pleim, 1999).
In 1982, Slinn published an analytical model including semi-analytical descriptions of
12

particle collection efficiencies on vegetated surfaces (Slinn, 1982)
vd = vg + CDUr
[1 +
UhUr
(1− ε
ε+√εtanhγ
√ε
)]−1(10)
CD =
(u∗2
U2r
)(11)
UhUr
=u∗κUr
ln1
z0, (12)
where CD is canopy drag coefficient, Uh is U at canopy top (h), Ur at a reference
height above canopy, ε is particle collection efficiency, κ is von Karman constant and γ
is a parameter characterizing the wind profile through the forest. However, although
extensively used and probably the most cited dry deposition model, it is based upon
a number of assumptions which may be frequently violated in practice (see e.g. Pryor
et al., 2008a).
Over the last three decades, number of dry deposition parameterizations and models
have been published. Many of those are based on Slinn’s formulation, but also new ap-
proaches have been developed. Roughly, dry deposition models could be classified into
two groups. The first group includes models assuming similarity between deposition
of particles on walls of pipes and on the canopy-soil system (e.g. Chamberlain, 1967;
Caporaloni et al., 1975; Noll et al., 2001; Feng , 2008). The second group contains mod-
els proposed for vegetated surfaces ranging from bulk deposition rates (Wesely et al.,
1985; Wesely and Hicks , 2000) to size-resolved approaches (Sehmel , 1980; Gallagher
et al., 1997; Pryor et al., 2007, 2008a; Petroff et al., 2008b). Petroff et al. (2008a)
and Pryor et al. (2008a) summarized and compared models and formulations mainly
developed over the past 20 years.
In a multilayer model developed in Paper IV, a second order differential equation for
the particle concentration is derived
∂
∂z
[− (Dp,m +Dp,t(z))
∂C(z)
∂z+ VsC(z)
]+a(z)
π
[√−u′w′(z)
(θ Sc−2/3 + 10−3/St(z)
)+ Vt
]C(z) = 0 (13)
where the Brownian diffusion term (Dp,m) is given as (Seinfeld and Pandis , 1998)
Dp,m =kBT
3πµdpCc, (14)
13

where kB = 1.38 × 10⁻²³J K−1 is the Boltzmann constant, T is the absolute temper-
ature, dp particle diameter, and µ = ρν is the dynamic viscosity of the air, where ρ
and ν are the air density and kinematic viscosity, respectively, and Cc is the Cunning-
ham coefficient. The particle turbulent diffusivity is primarily dominated by the flow
turbulent diffusivity and is given as
Dp,t = Kt
(1 +
τpτ
)−1, (15)
where Kt is the eddy viscosity of the flow, τp is the particle time scale given by
τp =ρpd
2p
18µCc, (16)
where ρp is particle density. The Lagrangian turbulent time scale (τ) is given as
τ =Kt
σ2w
, (17)
where σw is the turbulent vertical velocity standard deviation. For small aerosol par-
ticles in the µm diameter range, τp/τ � 1, and Dp,t ≈ Kt.
Based on K-theory for momentum transfer,
Kt = −u′w′∣∣∣∂U∂z ∣∣∣ , (18)
where U is the mean longitudinal velocity, and u′w′ is the turbulent stress. The mod-
elling of the vertical variation of flow statistics is described in Paper IV.
Settling velocity Vs for particles with Reynolds number ≤ 1 is
Vs = Cc(ρp − ρ)
ρ
gd2p18ν
, (19)
where ρp is the particle density, and g is the gravitational acceleration.
The role of turbo-phoresis, recognized and listed along with other phoretic terms, was
absent in virtually all atmospheric aerosol deposition models over vegetated surface
and was not explicitly treated in any of the data-model inter-comparisons reviewed in
Petroff et al. (2008a) and Pryor et al. (2008a). Turbophoresis (Vt) plays a role via
vegetation collection mechanisms (Sc(z)) within a quasi-laminar boundary layer close
to the leaf surface
Sc(z) =a(z)
π
(C(z)− CL)
rb(z), (20)
14

where a(z) is the total leaf area density, the π adjusts for the single-side projected leaf
area to total surface area of leaves (assuming the cylinder shape for needless), CL (≈ 0)
is the mean particle concentration at the leaf surface, and rb is the local quasi-laminar
boundary layer resistance for particles (Seinfeld and Pandis , 1998):
rb(z) =
(√−u′w′(z)
(θSc−2/3 + 10−3/St
)+ Vt
)−1, (21)
where Sc = ν/Dp,m is the Schmidt number and St = Vs(−u′w′(z))/(gν) is a turbulent
Stokes number. θ = (π/2)(cv/cd), where cv/cd is the ratio of the viscous to form drag
coefficient of the leaf. Moreover, the inertial impaction term in rb is parameterized
as 10−3/St, which is based on Slinn and Slinn (1980) formulation for water or smooth
surfaces (see Aluko and Noll , 2006). Sedimentation, interception, and rebound are all
ignored in equation though those can be readily added into rb if known. Note here,
that the rb and the St vary with the local turbulent flux of momentum (= −u′w′)rather than some of the common formulations that adopt the local mean velocity (e.g.
see review by Pryor et al., 2008a).
The turbo-phoretic velocity can be approximated by (Caporaloni et al., 1975; Reeks ,
1983; Guha, 1997; Young and Leeming , 1997; Zhao and Wu, 2006)
Vt = −τpdσ2
w,p
dz, (22)
where,σ2w,p
σ2w
=(
1 +τpτ
)−1. (23)
and the main ’driving force’ for turbo-phoresis is given (see details in Paper IV) as
∂σ2w
∂z≈ σ2
w
√−u′w′b ν
. (24)
15

2.3 Wet deposition
Wet deposition is a major removal mechanism for atmospheric aerosol particles. Pre-
cipitation scavenging can occur both in- and below-cloud (Figure 4). At cloud base,
in a supersaturated conditions, aerosol particle can act as a cloud condensation nu-
cleus (CCN) providing the surface on which water vapor can condense and form cloud
droplets. In-cloud aerosol particles can also be scavenged by coagulation with cloud
droplets and by collection onto falling raindrops.
Below-cloud scavenging is a process where aerosol particles are collected by a falling
raindrop. The object lesson of Seinfeld and Pandis (1998) is, that when a raindrop
(diameter Dp) falls, it collides with aerosol particles (diameter dp) collecting them.
As a first thought, one could think that the raindrop sweeps the volume of π(Dp −dp)
2(Ut(Dp)−ut(dp))/4 per unit time, where Ut is raindrop’s and ut particle’s terminal
falling velocity. However, falling drop perturbs the air around it and creates the flow
field which streamlines diverge around the drop causing a force on particle modifying
its trajectory. The possible collision depends on the sizes and relative locations of the
drop and the particle. A complicated fluid mechanics problem has arisen.
The below-cloud scavenging by precipitation is an important aerosol particle removal
mechanism. While vd is an important parameter related to dry deposition, a scavenging
coefficient (λ) is that for wet deposition. λ represents a fractional amount of aerosol
particles of certain size which are removed from atmosphere by precipitation per time
unit∂c(dp)
∂t= −λ(dp)c(dp) (25)
where c(dp) is concentration of particles with a diameter dp.
Although many theoretical and experimental studies have been carried out in the last
few years, below-cloud λ still has large uncertainties. Assuming that U(t) >> u(t), λ
is
λ(dp) =
∫ ∞0
π
4(Dp)
2Ut(Dp)E(Dp, dp)N(Dp)dDp (26)
where N(Dp) is number concentration of raindrops of the size Dp and E(Dp, dp) is
the collection efficiency between raindrops and particles. Raindrop-aerosol collision
efficiency takes into account the contribution of Brownian diffusion, interception and
16

Figure 4: In- and below-cloud scavenging of particles.
inertial impaction (Slinn, 1983)
E(Dp, dp) = 4ReSc
(1 + 0.4Re1/2Sc1/3 + 0.16Re1/2Sc1/2
)+ (27)
4 dpDp
[µaµw
+ (1 + 2Re1/2) dpDp
]+ Ee (28)
where Re and Sc are particle Reynolds and Schmidt numbers, µ is air viscosity and
indexes a and w refer to aerosol and water. Raindrop size distribution is usually
described by exponential (e.g. Marshall and Palmer , 1948), gamma (e.g. Ulbrich, 1983)
or lognormal distribution (e.g. Cerro et al., 1997).
The electric term Ee is (Pruppacher and Klett , 1998; Andronache, 2004)
Ee =16KCca
2α2dp3πµaU
(29)
where K = 9e9 Nm2C−2s−1, a = 0.83e−6 and α is an empirical parameter varying
from 0 (neutral particles) to 7 (highly electrified clouds during thunderstorms). Cc is
17

the Cunningham slip correction factor to account for non-continuum effects associated
with small particles.
While Slinn (1983) included Brownian diffusion, interception and inertial impaction
in E(Dp, dp), the recent parameterizations add also phoretic terms (thermo-, diffusio-
and electrophoresis), which increase E(Dp, dp) especially in sub-micrometer particles.
However, theoretical values for λ are still usually order of magnitude smaller than
those based on observations. Therefore, more scavenging measurements and theoretical
studies are needed to improve the existing models. This is especially true for the below
3 µm aerosol particles where the discrepancy between the models and measurements
is largest (Wang et al., 2010). The most uncertain terms of the scavenging equation
are E(Dp, dp) and the Dp distribution (Wang et al., 2010). In contrast to Mircea et al.
(2000), Wang et al. (2010) found that the various Dp distributions can yield 3 to 5
fold difference to λ values depending on rainfall intensity and dp. Also, the uncertainty
related to Ut exists, but is generally smaller than factor of 2.
Snow scavenging is even more complicated process due to large variety of frozen pre-
cipitation: snow flakes, ice grains, ice pellets and so on. Different shapes, sizes and
densities result differences in terminal settling velocities and cross-sectional areas. The
process is not well understood and only a few studies exist (e.g. Graedel and Franey ,
1975; Jylha, 2000; Ying et al., 2004; Paramonov et al., 2011, Paper VIII). Pruppacher
and Klett (1998) found that aerosol particles are scavenged at the rim of ice crystals
due to a strong horizontal flow underneath the falling crystal. Snowflakes are better
collectors than ice crystals because of the filtering effect; collection efficiency is depen-
dent on the flow through the aggregates rather than on the flow around the crystal
(Mitra et al., 1990).
18

3 Experimental methods and measurements
Measurement set-ups and detailed description of data processing are given in papers
followed this introductory part. Therefore, only a common description about site and
the methods used in the studies are given in this chapter.
The main particle measurement device was condensation particle counter (CPC), which
measures particles from 0.01 to 1.0 µm (TSI-3010) or from 0.003 to 1.0 µm (TSI-3025)
in diameter. Inside a CPC the sample flow goes through a saturator and becomes
saturated with alcohol vapor. The flow continues into a cooled condenser where the
alcohol supersaturates and condenses onto particles forming droplets. Droplets pass
through a thin ribbon of laser light which scatters by the droplets. The light signal is
focused onto a photodetector and converted to an electrical pulse which is counted.
Aerosol particle size distribution measurements were performed with two differential
mobility particle sizers (DMPS). A DMPS consisted of a neutralizer, Hauke-type differ-
ential mobility analyzer (DMA) and a condensation particle counter (CPC). The first
DMPS measured particle size spectrum between 3 - 40 nm and the second between
10 - 1000 nm with a time resolution of 10 minutes. Aalto et al. (2001) describe this
twin-DMPS system used at SMEAR II station. Figure 5 shows a mean aerosol size
distribution at SMEAR II during the spring 2005.
3.1 SMEAR II measurement site
All the measurements were carried out at the SMEAR II station in southern Finland
(61◦51′N, 24◦17′E, 181 m above sea level). The Scots pine stand (Pinus sylvestris L.)
around the station is a rather homogeneous, established in 1962 through direct sowing
after clear felling and prescribed burning. The height of the dominant trees were about
14 - 16 m. The homogeneous fetch in the prevailing wind direction (230◦) is 250 m
(Vesala et al., 1998). The soil is podzolic and composed of sandy and coarse silty
glacial till, and the terrain is subject to modest height variations. The annual mean
temperature in 1961 - 1990 was +2.9 ◦C and the annual mean precipitation 700 mm.
Part of the stand was thinned between January and March 2002, and total LAI in the
thinned area dropped from 8 to 6 (Vesala et al., 2005). Hari and Kulmala (2005) give
more information about atmospheric measurements at the site.
19

Figure 5: Mean size (diameter, dp) distribution for aerosol number (N) measured
with twin-DMPS at SMEAR II between March 1st to May 31st, 2005. Mean particle
concentration was 2880 cm−3.
3.2 Eddy covariance
Eddy covariance method (EC) is the most direct way to measure vertical turbulent
fluxes of atmospheric constituents. The principle of EC is simple: in horizontally
homogenous and stationary conditions the vertical flux equals all sources and sinks
in the source area, the footprint. In EC, the flux (Fc) is calculated as a covariance
between the vertical wind velocity (w) and concentration of the compound (c)
Fc = c′w′ =1
t2 − t1
∫ t2
t1
((c(t)− c)(w(t)− w))dt (30)
where overlines denote time averages. Due to significant portion of vertical flux carried
by less than few seconds time scale eddies, the w and c should be measured with a
fast response time. Wesely et al. (1977) was the first one who published the results
of particle flux measurements performed with EC. Since then, the EC has become the
most common tool for particle flux measurements above the surface (e.g. Wesely and
Hicks , 2000; Fairall , 1984; Lamaud et al., 1994; Buzorius et al., 1998, 2000; Rannik
20

et al., 2001, 2003; Held et al., 2006; Pryor et al., 2007). EC has also used within
a canopy to measure mainly energy and CO2 exchange (e.g. Baldocchi et al., 1986;
Blanken et al., 1998; Launiainen et al., 2005; Misson et al., 2006). To my knowledge,
Paper III presents the first measurements of particle fluxes to forest floor by using
EC.
A footprint area depends on the measurement height, topography, wind speed and
surface layer stability. According to Sogachev et al. (2004), at SMEAR II when near-
neutral conditions, 80% of fluxes measured at 23 m height has a footprint extending
200 - 300 m upwind from the measurement tower.
The EC methodology assumes stationarity and horizontal homogeneity of sinks, sources
and transport phenomena. By using linear de-trending the weak non-stationary con-
centration changes (linear trend) can be corrected to stationary. Typically data post-
processing include co-ordinate rotation of the wind speed components to remove ad-
vective part from the flux. Also, the delay time due to air traveling in the sampling
tube (time lag) is taken into account. That is calculated from searching for the largest
correlation between the vertical wind speed and concentration measurements inside a
certain, theoretically estimated time window.
Data processing could include corrections related to EC measurement. WPL correc-
tion is taking into account variation of particle concentration due to density variations
caused by heat or water vapor fluxes. The errors due to imperfect frequency response
of an analyzer can be estimated and accounted by using the spectral models based on
Fourier transformed auto- and cross-correlation functions producing power and cross
spectrum, respectively. In atmospheric studies, usually the one-sided (frequencies from
zero to plus infinity) power spectrum and real part of the cross-spectrum (co-spectrum)
are used (e.g. Kaimal and Finnigan, 1994). Sometimes also a correction for the influ-
ence of deliquescence causing condensation or evaporation and therefore variation in
the detection of particles is applied.
3.3 Relaxed eddy accumulation
Despite the importance of size-resolved particle flux and deposition velocity determi-
nation, only few studies have sought to quantify the size dependence of sub-micron
particle vd. At the time that was mainly due to requirement of fast analyzers in EC
21

applications. Therefore, a relaxed eddy accumulation (REA) collection system with
DMPS was build up at SMEAR II site (Paper II and Gaman et al., 2003).
The history of accumulation methods begin on 1972, when Desjardins (1972) presented
an eddy accumulation (EA) method where instantaneous air samples are collected by
two separate reservoirs. One reservoir opens when air flow is upward (w+) and the
other when the flow is downward (w−). After a sufficiently long sampling period the
total air mass collected and measured in the two reservoirs represents the total vertical
flux
w+c+ w−c = w+(c+ c′) + w−(c+ c′) (31)
= (w+w−)c+ w+c′ + w−c′ (32)
= w+c′ + w−c′ (33)
= w′c′ (34)
where one assumes w++w− = w = 0. The disadvantage with EA is that the sample flow
rate has to be adjusted instantaneously according to magnitude of w. To simplify the
problem, Businger and Oncley (1990) suggested a REA method in which the vertical
flux is determined as the product of the standard deviation of w (σw) and the mean
concentration difference of the air sampled upwards and downwards multiplied by an
empirical constant β (Businger coefficient):
w′c′ = βσw(c+ − c−) (35)
To maximize signal-to-noise ratio (the ratio of the concentration difference between
the c+ and c− to the uncertainty in the concentration measurement) the samples are
collected only when |w| >deadband (a threshold value w0). The signal increases with
increasing w0, but at the same time decreases the effective sampling time resulting the
larger noise. Thus, to minimize the total uncertainty, an optimal compromise should be
found. Usually, the deadband proportional to σw is used. To avoid dependence of β on
stability, we applied a dynamic deadband proportional to the 5 minutes running mean
of σw. Then, the constant value for β can be used and it depends only on deadband
width (Paper I). It is recommended to determinate the value β by using fast analyzers
and assuming scalar similarity (Papers I and II)
β =w′c′
σw(c+ − c−). (36)
22

3.4 Scavenging coefficient determination
Both rain and snow scavenging studies (Papers VI and VIII) are based on semi-
empirical approach similar to Mircea and Stefan (1998). The scavenging coefficient is
calculated by integrating Eq. 25 from t0 to t1 resulting
λ(dp) = − 1
t1 − t0ln
(c1(dp)
c0(dp)
), (37)
where c0(dp) and c1(dp) are particle size distributions at the time t0 and t1, respectively.
λ can be determined as an average value or as a slope of the logarithm as a function
of t. This applies if scavenging is the only process affecting to aerosol particle size
distribution. However, many other processes exist: condensation, coagulation, advec-
tion, etc. (see papers VI, VII and VIII). Therefore, a large data set and a careful
data selection is needed to minimize the effect of other mechanisms than precipitation
scavenging.
In Paper VI, precipitation was measured with tipping bucket ARG100 rain gauge. It
collects liquid precipitation by a funnel to one of the two buckets. When the first is
full, the balance arm tips, empties the bucket, and moves the second one under the
funnel. The number of tips are counted and saved with time resolution of 15 minutes.
Disadvantage of the device is that it is not able to measure frozen precipitation and
the flow field around the funnel tends to divert droplets past the funnel.
In Paper VIII, snow and rain precipitation was measured with Vaisala FD12P weather
sensor. It includes optical forward scattering sensor and capacitive precipitation sensor
and is able to measure both precipitation type and amount as well as visibility. The
wavelength of light is 875 nm and sample volume is about 0.1 dm3 located at the
intersection of transmitter and receiver beams.
23

4 Results and discussion
An overview of the results obtained in the following peer-reviewed studies is given
here. However, the reader is encouraged to read through the original studies (Papers
I-VIII) to get a full understanding about the research and the results.
Starting from the measurements, Paper I presents the effect of deadband width and
atmospheric stability on the numerical value of empirical β coefficient used to invert
measured REA data to flux. Our simulations show that by using dynamic deadband,
only a weak dependence between β and atmospheric stability appears. Therefore, the
use of a constant β is justified. In agreement with previous studies (Paper I, Table
4), the median value obtained for a system with dynamic deadband proportional to 0.5
times the running mean of σw was β = 0.42± 0.03.
By REA system we were able to measure size segregated particle fluxes (Paper II).
Particles in the size range of 80 − 100 nm had the lowest vd, about 0.4− 0.5 cm s−1.
From 80 − 100 nm size, vd increased with decreasing or increasing particle diameter.
At the larger end, our results agree with those obtained by Gallagher et al. (1997).
Compared to indirect results from EC (Rannik et al., 2001, 2003, Paper III), vd
measured with REA are higher. The reason for that is not understood although some
hypothesis could be presented.
Measurements allowed us also to study the effect of increasing turbulence on vd. Figure
6 shows mean deposition velocities of 15− 80 nm particles as a function of u∗. Size
classes 15, 20, 25 and 40 nm and size classes 50, 60, 70 and 80 nm were combined to
get enough data for statistical analysis. For 30 nm particles, enough (12 months) data
was available. Although the uncertainty is large, a clear dependence of vd on u∗ exists,
especially for high u∗ values. This is consistent with other flux studies.
To proceed from a bulk deposition studies to multi-layer approach, we installed EC
measurement set-up below the canopy (Paper III). Spectral analysis showed that the
method could be used to study ground deposition in a forest, which was the main
advantage of the work. Also, we observed that approximately 20% of the particles
penetrated the canopy and deposited on the forest floor. The promising results let us
to continue the measurements and after a year we had enough data to build up and
verify a multi-layer particle deposition model (MLM) presented in Paper IV.
With the MLM we were able to show that turbo-phoresis, excluded from the most of
24

Figure 6: Deposition velocities measured with REA (Paper II). Vertical bars denotes
standard deviations.
the existing models, provides a coherent explanation why vd measured over tall forests
do not support a clearly defined minimum for particle sizes in the range of 0.1-2 µm.
Turbo-phoresis is also likely to explain why particle dry deposition velocities observed
over tall forests behave differently in the inertial-impaction regime than data from
many laboratory and short-canopy crop experiments. The latter have indicated that
when vd is normalized by u∗ (V +d ) and presented as a function of τp normalized by ν
(τ+p ), a power-law scaling in the form of V +d ∼
(τ+p)2
emerges in the inertial-impaction
regime. Over forest canopies, turbo-phoresis was found to increase vd especially in that
particular size range (Paper IV).
The MLM was also used to study the influence of vertical leaf area shape and total LAI
on vd (Fig. 7). At SMEAR II, thinning was performed during the winter 2002, which
provided a nice set of experimental data to compare the MLM results. Both MLM and
the measurements (Paper V) showed that after thinning vd diminished about 25 %,
which was comparable with the reduction of single-sided LAI. Besides of the value of
LAI, vd depends also on the location of leaves: 1) at a given LAI a constant leaf area
25
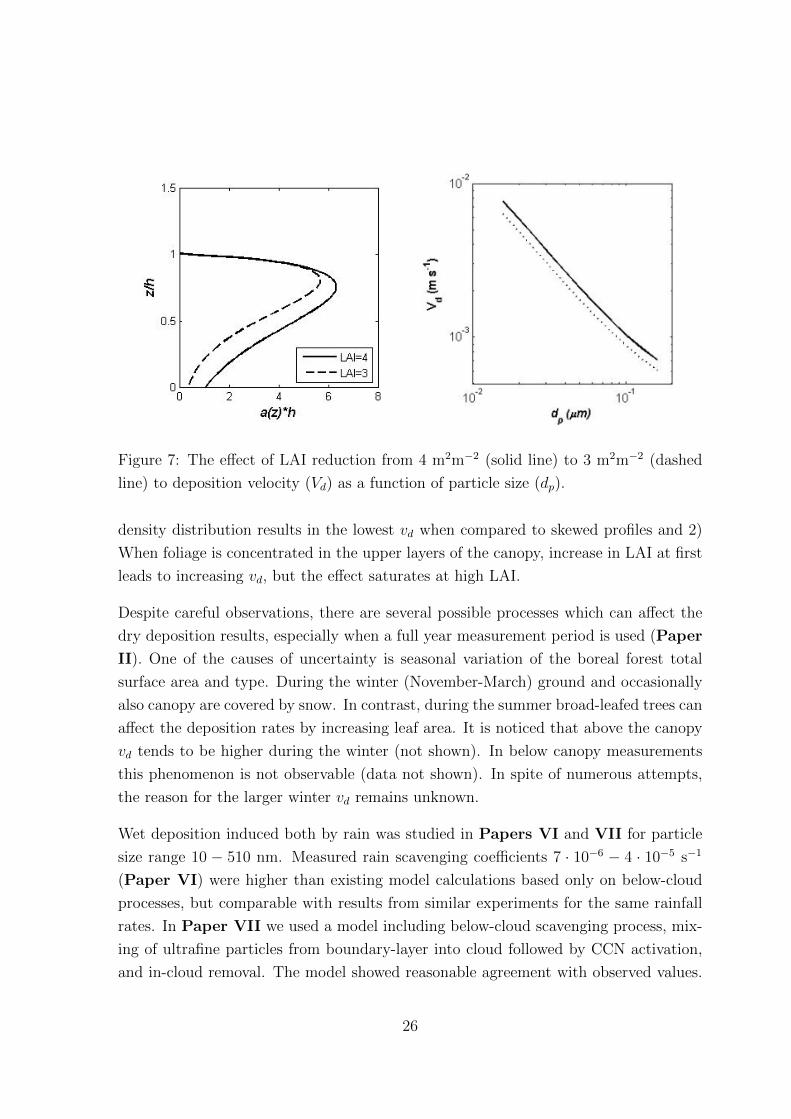
Figure 7: The effect of LAI reduction from 4 m2m−2 (solid line) to 3 m2m−2 (dashed
line) to deposition velocity (Vd) as a function of particle size (dp).
density distribution results in the lowest vd when compared to skewed profiles and 2)
When foliage is concentrated in the upper layers of the canopy, increase in LAI at first
leads to increasing vd, but the effect saturates at high LAI.
Despite careful observations, there are several possible processes which can affect the
dry deposition results, especially when a full year measurement period is used (Paper
II). One of the causes of uncertainty is seasonal variation of the boreal forest total
surface area and type. During the winter (November-March) ground and occasionally
also canopy are covered by snow. In contrast, during the summer broad-leafed trees can
affect the deposition rates by increasing leaf area. It is noticed that above the canopy
vd tends to be higher during the winter (not shown). In below canopy measurements
this phenomenon is not observable (data not shown). In spite of numerous attempts,
the reason for the larger winter vd remains unknown.
Wet deposition induced both by rain was studied in Papers VI and VII for particle
size range 10 − 510 nm. Measured rain scavenging coefficients 7 · 10−6 − 4 · 10−5 s−1
(Paper VI) were higher than existing model calculations based only on below-cloud
processes, but comparable with results from similar experiments for the same rainfall
rates. In Paper VII we used a model including below-cloud scavenging process, mix-
ing of ultrafine particles from boundary-layer into cloud followed by CCN activation,
and in-cloud removal. The model showed reasonable agreement with observed values.
26

Figure 8: Scavenging coefficients (dn/dt1/n) for snow and rain precipitation and virtual
scavenging coefficient for dry deposition as a function of particle size (Dp) calculated
assuming well-mixed situation in boundary-layer with height 1000 m.
According to the model, ultrafine particle removal by rain depends on particle size,
rainfall intensity, mixing processes between boundary-layer and cloud elements, the in-
cloud collection efficiency and coagulation with droplets. Also chemical composition of
particles can impact the growth factor and affect the scavenged fraction of particles in
supersaturated conditions. Electric charge may play a role in scavenging by increasing
the collection efficiency.
By using similar approach than for rain, we determined snow scavenging coefficients in
Paper VIII for particles between (10− 1000 nm). Scavenging coefficients varied from
8.7 · 10−6 to 5.2 · 10−5 s−1 depending on particle size and precipitation intensity. This
study was afterwards repeated in an urban area and compared to radar measurements
(Paramonov et al., 2011).
To compare dry and wet deposition, a ’virtual’ scavenging coefficient can be determined
for dry deposition (REA data, Paper II) using measured vd and assuming well-mixed
boundary layer with a height of, say, 1000 m. Figure 8 illustrates the scavenging
coefficients determined for rain and snow as well as for dry deposition For the size-
27

segregated data, a parametrization presented in Paper VI is used. To summarize, wet
deposition is an order of magnitude more effective ’air cleaner’ than dry deposition.
28
5 Review of papers and author’s contribution
Paper I presents simulations to determinate a magnitude of the factor β related to
REA data inversion to fluxes. Also deadband width is studied to optimize signal to
noise ratio and statistics. I am responsible for simulations, data analysis and writing.
Paper II is a clear continuum to Paper I although published before that. It presents,
to my knowledge, the first size-segregated vd measurements covering particle sizes from
10 to 150 nm. Also the dependence of vd on u∗ was reported. I am responsible for
data analysis and writing this paper.
Paper III is written to show that particle flux measurement with EC is possible to
carry out successfully also below canopy. Related to Paper II, size-segregated vd are
derived and below canopy data set is compared to above canopy flux data. I did the
most of the data analysis and about a half of writing.
Paper IV presents a new multi-layer deposition model for a forest canopy and floor.
The experience gained in Paper III enabled to continue the below canopy flux mea-
surements and get an extensive data set to verify the model. With the model we
studied turbophoresis and found that it at least partly explained distinctions between
the measurements and existing models. I was partly responsible for planning, installing
and running the measurements and made data-analysis. I partly developed the model
and wrote some chapters of the article.
Paper V takes advantage of the MLM developed in Paper IV and studies the effect
of canopy structure and magnitude of LAI on vd. I am responsible for data analysis,
planning, and partly for writing.
Paper VI was the first published paper in this thesis. It reports size-segregated
scavenging coefficients for ultrafine particles determined from DMPS measurements
accounting of precipitation intensity. I did about half of the data analysis and writing
of this paper.
Paper VII is a modeling study which shows that including in-cloud scavenging in
addition to below-cloud wet deposition was necessary to reproduce the field observa-
tions presented in Paper VI. I am responsible for data analysis, parametrization, and
partly for writing.
29

Paper VIII attacks snow scavenging. As in Paper VI, size-segregated scavenging
coefficients and a parametrization for ultrafine particles is presented. I supervised this
work and am responsible for parametrization and codes to process the data.
30

6 Conclusions
The open questions in the field of particle deposition were presented in the beginning
of this book. The first one was lack of measurement data of size-segregated particle
fluxes, especially in the size-range below few hundred nm. As mentioned, dry deposition
velocity depends on particle size and turbulence. In Paper II we measured deposition
velocities (vd) of 10 - 150 nm using REA system and studied the friction velocity (u∗)dependence. As expected, the highest vd was measured for the smallest particles and
the vd decreased with increasing particle diameter. vd was duly dependent on u∗. The
dependence was strongest for the smallest particles. The results of Paper I improve
REA data inversion.
The second aim was to study partitioning of particle deposition between vegetation
and the underlying ground. We grab this task by setting a particle EC measurement
unit below canopy and showed by spectral analysis that the measurements are robust
(Paper III). The main result of the short measurement period was that about 20
% of particles penetrated the canopy and deposited on the ground. This work was
continued in Paper IV, where the sub-canopy particle flux measurements over one
year were analyzed and used to verify a multilayer deposition model. The model was
further used to study the effect of canopy structure on vd (Paper V).
Third problem was to find out why the observations over forests generally do not
support the pronounced minimum of deposition velocity for particles 0.1 - 2 µm. In
Paper IV we show that turbophoresis, when accounted for at the leaf scale in vertically
resolved models, provide a plausible explanation for the discrepancy. It also explains
why a power law scaling in the form of vd normalized by u∗ ∼ particle time scale
normalized by air viscosity to the power of 2 emerges in the inertial-impaction regime
for laboratory experiments but not in the forest measurements.
The fourth issue concern lack of size-segregated scavenging coefficient data. In Paper
VI, VII and VIII we present scavenging coefficients and parametrization both for
rain and snow scavenging. Together with dry deposition velocities at the same site, we
were able also to compare these removal mechanisms to each other. The importance
of particle dry deposition relative to wet deposition depends on the solubility of the
species in water, the amount of precipitation in the region and the surface properties.
Effectiveness of snow scavenging depends on the crystal or snow flake structure and air
relative humidity.
31

References
Aalto P., K. Hameri, E. Becker, R. Weber, J. Salm, J. Makela, C. Hoell, C. O’Dowd, H.
Karlsson, H.-C. Hansson, M. Vakeva, I. K. Koponen, G. Buzorius and M. Kulmala
(2001), Physical characterization of aerosol particles during nucleation events. Tellus,
53B, 344–358.
Aluko, O. and K. E. Noll (2006), Deposition and suspension of large, airborne particles.
Aerosol Sci. Technol., 40, 503–513, doi:10.1080/02786820600664152.
Andronache, C. (2004), Diffusion and electric charge contributions to below-cloud wet
removal of atmospheric ultra-fine aerosol particles. J. Aerosol Sci., 35, 1467–1482.
Baldocchi, D. D., S. B. Verma, D. R. Matt and D. E. Anderson (1986), Eddy-correlation
measurements of carbon dioxide efflux from the floor of a deciduous forest. J. Appl.
Ecol., 23, 967–975.
Blanken, B. D., T. A. Black, H. H. Neumann, G. Den Hartog, P. C. Yang, Z. Nesic, R.
Staebler, W. Chen and M. D. Novak (1998), Turbulent flux measurements above and
below the overstory of a boreal aspen forest. Boundary Layer Meteorol., 89, 109–140.
Bosanquet, C. H. and J. L. Pearson (1936), The spread of smoke and gases from
chimneys. Trans. Faraday Soc., 32, doi:10.1039/TF9363201249.
Brock, J. R. (1962), On the theory of thermal forces acting on aerosol particles. J.
Colloid Sci., 17, 768–780.
Businger, J. A. and Oncley S. P. (1990), Flux measurement with conditional sampling.
J. Atmos. Ocean. Tech., 7, 349–352.
Buzorius, G., U. Rannik, J.M. Makela, T. Vesala and M. Kulmala (1998), Vertical
aerosol particle fluxes measured by eddy covariance technique using condensational
particle counter. J. Aerosol Sci., 29, 157–171.
Buzorius, G., U. Rannik, J.M. Makela, P. Keronen, T. Vesala and M. Kulmala (1998),
Vertical aerosol particle fluxes measured by eddy covariance method and deposition
of nucleation mode particles above Scots pine forest in southern Finland. J. Geophys.
Res., 105, 19905–19916.
Caporaloni, M., F. Tampieri, F. Trombetti, and O. Vittori (1975), Transfer of particles
in nonisotropic air turbulence. J. Atmos. Sci., 32, 565–568.
32

Cassiani, M., G. G. Katul, and J. D. Albertson (2008), The effects of canopy leaf area
index on airflow across forest edges: Large-Eddy Simulation and analytical results.
Boundary-Layer Meteorol., 126, 433–460.
Cerro, C., Codina, B., Bech, J., and Lorente, J. (1997) Modelling raindrop size distri-
bution and Z(R) relations in the Western Mediterranean Area. J. Appl. Meteorol.,
36, 1470-1479.
Chamberlain, A.C. (1967), Deposition of particles to natural surfaces. Symp. Soc. Gen.
Microbiol., 17, 138–64.
Desjardins, R. L. (1972), A study of carbon-dioxide and sensible heat fluxes using the
eddy correlation technique. Ph.D. dissertation, Cornell University.
Detto M., G. G. Katul, M. B. Siqueira, J.-Y. Juang, P. Stoy (2007), The structure of
turbulence near a tall forest edge: the backward facing step flow analogy revisited.
Ecol. Appl., 18, 1420–1435.
Donat, J. and B. Ruck (1999), Simulated ground deposition of fine airborne particles
in an array of idealized tree crowns. Boundary-Layer Meteorol., 93, 469–492.
Fairall, C. W. (1984), Interpretation of eddy-correlation measurements of particulate
deposition and aerosol flux, Atmos. Environ., 18, 1329–1337.
Feng, J. (2008), A size-resolved model and a four-mode parameterization
of dry deposition of atmospheric aerosols. J. Geophys. Res., 113, D12201,
doi:10.1029/2007JD009004.
Fenton, D.L., R.Y. Purcell, D. Hrdina and E.O. Knutson (2008), The washout of
combustion-generated hydrogen chloride. Atmos. Environ., 14, 1055.
Finnigan, J.J. (2000), Turbulence in plant canopies. Ann. Rev. Fluid Mech., 32, 519–
571.
Gallagher M., K. Beswick, J. Duyzer, H. Westrate, T. Choularton, and P. Hummelshøj
(1997), Measurements of aerosol fluxes to Speulder forest using a micrometeorological
technique. Atmos. Environ., 31, 359–373.
Gaman A., Rannik, U., Aalto, P., Pohja, T., Siivola, E., Kulmala, M and Vesala, T.
(2003), Relaxed Eddy Accumulation System for Size-Resolved Aerosol Particle Flux
Measurements. J. Atmos. Ocean. Tech., 21, 933–943.
33

Graedel, T. E. and Franey, J. P. (1975), Field measurements of submicron aerosol
washout by snow. Geophys. Res. Lett., 2, 325–328
Guha, A. (1997), A unified Eulerian theory of turbulent deposition to smooth and
rough surfaces. J. Aerosol Sci., 28, 1517–1537, doi:10.1016/S0021-8502(97)00028-1.
Hari P. and M. Kulmala (2005), Station for Measuring Ecosystem-Atmosphere Rela-
tions (SMEAR II), Boreal. Environ. Res., 10, 315–322.
Held, A., A. Nowak, A. Wiedensohler and O. Klemm (2006), Field measurements and
size-resolved model simulations of turbulent particle transport to a forest canopy. J.
Aerosol Sci., 37, 786–798.
Jylha, K. (2000), Removal by snowfall of emissions from a coal-fired power plant:
observations and modelling. Water Air Soil Pollut., 120, 397–420.
Kaimal, J. C. and Finnigan, J. J. (1994), Atmospheric boundary-layer flows: Their
structure and measurement, Oxford University Press, Oxford.
Kramm, G. Beheng, K.-D. and Muller, H. (1992), Modeling of the vertical transport
of polydispersed aerosol particles in the atmosphere surface layer. In: Precipitation
Scavenging and Atmosphere-Surface Exchange Processes, 2, Hemisphere Publishers,
Washingon/Philadelphia/London, 1125–1141.
Lamaud, E., Y. Brunet, A. Labatut, A. Lopez, J. Fontan, and A. Druilhet (1994), The
Landes experiment: Biosphere-atmosphere exchanges of ozone and aerosol particles
above a pine forest. J. Geophys. Res., 99(D8), 16,1511–16,521.
Launiainen, S., J. Rinne, J. Pumpanen, L. Kulmala, P. Kolari, P. Keronen, E. Siivola,
T. Pohja, P. Hari, and T. Vesala (2005), Eddy covariance measurements of CO2 and
sensible and latent heat fluxes during a full year in a boreal pine forest trunk-space,
Boreal Environ. Res., 10, 569–588.
Li, W.K., C.Y. Soong, C.H. Liu, and P.Y. Tzeng (2010), Parametric analysis of energy
absorption in micro-particle photophoresis in absorbing gaseous media, Defence Sci.
J., 60, 233–237.
Lyklema, J. (2005), Fundamentals of Interface and Colloid Science, solid-liquid inter-
faces, Academic Press, A Harcourt Science and Technology Company, San Diego,
ISBN 0-12-460524-9.
34

Marshall, J. S. and Palmer, W. M. (1948). The distribution of raindrop with size. J.
Meteorol., 5, 165-166.
Misson, L., et al. (2006), Partitioning forest carbon fluxes with overstory and under-
story eddy-covariance measurements: A synthesis based on FLUXNET data. Agric.
For. Meteorol., 144, 14–31.
Mitra, S. K., Vohl, O. M., Ahr, M. and Pruppacher, H. R. (1990). A wind tunnel and
theoretical study of the melting behaviour of atmospheric ice particles. IV. Experi-
ment and theory of snow flakes. J. Atmos. Sci., 47, 584-591.
Mircea, M. and S. Stefan (1998), A theoretical study of the microphysical parame-
terization of the scavenging coefficient as a function of precipitation type and rate.
Atmos. Environ., 32, 2931–2938.
Mircea, M., Stefan, S., and Fuzzi, S. (2000). Precipitation scavenging coefficient: in-
fluence of measured aerosol and raindrop size distributions. Atmos. Environ., 34,
5169-5174.
Noll, K. E., M. M. Jackson, and A. K. Oskoie (2001), Development of an at-
mospheric particle dry deposition model, Aerosol Sci. Technol., 35, 627–636,
doi:10.1080/027868201316899983
Ould-Dada, Z. and Baghini, N. M. (2001), Resuspension of small particles from tree
surfaces, Atmos. Environ., 35, 3799–3809.
Paramonov, M., Gronholm, T. and Virkkula, A. (2011), Below-cloud scavenging of
aerosol particles by snow at an urban site in Finland, Boreal Env. Res., 16, 304–320.
Petroff, A., A. Mailliat, M. Amielh, and F. Anselmet (2008a), Aerosol dry deposition
on vegetative canopies. Part I: Review of present knowledge, Atm. Environ., 42,
3625–3653, doi:10.1016/j.atmosenv.2007.09.043.
Petroff, A., A. Mailliat, M. Amielh, and F. Anselmet (2008b), Aerosol dry deposition
on vegetative canopies. Part II: A new modelling approach and applications, Atm.
Environ., 42, 3654–3683, doi:10.1016/j.atmosenv.2007.12.060.
Pruppacher, H. R. and Klett, J. D. (1998), Microphysics of clouds and precipitation,
Kluwer Academic Publishers, Dordrecht, Boston, London, pp. 954.
35

Pryor S.C., S. E. Larsen, L. L. Sørensen, R. J. Barthelmie, T. Gronholm, M. Kulmala,
S. Launiainen, U. Rannik, and T. Vesala (2007), Particle fluxes over forests: Anal-
yses of flux methods and functional dependencies. J. Geophys. Res., 112, D07205,
doi:10.1029/2006JD008066.
Pryor S., M. Gallagher, H. Sievering, S. E. Larsen, R. J. Barthelmie, F. Birsan, E.
Nemitz, J. Rinne, M. Kulmala, T. Gronholm, R. Taipale, and T. Vesala (2008a), A
review of measurement and modeling results of particle atmosphere-surface exchange.
Tellus, 60B, 42–75.
Rannik, U., T. Petaja, G. Buzorius, P. Aalto, T. Vesala and M. Kulmala (2003),
Deposition velocities of nucleation mode particles into a Scots pine forest. Environ.
Chem. Phys., 22, 97–102.
Rannik, U., P. Aalto, P. Keronen, T. Vesala and M. Kulmala (2003), Interpretation
of aerosol particle fluxes over a pine forest: Dry deposition and random errors. J.
Geophys. Res., 108, 1–11.
Reed, L. D. (1977), Low Knudsen number photophoresis. J. Aerosol Sci., 8, 123–131.
Reeks, M. W. (1983), The transport of discrete particles in inhomogeneous turbulence.
J. Aerosol Sci., 14, 729–739, doi:10.1016/0021-8502(83)90055-1.
Scott, B. C. (1982), Theoretical estimates of the scavenging coefficient for soluble
aerosol partilces as a function of precipitation type, rate and altitude. Atmos. Envi-
ron., 16, 1753.
Sehmel G. A. (1980), Particle and gas dry deposition: a review. Atmos. Environ., 14,
983–1011.
Seinfeld J. H. and S. N. Pandis (1998), In: Atmospheric Chemistry and physics: From
Air Pollution to Climate Change, John Wiley & Sons, Inc., New York.
Slinn, W. G. N. (1977), Precipitation scavenging: some problems, approximate solu-
tions and suggestions for future reasearch. ERDA 41 Symposium Series. Precipitation
Scavenging, 1–65.
Slinn, S. A. and W. G. N. Slinn (1980), Predictions for particle deposition on natural
waters. Atmos. Environ., 14, 1013–1026, doi:10.1016/0004-6981(80)90032-3.
36

Slinn, W. G. N. (1982), Predictions of particle deposition to vegetative surfaces. Atmos.
Environ., 16, 1785–1794, doi:10.1016/0004-6981(82)90271-2.
Slinn, W. G. N. (1983). Precipitation scavenging. In: Atmospheric Sciences and Power
Production - 1979, chap. 11, Division of Biomedical Environmental Research, U.S.
Department of Energy, Washington, D.C.
Sogachev, A., U. Rannik, and T. Vesala (2004), Flux footprints over complex terrain
covered by heterogeneous forest. Agric. For. Meteorol., 127, 142–158.
Stull, R. B. (1988). Introduction to boundary-layer meteorology, Kluwer Academic
Publishers, Dordrecht, ISBN: 90-277-2768-6.
Tammet, H., Kimmel, V. and Israelsson, S. (2001). Effect of atmospheric electricity on
dry deposition of airborne particles from atmosphere. Atmos. Environ., 35, 3413–
3419.
Thomas, M.D. (1951), Gas damage to plants. Ann. Rev. Plant Physiol., 2, 293–322.
Ulbrich, C. W. (1983). Natural variations in the analytical form of the rain drop size
distribution. J. Clim. Appl. Meteorol., 22, 1764-1775.
Venkatram, A. and Pleim, J. (1999), The electrical analogy does not apply to modeling
dry deposition of particles. Atmos. Environ., 33, 3075–3076.
Vesala, T., Haataja, J., Aalto, P., et al. (1998) Long-term field measurements of
atmosphere-surface interactions in boreal forest combining forest ecology, microm-
eteorology, aerosol physics and atmospheric chemistry. Trends in Heat, Mass and
Momentum Transfer, 4, 17–35.
Vesala, T., Suni, T., Rannik, U., Keronen, P., Markkanen, T., Sevanto, S., Gronholm,
T., Smolander, S., Kulmala, M., Ilvesniemi, H., Ojansuu, R., Uotila, A., Levula,
J., Makela, A., Pumpanen, J., Kolari, P., Kulmala, L., Altimir, N., Berninger, F.,
Nikinmaa, E. and Hari, P. (2005), Effect of thinning on surface fluxes in a boreal
forest. Global Biogeochem. Cycles, 19, doi:10.1029/2004GB002316.
Wang, X., Zhang, L., and Moran, M. D. (2010). Uncertainty assessment of current
size-resolved parameterizations for below-cloud particle scavenging by rain. Atmos.
Chem. Phys. Discuss., 10, 2503-2548.
37
Wesely, M. L. and B. B. Hicks (2000), A review of the current status of knowledge on
dry deposition. Atm. Environ., 34, 2261–2282.
Wesely, M. L., D. R. Cook, R. L. Hart, and R. E. Speer (1985), Measurements and
parameterization of particulate sulful dry deposition over grass. J. Geophys. Res.,
90, 2131–2143.
Wesely, M., B. Hicks, W. Dannevik, S. Frisella and R. Husar (1977), An eddy-
correlation measurement of particulate deposition from the atmosphere. Atmos. En-
viron., 11, 561–563.
Ying, Y. D., Lei, D. and Wania, F. Is rain or snow a more efficient scavenger of organic
chemicals? Atmos. Environ., 38, 3557–3571.
Young, J. and A. Leeming (1997), A theory of particle deposition in turbulent pipe
flow. J. Fluid Mechanics, 340, 129–159.
Zhao, B. and J. Wu (2006), Modeling particle deposition from fully developed turbulent
flow in ventilation duct. Atm. Environ., 40, 457–466.
Zufall, M.J. and Davidson, C.I.(1998), Dry deposition of particles. In: Atmospheric
Particles, 5, John Wiley & Sons, Chichester, 425–473.
38