deposit mechanism design and corresponding decision
TRANSCRIPT
Research ArticleDeposit Mechanism Design and Corresponding DecisionStrategy considering Uncertainty of Customer Behaviour
Qingshan Xu 1 Mengjia Liu 1 Yu Huang1 Hong Sun2 and Xinjia Li2
1School of Electrical Engineering Southeast University Nanjing 210096 China2Jiangsu Frontier Electric Technologies Co Ltd Nanjing 211102 China
Correspondence should be addressed to Mengjia Liu 220162210seueducn
Received 20 June 2018 Accepted 16 August 2018 Published 30 September 2018
Academic Editor Gaetano Zizzo
Copyright copy 2018 Qingshan Xu et al This is an open access article distributed under the Creative Commons Attribution Licensewhich permits unrestricted use distribution and reproduction in any medium provided the original work is properly cited
Demand response (DR) has received great concern since the significant growth in electricity consumption and peak-valleydifference were witnessed recently Based on the theory of customer psychology an uncertainty model of customer behaviouris proposed By converting electric power to deposit points a novel deposit mechanism is designed in this paper which can betterdeal with the special situations in China Compared with traditional mechanism the proposed deposit mechanism is capableof improving acceptability of DR methods in China and achieving greater mobilization of customer motivation for its moreunderstandable rules and higher participation compensations Furthermore a decision strategy considering benefits of both thepower company and the subscribed customers is proposed based on the uncertaintymodel of customerbehaviour and the proposeddepositmechanismwhich aims at achievingwin-win situations and greatermobilization of customermotivationTheuncertaintiesin decision strategy are quantified by the uniform design sampling (UDS) method which is more efficient and computationallyaccurate than traditional Monte Carlo simulation With the electricity data of Nanjing City China the superiority of proposeddeposit mechanism and decision strategy are verified by numerical simulations
1 Introduction
In face of increasingly severe global power supply shortagesthe bilateral interaction of information or power betweensuppliers and buyers is emphasized by encouraging cus-tomers to optimize their consumption behaviour in a morereasonable way [1ndash4] Therefore demand response (DR) iswidely implemented to motivate customers to participate inpower system operation so as to defer the investment ofnew power plants and transmission or distribution networks[5] Accordingly depending on how DR responses theycan be divided into price-based DR and incentive-basedDR Customerrsquos consumption behaviour is changed basedon electricity prices in the first category and in responseto incentive measures within a predetermined time in thesecond category [6 7]
Nevertheless price-based DR is more applicable to acompetitive power market and is with greater uncertaintyas well as less schedulable potential Hence incentive-basedDR is more suitable for dealing with capacity shortage events
due to its striking responsiveness and stability [8] Theworks carried out nowadays include design and operation ofdemand response mechanism [9 10] modellingcontrollingof demand side resources assisting in integrating renewableenergy [11 12] and so on [13] However the reformationof electricity market and demand side management (DSM)has just started in China leading to the lack of matureelectricity market and low customer participations Thespecial situations make the existing DR methods in othercountries difficult to be effectively applied to DSM in ChinaIn order to improve customersrsquo participation motivationthe idea of deposit mechanism is proposed considering theactual nation situations of China based on the theory offundamental saving [14] The demand side resources areregarded as special commodities with appreciated functionthat can be returned to customers in the future underdeposit mechanism Compared with traditional mechanismthe proposed deposit mechanism is capable of easing tensionduring peak periods and increasing load level during valleyperiods which is beneficial to reduce peak-valley differences
HindawiMathematical Problems in EngineeringVolume 2018 Article ID 4271324 14 pageshttpsdoiorg10115520184271324
2 Mathematical Problems in Engineering
of the power system [15] The actual operating process aswell as rewardpunishment rules of deposit mechanism alsorequires deep research Hence how to design the operatingrules of deposit mechanism by emulating the deposit andwithdrawal rules of funds in banks and establish an appropri-ate decision strategy based on deposit mechanism of capacityshortage events have become an urgent and important issuefor the realization from theory to application of depositmechanism and promoting the development of demand sidemanagement (DSM) in China
It is widely acknowledged that changes of customerconsumption in the process of demand response can be ratherstochastic and unpredictable [16 17] The uncertainty of cus-tomer behaviour has a significant influence on decision strat-egy of capacity shortage events and a variety of works havebeen done already For instance the transactions betweendifferent operating modes with uncertainties submitting tosome certain distributions are imposed in [18 19] to describethe actual consumption patterns of customers which fails toprecisely reflect the situation of load reduction Moreovera cross-elasticity model between demand side participationand priceincentive measures is established in [20 21] withuniversality under different conditions This method takesthe influence of penalty into consideration but neglects therelationship between incentive level and customer behaviourThus the uncertainty model of considering customer psy-chology is introduced in this paper to reveal the relationshipbetween incentive level and load reduction as well as itsuncertainty
In terms of uncertainty quantification methods thereexist three main categories simulation method approxima-tion method and analytical method Monte Carlo simulationis widely utilized due to its simplicity and applicability asa typical simulation method [22] However it is rathertime-consuming Approximation methods such as pointestimation method [23 24] and analytical methods suchas cumulant method [25] can reduce computational timeeffectively but are both with limitations for their complicatedsolutions and theoretical model architectures As a resultresearchers turn to ameliorate sampling measurements withthe purpose of simplifying models or optimizing sample sizesuch as the uniform design sampling (UDS) method [26 27]
Based on existing studies operating rules of depositmechanism and a novel corresponding decision strategyconsidering total benefits of both the power company and thesubscribed customers are proposed in this paper In order torealize the storage and value-added function under depositmechanism a deposit point method is proposed and appliedinto mechanism design in which way the electric power canbe converted into deposit points operating in a similar wayof depositwithdrawal process of bank funds Based on theuncertainty model of customer behaviour considering cus-tomer psychology proposed in this paper a decision strategyis also proposed to solve the optimal incentive level undercapacity shortage event considering total benefits of boththe power company and the subscribed customers aimingat a win-win situation to achieve greater mobilization ofcustomer motivation The uncertainties in decision strategyare quantified by the uniformdesign sampling (UDS)method
Dead zone
0 x
Linear zone
Saturated zone
Δdk
Δdk0
xk0 xkmax
Δdkdown
Δdkup
C(xkmax Δdkmax)
B(xk1 0)
Figure 1The curve of customer behaviour considering uncertainty
to improve the sampling efficiency computational accuracyand error stability
The rest of this paper is organized as follows Section 2proposes the uncertainty model of customer behaviour con-sidering customer psychology The design of deposit mech-anism is explained in detail in Section 3 Then the decisionstrategy considering uncertainty as well as the correspondinguncertainty quantification method (uniform design samplingmethod) is proposed in Section 4 After that results ofcase studies are presented in Section 5 Finally concludingremarks are drawn in Section 6
2 Uncertainty Model of Customer Behaviour
It is acknowledged that loads are shed voluntarily by cus-tomers according to contractual contents during peak periodsor emergency situations after receiving the notification fromthe power company when classified as incentive-based DR[28] However customer behavior is rather unpredictablebut has a significant influence on the results of capacityshortage events Hence how to establish a model that canaccurately estimate customer behavior under deposit mech-anism becomes a key point In this section an uncertaintymodel considering customer psychology is introduced forestimation of actual load reduction of customer The mainidea is to associate incentive level with actual load reductionas well as its uncertainty in which way the actual customerbehavior can be simulated by interval parameters so as toimprove the applicability of the model
Incentive level not only affects the amount of load reduc-tion but also affects its uncertainty thus determining theactual situation of customer response behavior The higherthe incentive level is the stronger customersrsquo willingness ofload shedding and less uncertainty can be accounted for dueto the driving effects of interests
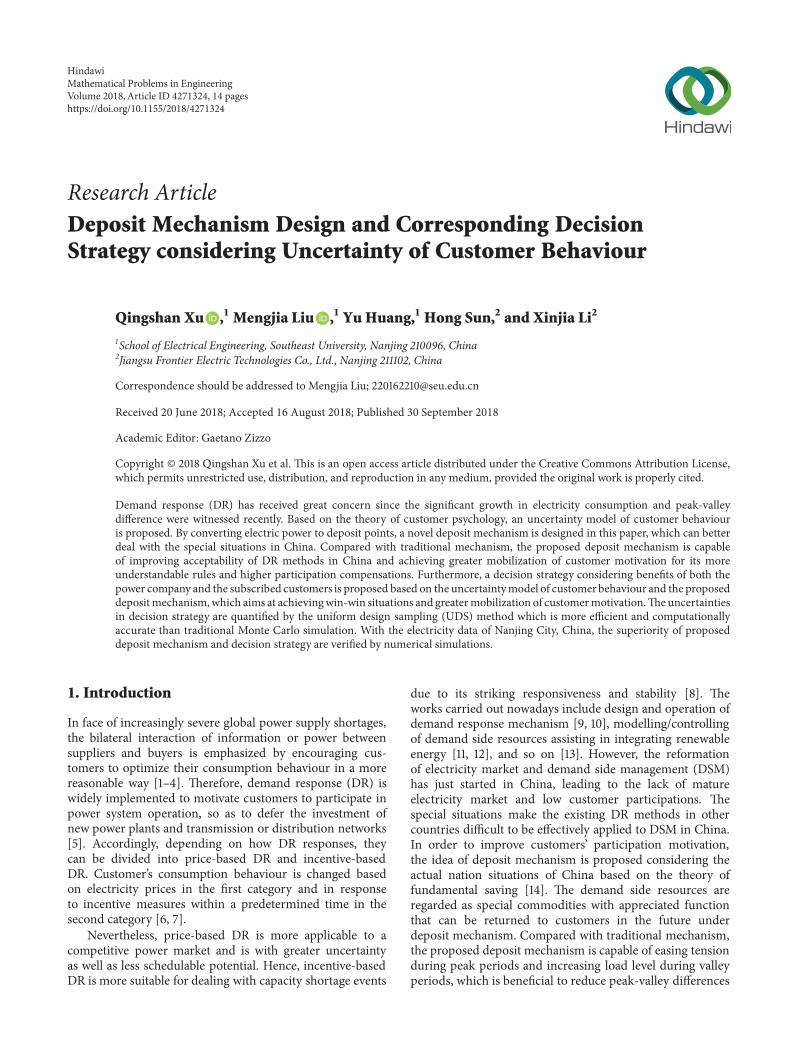
The curve of customer behavior considering uncertaintybased on customer psychology is shown in Figure 1 Thehorizontal axis represents incentive level x while the verticalaxis represents the amount of load reduction Δ119889
Assume that 1199091198960 represents initial incentive level forcustomer 119896 where the voluntarily load reduction starts 1199091198961
Mathematical Problems in Engineering 3
represents critical incentive level where customer 119896 will nolonger increase power consumption despite uncertainty 1199091198962represents saturated incentive level where load reductionachieves the maximum value Δ119889119906119901
119896 Δ119889119889119900119908119899119896 are respectively
the upper and lower limits of load reduction At incentivelevel 119909119896 the actual load reduction Δ119889119896(119909119896) is a randomvariable which is distributed normally within the interval[Δ119889119906119901119896
(119909119896) Δ119889119889119900119908119899119896 (119909119896)]The curve is divided into three zones by the range of
incentive levels dead zone linear zone and saturated zoneIn dead zone the incentive level is too low to attract anycustomer where normal consumption patterns of customersstay the same with the existing of behavior uncertainty Inlinear zone interest-driven there is a linear relationshipbetween maximumminimum load variation and incentivelevel with a gradually decreasing trend of uncertainty Insaturated zone load reduction remains unchanged and theuncertainty is rather negligible
3 Deposit Mechanism Design
Thework of demand sidemanagement (DSM) has just startedinChina recently resulting in low acceptability and participa-tion of demand response (DR) methods [14] The successfulresearch and experience in America and European marketscannot be directly applied to China as the incompleteelectricity market in China suffers much more factors whichweaken the effectiveness of traditional methods Aiming toadapt to the situations in China a novel deposit mechanismis proposed based on the theory of fundamental saving [29]The proposed method can improve customersrsquo acceptanceby emulating the operating rules of bank funds and achievegreater mobilization of customer motivation by increasingtotal benefits of subscribed customers especially industryload customers with significant schedulable potential In thisway the effectiveness of DR can be improved in ChinaConsidering the real-time characteristics of electric powerand the difficulty of building a large-scale power resourcebase a deposit point method is proposed and applied intodeposit mechanism design for realizing the storage value-added function of deposit points converted from electricpower which is analogous to the deposit and withdrawalprocess of bank funds Contractual contents especiallythe reward and punishment rules of deposit mechanismmanagement are also explained in detail to evaluate theeffectiveness of customerrsquos response for further compensationor penalties
31 e Principle of Deposit Mechanism Deposit mechanismis implemented by emulating the operation rules of fundswhere demand side resources are regarded as special com-modities with saving and value-added functions With theproposedmechanism the low acceptability and participationof demand response (DR)methods in China can be improvedformore understandable rules and higher participation com-pensations Besides smaller peak-valley differences of thepower system can be achieved as well because the proposeddeposit mechanism can not only ease tension during peak
periods but also promote electricity usage during valleyperiods
According to the theory of fundamental saving fundssaved by customers are continuously increasing in their bankaccounts because of interest until customers make with-drawals after a fixed period of time [29] Similarly the actualload reduction and incentive level are respectively regardedas principle and interest (appreciated rate) under depositmechanism Customersrsquo load shedding during peak periodsis analogous to deposit behavior while the acquirement ofappreciated load for free during valley periods is analogousto withdrawal behavior after the storage time 119873
However due to the real-time characteristics of electricpower supply and consumption a large-scale power resourcebase functioning as the bank account is necessary for timelyconsumption and output of electric power but rather difficultto implement Hence a deposit point method is put forwardto solve this problem Assume that the actual load reductionof customer can be converted into deposit points accordingto certain criteria which can be stored into the depositaccount created for each customer The initial point in eachdeposit account is 0 and points are accumulated or deductedaccording to specific reward and punishment rules untilthey are withdrawn by customers to act as the proof ofcompensation In this way there is no need to establish apower resource base and the final points can be applied toevaluate the effectiveness of customerrsquos response
The principle of deposit point method for each customeris briefly shown in Figure 2 It is noted that each customerowns a deposit account just like hisher bank account
Deposit mechanism is implemented through bilateralcontracts previously signed between the power company andthe customer Contents of bilateral contracts should clearlyindicate the operating rules of deposit mechanism includingadvanced notification time load interruption requirementsstorage time reward and punishment rules of deposit mech-anism management which can be explained as follows(1)Advanced notification time is generally set as 30min to2h according to settings of contractual contents of traditionalmechanism [30 31](2) Load interruption requirements include the responsetime interruption duration and the contractual amount ofload reduction(3) Storage time is the time period when customers areunable to obtain appreciated electric power or pay extramoney for punishment The longer storage time N is thegreater effect of value-added function can be(4) Reward and punishment rules of deposit mechanismmanagement are detailed in the following section rdquoRewardand Punishment Rulesrdquo
Due to the special operating rules of deposit mechanismit is capable of reducing peak load and promoting the level ofelectric power consumption during valley periods at the sametime thus making a greater contribution for the reductionof peak-valley difference compared with traditional mech-anism In addition industry load customers are selectedas the main focus of deposit mechanism because of theirstrong flexibility and great controllability which account fora large proportion of total electricity customers They can
4 Mathematical Problems in Engineering
Actual load reduction Converted deposit points
Deposit accountspecific reward andpunishment rules
Accumulated deposit pointsAppreciated electricpower used for free
Deducted deposit pointsAdditional electric powerpayed for punishment
Power resource baserather hard to
implement
At present
Future
Storage time N
Deposit
Withdraw
Improvement
Figure 2 The principle of deposit point method for each customer
achieve greater benefits by adjusting the production planunder deposit mechanism leading to greater mobilization ofcustomer motivation compared with traditional mechanism
32 Reward and Punishment Rules As is mentioned abovereward and punishment rules of deposit mechanism man-agement are necessary to evaluate the effectiveness of cus-tomerrsquos response Once receiving notification from the powercompany customers are selected as incentive targets and aresupposed to voluntarily cut the load according to contractualcontents Otherwise customers will be punished to payadditional penalties for their noncompliance
Assume that the actual load reduction of a certaincustomer k is Δ119889119896(119909) at incentive level x within the durationof T The steps of reward and punishment rules of depositmechanism management can be summarized as follows(1) Calculate the converted deposit points (119872119862) of cus-tomer k
119872119862119896 = 119872119868119873119862119896 minus 119872119875119864119873119896 (1)
where 119872119868119873119862 is incentive points for compliance and 119872119875119864119873 ispenalty points for noncompliance with the bilateral contractbased on deposit mechanism
119872119868119873119862119896 =
1198961 sdot 119889119888119906119905119896 Δ119889119896 (119909119896) gt 1198891198881199061199051198961198961 sdot Δ119889119896 (119909119896) 0 le Δ119889119896 (119909119896) le 1198891198881199061199051198960 Δ119889119896 (119909119896) lt 0
(2)
119872119875119864119873119896
=
0 Δ119889119896 (119909119896) gt 1198891198881199061199051198961198962 sdot (119889119888119906119905119896 minus Δ119889119896 (119909119896)) 0 le Δ119889119896 (119909119896) le 1198891198881199061199051198961198962 sdot 119889119888119906119905119896 Δ119889119896 (119909119896) lt 0
(3)
where 1198961 1198962 are incentive conversion ratio and penaltyconversion ratio respectively119889119888119906119905119896 is the contractual amountof load reduction
(2) If 119872119862119896 gt0 customer response is in compliance withcontractual requirements Hence 119872119862119896 is appreciated duringthe storage time 119873
119872119861119896 = (1 + 119909)119873 sdot 119872119862119896 (4)
where incentive level is regarded as appreciated rate underdeposit mechanism and 119872119861119896 is the appreciated points
Customer k can choose two ways as compensation forits regulated load reduction after storage time N One isappreciated electric power used for free within the duration Tduring valley periods another is economic reimbursementsIf customer k fails to submit the application requiring forappreciated electric power usage the power company defaultsto compensate the customer economically
If customer k chooses to obtain free electric power in thefuture the appreciated electricity 119876119861119896 obtained during valleyperiods can be deduced as
119876119861119896 = 1198721198611198961198961 sdot 119879 (5)
If customer k fails to submit the application the economicreimbursements can be conducted in accordance with actualelectricity reduction 119876119862119896 which is deduced as
119876119862119896 = Δ119889119896 (119909) sdot 119879 (6)
(3) If 119872119862119896 = 0 customer response is in the critical stateAssign 0 to 119876119861119896 under this circumstance Customer k doesnot need to pay additional penalties to the power companynor can it receive any compensation(4) If 119872119862119896 lt 0 customer response is defined asnoncompliance Penalties paid from customer 119896 to the powercompany are calculated based on penalty electricity 1198761015840119862119896
1198761015840119862119896 =100381610038161003816100381611987211986211989610038161003816100381610038161198961 sdot 119879 sdot 119896119888 (7)
where 119896119888 is the penalty rate for customerrsquos noncompliance
Mathematical Problems in Engineering 5
4 Decision Strategy of Capacity ShortageEvent under Deposit Mechanism
Under capacity shortage event an appropriate decision-making strategy is capable of achieving maximum economicefficiency under the premise of guaranteeing the safetyand stability of power system operation The benefit modelof subscribed customers and the power company underdeposit mechanism are established in this section Moreovera decision strategy under deposit mechanism consideringbenefits of both the power company and the customersis proposed based on the uncertainty model of customerbehaviour with the purpose of achieving optimal incentivelevel (appreciated rate) of capacity shortage events The mainidea is to maximize total benefits of the power companyon the premise of giving priority to customers with greaterbenefits as incentive targets Eventually the uniform designsampling (UDS) method considering correlations betweendifferent random input variables is introduced to quantify theuncertainties in decision strategy under deposit mechanism
41 Benefit Model of the Subscribed Customer Accordingto the reward and punishment rules of deposit mechanismmanagement total benefits of customer k (119861119864119873119896) underdepositmechanism can be deduced as the following function
119861119864119873119896 = 119864 119906119896 (120588119901119890119886119896 minus 119887119901119896)119876119862119896+ 119906119896119875119895119896 [120572119896119887V119896119876119861119896 + (1 minus 120572119896) 120588119888119900119898119876119862119896]minus 119906119896 (1 minus 119875119895119896) 1205881199011198901198861198961198761015840119862119896
(8)
where 119864∙ represents the mathematical expectation 119906119896 is astate variable whose value is neither 0 or 1 if customer kis one of the participants then 119906119896 = 1 else 119906119896 = 0 119887119901119896and 119887V119896 are unit production efficiency of customer k duringpeak periods and valley periods respectively ($kWh) 120588119901119890119886119896is peak electricity price ($kWh) 120572119896 is the probability whencustomer k submits the application for choosing appreciatedelectric power as the compensation 120588119888119900119898 is the economicreimbursement for unit electricity reduction ($kWh) 119875119895119896 isthe probability of compliance for customer k under capacityshortage event j which can be calculated through uniformdesign sampling (UDS) method introduced in this paper
42 BenefitModel of the PowerCompany Total benefits of thepower company under deposit mechanism are introduced asfollows based on the reward and punishment rules of depositmechanism management
119864119888119900119898 = 1198641198881199001198981 + 1198641198881199001198982 minus 1198641198881199001198983 minus 1198641198881199001198984 minus 1198641198881199001198985 (9)
where1198641198881199001198981 is avoidable investing and operating costs 1198641198881199001198982is penalties from customers 1198641198881199001198983 is the loss of electricity
sales 1198641198881199001198984 is incentive costs 1198641198881199001198985 is directly load sheddingcosts
1198641198881199001198981 = 119864 119899sum119896=1
119906119896 [(1198621 + 1198622)119876119862119896] (10)
1198641198881199001198982 = 119864 119899sum119896=1
119906119896 (1 minus 119875119895119896) 1205881199011198901198861198961198761015840119862119896 (11)
1198641198881199001198983 = 119864 119899sum119896=1
119906119896120588119901119890119886119896119876119862119896 (12)
1198641198881199001198984= 119864 119899sum
119896=1
119906119896 [120572119896120588V119886119897119897119890119910119876119861119896 + (1 minus 120572119896) 120588119888119900119898119876119862119896] 119875119895119896 (13)
1198641198881199001198985 = 119864119881119874119871119871 sdot (119862119878119895 minus 119899sum119896=1
119906119896119876119862119896) (14)
where 119864∙ represents the mathematical expectation 1198621is peak load pricing which represents the unit avoidableinvestment and operation costs of generators ($kWh) 1198622is unit transmission and distribution cost which representsthe unit avoidable construction operation and maintenancecosts of power networks ($kWh) 120588V119886119897119897119890119910 is valley electricityprice ($kWh)VOLL(value of lost load) is unit loss of directlyload shedding when capacity shortage is not completelyfilled by subscribed customers ($kWh) 119862119878119895 is the capacitydeficiency of event j
43 Decision Strategy In general the design and implemen-tation of demand response mechanism including depositmechanism is to maximize the total benefits of the powercompany However benefits of subscribed customers chosenas incentive targets are also important in order to achievegreater participation motivation and promote a friendlybilateral interaction of power between suppliers and buy-ers considering the responsibilities of the power companyHence a novel decision strategy of capacity shortage eventsunder deposit mechanism is proposed in this section torealize the economic efficiency of the power company onthe premise of protecting benefits of subscribed customerswhich helps to achieve a win-win situation for both the powercompany and the customers
The objective of decision model is still maximizing totalbenefits of the power company
119891 = max119864119888119900119898 (15)
Considering the uncertainty of customer behaviours re-sponse fluctuation level of capacity shortage event 119895 can bedefined as
119865119895 =10038161003816100381610038161003816sum119899119896=1119876119862119896 minus 11986211987811989510038161003816100381610038161003816119862119878119895 (16)
6 Mathematical Problems in Engineering
Therefore the reliability 119877119895 of capacity shortage event 119895which evaluates the actual response of target customers isdeduced as follows
119877119895 = 1 minus 119865119895 (17)
Constraints of the decision model include the individual-rationality constraint load reduction constraint reliabilityconstraint and incentive level (appreciated rate) constraintwhich are shown as follows
(1) Individual-Rationality Constraint The expected benefit ofcustomer k chosen as an incentive target of capacity shortageevent j under deposit mechanism should be greater thanthe maximum expected benefit from nonparticipation (119896 =1 2 119899)
[120588119901119890119886119896 + (1 minus 120572119896) 120588119888119900119898]119876119862119896 + 120572119896119887V119896119876119861119896 ge 119887119901119896119876119862119896 (18)
(2) Load Reduction Constraint The actual load reduction ofcustomer k should not be less than theminimum interruptionrequirement 119889min which is usually defined as 05MW inChina
Δ119889119896 (119909) ge 119889min 119896 = 1 2 119899 (19)
(3) Reliability Constraint In order to avoid the situations ofrdquounderresponserdquo and rdquooverresponserdquo the range of reliabilityshould be refined as
119877119895min le 119877119895 le 119877119895max (20)
where 119877119895min and 119877119895max are the lowerupper bounds ofreliability(4) Incentive Level (Appreciated Rate) Constraint
119909min le 119909 le 119909max (21)
where 119909min and 119909max are the lowerupper bounds of incentivelevel (appreciated rate)
The decision strategy procedure of capacity shortageevent 119895 can be summarized in Figure 3 where 119873119880119872119895119896 is thesummation of compliance in random sampling 119873119904119906119898 is thetotal number of sampling Hence 119875119895119896 can be calculated as
119875119895119896 = 119873119880119872119895119896119873119904119906119898 (22)
The steps of decision strategy can be explained in detail asfollows
Step 1 Acquire the deficiency of capacity shortage 119862119878119895Suppose the initial incentive level as well as its step length ofevent j
Step 2 Among all the subscribed customers choose thosewith maximum self-benefits as incentive targets at incentivelevel 119909119895 in which way the total benefits of subscribedcustomers are guaranteed to enhance the participation moti-vation of customers
Step 3 Generate the sampling of actual load reductionΔ119889119896(119909119895) for each chosen customer k chosen as incentive targetbased on the uniform design sampling (UDS) method
Step 4 Calculate the probability of compliance 119875119895119896 forcustomer k based on the sample statistics results as well asthe reward and punishment rules of deposit mechanism
Step 5 If the chosen customer k cannot satisfy constraints (1)and (2) reselect an incentive target at the current incentivelevel 119909119895 according to the principle of maximum customerbenefits among the rest of subscribed customers repeat Steps2 and 3 if all the chosen customers can satisfy constraints (1)and (2) calculate the reliability of capacity shortage event jconsidering the actual load reductions of all incentive targets
Step 6 If constraint (3) is satisfied calculate total benefits ofthe power company at the current incentive level 119909119895Step 7 If incentive level has already reached the maximumset in constraint (4) output the optimal benefits of the powercompany as well as the incentive level
44 Uniform Design Sampling (UDS) Method Uncertaintiesof customersrsquo actual load reductions lead to numerous ran-dom input variables in the decision strategy model Hencethe uniform design sampling (UDS) method is introducedin this section considering the correlation between differentrandom input variables
Uniform design sampling (UDS) method is conductedbased on the idea of space filling with sampling pointsobeying uniform distribution within the test range [32]After sampling points are selected edge transformation andcorrelation processing are put forward as well to enhance theuniversality of UDS Compared with traditional Monte Carlosimulation superiorities of UDS are presented as follows (1)the number of sampling points of UDS is smaller with thesame sample space (2) the stability of UDS is better(1) Uniform Design Sampling Assume that there are m-dimensional random variables 1198831 1198832 119883119898 obeying uni-form distribution in interval [0 1] and the total number ofsampling points for each variable is119873119888Therefore the steps ofconstructing samplemoment119883119898times119873119888 byUDS are summarizedas follows(1)Generate a positive integer vector1198671times119898 = [ℎ1 ℎ2 ℎ119898] where ℎ1 = 1 1 lt ℎ119895 lt 119899 and for any 119894 = 119895 ℎ119894 = ℎ119895 119899can be any positive integer greater than 119898(2) Generate vector Β1times119898 = [1198871 1198872 119887119898] with elementsselected from [0 1 119873119888 minus 1](3) Generate sample matrix 119864119898times119873119888 = [1198901 1198902 119890119894 119890119898]119879 by traditional Monte Carlo simulation where 119890119894 =[1198901198941 1198901198942 119890119894119873119888] Any 119890119894119895 is supposed to obey uniform distri-bution in interval [minus05 05](4) Elements in 119883119898times119873119888 = [11990911199092 119909119894 119909119898]119879 can bedefined as follows when 119909119894 = [1199091198941 1199091198942 119909119894119873119888 ]119879
119909119894119895 = 119895ℎ119894 + 119887119894 minus 05119873119888 + 119890119894119895119873119888 (23)
Mathematical Problems in Engineering 7
Select the incentive target customers accordingto maximum customer benefits
End of sampling
Yes
No
Constraint 1amp2 satisfied
Yes
Yes
No
Customerscompletely traversed
No
No
Yes
Constraint 3 satisfied
Yes
No
Calculate the total benefit of powercompany at the current incentive level
Maximum incentive level
YesOutput the maximum benefit as well as incentive level
No
Acquire capacity deficiency and assumethe initial incentive level of event
= +
gt
based on uniform design sampling (UDS) methodAcquire the sampling of actual load reduction ()
Calculate according to formula (1)(2)(3)
gt
= +1 = +1
=
Figure 3 The decision strategy procedure of capacity shortage event j
where ∙ means taking the fractional part only 119894 = 1 2 119898 119895 = 1 2 119873119888(2) Edge Transformation and Correlation Processing It isnoticed that random variables should obey uniform distribu-tion in interval [0 1] which is the basis of UDS Howeverrandom variables in the stochastic model can be subjectto arbitrary distributions Therefore edge transformation isproposed to solve this problem
If the cumulative distribution function (CDF) of randominput variable 120596 is referred to as 119865(120596) it can be confirmedthat 119906 = 119865(120596) is bound to obey uniform distributionin interval [0 1] [33] The transaction between those twodifferent distributions is defined as edge transformation
1198651 (119910) = 119865 (120596) lArrrArr 120596 = 119865minus1 (1198651 (119910)) (24)
In this way it is possible to implement transformationfrom uniform distribution to arbitrary distribution whichenhances the applicability of UDS
The initial correlation coefficient matrix sum = (120574119894119895) forinput variables can either be calculated throughmeasurementdata or be directly given for those without measurementAs is mentioned above edge transformation is capable ofimplementing transformation from uniform distribution toarbitrary distribution In order to satisfy the initial correla-tion between input variables after edge transformation anintermediate variable V1015840 obeying Gaussian distribution is
8 Mathematical Problems in Engineering
Table 1 Characteristic parameters of typical customers
Type Δ1198890119888119886119901119886119888119894119905119910 Δ119889119898119886119909119888119886119901119886119888119894119905119910 1199090 1199091 119909119898119886119909 119889119888119906119905119888119886119901119886119888119894119905119910 119896119888 1205721 8 40 005 010 020 40
12 082 5 25 005 020 030 253 3 10 005 030 040 10
Table 2 Optimal benefits of customers under deposit mechanism and traditional mechanism
Mechanism Customer type Optimal benefit$ Incentive range when 119861119864119873 ge 0Traditional mechanism
1 56205 [0136 02]2 49295 [0233 03]3 24341 [0325 04]
Deposit mechanism1 85868 [0146 02]2 73871 [0236 03]3 38640 [0327 04]
introduced for correlation processing Main steps of corre-lation processing are summarized as follows(1) Assume that the sample matrix generated by UDS is119884119898times119873119888 119884119898times119873119888 = [11991011199102 119910119894 119910119898]119879 119910119894 sim 119880(0 1) Thecorresponding intermediate variable 119907119894 can be achieved as
119907119894 = Φminus1 (119910119894) 119894 = 1 2 119898 (25)
whereΦ is CDF of standard normal distribution(2) Make a corresponding correction to the initial cor-relation coefficient matrix sum For the transformation fromGaussian distribution to uniform distribution the nondiago-nal elements of sum should be modified as [34]
120574lowast119894119895 = 2 sin (1205876 120574119894119895) (26)
The revised correlation coefficient matrix is denoted assum lowast =(120574lowast119894119895)(3) Achieve the corresponding Gaussian sample matrix119881119888119900119903119903 by Cholesky decomposition of sumlowast
119881119888119900119903119903 = 119871119881 (27)
where 119881 = [1199071 1199072 119907119894 119907119899]119879 119907119894 = [V1198941 V1198942 V119894119873119888 ] 119871is an upper triangular matrix which satisfies sumlowast = 119871119871119879(4) Achieve the corresponding uniform sample as
119910119888119900119903119903119894 = Φ (119907119888119900119903119903119894 ) (28)
Another edge transformation is also necessary to obtain thecorresponding sample of input variable 120596119894
120596119888119900119903119903119894 = 119865minus1119908119894 (119910119888119900119903119903119894 ) 119894 = 1 2 119898 (29)
where 119865119908119894 is CDF of input variable 120596119894Due to the nonlinear characteristics of edge transforma-
tion truncation errors may occur in the process [35] Usuallythe errors are too small to have effect on resultsTherefore thetruncation errors are ignored in this paper
5 Case Studies and Discussions
Taking the electricity data in Nanjing city China as anexample peak electricity price 120588119901119890119886119896 is 02 $kWh and valleyelectricity price 120588V119886119897119897119890119910 is 008 $kWh according to marketsurvey Considering the significant economic benefits ofdemand response peak load pricingC1 and unit transmissionand distribution cost 1198622 are assumed as 07 $kWh and0015$kWh respectively VOLL is set as 1000$MWh and therelationship between incentive conversion ratio and penaltyconversion ratio 1198961 is proposed as 1198962 according to literature[36]
Under deposit mechanism unit economic reimburse-ment 120588119888119900119898 cannot be set too high or too low On the one hand120588119888119900119898 should be smaller than unit economic reimbursementunder traditional mechanism in order to encourage powerconsumption during valley periods On the other hand 120588119888119900119898is ought to be higher than peak electricity price 120588119901119890119886119896 so asto guarantee effectiveness of incentive measures As a result120588119888119900119898 is set as 028$kWh in this paper [10]
51 Customer Benefits under Different Mechanisms Threetypical customer types under deposit mechanism based onthe range of incentive levels are proposed in this sectionshown in Table 1 Assume that unit production efficienciesduring peak and valley periods are 03385 and 02154 $kWhresponse time T is 1 (hour) and storage time119873 = 3 (months)for all three types of customers Optimal benefits of eachtypical customer under deposit mechanism and traditionalmechanism can be shown in Table 2 In order to reveal theinfluence of customer types to customer benefits the capacityis set as 10MW for all three types in this case
Under traditionalmechanism customers can only receiveeconomic compensations based on actual electricity reduc-tion for compliance while the penalty rate for noncomplianceis still 119896119888 Unit economic compensation under traditionalmechanism is set as 03385 $kWh [10]
From customerrsquos point of view optimal benefits underdeposit mechanism are superior to those under traditionalmechanism owing to the fact that the scope of customer
Mathematical Problems in Engineering 9
Table 3 Typical categories of customersrsquo capacity allocation
Typical categories Capacity proportion of different customer typesType 1 Type 2 Type 3
Category 1 50 25 25Category 2 25 50 25Category 3 25 25 50
5500
6000
6500
7000
7500
8000
Tota
l ben
efits
($)
02 025 03 035 04015Incentive level
8000
8500
9000
9500
10000
10500
Tota
l ben
efits
($)
025 03 035 0402Incentive level
Deposit mechanismTraditional mechanism
Deposit mechanismTraditional mechanism
Figure 4 Comparison of the decision strategy results between deposit mechanism and traditional mechanism with customer allocation ofcategory 1 under different scenarios Left scenario 1 Right scenario 2
benefits has been expanded under deposit mechanism withthe appreciated function In addition customer in type 1 ownsthe maximum benefits and minimum profit range amongall types due to its high sensitivity to changes in incentivelevels and high flexibility in electricity usage indicating thatthe participation willing of customers in type 1 may be thestrongest under deposit mechanism
52 Decision Strategy Benefits under Different MechanismsAssume that the total capacity of subscribed customersis 900MW In order to facilitate the analysis of decisionresults under deposit mechanism with different customercompositions three typical categories of customersrsquo capacityallocation are proposed in Table 3 The total number ofcustomers is 119899 = 30 with 10 type 1 customers 10 type 2customers and 10 type 3 customers The capacity of eachcustomer under a specific type is randomly generated butremains the same characteristics with that given in Table 1Because of the fact that subscribed customers are mutuallyindependent the initial correlation coefficient matrix is a nullmatrix Two scenarios are also proposed to simulate differentcapacity shortage events that occurred during peak periodsThe capacity gaps are 20MW and 35MW under scenario 1and scenario 2 describing the actual electricity consumptionsituation during springautumn and summerwinter respec-tively
The comparison of decision strategy results (total benefitsof the power company) between deposit mechanism and
traditional mechanism with different categories of customerallocation under different scenarios is illustrated in Figures4ndash6 while the reliability range is set as 80-90 in all casesThe lower limits of incentive level shown in Figures 4 5and 6 are the minimum incentive level satisfying reliabilityrequirements in each specific scenario The upper limits ofincentive level shown in Figures 4 5 and 6 are both 04 whereall customers have reached saturated zone in all cases
It is revealed from Figures 4ndash6 that the decision strategyresults under deposit mechanism are superior to that undertraditionalmechanism in themost range of effective incentivelevel of all cases It is because the optional compensation wayof free appreciated electric power under deposit mechanismsignificantly reduces the overall incentive costs of the powercompany in the most range of effective inventive levelcompared with traditional mechanism illustrating the greatsuperiority of proposed deposit mechanism
However there is a tendency that the total benefitsunder deposit mechanism are inferior to those under tra-ditional mechanism at the very beginning and ending ofeffective incentive range Reasons for this phenomenon canbe explained as follows When incentive level is relatively lowcustomers are highly likely to be defined as noncomplianceunder deposit mechanism Hence the lack of motivationcauses decrease of total load reduction leading to less benefitsunder deposit mechanism When incentive level is too highthe exponentially growing incentive costs caused by appreci-ated function under deposit mechanism are bigger than that
10 Mathematical Problems in Engineering
8000
8500
9000
9500
10000
10500
Tota
l ben
efits
($)
03 035 04025Incentive level
025 03 035 0402Incentive level
5000
5500
6000
6500
7000
7500
8000To
tal b
enefi
ts ($
)
Deposit mechanismTraditional mechanism
Deposit mechanismTraditional mechanism
Figure 5 Comparison of the decision strategy results between deposit mechanism and traditional mechanism with customer allocation ofcategory 2 under different scenarios Left scenario 1 Right scenario 2
5000
5500
6000
6500
7000
7500
8000
Tota
l ben
efits
($)
03 035 04025Incentive level
8000
8500
9000
9500
10000
10500To
tal b
enefi
ts ($
)
03 035 04025Incentive level
Deposit mechanismTraditional mechanism
Deposit mechanismTraditional mechanism
Figure 6 Comparison of the decision strategy results between deposit mechanism and traditional mechanism with customer allocation ofcategory 3 under different scenarios Left scenario 1 Right scenario 2
growing linearly under traditional mechanism leading to thesteeper slope of deposit mechanism when incentive targetshave been fixed
In general deposit mechanism still has outstandingadvantages over traditional mechanism in the most range ofeffective incentive level ranges and the tendency inferior totraditional mechanism only appears in extreme cases withrather small probabilities
It is also noted that the optimal benefits as well as theincentive range superior to traditional mechanism of depositmechanism are successively decreasing with customer allo-cation of category 1 category 2 and category 3 mainlybecause of the different proportion of different customertypes in the three categories According to analysis abovetype 1 customers are more sensitive to incentive level changes
and with greater schedulable potential than type 2 andtype 3 customers with the same capacity As a result thepower company is capable of acquiring more demand sideresources with less incentive costs from type 1 customersleading to greater benefits under the same scenario Themore proportion type 1 customers accounted for the greaterbenefits are
The overall trends of total benefits curves with differentcategories of customer allocation and different scenarios arealmost the same As incentive level increases customerswith greater benefits are chosen as incentive targets and theactual load reduction improves as well leading to the gradualincrease of total benefits at the very beginning With thecontinuous increases of incentive level part of customershave reached the saturated zone and other customers will
Mathematical Problems in Engineering 11
NoConstraint 1)amp2) satisfied
Reliability satisfied
Maximum incentive level
Yes
Output incentive targets and incentive level correspondingto optimal total benefits based on model B and model C
No
No
Yes
Yes
Acquire the decision strategy based on model B and model C
Acquire the actual load reduction of incentive targets basedon model B and model C using Monte Carlo simulation
Evaluate the practical application of decision strategy above
Calculate optimal benefits of power company accordingto the estimated incentive targets and incentive level
Acquire capacity deficiency and assumethe initial incentive level of event
= +
based on model B and model C and select the incentive targetcustomers according to the maximum load reduction
Acquire the estimated load reduction () of each customer
Figure 7 Analysis procedure of model B and model C
be informed to reduce electric power in order to satisfy thereliability Therefore the growth in incentive costs causes thedecrease of total benefits and the dynamic choices of incentivetargets result in the fluctuation As incentive level continues toincrease and reaches a certain value the selection of incentivetargets has been fixed After that the increase of incentivecosts causes the gradual decrease of total benefits
53 Efficacy of Proposed Uncertainty Customer BehaviourModel The influence of different modelling of customersfor decision strategy under deposit mechanism is proposedin this section Among them model A is the uncertaintymodel previously noted in Section 2 and model B andmodel C are the traditional deterministic psychology modelswith different inflection points between dead zone andlinear zone representing the optimistic estimation and pes-simistic estimation of actual load reduction respectively The
traditional deterministic psychology model is introduced inthe Appendix
The inflection points of model B and model C are set as1199090 and 1199091 of model A respectively while other parametersremain the same Suppose the reliability is 80-90 underscenario 1with customer allocation of category 2The analysisprocedure of models B and C is shown in Figure 7
Key parameters of decision strategy results based onmodels A B and C are proposed in Table 4 It is illustratedthat optimal benefits based on model A are superior tothose based on model B and model C If the actual loadreduction of customers is optimistic estimated (model B)probability of noncompliance is higher and the penaltiesfrom customers will increase However the costs for directlyload shedding will also increase leading to the declineof optimal benefits If the actual load reduction of cus-tomers is pessimistic estimated (model C) the increase of
12 Mathematical Problems in Engineering
Table 4 Key parameters of decision strategy based on models A B C
Model Optimalincentive level
Optimalbenefits$
Incentivecosts$
Compensationfrom customers$
Directly loadshedding costs$
A 023 741505 421601 1348 41948B 016 588287 281940 8922 241922C 026 680651 465730 0 0
Credibility ()
0
02
04
06
08
1
Opt
imal
ben
efits
104$
Scenario 1Scenario 2
0-10
20-30
30-40
40-50
50-60
60-70
70-80
80-90
10-20
90-100
Figure 8 The trend of optimal benefits changing with reliabilityrange with customer allocation of category 2 under different scenar-ios
incentive costs will cause the decline of optimal benefits aswell
54 Influence of Reliability Setting on Decision Strategy Inorder to further analyse the influence of reliability on decisionstrategy results different reliability ranges are chosen underscenario 1 and scenario 2 with the customer allocation ofcategory 2 The trend of optimal benefits changing withreliability range is shown in Figure 8
From the perspective of the power company optimalreliability ranges are 70-80 under scenario 1 and 90-100 under scenario 2 Reasons for this phenomenon canbe explained as follows Under scenario 1 capacity gap iscomparatively small The influence of uncertainty in cus-tomer behaviours can be decreased along with the increaseof incentive level in order to satisfy reliability requirementsHowever as the reliability increases the rising of incentivecosts can also lead to the decline of optimal benefits Underscenario 2 the electricity shortage is rather severe that thepower company needs to continuously increase incentivelevel to encourage the participation of more customers sothat capacity gap can be filled owing to the fact that costsof direct load shedding caused by insufficient response aremuch higher than incentive costs Customers with lowerschedulable potential is selected as well due to the expansion
0
05
1
15
2
25
(
)
1000 1500 2000 2500 3000 3500 4000500Total number of sampling points
Monte CarloUDS
Figure 9 Error comparison of mean between Monte Carlo simula-tion and UDS
of incentive targets which can explain the gradual decreaseof increasing rate in optimal benefits
55 Comparison between UDS and Traditional Monte CarloSimulation The selection of input random sampling deter-mines calculation accuracy directly Suppose that results cal-culated by traditional Monte Carlo simulation with samplingscale of 40000 is the accurate value of optimal benefits Theaccurate mean and variance can be described as 120583119898119890119886119899 and1205902var while the calculated mean and variance can be describedas 120583119888119886119897 and 1205902119888119886119897 Therefore average relative errors of optimalbenefits are deduced as
120576120583 = 10038161003816100381610038161003816100381610038161003816120583119898119890119886119899 minus 120583119888119886119897120583119898119890119886119899
10038161003816100381610038161003816100381610038161003816 (30)
120576120590 =1003816100381610038161003816100381610038161003816100381610038161205902var minus 12059021198881198861198971205902var
100381610038161003816100381610038161003816100381610038161003816 (31)
where 120576120583 is average relative error of mean and 120576120590 is averagerelative error of variance
The relative errors of optimal benefits solved by tradi-tional Monte Carlo simulation and UDS are shown in Figures9 and 10 It is indicated that UDS is superior to Monte Carlosimulation in terms of precision as well as error stability withthe same sample size The fewer sampling points are thegreater advantages can be illustrated
Mathematical Problems in Engineering 13
Monte CarloUDS
1000 1500 2000 2500 3000 3500 4000500Total number of sampling points
0
05
1
15
(
)
Figure 10 Error comparison of variance between Monte Carlosimulation and UDS
6 Conclusions
In this paper the design of deposit mechanism and anovel corresponding decision strategy are proposed con-sidering the uncertainty of customer behaviour Based onthe theory of customer psychology an uncertainty modelof customer behaviour is introduced Emulating the depositand withdrawal process of bank funds a new deposit pointmethod is proposed and applied into the deposit mechanismdesign to realize the storage and value-added function ofdeposit points converted from electric power Furthermorea decision strategy based on uncertainty model of customerbehaviour is proposed considering both the benefits ofthe power company and the subscribed customers underdeposit mechanism Uncertainties in decision strategy arequantified by uniform design sampling (UDS) method Ingeneral the advantages of proposed deposit mechanism anddecision strategy as well as its uncertainty quantificationmethod are the following (1) Greater benefits of both thepower company and the subscribed customers are to beobtained (2) A win-win situation and greater mobilizationof customer motivation can be achieved (3) The influencecaused by estimation of customer behaviour can be reduced(4) Sampling efficiency computational accuracy and errorstability can be improvedWith the electricity data of Nanjingcity China the numerical simulation results demonstratethat the proposed deposit mechanism and decision strategycan improve the effectiveness of DR in China Comparedwith traditional methods greater benefits of both the powercompany and the customers can be achieved to improve theparticipation motivation of customers
Appendix
The traditional deterministic psychology model of customerresponse mentioned in Section 5 is shown in Figure 11
Dead zone
0 xInflection point
Linear zone
Saturated zone
Δdk
Figure 11 Traditional deterministic psychology model of customerresponse
Data Availability
All the data needed in decision strategy solution has beenpresented in the main body of this paper
Conflicts of Interest
The authors declare no conflicts of interest
Acknowledgments
This research was funded by National Key TechnologyResearch and Development Program of China[2016YFB0901100]References
[1] Q Xu Y Ding Q Yan A Zheng and P Du ldquoDay-Ahead LoadPeak SheddingShifting SchemeBased onPotential LoadValuesUtilization Theory and Practice of Policy-Driven DemandResponse in Chinardquo IEEE Access vol 5 pp 22892ndash22901 2017
[2] R Deng Z Yang J Chen and M-Y Chow ldquoLoad schedulingwith price uncertainty and temporally-coupled constraints insmart gridsrdquo IEEE Transactions on Power Systems vol 29 no 6pp 2823ndash2834 2014
[3] Y Wang Q Xu Z Ma and H Zhu ldquoAn improved controland energy management strategy of three-level NPC converterbased DC distribution networkrdquo Energies vol 10 no 10 2017
[4] Y Wang Q Xu and M Liu ldquoA novel system operation modewith flexible bus type selection method in DC power systemsrdquoInternational Journal of Electrical Power amp Energy Systems vol103 pp 1ndash11 2018
[5] P Siano ldquoDemand response and smart gridsmdasha surveyrdquoRenew-able amp Sustainable Energy Reviews vol 30 pp 461ndash478 2014
[6] H A Aalami M P Moghaddam and G R Yousefi ldquoDemandresponse modeling considering interruptiblecurtailable loadsand capacity market programsrdquo Applied Energy vol 87 no 1pp 243ndash250 2010
[7] J Saez-Gallego J M Morales M Zugno and H Madsen ldquoAData-Driven Bidding Model for a Cluster of Price-ResponsiveConsumers of Electricityrdquo IEEE Transactions on Power Systemsvol 31 no 6 pp 5001ndash5011 2016
14 Mathematical Problems in Engineering
[8] F Aminifar M Fotuhi-Firuzabad andM Shahidehpour ldquoUnitcommitment with probabilistic spinning reserve and interrupt-ible load considerationsrdquo IEEE Transactions on Power Systemsvol 24 no 1 pp 388ndash397 2009
[9] G K Toh and H B Gooi ldquoProcurement of interruptible loadservices in electricity supply systemsrdquo Applied Energy vol 98pp 533ndash539 2012
[10] M M Sahebi E A Duki M Kia A Soroudi and MEhsan ldquoSimultanous emergency demand response program-ming and unit commitment programming in comparison withinterruptible load contractsrdquo IET Generation Transmission ampDistribution vol 6 no 7 pp 605ndash611 2012
[11] R Argiento R Faranda A Pievatolo and E Tironi ldquoDis-tributed interruptible load shedding and micro-generator dis-patching to benefit system operationsrdquo IEEE Transactions onPower Systems vol 27 no 2 pp 840ndash848 2012
[12] H-G Park J-K Lyu Y Kang and J-K Park ldquoUnit commit-ment considering interruptible load for power systemoperationwith wind powerrdquo Energies vol 7 no 7 pp 4281ndash4299 2014
[13] R Bhana and T J Overbye ldquoThe Commitment of Inter-ruptible Load to Ensure Adequate System Primary FrequencyResponserdquo IEEE Transactions on Power Systems vol 31 no 3pp 2055ndash2063 2016
[14] J Dong G Xue and R Li ldquoDemand response in ChinaRegulations pilot projects and recommendations - A reviewrdquoRenewable amp Sustainable Energy Reviews vol 59 pp 13ndash272016
[15] J Sousa O R Saavedra and S L Lima ldquoDecision-Making inEmergency Operation for Power Transformers with Regard toRisks and Interruptible Load Contractsrdquo IEEE Transactions onPower Delivery vol 99 2017
[16] M Shafie-Khah and J P S Catalao ldquoA stochastic multi-layeragent-based model to study electricity market participantsbehaviorrdquo IEEE Transactions on Power Systems vol 30 no 2pp 867ndash881 2015
[17] H-G Kwag and J-O Kim ldquoReliability modeling of demandresponse considering uncertainty of customer behaviorrdquoApplied Energy vol 122 pp 24ndash33 2014
[18] N Nikmehr S Najafi-Ravadanegh and A Khodaei ldquoProba-bilistic optimal scheduling of networked microgrids consider-ing time-based demand response programs under uncertaintyrdquoApplied Energy vol 198 pp 267ndash279 2017
[19] Q Zhang M F Morari I E Grossmann A Sundaramoorthyand J M Pinto ldquoAn adjustable robust optimization approachto scheduling of continuous industrial processes providinginterruptible loadrdquo Computers amp Chemical Engineering vol 86pp 106ndash119 2016
[20] Q Wang J Wang and Y Guan ldquoStochastic unit commitmentwith uncertain demand responserdquo IEEE Transactions on PowerSystems vol 28 no 1 pp 562-563 2013
[21] M Aien M Fotuhi-Firuzabad and M Rashidinejad ldquoProb-abilistic optimal power flow in correlated hybrid wind-photovoltaic power systemsrdquo IEEE Transactions on Smart Gridvol 5 no 1 pp 130ndash138 2014
[22] Z Wei J Xu X Dai et al ldquoResearch on coarse-grained parallelalgorithm of the Monte-Carlo simulation for probabilistic loadflow calculationrdquo Power and Energy 2015
[23] C Delgado and J A Domınguez-Navarro ldquoPoint estimatemethod for probabilistic load flow of an unbalanced powerdistribution system with correlated wind and solar sourcesrdquoInternational Journal of Electrical Power amp Energy Systems vol61 pp 267ndash278 2014
[24] WWu K Wang B Han et al ldquoA versatile probability model ofphotovoltaic generation using pair copula constructionrdquo Powerand Energy Society General Meeting 2016
[25] A Tamtum A Schellenberg and W D Rosehart ldquoEnhance-ments to the cumulant method for probabilistic optimal powerflow studiesrdquo IEEE Transactions on Power Systems vol 24 no4 pp 1739ndash1746 2009
[26] M D Shields and J Zhang ldquoThe generalization of Latinhypercube samplingrdquo Reliability Engineering amp System Safetyvol 148 pp 96ndash108 2016
[27] Q Xu Y Yang Y Liu and X Wang ldquoAn improved latinhypercube sampling method to enhance numerical stabilityconsidering the correlation of input variablesrdquo IEEE Access vol5 pp 15197ndash15205 2017
[28] S Majumdar D Chattopadhyay and J Parikh ldquoInterruptibleload management using optimal power flow analysisrdquo IEEETransactions on Power Systems vol 11 no 2 pp 715ndash720 1996
[29] M Feldstein and C Horioka ldquoDomestic saving and interna-tional capital flowsrdquo Economic Journal vol 90 no 358 pp 314ndash329 1980
[30] J H Doudna ldquoOverview of California ISO summer 2000demand response programsrdquo in Proceedings of the 2001 IEEEPower Engineering Society Winter Meeting vol 1 pp 228ndash2332001
[31] N Abed S Greene and J Gentile T ldquoNew York IndependentSystemOperator (NYISO) Benefits of Adding Capacitors to theElectric System February 27rdquo Keats-Shelley Journal pp 151ndash1532008
[32] K-T FangD K Lin PWinker andY Zhang ldquoUniformdesigntheory and applicationrdquo Technometrics vol 42 no 3 pp 237ndash248 2000
[33] P-L Liu and A der Kiureghian ldquoMultivariate distributionmodels with prescribed marginals and covariancesrdquo Probabilis-tic Engineering Mechanics vol 1 no 2 pp 105ndash112 1986
[34] J Usaola ldquoProbabilistic load flow with correlated wind powerinjectionsrdquo Electric Power Systems Research vol 80 no 5 pp528ndash536 2010
[35] H Li Z Lu and X Yuan ldquoNataf transformation based pointestimate methodrdquo Chinese Science Bulletin vol 53 no 17 pp2586ndash2592 2008
[36] A Moshari A Ebrahimi and M Fotuhi-Firuzabad ldquoShort-Term Impacts ofDRPrograms onReliability ofWind IntegratedPower Systems Considering Demand-Side Uncertaintiesrdquo IEEETransactions on Power Systems vol 31 no 3 pp 2481ndash24902016
Hindawiwwwhindawicom Volume 2018
MathematicsJournal of
Hindawiwwwhindawicom Volume 2018
Mathematical Problems in Engineering
Applied MathematicsJournal of
Hindawiwwwhindawicom Volume 2018
Probability and StatisticsHindawiwwwhindawicom Volume 2018
Journal of
Hindawiwwwhindawicom Volume 2018
Mathematical PhysicsAdvances in
Complex AnalysisJournal of
Hindawiwwwhindawicom Volume 2018
OptimizationJournal of
Hindawiwwwhindawicom Volume 2018
Hindawiwwwhindawicom Volume 2018
Engineering Mathematics
International Journal of
Hindawiwwwhindawicom Volume 2018
Operations ResearchAdvances in
Journal of
Hindawiwwwhindawicom Volume 2018
Function SpacesAbstract and Applied AnalysisHindawiwwwhindawicom Volume 2018
International Journal of Mathematics and Mathematical Sciences
Hindawiwwwhindawicom Volume 2018
Hindawi Publishing Corporation httpwwwhindawicom Volume 2013Hindawiwwwhindawicom
The Scientific World Journal
Volume 2018
Hindawiwwwhindawicom Volume 2018Volume 2018
Numerical AnalysisNumerical AnalysisNumerical AnalysisNumerical AnalysisNumerical AnalysisNumerical AnalysisNumerical AnalysisNumerical AnalysisNumerical AnalysisNumerical AnalysisNumerical AnalysisNumerical AnalysisAdvances inAdvances in Discrete Dynamics in
Nature and SocietyHindawiwwwhindawicom Volume 2018
Hindawiwwwhindawicom
Dierential EquationsInternational Journal of
Volume 2018
Hindawiwwwhindawicom Volume 2018
Decision SciencesAdvances in
Hindawiwwwhindawicom Volume 2018
AnalysisInternational Journal of
Hindawiwwwhindawicom Volume 2018
Stochastic AnalysisInternational Journal of
Submit your manuscripts atwwwhindawicom

2 Mathematical Problems in Engineering
of the power system [15] The actual operating process aswell as rewardpunishment rules of deposit mechanism alsorequires deep research Hence how to design the operatingrules of deposit mechanism by emulating the deposit andwithdrawal rules of funds in banks and establish an appropri-ate decision strategy based on deposit mechanism of capacityshortage events have become an urgent and important issuefor the realization from theory to application of depositmechanism and promoting the development of demand sidemanagement (DSM) in China
It is widely acknowledged that changes of customerconsumption in the process of demand response can be ratherstochastic and unpredictable [16 17] The uncertainty of cus-tomer behaviour has a significant influence on decision strat-egy of capacity shortage events and a variety of works havebeen done already For instance the transactions betweendifferent operating modes with uncertainties submitting tosome certain distributions are imposed in [18 19] to describethe actual consumption patterns of customers which fails toprecisely reflect the situation of load reduction Moreovera cross-elasticity model between demand side participationand priceincentive measures is established in [20 21] withuniversality under different conditions This method takesthe influence of penalty into consideration but neglects therelationship between incentive level and customer behaviourThus the uncertainty model of considering customer psy-chology is introduced in this paper to reveal the relationshipbetween incentive level and load reduction as well as itsuncertainty
In terms of uncertainty quantification methods thereexist three main categories simulation method approxima-tion method and analytical method Monte Carlo simulationis widely utilized due to its simplicity and applicability asa typical simulation method [22] However it is rathertime-consuming Approximation methods such as pointestimation method [23 24] and analytical methods suchas cumulant method [25] can reduce computational timeeffectively but are both with limitations for their complicatedsolutions and theoretical model architectures As a resultresearchers turn to ameliorate sampling measurements withthe purpose of simplifying models or optimizing sample sizesuch as the uniform design sampling (UDS) method [26 27]
Based on existing studies operating rules of depositmechanism and a novel corresponding decision strategyconsidering total benefits of both the power company and thesubscribed customers are proposed in this paper In order torealize the storage and value-added function under depositmechanism a deposit point method is proposed and appliedinto mechanism design in which way the electric power canbe converted into deposit points operating in a similar wayof depositwithdrawal process of bank funds Based on theuncertainty model of customer behaviour considering cus-tomer psychology proposed in this paper a decision strategyis also proposed to solve the optimal incentive level undercapacity shortage event considering total benefits of boththe power company and the subscribed customers aimingat a win-win situation to achieve greater mobilization ofcustomer motivation The uncertainties in decision strategyare quantified by the uniformdesign sampling (UDS)method
Dead zone
0 x
Linear zone
Saturated zone
Δdk
Δdk0
xk0 xkmax
Δdkdown
Δdkup
C(xkmax Δdkmax)
B(xk1 0)
Figure 1The curve of customer behaviour considering uncertainty
to improve the sampling efficiency computational accuracyand error stability
The rest of this paper is organized as follows Section 2proposes the uncertainty model of customer behaviour con-sidering customer psychology The design of deposit mech-anism is explained in detail in Section 3 Then the decisionstrategy considering uncertainty as well as the correspondinguncertainty quantification method (uniform design samplingmethod) is proposed in Section 4 After that results ofcase studies are presented in Section 5 Finally concludingremarks are drawn in Section 6
2 Uncertainty Model of Customer Behaviour
It is acknowledged that loads are shed voluntarily by cus-tomers according to contractual contents during peak periodsor emergency situations after receiving the notification fromthe power company when classified as incentive-based DR[28] However customer behavior is rather unpredictablebut has a significant influence on the results of capacityshortage events Hence how to establish a model that canaccurately estimate customer behavior under deposit mech-anism becomes a key point In this section an uncertaintymodel considering customer psychology is introduced forestimation of actual load reduction of customer The mainidea is to associate incentive level with actual load reductionas well as its uncertainty in which way the actual customerbehavior can be simulated by interval parameters so as toimprove the applicability of the model
Incentive level not only affects the amount of load reduc-tion but also affects its uncertainty thus determining theactual situation of customer response behavior The higherthe incentive level is the stronger customersrsquo willingness ofload shedding and less uncertainty can be accounted for dueto the driving effects of interests
The curve of customer behavior considering uncertaintybased on customer psychology is shown in Figure 1 Thehorizontal axis represents incentive level x while the verticalaxis represents the amount of load reduction Δ119889
Assume that 1199091198960 represents initial incentive level forcustomer 119896 where the voluntarily load reduction starts 1199091198961
Mathematical Problems in Engineering 3
represents critical incentive level where customer 119896 will nolonger increase power consumption despite uncertainty 1199091198962represents saturated incentive level where load reductionachieves the maximum value Δ119889119906119901
119896 Δ119889119889119900119908119899119896 are respectively
the upper and lower limits of load reduction At incentivelevel 119909119896 the actual load reduction Δ119889119896(119909119896) is a randomvariable which is distributed normally within the interval[Δ119889119906119901119896
(119909119896) Δ119889119889119900119908119899119896 (119909119896)]The curve is divided into three zones by the range of
incentive levels dead zone linear zone and saturated zoneIn dead zone the incentive level is too low to attract anycustomer where normal consumption patterns of customersstay the same with the existing of behavior uncertainty Inlinear zone interest-driven there is a linear relationshipbetween maximumminimum load variation and incentivelevel with a gradually decreasing trend of uncertainty Insaturated zone load reduction remains unchanged and theuncertainty is rather negligible
3 Deposit Mechanism Design
Thework of demand sidemanagement (DSM) has just startedinChina recently resulting in low acceptability and participa-tion of demand response (DR) methods [14] The successfulresearch and experience in America and European marketscannot be directly applied to China as the incompleteelectricity market in China suffers much more factors whichweaken the effectiveness of traditional methods Aiming toadapt to the situations in China a novel deposit mechanismis proposed based on the theory of fundamental saving [29]The proposed method can improve customersrsquo acceptanceby emulating the operating rules of bank funds and achievegreater mobilization of customer motivation by increasingtotal benefits of subscribed customers especially industryload customers with significant schedulable potential In thisway the effectiveness of DR can be improved in ChinaConsidering the real-time characteristics of electric powerand the difficulty of building a large-scale power resourcebase a deposit point method is proposed and applied intodeposit mechanism design for realizing the storage value-added function of deposit points converted from electricpower which is analogous to the deposit and withdrawalprocess of bank funds Contractual contents especiallythe reward and punishment rules of deposit mechanismmanagement are also explained in detail to evaluate theeffectiveness of customerrsquos response for further compensationor penalties
31 e Principle of Deposit Mechanism Deposit mechanismis implemented by emulating the operation rules of fundswhere demand side resources are regarded as special com-modities with saving and value-added functions With theproposedmechanism the low acceptability and participationof demand response (DR)methods in China can be improvedformore understandable rules and higher participation com-pensations Besides smaller peak-valley differences of thepower system can be achieved as well because the proposeddeposit mechanism can not only ease tension during peak
periods but also promote electricity usage during valleyperiods
According to the theory of fundamental saving fundssaved by customers are continuously increasing in their bankaccounts because of interest until customers make with-drawals after a fixed period of time [29] Similarly the actualload reduction and incentive level are respectively regardedas principle and interest (appreciated rate) under depositmechanism Customersrsquo load shedding during peak periodsis analogous to deposit behavior while the acquirement ofappreciated load for free during valley periods is analogousto withdrawal behavior after the storage time 119873
However due to the real-time characteristics of electricpower supply and consumption a large-scale power resourcebase functioning as the bank account is necessary for timelyconsumption and output of electric power but rather difficultto implement Hence a deposit point method is put forwardto solve this problem Assume that the actual load reductionof customer can be converted into deposit points accordingto certain criteria which can be stored into the depositaccount created for each customer The initial point in eachdeposit account is 0 and points are accumulated or deductedaccording to specific reward and punishment rules untilthey are withdrawn by customers to act as the proof ofcompensation In this way there is no need to establish apower resource base and the final points can be applied toevaluate the effectiveness of customerrsquos response
The principle of deposit point method for each customeris briefly shown in Figure 2 It is noted that each customerowns a deposit account just like hisher bank account
Deposit mechanism is implemented through bilateralcontracts previously signed between the power company andthe customer Contents of bilateral contracts should clearlyindicate the operating rules of deposit mechanism includingadvanced notification time load interruption requirementsstorage time reward and punishment rules of deposit mech-anism management which can be explained as follows(1)Advanced notification time is generally set as 30min to2h according to settings of contractual contents of traditionalmechanism [30 31](2) Load interruption requirements include the responsetime interruption duration and the contractual amount ofload reduction(3) Storage time is the time period when customers areunable to obtain appreciated electric power or pay extramoney for punishment The longer storage time N is thegreater effect of value-added function can be(4) Reward and punishment rules of deposit mechanismmanagement are detailed in the following section rdquoRewardand Punishment Rulesrdquo
Due to the special operating rules of deposit mechanismit is capable of reducing peak load and promoting the level ofelectric power consumption during valley periods at the sametime thus making a greater contribution for the reductionof peak-valley difference compared with traditional mech-anism In addition industry load customers are selectedas the main focus of deposit mechanism because of theirstrong flexibility and great controllability which account fora large proportion of total electricity customers They can
4 Mathematical Problems in Engineering
Actual load reduction Converted deposit points
Deposit accountspecific reward andpunishment rules
Accumulated deposit pointsAppreciated electricpower used for free
Deducted deposit pointsAdditional electric powerpayed for punishment
Power resource baserather hard to
implement
At present
Future
Storage time N
Deposit
Withdraw
Improvement
Figure 2 The principle of deposit point method for each customer
achieve greater benefits by adjusting the production planunder deposit mechanism leading to greater mobilization ofcustomer motivation compared with traditional mechanism
32 Reward and Punishment Rules As is mentioned abovereward and punishment rules of deposit mechanism man-agement are necessary to evaluate the effectiveness of cus-tomerrsquos response Once receiving notification from the powercompany customers are selected as incentive targets and aresupposed to voluntarily cut the load according to contractualcontents Otherwise customers will be punished to payadditional penalties for their noncompliance
Assume that the actual load reduction of a certaincustomer k is Δ119889119896(119909) at incentive level x within the durationof T The steps of reward and punishment rules of depositmechanism management can be summarized as follows(1) Calculate the converted deposit points (119872119862) of cus-tomer k
119872119862119896 = 119872119868119873119862119896 minus 119872119875119864119873119896 (1)
where 119872119868119873119862 is incentive points for compliance and 119872119875119864119873 ispenalty points for noncompliance with the bilateral contractbased on deposit mechanism
119872119868119873119862119896 =
1198961 sdot 119889119888119906119905119896 Δ119889119896 (119909119896) gt 1198891198881199061199051198961198961 sdot Δ119889119896 (119909119896) 0 le Δ119889119896 (119909119896) le 1198891198881199061199051198960 Δ119889119896 (119909119896) lt 0
(2)
119872119875119864119873119896
=
0 Δ119889119896 (119909119896) gt 1198891198881199061199051198961198962 sdot (119889119888119906119905119896 minus Δ119889119896 (119909119896)) 0 le Δ119889119896 (119909119896) le 1198891198881199061199051198961198962 sdot 119889119888119906119905119896 Δ119889119896 (119909119896) lt 0
(3)
where 1198961 1198962 are incentive conversion ratio and penaltyconversion ratio respectively119889119888119906119905119896 is the contractual amountof load reduction
(2) If 119872119862119896 gt0 customer response is in compliance withcontractual requirements Hence 119872119862119896 is appreciated duringthe storage time 119873
119872119861119896 = (1 + 119909)119873 sdot 119872119862119896 (4)
where incentive level is regarded as appreciated rate underdeposit mechanism and 119872119861119896 is the appreciated points
Customer k can choose two ways as compensation forits regulated load reduction after storage time N One isappreciated electric power used for free within the duration Tduring valley periods another is economic reimbursementsIf customer k fails to submit the application requiring forappreciated electric power usage the power company defaultsto compensate the customer economically
If customer k chooses to obtain free electric power in thefuture the appreciated electricity 119876119861119896 obtained during valleyperiods can be deduced as
119876119861119896 = 1198721198611198961198961 sdot 119879 (5)
If customer k fails to submit the application the economicreimbursements can be conducted in accordance with actualelectricity reduction 119876119862119896 which is deduced as
119876119862119896 = Δ119889119896 (119909) sdot 119879 (6)
(3) If 119872119862119896 = 0 customer response is in the critical stateAssign 0 to 119876119861119896 under this circumstance Customer k doesnot need to pay additional penalties to the power companynor can it receive any compensation(4) If 119872119862119896 lt 0 customer response is defined asnoncompliance Penalties paid from customer 119896 to the powercompany are calculated based on penalty electricity 1198761015840119862119896
1198761015840119862119896 =100381610038161003816100381611987211986211989610038161003816100381610038161198961 sdot 119879 sdot 119896119888 (7)
where 119896119888 is the penalty rate for customerrsquos noncompliance
Mathematical Problems in Engineering 5
4 Decision Strategy of Capacity ShortageEvent under Deposit Mechanism
Under capacity shortage event an appropriate decision-making strategy is capable of achieving maximum economicefficiency under the premise of guaranteeing the safetyand stability of power system operation The benefit modelof subscribed customers and the power company underdeposit mechanism are established in this section Moreovera decision strategy under deposit mechanism consideringbenefits of both the power company and the customersis proposed based on the uncertainty model of customerbehaviour with the purpose of achieving optimal incentivelevel (appreciated rate) of capacity shortage events The mainidea is to maximize total benefits of the power companyon the premise of giving priority to customers with greaterbenefits as incentive targets Eventually the uniform designsampling (UDS) method considering correlations betweendifferent random input variables is introduced to quantify theuncertainties in decision strategy under deposit mechanism
41 Benefit Model of the Subscribed Customer Accordingto the reward and punishment rules of deposit mechanismmanagement total benefits of customer k (119861119864119873119896) underdepositmechanism can be deduced as the following function
119861119864119873119896 = 119864 119906119896 (120588119901119890119886119896 minus 119887119901119896)119876119862119896+ 119906119896119875119895119896 [120572119896119887V119896119876119861119896 + (1 minus 120572119896) 120588119888119900119898119876119862119896]minus 119906119896 (1 minus 119875119895119896) 1205881199011198901198861198961198761015840119862119896
(8)
where 119864∙ represents the mathematical expectation 119906119896 is astate variable whose value is neither 0 or 1 if customer kis one of the participants then 119906119896 = 1 else 119906119896 = 0 119887119901119896and 119887V119896 are unit production efficiency of customer k duringpeak periods and valley periods respectively ($kWh) 120588119901119890119886119896is peak electricity price ($kWh) 120572119896 is the probability whencustomer k submits the application for choosing appreciatedelectric power as the compensation 120588119888119900119898 is the economicreimbursement for unit electricity reduction ($kWh) 119875119895119896 isthe probability of compliance for customer k under capacityshortage event j which can be calculated through uniformdesign sampling (UDS) method introduced in this paper
42 BenefitModel of the PowerCompany Total benefits of thepower company under deposit mechanism are introduced asfollows based on the reward and punishment rules of depositmechanism management
119864119888119900119898 = 1198641198881199001198981 + 1198641198881199001198982 minus 1198641198881199001198983 minus 1198641198881199001198984 minus 1198641198881199001198985 (9)
where1198641198881199001198981 is avoidable investing and operating costs 1198641198881199001198982is penalties from customers 1198641198881199001198983 is the loss of electricity
sales 1198641198881199001198984 is incentive costs 1198641198881199001198985 is directly load sheddingcosts
1198641198881199001198981 = 119864 119899sum119896=1
119906119896 [(1198621 + 1198622)119876119862119896] (10)
1198641198881199001198982 = 119864 119899sum119896=1
119906119896 (1 minus 119875119895119896) 1205881199011198901198861198961198761015840119862119896 (11)
1198641198881199001198983 = 119864 119899sum119896=1
119906119896120588119901119890119886119896119876119862119896 (12)
1198641198881199001198984= 119864 119899sum
119896=1
119906119896 [120572119896120588V119886119897119897119890119910119876119861119896 + (1 minus 120572119896) 120588119888119900119898119876119862119896] 119875119895119896 (13)
1198641198881199001198985 = 119864119881119874119871119871 sdot (119862119878119895 minus 119899sum119896=1
119906119896119876119862119896) (14)
where 119864∙ represents the mathematical expectation 1198621is peak load pricing which represents the unit avoidableinvestment and operation costs of generators ($kWh) 1198622is unit transmission and distribution cost which representsthe unit avoidable construction operation and maintenancecosts of power networks ($kWh) 120588V119886119897119897119890119910 is valley electricityprice ($kWh)VOLL(value of lost load) is unit loss of directlyload shedding when capacity shortage is not completelyfilled by subscribed customers ($kWh) 119862119878119895 is the capacitydeficiency of event j
43 Decision Strategy In general the design and implemen-tation of demand response mechanism including depositmechanism is to maximize the total benefits of the powercompany However benefits of subscribed customers chosenas incentive targets are also important in order to achievegreater participation motivation and promote a friendlybilateral interaction of power between suppliers and buy-ers considering the responsibilities of the power companyHence a novel decision strategy of capacity shortage eventsunder deposit mechanism is proposed in this section torealize the economic efficiency of the power company onthe premise of protecting benefits of subscribed customerswhich helps to achieve a win-win situation for both the powercompany and the customers
The objective of decision model is still maximizing totalbenefits of the power company
119891 = max119864119888119900119898 (15)
Considering the uncertainty of customer behaviours re-sponse fluctuation level of capacity shortage event 119895 can bedefined as
119865119895 =10038161003816100381610038161003816sum119899119896=1119876119862119896 minus 11986211987811989510038161003816100381610038161003816119862119878119895 (16)
6 Mathematical Problems in Engineering
Therefore the reliability 119877119895 of capacity shortage event 119895which evaluates the actual response of target customers isdeduced as follows
119877119895 = 1 minus 119865119895 (17)
Constraints of the decision model include the individual-rationality constraint load reduction constraint reliabilityconstraint and incentive level (appreciated rate) constraintwhich are shown as follows
(1) Individual-Rationality Constraint The expected benefit ofcustomer k chosen as an incentive target of capacity shortageevent j under deposit mechanism should be greater thanthe maximum expected benefit from nonparticipation (119896 =1 2 119899)
[120588119901119890119886119896 + (1 minus 120572119896) 120588119888119900119898]119876119862119896 + 120572119896119887V119896119876119861119896 ge 119887119901119896119876119862119896 (18)
(2) Load Reduction Constraint The actual load reduction ofcustomer k should not be less than theminimum interruptionrequirement 119889min which is usually defined as 05MW inChina
Δ119889119896 (119909) ge 119889min 119896 = 1 2 119899 (19)
(3) Reliability Constraint In order to avoid the situations ofrdquounderresponserdquo and rdquooverresponserdquo the range of reliabilityshould be refined as
119877119895min le 119877119895 le 119877119895max (20)
where 119877119895min and 119877119895max are the lowerupper bounds ofreliability(4) Incentive Level (Appreciated Rate) Constraint
119909min le 119909 le 119909max (21)
where 119909min and 119909max are the lowerupper bounds of incentivelevel (appreciated rate)
The decision strategy procedure of capacity shortageevent 119895 can be summarized in Figure 3 where 119873119880119872119895119896 is thesummation of compliance in random sampling 119873119904119906119898 is thetotal number of sampling Hence 119875119895119896 can be calculated as
119875119895119896 = 119873119880119872119895119896119873119904119906119898 (22)
The steps of decision strategy can be explained in detail asfollows
Step 1 Acquire the deficiency of capacity shortage 119862119878119895Suppose the initial incentive level as well as its step length ofevent j
Step 2 Among all the subscribed customers choose thosewith maximum self-benefits as incentive targets at incentivelevel 119909119895 in which way the total benefits of subscribedcustomers are guaranteed to enhance the participation moti-vation of customers
Step 3 Generate the sampling of actual load reductionΔ119889119896(119909119895) for each chosen customer k chosen as incentive targetbased on the uniform design sampling (UDS) method
Step 4 Calculate the probability of compliance 119875119895119896 forcustomer k based on the sample statistics results as well asthe reward and punishment rules of deposit mechanism
Step 5 If the chosen customer k cannot satisfy constraints (1)and (2) reselect an incentive target at the current incentivelevel 119909119895 according to the principle of maximum customerbenefits among the rest of subscribed customers repeat Steps2 and 3 if all the chosen customers can satisfy constraints (1)and (2) calculate the reliability of capacity shortage event jconsidering the actual load reductions of all incentive targets
Step 6 If constraint (3) is satisfied calculate total benefits ofthe power company at the current incentive level 119909119895Step 7 If incentive level has already reached the maximumset in constraint (4) output the optimal benefits of the powercompany as well as the incentive level
44 Uniform Design Sampling (UDS) Method Uncertaintiesof customersrsquo actual load reductions lead to numerous ran-dom input variables in the decision strategy model Hencethe uniform design sampling (UDS) method is introducedin this section considering the correlation between differentrandom input variables
Uniform design sampling (UDS) method is conductedbased on the idea of space filling with sampling pointsobeying uniform distribution within the test range [32]After sampling points are selected edge transformation andcorrelation processing are put forward as well to enhance theuniversality of UDS Compared with traditional Monte Carlosimulation superiorities of UDS are presented as follows (1)the number of sampling points of UDS is smaller with thesame sample space (2) the stability of UDS is better(1) Uniform Design Sampling Assume that there are m-dimensional random variables 1198831 1198832 119883119898 obeying uni-form distribution in interval [0 1] and the total number ofsampling points for each variable is119873119888Therefore the steps ofconstructing samplemoment119883119898times119873119888 byUDS are summarizedas follows(1)Generate a positive integer vector1198671times119898 = [ℎ1 ℎ2 ℎ119898] where ℎ1 = 1 1 lt ℎ119895 lt 119899 and for any 119894 = 119895 ℎ119894 = ℎ119895 119899can be any positive integer greater than 119898(2) Generate vector Β1times119898 = [1198871 1198872 119887119898] with elementsselected from [0 1 119873119888 minus 1](3) Generate sample matrix 119864119898times119873119888 = [1198901 1198902 119890119894 119890119898]119879 by traditional Monte Carlo simulation where 119890119894 =[1198901198941 1198901198942 119890119894119873119888] Any 119890119894119895 is supposed to obey uniform distri-bution in interval [minus05 05](4) Elements in 119883119898times119873119888 = [11990911199092 119909119894 119909119898]119879 can bedefined as follows when 119909119894 = [1199091198941 1199091198942 119909119894119873119888 ]119879
119909119894119895 = 119895ℎ119894 + 119887119894 minus 05119873119888 + 119890119894119895119873119888 (23)
Mathematical Problems in Engineering 7
Select the incentive target customers accordingto maximum customer benefits
End of sampling
Yes
No
Constraint 1amp2 satisfied
Yes
Yes
No
Customerscompletely traversed
No
No
Yes
Constraint 3 satisfied
Yes
No
Calculate the total benefit of powercompany at the current incentive level
Maximum incentive level
YesOutput the maximum benefit as well as incentive level
No
Acquire capacity deficiency and assumethe initial incentive level of event
= +
gt
based on uniform design sampling (UDS) methodAcquire the sampling of actual load reduction ()
Calculate according to formula (1)(2)(3)
gt
= +1 = +1
=
Figure 3 The decision strategy procedure of capacity shortage event j
where ∙ means taking the fractional part only 119894 = 1 2 119898 119895 = 1 2 119873119888(2) Edge Transformation and Correlation Processing It isnoticed that random variables should obey uniform distribu-tion in interval [0 1] which is the basis of UDS Howeverrandom variables in the stochastic model can be subjectto arbitrary distributions Therefore edge transformation isproposed to solve this problem
If the cumulative distribution function (CDF) of randominput variable 120596 is referred to as 119865(120596) it can be confirmedthat 119906 = 119865(120596) is bound to obey uniform distributionin interval [0 1] [33] The transaction between those twodifferent distributions is defined as edge transformation
1198651 (119910) = 119865 (120596) lArrrArr 120596 = 119865minus1 (1198651 (119910)) (24)
In this way it is possible to implement transformationfrom uniform distribution to arbitrary distribution whichenhances the applicability of UDS
The initial correlation coefficient matrix sum = (120574119894119895) forinput variables can either be calculated throughmeasurementdata or be directly given for those without measurementAs is mentioned above edge transformation is capable ofimplementing transformation from uniform distribution toarbitrary distribution In order to satisfy the initial correla-tion between input variables after edge transformation anintermediate variable V1015840 obeying Gaussian distribution is
8 Mathematical Problems in Engineering
Table 1 Characteristic parameters of typical customers
Type Δ1198890119888119886119901119886119888119894119905119910 Δ119889119898119886119909119888119886119901119886119888119894119905119910 1199090 1199091 119909119898119886119909 119889119888119906119905119888119886119901119886119888119894119905119910 119896119888 1205721 8 40 005 010 020 40
12 082 5 25 005 020 030 253 3 10 005 030 040 10
Table 2 Optimal benefits of customers under deposit mechanism and traditional mechanism
Mechanism Customer type Optimal benefit$ Incentive range when 119861119864119873 ge 0Traditional mechanism
1 56205 [0136 02]2 49295 [0233 03]3 24341 [0325 04]
Deposit mechanism1 85868 [0146 02]2 73871 [0236 03]3 38640 [0327 04]
introduced for correlation processing Main steps of corre-lation processing are summarized as follows(1) Assume that the sample matrix generated by UDS is119884119898times119873119888 119884119898times119873119888 = [11991011199102 119910119894 119910119898]119879 119910119894 sim 119880(0 1) Thecorresponding intermediate variable 119907119894 can be achieved as
119907119894 = Φminus1 (119910119894) 119894 = 1 2 119898 (25)
whereΦ is CDF of standard normal distribution(2) Make a corresponding correction to the initial cor-relation coefficient matrix sum For the transformation fromGaussian distribution to uniform distribution the nondiago-nal elements of sum should be modified as [34]
120574lowast119894119895 = 2 sin (1205876 120574119894119895) (26)
The revised correlation coefficient matrix is denoted assum lowast =(120574lowast119894119895)(3) Achieve the corresponding Gaussian sample matrix119881119888119900119903119903 by Cholesky decomposition of sumlowast
119881119888119900119903119903 = 119871119881 (27)
where 119881 = [1199071 1199072 119907119894 119907119899]119879 119907119894 = [V1198941 V1198942 V119894119873119888 ] 119871is an upper triangular matrix which satisfies sumlowast = 119871119871119879(4) Achieve the corresponding uniform sample as
119910119888119900119903119903119894 = Φ (119907119888119900119903119903119894 ) (28)
Another edge transformation is also necessary to obtain thecorresponding sample of input variable 120596119894
120596119888119900119903119903119894 = 119865minus1119908119894 (119910119888119900119903119903119894 ) 119894 = 1 2 119898 (29)
where 119865119908119894 is CDF of input variable 120596119894Due to the nonlinear characteristics of edge transforma-
tion truncation errors may occur in the process [35] Usuallythe errors are too small to have effect on resultsTherefore thetruncation errors are ignored in this paper
5 Case Studies and Discussions
Taking the electricity data in Nanjing city China as anexample peak electricity price 120588119901119890119886119896 is 02 $kWh and valleyelectricity price 120588V119886119897119897119890119910 is 008 $kWh according to marketsurvey Considering the significant economic benefits ofdemand response peak load pricingC1 and unit transmissionand distribution cost 1198622 are assumed as 07 $kWh and0015$kWh respectively VOLL is set as 1000$MWh and therelationship between incentive conversion ratio and penaltyconversion ratio 1198961 is proposed as 1198962 according to literature[36]
Under deposit mechanism unit economic reimburse-ment 120588119888119900119898 cannot be set too high or too low On the one hand120588119888119900119898 should be smaller than unit economic reimbursementunder traditional mechanism in order to encourage powerconsumption during valley periods On the other hand 120588119888119900119898is ought to be higher than peak electricity price 120588119901119890119886119896 so asto guarantee effectiveness of incentive measures As a result120588119888119900119898 is set as 028$kWh in this paper [10]
51 Customer Benefits under Different Mechanisms Threetypical customer types under deposit mechanism based onthe range of incentive levels are proposed in this sectionshown in Table 1 Assume that unit production efficienciesduring peak and valley periods are 03385 and 02154 $kWhresponse time T is 1 (hour) and storage time119873 = 3 (months)for all three types of customers Optimal benefits of eachtypical customer under deposit mechanism and traditionalmechanism can be shown in Table 2 In order to reveal theinfluence of customer types to customer benefits the capacityis set as 10MW for all three types in this case
Under traditionalmechanism customers can only receiveeconomic compensations based on actual electricity reduc-tion for compliance while the penalty rate for noncomplianceis still 119896119888 Unit economic compensation under traditionalmechanism is set as 03385 $kWh [10]
From customerrsquos point of view optimal benefits underdeposit mechanism are superior to those under traditionalmechanism owing to the fact that the scope of customer
Mathematical Problems in Engineering 9
Table 3 Typical categories of customersrsquo capacity allocation
Typical categories Capacity proportion of different customer typesType 1 Type 2 Type 3
Category 1 50 25 25Category 2 25 50 25Category 3 25 25 50
5500
6000
6500
7000
7500
8000
Tota
l ben
efits
($)
02 025 03 035 04015Incentive level
8000
8500
9000
9500
10000
10500
Tota
l ben
efits
($)
025 03 035 0402Incentive level
Deposit mechanismTraditional mechanism
Deposit mechanismTraditional mechanism
Figure 4 Comparison of the decision strategy results between deposit mechanism and traditional mechanism with customer allocation ofcategory 1 under different scenarios Left scenario 1 Right scenario 2
benefits has been expanded under deposit mechanism withthe appreciated function In addition customer in type 1 ownsthe maximum benefits and minimum profit range amongall types due to its high sensitivity to changes in incentivelevels and high flexibility in electricity usage indicating thatthe participation willing of customers in type 1 may be thestrongest under deposit mechanism
52 Decision Strategy Benefits under Different MechanismsAssume that the total capacity of subscribed customersis 900MW In order to facilitate the analysis of decisionresults under deposit mechanism with different customercompositions three typical categories of customersrsquo capacityallocation are proposed in Table 3 The total number ofcustomers is 119899 = 30 with 10 type 1 customers 10 type 2customers and 10 type 3 customers The capacity of eachcustomer under a specific type is randomly generated butremains the same characteristics with that given in Table 1Because of the fact that subscribed customers are mutuallyindependent the initial correlation coefficient matrix is a nullmatrix Two scenarios are also proposed to simulate differentcapacity shortage events that occurred during peak periodsThe capacity gaps are 20MW and 35MW under scenario 1and scenario 2 describing the actual electricity consumptionsituation during springautumn and summerwinter respec-tively
The comparison of decision strategy results (total benefitsof the power company) between deposit mechanism and
traditional mechanism with different categories of customerallocation under different scenarios is illustrated in Figures4ndash6 while the reliability range is set as 80-90 in all casesThe lower limits of incentive level shown in Figures 4 5and 6 are the minimum incentive level satisfying reliabilityrequirements in each specific scenario The upper limits ofincentive level shown in Figures 4 5 and 6 are both 04 whereall customers have reached saturated zone in all cases
It is revealed from Figures 4ndash6 that the decision strategyresults under deposit mechanism are superior to that undertraditionalmechanism in themost range of effective incentivelevel of all cases It is because the optional compensation wayof free appreciated electric power under deposit mechanismsignificantly reduces the overall incentive costs of the powercompany in the most range of effective inventive levelcompared with traditional mechanism illustrating the greatsuperiority of proposed deposit mechanism
However there is a tendency that the total benefitsunder deposit mechanism are inferior to those under tra-ditional mechanism at the very beginning and ending ofeffective incentive range Reasons for this phenomenon canbe explained as follows When incentive level is relatively lowcustomers are highly likely to be defined as noncomplianceunder deposit mechanism Hence the lack of motivationcauses decrease of total load reduction leading to less benefitsunder deposit mechanism When incentive level is too highthe exponentially growing incentive costs caused by appreci-ated function under deposit mechanism are bigger than that
10 Mathematical Problems in Engineering
8000
8500
9000
9500
10000
10500
Tota
l ben
efits
($)
03 035 04025Incentive level
025 03 035 0402Incentive level
5000
5500
6000
6500
7000
7500
8000To
tal b
enefi
ts ($
)
Deposit mechanismTraditional mechanism
Deposit mechanismTraditional mechanism
Figure 5 Comparison of the decision strategy results between deposit mechanism and traditional mechanism with customer allocation ofcategory 2 under different scenarios Left scenario 1 Right scenario 2
5000
5500
6000
6500
7000
7500
8000
Tota
l ben
efits
($)
03 035 04025Incentive level
8000
8500
9000
9500
10000
10500To
tal b
enefi
ts ($
)
03 035 04025Incentive level
Deposit mechanismTraditional mechanism
Deposit mechanismTraditional mechanism
Figure 6 Comparison of the decision strategy results between deposit mechanism and traditional mechanism with customer allocation ofcategory 3 under different scenarios Left scenario 1 Right scenario 2
growing linearly under traditional mechanism leading to thesteeper slope of deposit mechanism when incentive targetshave been fixed
In general deposit mechanism still has outstandingadvantages over traditional mechanism in the most range ofeffective incentive level ranges and the tendency inferior totraditional mechanism only appears in extreme cases withrather small probabilities
It is also noted that the optimal benefits as well as theincentive range superior to traditional mechanism of depositmechanism are successively decreasing with customer allo-cation of category 1 category 2 and category 3 mainlybecause of the different proportion of different customertypes in the three categories According to analysis abovetype 1 customers are more sensitive to incentive level changes
and with greater schedulable potential than type 2 andtype 3 customers with the same capacity As a result thepower company is capable of acquiring more demand sideresources with less incentive costs from type 1 customersleading to greater benefits under the same scenario Themore proportion type 1 customers accounted for the greaterbenefits are
The overall trends of total benefits curves with differentcategories of customer allocation and different scenarios arealmost the same As incentive level increases customerswith greater benefits are chosen as incentive targets and theactual load reduction improves as well leading to the gradualincrease of total benefits at the very beginning With thecontinuous increases of incentive level part of customershave reached the saturated zone and other customers will
Mathematical Problems in Engineering 11
NoConstraint 1)amp2) satisfied
Reliability satisfied
Maximum incentive level
Yes
Output incentive targets and incentive level correspondingto optimal total benefits based on model B and model C
No
No
Yes
Yes
Acquire the decision strategy based on model B and model C
Acquire the actual load reduction of incentive targets basedon model B and model C using Monte Carlo simulation
Evaluate the practical application of decision strategy above
Calculate optimal benefits of power company accordingto the estimated incentive targets and incentive level
Acquire capacity deficiency and assumethe initial incentive level of event
= +
based on model B and model C and select the incentive targetcustomers according to the maximum load reduction
Acquire the estimated load reduction () of each customer
Figure 7 Analysis procedure of model B and model C
be informed to reduce electric power in order to satisfy thereliability Therefore the growth in incentive costs causes thedecrease of total benefits and the dynamic choices of incentivetargets result in the fluctuation As incentive level continues toincrease and reaches a certain value the selection of incentivetargets has been fixed After that the increase of incentivecosts causes the gradual decrease of total benefits
53 Efficacy of Proposed Uncertainty Customer BehaviourModel The influence of different modelling of customersfor decision strategy under deposit mechanism is proposedin this section Among them model A is the uncertaintymodel previously noted in Section 2 and model B andmodel C are the traditional deterministic psychology modelswith different inflection points between dead zone andlinear zone representing the optimistic estimation and pes-simistic estimation of actual load reduction respectively The
traditional deterministic psychology model is introduced inthe Appendix
The inflection points of model B and model C are set as1199090 and 1199091 of model A respectively while other parametersremain the same Suppose the reliability is 80-90 underscenario 1with customer allocation of category 2The analysisprocedure of models B and C is shown in Figure 7
Key parameters of decision strategy results based onmodels A B and C are proposed in Table 4 It is illustratedthat optimal benefits based on model A are superior tothose based on model B and model C If the actual loadreduction of customers is optimistic estimated (model B)probability of noncompliance is higher and the penaltiesfrom customers will increase However the costs for directlyload shedding will also increase leading to the declineof optimal benefits If the actual load reduction of cus-tomers is pessimistic estimated (model C) the increase of
12 Mathematical Problems in Engineering
Table 4 Key parameters of decision strategy based on models A B C
Model Optimalincentive level
Optimalbenefits$
Incentivecosts$
Compensationfrom customers$
Directly loadshedding costs$
A 023 741505 421601 1348 41948B 016 588287 281940 8922 241922C 026 680651 465730 0 0
Credibility ()
0
02
04
06
08
1
Opt
imal
ben
efits
104$
Scenario 1Scenario 2
0-10
20-30
30-40
40-50
50-60
60-70
70-80
80-90
10-20
90-100
Figure 8 The trend of optimal benefits changing with reliabilityrange with customer allocation of category 2 under different scenar-ios
incentive costs will cause the decline of optimal benefits aswell
54 Influence of Reliability Setting on Decision Strategy Inorder to further analyse the influence of reliability on decisionstrategy results different reliability ranges are chosen underscenario 1 and scenario 2 with the customer allocation ofcategory 2 The trend of optimal benefits changing withreliability range is shown in Figure 8
From the perspective of the power company optimalreliability ranges are 70-80 under scenario 1 and 90-100 under scenario 2 Reasons for this phenomenon canbe explained as follows Under scenario 1 capacity gap iscomparatively small The influence of uncertainty in cus-tomer behaviours can be decreased along with the increaseof incentive level in order to satisfy reliability requirementsHowever as the reliability increases the rising of incentivecosts can also lead to the decline of optimal benefits Underscenario 2 the electricity shortage is rather severe that thepower company needs to continuously increase incentivelevel to encourage the participation of more customers sothat capacity gap can be filled owing to the fact that costsof direct load shedding caused by insufficient response aremuch higher than incentive costs Customers with lowerschedulable potential is selected as well due to the expansion
0
05
1
15
2
25
(
)
1000 1500 2000 2500 3000 3500 4000500Total number of sampling points
Monte CarloUDS
Figure 9 Error comparison of mean between Monte Carlo simula-tion and UDS
of incentive targets which can explain the gradual decreaseof increasing rate in optimal benefits
55 Comparison between UDS and Traditional Monte CarloSimulation The selection of input random sampling deter-mines calculation accuracy directly Suppose that results cal-culated by traditional Monte Carlo simulation with samplingscale of 40000 is the accurate value of optimal benefits Theaccurate mean and variance can be described as 120583119898119890119886119899 and1205902var while the calculated mean and variance can be describedas 120583119888119886119897 and 1205902119888119886119897 Therefore average relative errors of optimalbenefits are deduced as
120576120583 = 10038161003816100381610038161003816100381610038161003816120583119898119890119886119899 minus 120583119888119886119897120583119898119890119886119899
10038161003816100381610038161003816100381610038161003816 (30)
120576120590 =1003816100381610038161003816100381610038161003816100381610038161205902var minus 12059021198881198861198971205902var
100381610038161003816100381610038161003816100381610038161003816 (31)
where 120576120583 is average relative error of mean and 120576120590 is averagerelative error of variance
The relative errors of optimal benefits solved by tradi-tional Monte Carlo simulation and UDS are shown in Figures9 and 10 It is indicated that UDS is superior to Monte Carlosimulation in terms of precision as well as error stability withthe same sample size The fewer sampling points are thegreater advantages can be illustrated
Mathematical Problems in Engineering 13
Monte CarloUDS
1000 1500 2000 2500 3000 3500 4000500Total number of sampling points
0
05
1
15
(
)
Figure 10 Error comparison of variance between Monte Carlosimulation and UDS
6 Conclusions
In this paper the design of deposit mechanism and anovel corresponding decision strategy are proposed con-sidering the uncertainty of customer behaviour Based onthe theory of customer psychology an uncertainty modelof customer behaviour is introduced Emulating the depositand withdrawal process of bank funds a new deposit pointmethod is proposed and applied into the deposit mechanismdesign to realize the storage and value-added function ofdeposit points converted from electric power Furthermorea decision strategy based on uncertainty model of customerbehaviour is proposed considering both the benefits ofthe power company and the subscribed customers underdeposit mechanism Uncertainties in decision strategy arequantified by uniform design sampling (UDS) method Ingeneral the advantages of proposed deposit mechanism anddecision strategy as well as its uncertainty quantificationmethod are the following (1) Greater benefits of both thepower company and the subscribed customers are to beobtained (2) A win-win situation and greater mobilizationof customer motivation can be achieved (3) The influencecaused by estimation of customer behaviour can be reduced(4) Sampling efficiency computational accuracy and errorstability can be improvedWith the electricity data of Nanjingcity China the numerical simulation results demonstratethat the proposed deposit mechanism and decision strategycan improve the effectiveness of DR in China Comparedwith traditional methods greater benefits of both the powercompany and the customers can be achieved to improve theparticipation motivation of customers
Appendix
The traditional deterministic psychology model of customerresponse mentioned in Section 5 is shown in Figure 11
Dead zone
0 xInflection point
Linear zone
Saturated zone
Δdk
Figure 11 Traditional deterministic psychology model of customerresponse
Data Availability
All the data needed in decision strategy solution has beenpresented in the main body of this paper
Conflicts of Interest
The authors declare no conflicts of interest
Acknowledgments
This research was funded by National Key TechnologyResearch and Development Program of China[2016YFB0901100]References
[1] Q Xu Y Ding Q Yan A Zheng and P Du ldquoDay-Ahead LoadPeak SheddingShifting SchemeBased onPotential LoadValuesUtilization Theory and Practice of Policy-Driven DemandResponse in Chinardquo IEEE Access vol 5 pp 22892ndash22901 2017
[2] R Deng Z Yang J Chen and M-Y Chow ldquoLoad schedulingwith price uncertainty and temporally-coupled constraints insmart gridsrdquo IEEE Transactions on Power Systems vol 29 no 6pp 2823ndash2834 2014
[3] Y Wang Q Xu Z Ma and H Zhu ldquoAn improved controland energy management strategy of three-level NPC converterbased DC distribution networkrdquo Energies vol 10 no 10 2017
[4] Y Wang Q Xu and M Liu ldquoA novel system operation modewith flexible bus type selection method in DC power systemsrdquoInternational Journal of Electrical Power amp Energy Systems vol103 pp 1ndash11 2018
[5] P Siano ldquoDemand response and smart gridsmdasha surveyrdquoRenew-able amp Sustainable Energy Reviews vol 30 pp 461ndash478 2014
[6] H A Aalami M P Moghaddam and G R Yousefi ldquoDemandresponse modeling considering interruptiblecurtailable loadsand capacity market programsrdquo Applied Energy vol 87 no 1pp 243ndash250 2010
[7] J Saez-Gallego J M Morales M Zugno and H Madsen ldquoAData-Driven Bidding Model for a Cluster of Price-ResponsiveConsumers of Electricityrdquo IEEE Transactions on Power Systemsvol 31 no 6 pp 5001ndash5011 2016
14 Mathematical Problems in Engineering
[8] F Aminifar M Fotuhi-Firuzabad andM Shahidehpour ldquoUnitcommitment with probabilistic spinning reserve and interrupt-ible load considerationsrdquo IEEE Transactions on Power Systemsvol 24 no 1 pp 388ndash397 2009
[9] G K Toh and H B Gooi ldquoProcurement of interruptible loadservices in electricity supply systemsrdquo Applied Energy vol 98pp 533ndash539 2012
[10] M M Sahebi E A Duki M Kia A Soroudi and MEhsan ldquoSimultanous emergency demand response program-ming and unit commitment programming in comparison withinterruptible load contractsrdquo IET Generation Transmission ampDistribution vol 6 no 7 pp 605ndash611 2012
[11] R Argiento R Faranda A Pievatolo and E Tironi ldquoDis-tributed interruptible load shedding and micro-generator dis-patching to benefit system operationsrdquo IEEE Transactions onPower Systems vol 27 no 2 pp 840ndash848 2012
[12] H-G Park J-K Lyu Y Kang and J-K Park ldquoUnit commit-ment considering interruptible load for power systemoperationwith wind powerrdquo Energies vol 7 no 7 pp 4281ndash4299 2014
[13] R Bhana and T J Overbye ldquoThe Commitment of Inter-ruptible Load to Ensure Adequate System Primary FrequencyResponserdquo IEEE Transactions on Power Systems vol 31 no 3pp 2055ndash2063 2016
[14] J Dong G Xue and R Li ldquoDemand response in ChinaRegulations pilot projects and recommendations - A reviewrdquoRenewable amp Sustainable Energy Reviews vol 59 pp 13ndash272016
[15] J Sousa O R Saavedra and S L Lima ldquoDecision-Making inEmergency Operation for Power Transformers with Regard toRisks and Interruptible Load Contractsrdquo IEEE Transactions onPower Delivery vol 99 2017
[16] M Shafie-Khah and J P S Catalao ldquoA stochastic multi-layeragent-based model to study electricity market participantsbehaviorrdquo IEEE Transactions on Power Systems vol 30 no 2pp 867ndash881 2015
[17] H-G Kwag and J-O Kim ldquoReliability modeling of demandresponse considering uncertainty of customer behaviorrdquoApplied Energy vol 122 pp 24ndash33 2014
[18] N Nikmehr S Najafi-Ravadanegh and A Khodaei ldquoProba-bilistic optimal scheduling of networked microgrids consider-ing time-based demand response programs under uncertaintyrdquoApplied Energy vol 198 pp 267ndash279 2017
[19] Q Zhang M F Morari I E Grossmann A Sundaramoorthyand J M Pinto ldquoAn adjustable robust optimization approachto scheduling of continuous industrial processes providinginterruptible loadrdquo Computers amp Chemical Engineering vol 86pp 106ndash119 2016
[20] Q Wang J Wang and Y Guan ldquoStochastic unit commitmentwith uncertain demand responserdquo IEEE Transactions on PowerSystems vol 28 no 1 pp 562-563 2013
[21] M Aien M Fotuhi-Firuzabad and M Rashidinejad ldquoProb-abilistic optimal power flow in correlated hybrid wind-photovoltaic power systemsrdquo IEEE Transactions on Smart Gridvol 5 no 1 pp 130ndash138 2014
[22] Z Wei J Xu X Dai et al ldquoResearch on coarse-grained parallelalgorithm of the Monte-Carlo simulation for probabilistic loadflow calculationrdquo Power and Energy 2015
[23] C Delgado and J A Domınguez-Navarro ldquoPoint estimatemethod for probabilistic load flow of an unbalanced powerdistribution system with correlated wind and solar sourcesrdquoInternational Journal of Electrical Power amp Energy Systems vol61 pp 267ndash278 2014
[24] WWu K Wang B Han et al ldquoA versatile probability model ofphotovoltaic generation using pair copula constructionrdquo Powerand Energy Society General Meeting 2016
[25] A Tamtum A Schellenberg and W D Rosehart ldquoEnhance-ments to the cumulant method for probabilistic optimal powerflow studiesrdquo IEEE Transactions on Power Systems vol 24 no4 pp 1739ndash1746 2009
[26] M D Shields and J Zhang ldquoThe generalization of Latinhypercube samplingrdquo Reliability Engineering amp System Safetyvol 148 pp 96ndash108 2016
[27] Q Xu Y Yang Y Liu and X Wang ldquoAn improved latinhypercube sampling method to enhance numerical stabilityconsidering the correlation of input variablesrdquo IEEE Access vol5 pp 15197ndash15205 2017
[28] S Majumdar D Chattopadhyay and J Parikh ldquoInterruptibleload management using optimal power flow analysisrdquo IEEETransactions on Power Systems vol 11 no 2 pp 715ndash720 1996
[29] M Feldstein and C Horioka ldquoDomestic saving and interna-tional capital flowsrdquo Economic Journal vol 90 no 358 pp 314ndash329 1980
[30] J H Doudna ldquoOverview of California ISO summer 2000demand response programsrdquo in Proceedings of the 2001 IEEEPower Engineering Society Winter Meeting vol 1 pp 228ndash2332001
[31] N Abed S Greene and J Gentile T ldquoNew York IndependentSystemOperator (NYISO) Benefits of Adding Capacitors to theElectric System February 27rdquo Keats-Shelley Journal pp 151ndash1532008
[32] K-T FangD K Lin PWinker andY Zhang ldquoUniformdesigntheory and applicationrdquo Technometrics vol 42 no 3 pp 237ndash248 2000
[33] P-L Liu and A der Kiureghian ldquoMultivariate distributionmodels with prescribed marginals and covariancesrdquo Probabilis-tic Engineering Mechanics vol 1 no 2 pp 105ndash112 1986
[34] J Usaola ldquoProbabilistic load flow with correlated wind powerinjectionsrdquo Electric Power Systems Research vol 80 no 5 pp528ndash536 2010
[35] H Li Z Lu and X Yuan ldquoNataf transformation based pointestimate methodrdquo Chinese Science Bulletin vol 53 no 17 pp2586ndash2592 2008
[36] A Moshari A Ebrahimi and M Fotuhi-Firuzabad ldquoShort-Term Impacts ofDRPrograms onReliability ofWind IntegratedPower Systems Considering Demand-Side Uncertaintiesrdquo IEEETransactions on Power Systems vol 31 no 3 pp 2481ndash24902016
Hindawiwwwhindawicom Volume 2018
MathematicsJournal of
Hindawiwwwhindawicom Volume 2018
Mathematical Problems in Engineering
Applied MathematicsJournal of
Hindawiwwwhindawicom Volume 2018
Probability and StatisticsHindawiwwwhindawicom Volume 2018
Journal of
Hindawiwwwhindawicom Volume 2018
Mathematical PhysicsAdvances in
Complex AnalysisJournal of
Hindawiwwwhindawicom Volume 2018
OptimizationJournal of
Hindawiwwwhindawicom Volume 2018
Hindawiwwwhindawicom Volume 2018
Engineering Mathematics
International Journal of
Hindawiwwwhindawicom Volume 2018
Operations ResearchAdvances in
Journal of
Hindawiwwwhindawicom Volume 2018
Function SpacesAbstract and Applied AnalysisHindawiwwwhindawicom Volume 2018
International Journal of Mathematics and Mathematical Sciences
Hindawiwwwhindawicom Volume 2018
Hindawi Publishing Corporation httpwwwhindawicom Volume 2013Hindawiwwwhindawicom
The Scientific World Journal
Volume 2018
Hindawiwwwhindawicom Volume 2018Volume 2018
Numerical AnalysisNumerical AnalysisNumerical AnalysisNumerical AnalysisNumerical AnalysisNumerical AnalysisNumerical AnalysisNumerical AnalysisNumerical AnalysisNumerical AnalysisNumerical AnalysisNumerical AnalysisAdvances inAdvances in Discrete Dynamics in
Nature and SocietyHindawiwwwhindawicom Volume 2018
Hindawiwwwhindawicom
Dierential EquationsInternational Journal of
Volume 2018
Hindawiwwwhindawicom Volume 2018
Decision SciencesAdvances in
Hindawiwwwhindawicom Volume 2018
AnalysisInternational Journal of
Hindawiwwwhindawicom Volume 2018
Stochastic AnalysisInternational Journal of
Submit your manuscripts atwwwhindawicom
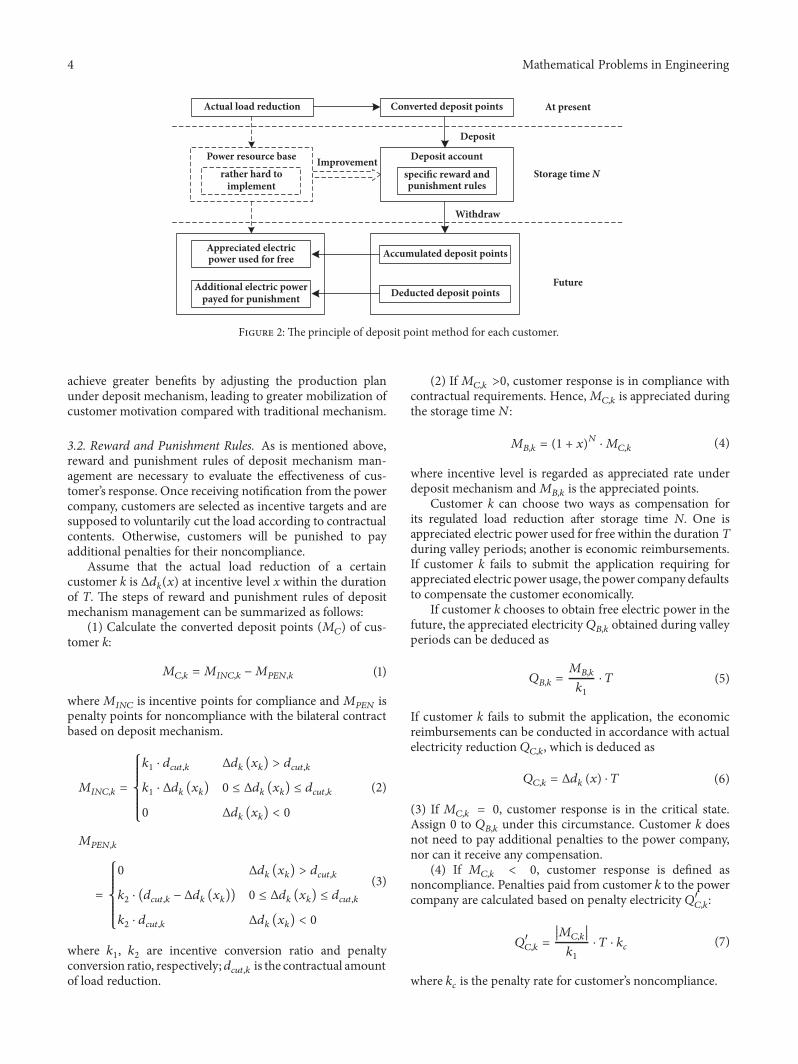
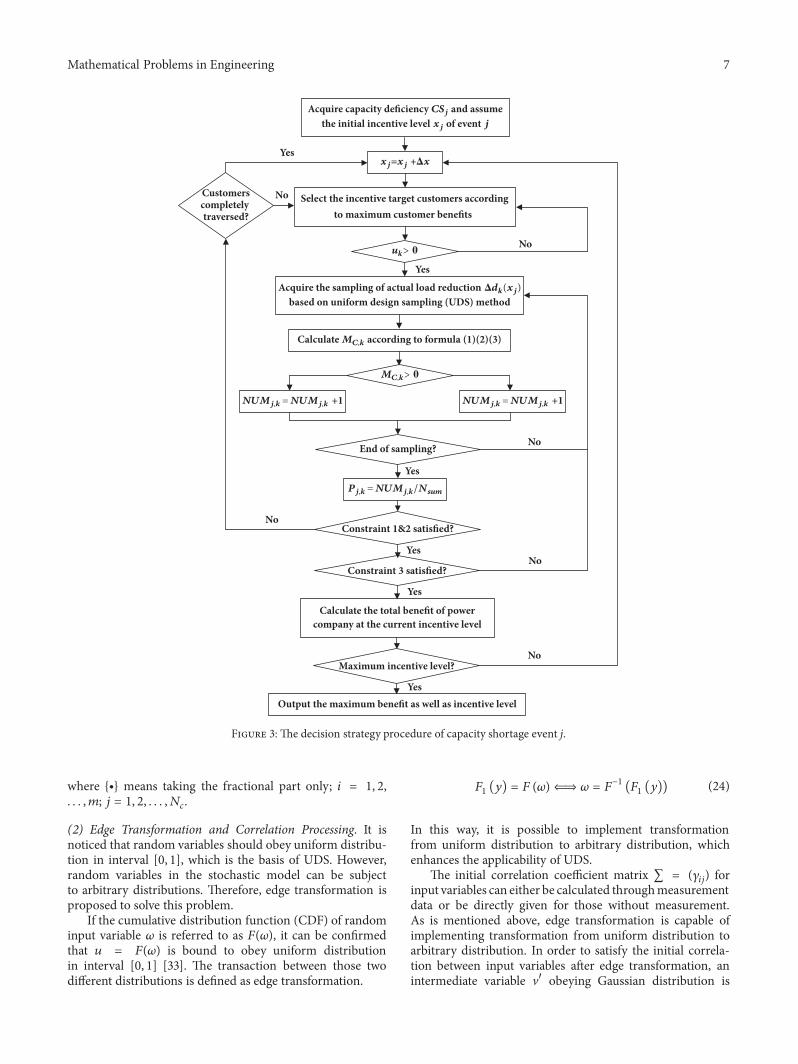
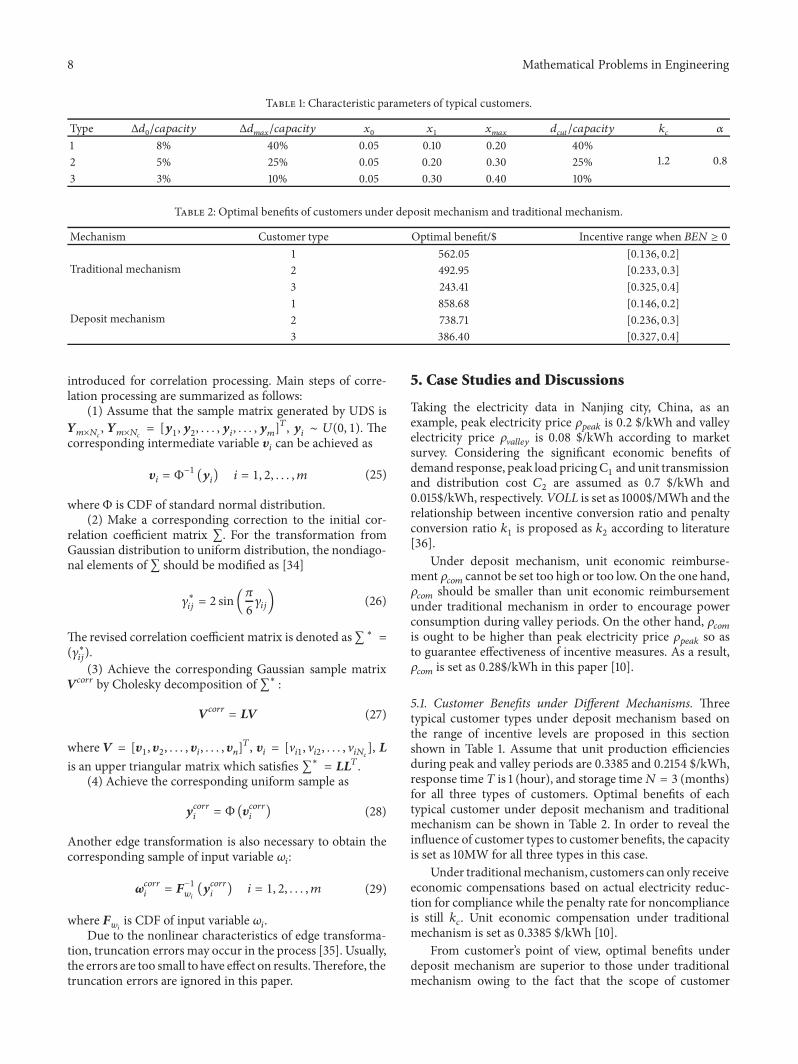
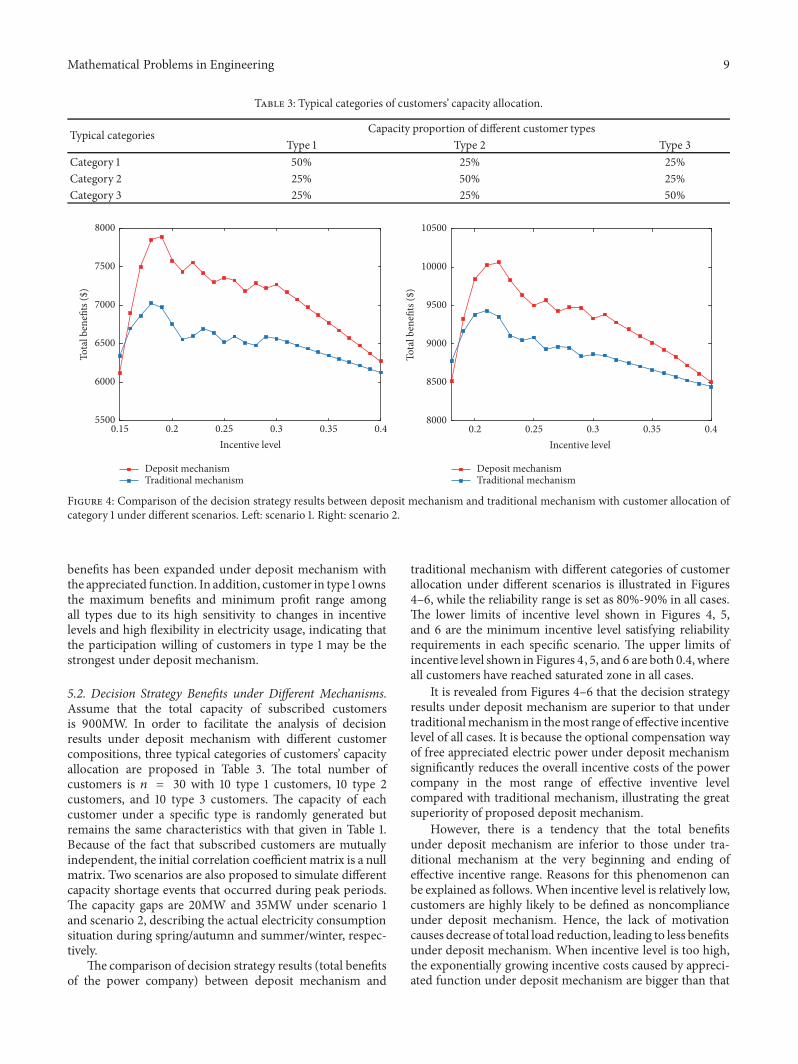
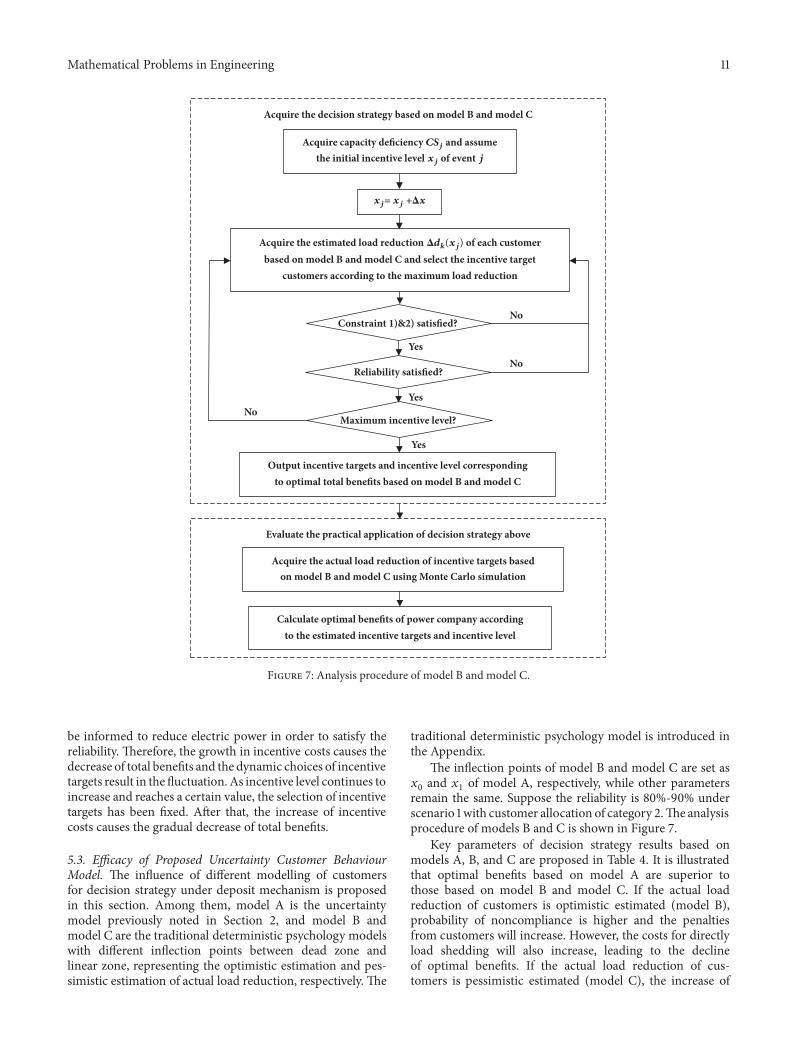
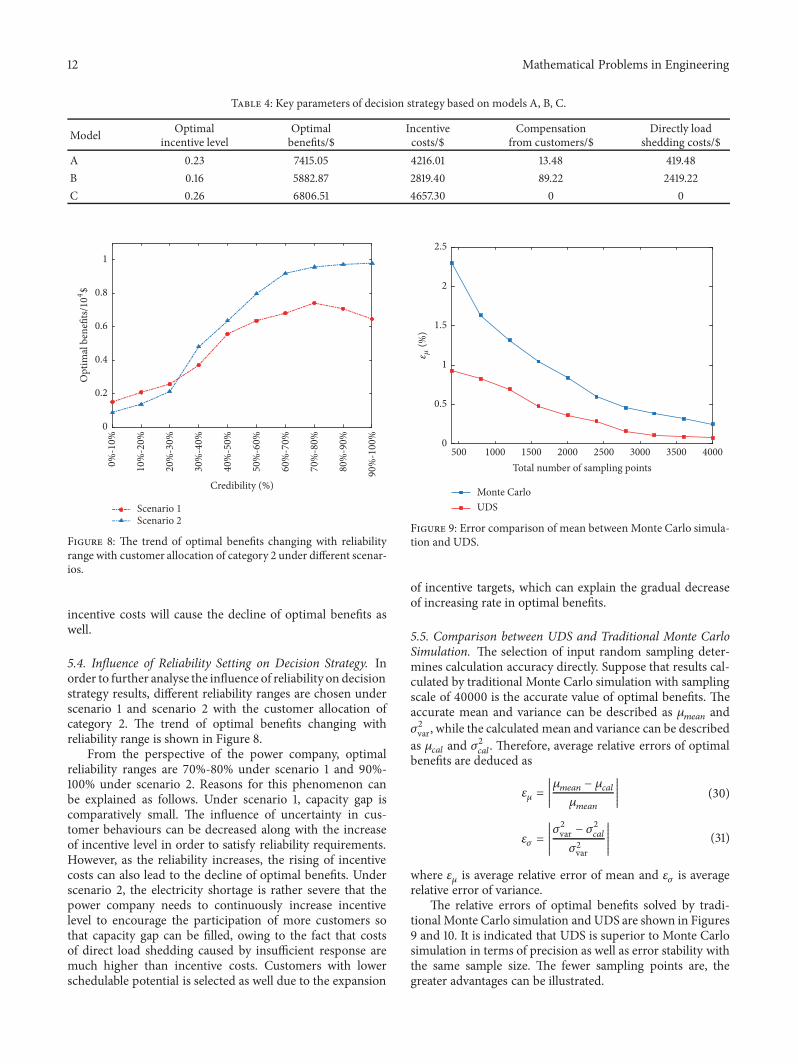
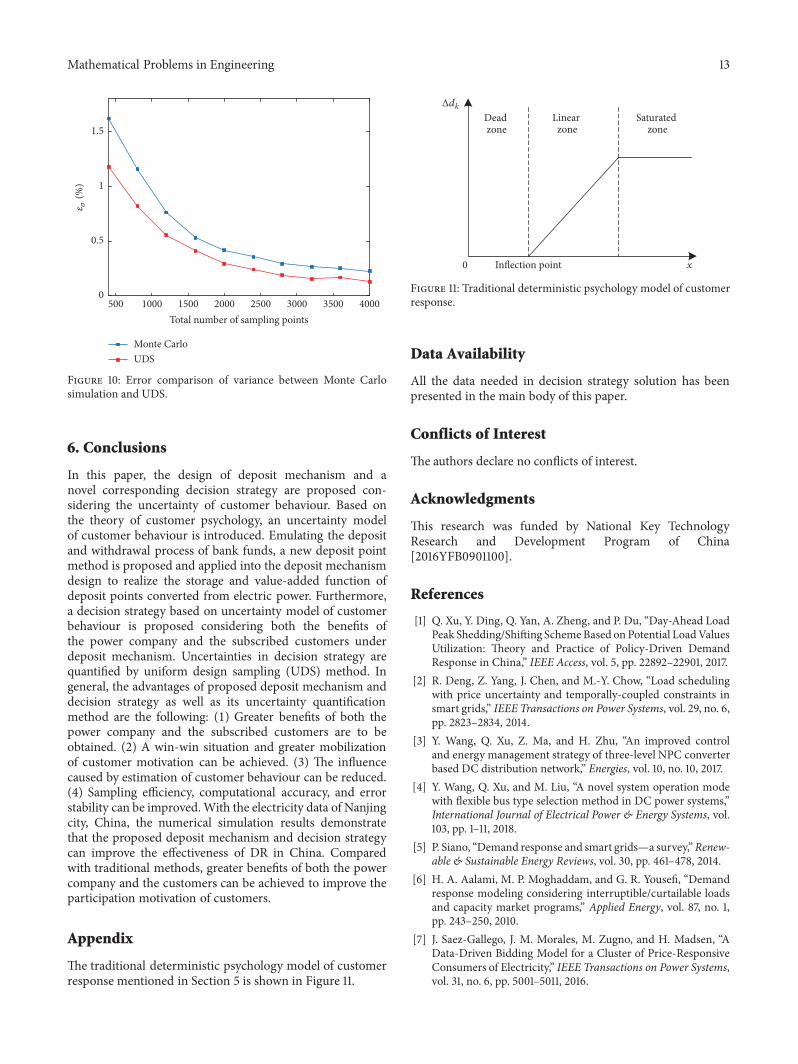

Hindawiwwwhindawicom Volume 2018
MathematicsJournal of
Hindawiwwwhindawicom Volume 2018
Mathematical Problems in Engineering
Applied MathematicsJournal of
Hindawiwwwhindawicom Volume 2018
Probability and StatisticsHindawiwwwhindawicom Volume 2018
Journal of
Hindawiwwwhindawicom Volume 2018
Mathematical PhysicsAdvances in
Complex AnalysisJournal of
Hindawiwwwhindawicom Volume 2018
OptimizationJournal of
Hindawiwwwhindawicom Volume 2018
Hindawiwwwhindawicom Volume 2018
Engineering Mathematics
International Journal of
Hindawiwwwhindawicom Volume 2018
Operations ResearchAdvances in
Journal of
Hindawiwwwhindawicom Volume 2018
Function SpacesAbstract and Applied AnalysisHindawiwwwhindawicom Volume 2018
International Journal of Mathematics and Mathematical Sciences
Hindawiwwwhindawicom Volume 2018
Hindawi Publishing Corporation httpwwwhindawicom Volume 2013Hindawiwwwhindawicom
The Scientific World Journal
Volume 2018
Hindawiwwwhindawicom Volume 2018Volume 2018
Numerical AnalysisNumerical AnalysisNumerical AnalysisNumerical AnalysisNumerical AnalysisNumerical AnalysisNumerical AnalysisNumerical AnalysisNumerical AnalysisNumerical AnalysisNumerical AnalysisNumerical AnalysisAdvances inAdvances in Discrete Dynamics in
Nature and SocietyHindawiwwwhindawicom Volume 2018
Hindawiwwwhindawicom
Dierential EquationsInternational Journal of
Volume 2018
Hindawiwwwhindawicom Volume 2018
Decision SciencesAdvances in
Hindawiwwwhindawicom Volume 2018
AnalysisInternational Journal of
Hindawiwwwhindawicom Volume 2018
Stochastic AnalysisInternational Journal of
Submit your manuscripts atwwwhindawicom