deploying renewables 2011 - international energy agency · promote deployment of renewable energy...
TRANSCRIPT

Best and Future Policy Practice
Rene
wab
le E
nerg
y
DeployingRenewables
Rene
wab
le E
nerg
yRe
new
able
Ene
rgy
MA
RK
ETS &
PO
LIC
IES
2011
Please note that this PDF is subject to specific restrictions that limit its use and distribution. The terms and conditions are available online at www.iea.org/about/copyright.asp

Ren
ewab
le E
ner
gy
Ren
ewab
le E
ner
gy
Ren
ewab
le E
ner
gy
Ren
ewab
le E
ner
gy
MA
RK
ET
S &
PO
LIC
IES Deploying
Renewables2011
(61 2011 27 1P1)
978-92-64-12490-5 €100
-:HSTCQE=VWY^UZ:
The global energy system faces urgent challenges. Concerns about energy security are growing, as highlighted by the recent political turmoil in Northern Africa and the nuclear incident in Fukushima. At the same time, the need to respond to climate change is more critical than ever. Against this background, many governments have increased efforts to promote deployment of renewable energy – low-carbon sources that can strengthen energy security. This has stimulated an unprecedented rise in deployment, and renewables are now the fastest growing sector of the energy mix.
This “coming of age” of renewable energy also brings challenges. Growth is focused on a few of the available technologies, and rapid deployment is confined to a relatively small number of countries. In more advanced markets, managing support costs and system integration of large shares of renewable energy in a time of economic weakness and budget austerity has sparked vigorous political debate.
The new IEA report, Deploying Renewables 2011 – Best and Future Policy Practice:
• provides a comprehensive review and analysis of renewable energy policy and market trends;• analyses in detail the dynamics of deployment and provides best-practice policy principles
for different stages of market maturity;• assesses the impact and cost-effectiveness of support policies using new methodological
tools and indicators;• investigates the strategic reasons underpinning the pursuit of RE deployment by different
countries and the prospects for globalisation of RE.
This new book builds on and extends a 2008 IEA publication, drawing on recent policy and deployment experience world-wide. It provides guidance for policy makers and other stakeholders to avoid past mistakes, overcome new challenges and reap the benefits of deploying renewables – today and tomorrow.

Rene
wab
le E
nerg
yRe
new
able
Ener
gy
Rene
wab
le E
nerg
yRe
new
able
Ene
rgy
Rene
wab
le E
nerg
y
Best and Future Policy Practice
DeployingRenewables
2011
001-30 pages debut AIE RENEWABLES.indd 1001-30 pages debut AIE RENEWABLES.indd 1 09/11/11 10:3509/11/11 10:35

INTERNATTIONAL ENERGY AGENCY
ThThe e InInteternrnationnanaaaal l l Energy Agency (IEA),, an autonomous agency, was establisheded in NoNooooovvvvveveveevevevembmmmbmbmbmbmberererererr 1 11197979 4. Itts s prprimimararyy mam ndddatatataa e e wawass – and is – two-fold: to promote energy securu ity y ammonnngggggsgsgsggsgsgsgsgsttt t ititititttttti s s s s memmmmemeem mbmbm ercocoununtrtrieiees s s tht roough h cocoolllllllececececece titittiveveeveve r r r esese pop nse tto physical disruptions in oil supplply,y, a andnd proovvvvviviividdededd a aaaaaututututhohohohoorirritattatit ve
rereseeararchchch a andnd a ananalylyssiissss s s oononoo w wwwayayayays s s ss tootottoo ee e nsn uure reliable, affordable and cleean enen rgy fffoooooor r itittits s s s 28282828 m mm mmemember counnu trrieies s anand d bebeyoooonndndndndndndndnd. . TThThTT e e e IEIEIEIEA A A A cacac rrrrieies ss ououout a comprehensive programmme e ofo energy ccocoooooooooo-o-o-o-o-o- pepepeppeep rarararararatititititttt ononononon a amomong its mem mber countrrrriiiiiiieeeesess, , eaeaee chchhh o o of f f f wwhwhw icich h isisis ooobbbblblbligigigede to hold oil stocks equivalelentnt to 90 daayyyyyyyyyys s ssss ofofofofofof i i itststss n nnnnnnn nnetetetett i impmpoorts.ThThe e Agene cy’s aimmmmmmmsssss s s inninclclcclududuu e e ththththe e ee fofollllowowwininnngggg gg oobobo jjectives:
SeSecucurere membeer r rrrr ccococcoccc ununununtrtrtt ieieees’s’s’s’ a aaaccccccc esess s toooto rrrreleliaaiabllble e anand ample supplies of aall foforms ofof eneergrgrgrggggggrggrgy;y;yy;y;yy;yy;yy; i i in n n pappapap rtrtrtrticululara ,ththrorougugh h mam inintainiininnnnnni gg g gg g efefee fefectctivivive e ee ememerergegegeeeennccn y y y y rerererespsppsps onononsesese c capabilities in ccasa e ofof oili suppplplllp y dididisrupp itititionono s.s
PrPromomotote e susustainnnnananaaaan blblblblbb e e ee ennennererre gygygygy p p p pololicicieies s ththhataat sspupuur rr ececononnnonoomo ic growth anand d enenviviroronmnmenntatal l prprotecccttitiono inin aa g glolobabal l cocontext t –– – – papapapapp rtrtrtrticicici ululararararlylyly i iiinn nn teteeermrms s ofof r rededucucininnngggg g ggreenhouse-gass e emimissssioionsns tthahat t cocontribubbuutete to cclilimamatete c chah nge.
Immprprp ovove transparrrenncycy oof f ininteteteeeernrnrnatatatatioioioionanananal ll mmmmmaarkets througgh collecctionon a andnd aanalysis s ooff enerrgygyg d ddata a.
SuSupppporort t glglobbal ccccoolo laaboboraratitit onon oooon n eennnerrgygy t tecechnh olologgy to secure e fufututurere e enenergggy y supppplliliesesanand mimititigagatete thheeeeir eenvn ironnmmentnntttaal imppacct,t, i incncluludid ngg thrhrououghgh i impmprovev d ennererggyy
efeffific cieieiencncy y anandd d dedeveveloopmpmenenenennnnnttt t anand d dedeplloyoymeentnt ooff lolow-w-cacarbrbonon technololoogogieiees.s.fifi
FiFindn sololututioioi nsns t to o o glglglglg ooobobalal e enenergrggy y chc alleengnges through eengagagememeenntt anannd d ddidiallogogueue wwwitith h nonon-n-mmmemember ccououuntntririeses,, ininduduststryry, , ininteternrnatattioiioonanal l
ororgaganiisasasatitioonons andd ototheher r ststakakeholded rs.countries:IEA member c
Australia Austria
Belgium Canada
Czech RepublicDenmark
FinlandFrance
GermanyGreece
HungaryIrelandIreland
ItalyJapan
KKorea (Republic of)LLuxembourgNetherlandsNeew ZealandNoorwayPoolandPoortugalSllovak RepublicSSpainSwedenSwitzerlandTurkeyUnited Kingdom
United States
The European Commissionl i i ialso participates inthe work of the IEA.
Please note that this publicationis subject to specifi c restrictionsthat limit its use and distribution.
The terms and conditions are availableonline at www.iea.org/about/copyright.asp
© OECD/IEA, 2011International Energgyy Agency
9 ruee d dee lala Fédératation 775757393 PPaariss C Cedex 15, FFrance
www.iea.org
p2 2011 20x27 Q.INDD 1p2 2p2 2p2 2p2 2011011011011 20 220x220x220 220x220x27 Q7 Q7 Q7 Q7 Q7 Q INDDINDDINDDINDDINDDINDD 111111ppp QQQQQQQ0000000000ppp 777772222222xxxxx2222211111111112222222222 xx2x2x2x2ppp Q7 QQ7 QQpp22 22001111 2220000x2x222777 QQQ DDDDDDDDDDDDDDNNNNNNNIIIIIII DDDDDDNNDNDNNDND.IIINNNDDDDDD 1111111111 10/10/11 13:2810/110/110/110/10/110/110/110/11 111133:2833:28110/0///110/0///1111 1133:28001-30 pages debut AIE RENEWABLES.indd 2001-30 pages debut AIE RENEWABLES.indd 2 09/11/11 10:3509/11/11 10:35
3
Foreword
3:2833:2833:2833:28
Global energy markets face unprecedented uncertainty and price volatility as supply and demand patterns change. Concerns about energy security are increasing across a broad range of energy carriers, including gas, coal and electricity as well as oil. The need to respond to global climate change is more urgent than ever. The IEA is convinced that renewable energy, along with energy efficiency, nuclear energy, and carbon capture and storage, has a key role to play in meeting these challenges.
The markets for renewable energy – electricity, heat and transport fuels – have been growing sharply over the last five years. Deployment of established technologies, like hydro, and newer technologies such as wind and solar photovoltaics, has risen quickly. This growth has increased confidence in the technologies, reduced costs and opened up new opportunities – particularly in emerging and developing countries, where the need for energy is strong and the renewable resources are favourable.
Given the rapid developments over the last five years, the IEA decided that it was time to follow up on its 2008 publication, Deploying Renewables: Principles for Effective Policies. The 2011 publication uses new methodological tools to provide a comprehensive review and analysis of current market deployment and policy trends, and extends the geographical coverage to cover regions round the globe. It assesses quantitatively the impact that policies are having on deployment in the electricity sector and extends the work on indicators for cost-effectiveness and total policy costs. Analysing the policy priorities that apply as deployment levels grow, it identifies key principles for policy best practice and provides recommendations for their implementation.
This review of the accumulated body of policy making experience provides guidance on how policy packages can have the largest impact at the lowest cost, while helping policy makers to avoid possible pitfalls. It should help with the challenges of controlling total policy spending, and also enable countries to move more quickly in establishing appropriate portfolios of renewable technologies as integral parts of their secure and sustainable energy mixes.
Maria van der HoevenExecutive Director
International Energy Agency
Foreword
001-30 pages debut AIE RENEWABLES.indd 3001-30 pages debut AIE RENEWABLES.indd 3 09/11/11 10:3509/11/11 10:35
© O
EC
D/IE
A, 2
011

001-30 pages debut AIE RENEWABLES.indd 4001-30 pages debut AIE RENEWABLES.indd 4 09/11/11 10:3609/11/11 10:36
© O
EC
D/IE
A, 2
011
Acknowledgements
5
Adam Brown and Simon Müller from the Renewable Energy Division at the International Energy Agency are the lead authors of this publication and managed the project to completion. Samantha Ölz managed and coordinated the earlier stages of the work and the studies that have fed into the analysis; she also co-authored earlier drafts of the publication. The book has benefitted from extensive contributions from colleagues in the Renewable Energy Division, led by Paolo Frankl, who supervised the project. Critical contributions were made by colleagues Milou Beerepoot, Hugo Chandler, Zuzana Dobrotková, Anselm Eisentraut, Carlos Gasco, Ada Marmion, Sara Moarif and Cédric Philibert.
Didier Houssin, Director of the IEA Energy and Markets and Security Directorate, provided valuable guidance and support throughout the project. Bo Diczfalusy, Director of the Energy Policy and Technology Directorate also provided most helpful review comments.
This work was guided by the IEA Working Party on Renewable Energy Technologies (REWP) which provided continuous support, especially from Hans Jorgen Koch (Chair, Denmark), Roberto Vigotti (former Chair, Italy), Martin Schöpe (Germany), Willem van der Heul (the Netherlands), Linda Silverman (United States) and Andreas Indinger (Austria). All renewable energy Implementing Agreements gave invaluable inputs with substantial technical advice and market data.
The IEA gratefully acknowledges the crucial financial support of the German Federal Ministry for the Environment, Nature Conservation and Nuclear Safety (BMU), the Japanese New Energy and Industrial Technology Development Organisation (NEDO) and Enel S.p.A., as well as the European Commission (through its long-time support of the IEA’s Renewable Energy Policies and Measures Database) for this project.
The manuscript was skilfully edited by Jonas Weisel.
Many thanks to the IEA colleagues in the Communications and Information Office, in particular Rebecca Gaghen, Muriel Custodio, Marilyn Smith, Jane Barbière, Astrid Dumond, Cheryl Haynes and Corinne Hayworth who assisted in the production and distribution of this book, added to the quality of the final product and ensured its swift completion.
We would also like to thank the many experts who provided helpful and very constructive guidance by commenting on the various drafts of the book and associated working papers that were circulated during its preparation. The final text has benefited hugely from these suggestions.
This book is complemented by four information and working papers which provide more detailed information and analysis. These are:
• Deploying Renewables in Southeast Asia, IEA Working Paper, Samantha Ölz and Milou Beerepoot;
• Renewable Energy: Markets and Prospects by Technology, IEA Information Paper, Adam Brown, Simon Müller and Zuzana Dobrotková;
Acknowledgements
001-30 pages debut AIE RENEWABLES.indd 5001-30 pages debut AIE RENEWABLES.indd 5 09/11/11 10:3609/11/11 10:36
© O
EC
D/IE
A, 2
011

6
Acknowledgements
• Renewable Energy: Markets and Prospects by Region, IEA Information Paper, Simon Müller, Ada Marmion and Milou Beerepoot;
• Renewable Energy: Policy Considerations for Deploying Renewables, IEA Information Paper, Simon Müller, Adam Brown and Samantha Ölz.
A number of trainees and interns provided helpful data and extensive analysis for the book and the information papers, including Lauren Culver, Silvia D’Ovidio, Christian Friebe, Charlotte Grosse Wiesmann, Melisande Liu and Asuka Sato, and we gratefully acknowledge their contributions.
Questions and comments should be addressed to:
Adam Brown or Simon MüllerInternational Energy Agency9, rue de la Fédération75739 Paris Cedex 15FRANCE
Email: [email protected] or [email protected]
001-30 pages debut AIE RENEWABLES.indd 6001-30 pages debut AIE RENEWABLES.indd 6 09/11/11 10:3609/11/11 10:36
© O
EC
D/IE
A, 2
011

Table of contents
7
Table of Contents
Foreword . . . . . . . . . . . . . . . . . . . . . . . . . . . . . . . . . . . . . . . . . . . . . . . 3
Acknowledgements . . . . . . . . . . . . . . . . . . . . . . . . . . . . . . . . . . . . . . . 5
Executive Summary . . . . . . . . . . . . . . . . . . . . . . . . . . . . . . . . . . . . . . . 15
Background . . . . . . . . . . . . . . . . . . . . . . . . . . . . . . . . . . . . . . . . . . . . . 15
Market developments . . . . . . . . . . . . . . . . . . . . . . . . . . . . . . . . . . . . . . 15
RE competitiveness and economic support . . . . . . . . . . . . . . . . . . . . . . 17Policy indicators . . . . . . . . . . . . . . . . . . . . . . . . . . . . . . . . . . . . . . . . . . . . . . . . . . . . . 18Policy principles and priorities . . . . . . . . . . . . . . . . . . . . . . . . . . . . . . . . . . . . . . . . . . 21Key challenges . . . . . . . . . . . . . . . . . . . . . . . . . . . . . . . . . . . . . . . . . . . . . . . . . . . . . . 27
Recommendations . . . . . . . . . . . . . . . . . . . . . . . . . . . . . . . . . . . . . . . . 29
Chapter 1 Introduction . . . . . . . . . . . . . . . . . . . . . . . . . . . . . . . . . . . . 31
Background . . . . . . . . . . . . . . . . . . . . . . . . . . . . . . . . . . . . . . . . . . . . . 31
Context . . . . . . . . . . . . . . . . . . . . . . . . . . . . . . . . . . . . . . . . . . . . . . . . . 32
Progress . . . . . . . . . . . . . . . . . . . . . . . . . . . . . . . . . . . . . . . . . . . . . . . . 32
Novel challenges . . . . . . . . . . . . . . . . . . . . . . . . . . . . . . . . . . . . . . . . . 32
This publication . . . . . . . . . . . . . . . . . . . . . . . . . . . . . . . . . . . . . . . . . . 33
Chapter 2 Market Development for RE Technologies . . . . . . . . . . . . . . 35
Technology portfolio . . . . . . . . . . . . . . . . . . . . . . . . . . . . . . . . . . . . . . 35
Deployment and cost trends: electricity . . . . . . . . . . . . . . . . . . . . . . . . 36General deployment trends . . . . . . . . . . . . . . . . . . . . . . . . . . . . . . . . . . . . . . . . . . . . 36Regional deployment trends . . . . . . . . . . . . . . . . . . . . . . . . . . . . . . . . . . . . . . . . . . . . 38Cost trends and scope for improvement . . . . . . . . . . . . . . . . . . . . . . . . . . . . . . . . . . . 42
Deployment and cost trends: heat . . . . . . . . . . . . . . . . . . . . . . . . . . . . 49General and regional deployment trends . . . . . . . . . . . . . . . . . . . . . . . . . . . . . . . . . . 49Cost trends and scope for improvement . . . . . . . . . . . . . . . . . . . . . . . . . . . . . . . . . . . 50
Deployment and cost trends: transport . . . . . . . . . . . . . . . . . . . . . . . . . 51General and regional deployment trends . . . . . . . . . . . . . . . . . . . . . . . . . . . . . . . . . . 51Cost trends and scope for improvement . . . . . . . . . . . . . . . . . . . . . . . . . . . . . . . . . . . 53
Recent global investment trends . . . . . . . . . . . . . . . . . . . . . . . . . . . . . . 55
Current trends and the IEA WEO 450 Scenario . . . . . . . . . . . . . . . . . . 55
001-30 pages debut AIE RENEWABLES.indd 7001-30 pages debut AIE RENEWABLES.indd 7 09/11/11 10:3609/11/11 10:36
© O
EC
D/IE
A, 2
011
Table of contents
8
RE technologies within the WEO 2010 450 Scenario . . . . . . . . . . . . . . . . . . . . . . . . . 56Electricity . . . . . . . . . . . . . . . . . . . . . . . . . . . . . . . . . . . . . . . . . . . . . . . . . . . . . . . . . . 57Heat . . . . . . . . . . . . . . . . . . . . . . . . . . . . . . . . . . . . . . . . . . . . . . . . . . . . . . . . . . . . . . 60Transport . . . . . . . . . . . . . . . . . . . . . . . . . . . . . . . . . . . . . . . . . . . . . . . . . . . . . . . . . . 60
Opportunities for expanding deployment . . . . . . . . . . . . . . . . . . . . . . . 61
Key challenges . . . . . . . . . . . . . . . . . . . . . . . . . . . . . . . . . . . . . . . . . . . 61Electricity . . . . . . . . . . . . . . . . . . . . . . . . . . . . . . . . . . . . . . . . . . . . . . . . . . . . . . . . . . 61Heat . . . . . . . . . . . . . . . . . . . . . . . . . . . . . . . . . . . . . . . . . . . . . . . . . . . . . . . . . . . . . . 62Transport . . . . . . . . . . . . . . . . . . . . . . . . . . . . . . . . . . . . . . . . . . . . . . . . . . . . . . . . . . 62
Priorities . . . . . . . . . . . . . . . . . . . . . . . . . . . . . . . . . . . . . . . . . . . . . . . . 63
Chapter 3 Policies for Deploying Renewables . . . . . . . . . . . . . . . . . . . 65
Introduction . . . . . . . . . . . . . . . . . . . . . . . . . . . . . . . . . . . . . . . . . . . . . 65
Renewable energy: drivers and benefits . . . . . . . . . . . . . . . . . . . . . . . . 66Energy security . . . . . . . . . . . . . . . . . . . . . . . . . . . . . . . . . . . . . . . . . . . . . . . . . . . . . . 66Reduction of CO2 emissions and environmental impacts . . . . . . . . . . . . . . . . . . . . . . 67Economic development . . . . . . . . . . . . . . . . . . . . . . . . . . . . . . . . . . . . . . . . . . . . . . . 68Innovation and industrial development . . . . . . . . . . . . . . . . . . . . . . . . . . . . . . . . . . . 67Mapping policy drivers: the energy security/GDP matrix . . . . . . . . . . . . . . . . . . . . . . 71
Barriers to RE technology deployment . . . . . . . . . . . . . . . . . . . . . . . . . 74Economic barriers . . . . . . . . . . . . . . . . . . . . . . . . . . . . . . . . . . . . . . . . . . . . . . . . . . . 74Non-economic barriers . . . . . . . . . . . . . . . . . . . . . . . . . . . . . . . . . . . . . . . . . . . . . . . 74Barriers in the electricity sector . . . . . . . . . . . . . . . . . . . . . . . . . . . . . . . . . . . . . . . . . 75Barriers in the heat sector . . . . . . . . . . . . . . . . . . . . . . . . . . . . . . . . . . . . . . . . . . . . . . 76Barriers in the transport sector . . . . . . . . . . . . . . . . . . . . . . . . . . . . . . . . . . . . . . . . . . 77
Tackling economic barriers to deployment . . . . . . . . . . . . . . . . . . . . . . 77Why provide economic support for technologies? . . . . . . . . . . . . . . . . . . . . . . . . . . . 77Objectives of economic support policies . . . . . . . . . . . . . . . . . . . . . . . . . . . . . . . . . . 79Support policy options for the electricity sector . . . . . . . . . . . . . . . . . . . . . . . . . . . . . 79Support policy options for the heat sector . . . . . . . . . . . . . . . . . . . . . . . . . . . . . . . . . 85Support policy options for the transport sector . . . . . . . . . . . . . . . . . . . . . . . . . . . . . . 88
Tackling non-economic barriers . . . . . . . . . . . . . . . . . . . . . . . . . . . . . . 89The price of policy risks: empirical evidence . . . . . . . . . . . . . . . . . . . . . . . . . . . . . . . 94
The deployment journey . . . . . . . . . . . . . . . . . . . . . . . . . . . . . . . . . . . . 95Stages on the journey . . . . . . . . . . . . . . . . . . . . . . . . . . . . . . . . . . . . . . . . . . . . . . . . . 97Developing a national market . . . . . . . . . . . . . . . . . . . . . . . . . . . . . . . . . . . . . . . . . . 99Overarching policy requirements . . . . . . . . . . . . . . . . . . . . . . . . . . . . . . . . . . . . . . . . 100Market inception . . . . . . . . . . . . . . . . . . . . . . . . . . . . . . . . . . . . . . . . . . . . . . . . . . . . 101Take-off . . . . . . . . . . . . . . . . . . . . . . . . . . . . . . . . . . . . . . . . . . . . . . . . . . . . . . . . . . . 102
001-30 pages debut AIE RENEWABLES.indd 8001-30 pages debut AIE RENEWABLES.indd 8 09/11/11 10:3609/11/11 10:36
© O
EC
D/IE
A, 2
011
Table of contents
9
Market consolidation . . . . . . . . . . . . . . . . . . . . . . . . . . . . . . . . . . . . . . . . . . . . . . . . . 104
Market design . . . . . . . . . . . . . . . . . . . . . . . . . . . . . . . . . . . . . . . . . . . . . . . . . . . . . . . 105
Chapter 4 Economic Support Policies for Electricity: Impact and Cost-Effectiveness Indicators . . . . . . . . . . . . . . 107
Methodological approach. . . . . . . . . . . . . . . . . . . . . . . . . . . . . . . . . . . 108Regional and technology coverage . . . . . . . . . . . . . . . . . . . . . . . . . . . . . . . . . . . . . . . 108
Policy impact indicator (PII) . . . . . . . . . . . . . . . . . . . . . . . . . . . . . . . . . . . . . . . . . . . . 108
Remuneration adequacy indicator (RAI) . . . . . . . . . . . . . . . . . . . . . . . . . . . . . . . . . . . 111
Total cost indicator (TCI) . . . . . . . . . . . . . . . . . . . . . . . . . . . . . . . . . . . . . . . . . . . . . . 114
Indicator analysis for onshore wind . . . . . . . . . . . . . . . . . . . . . . . . . . . 115Policy impact indicator . . . . . . . . . . . . . . . . . . . . . . . . . . . . . . . . . . . . . . . . . . . . . . . . 115
Remuneration adequacy indicator . . . . . . . . . . . . . . . . . . . . . . . . . . . . . . . . . . . . . . . 116
Remuneration adequacy versus impact analysis . . . . . . . . . . . . . . . . . . . . . . . . . . . . . 117
Total cost indicator . . . . . . . . . . . . . . . . . . . . . . . . . . . . . . . . . . . . . . . . . . . . . . . . . . . 121
Indicator analysis for solar PV . . . . . . . . . . . . . . . . . . . . . . . . . . . . . . . 121Policy impact indicator . . . . . . . . . . . . . . . . . . . . . . . . . . . . . . . . . . . . . . . . . . . . . . . . 121
Remuneration adequacy indicator . . . . . . . . . . . . . . . . . . . . . . . . . . . . . . . . . . . . . . . 124
Remuneration adequacy versus impact analysis . . . . . . . . . . . . . . . . . . . . . . . . . . . . . 124
Total cost indicator . . . . . . . . . . . . . . . . . . . . . . . . . . . . . . . . . . . . . . . . . . . . . . . . . . . 127
Conclusions about electricity support policy tools . . . . . . . . . . . . . . . . 130
Chapter 5 Going Global . . . . . . . . . . . . . . . . . . . . . . . . . . . . . . . . . . . . 133
Market trends . . . . . . . . . . . . . . . . . . . . . . . . . . . . . . . . . . . . . . . . . . . . 134Renewable electricity . . . . . . . . . . . . . . . . . . . . . . . . . . . . . . . . . . . . . . . . . . . . . . . . . 134
Renewable heat . . . . . . . . . . . . . . . . . . . . . . . . . . . . . . . . . . . . . . . . . . . . . . . . . . . . . 138
Renewable transport . . . . . . . . . . . . . . . . . . . . . . . . . . . . . . . . . . . . . . . . . . . . . . . . . . 140
Regional investment trends . . . . . . . . . . . . . . . . . . . . . . . . . . . . . . . . . . 142
Policies . . . . . . . . . . . . . . . . . . . . . . . . . . . . . . . . . . . . . . . . . . . . . . . . . 143General trends . . . . . . . . . . . . . . . . . . . . . . . . . . . . . . . . . . . . . . . . . . . . . . . . . . . . . . 143
Policy developments by region . . . . . . . . . . . . . . . . . . . . . . . . . . . . . . . . . . . . . . . . . . 146
Accelerating deployment in a broader range of countries . . . . . . . . . . . 155
Role of international cooperation . . . . . . . . . . . . . . . . . . . . . . . . . . . . . 158Sharing costs . . . . . . . . . . . . . . . . . . . . . . . . . . . . . . . . . . . . . . . . . . . . . . . . . . . . . . . 158
Sharing experience . . . . . . . . . . . . . . . . . . . . . . . . . . . . . . . . . . . . . . . . . . . . . . . . . . . 159
Facilitating global deployment expansion . . . . . . . . . . . . . . . . . . . . . . . . . . . . . . . . . . 159
001-30 pages debut AIE RENEWABLES.indd 9001-30 pages debut AIE RENEWABLES.indd 9 09/11/11 10:3609/11/11 10:36
© O
EC
D/IE
A, 2
011

Table of contents
10
Chapter 6 Conclusions and Recommendations . . . . . . . . . . . . . . . . . . 161
Market developments . . . . . . . . . . . . . . . . . . . . . . . . . . . . . . . . . . . . . . 161
RE competitiveness and economic support . . . . . . . . . . . . . . . . . . . . . . 161
Policy indicators . . . . . . . . . . . . . . . . . . . . . . . . . . . . . . . . . . . . . . . . . . 162
Policy principles and priorities . . . . . . . . . . . . . . . . . . . . . . . . . . . . . . . 162Inception . . . . . . . . . . . . . . . . . . . . . . . . . . . . . . . . . . . . . . . . . . . . . . . . . . . . . . . . . . 164Take-off . . . . . . . . . . . . . . . . . . . . . . . . . . . . . . . . . . . . . . . . . . . . . . . . . . . . . . . . . . . 164Consolidation . . . . . . . . . . . . . . . . . . . . . . . . . . . . . . . . . . . . . . . . . . . . . . . . . . . . . . . 165
Key challenges . . . . . . . . . . . . . . . . . . . . . . . . . . . . . . . . . . . . . . . . . . . 167Electricity . . . . . . . . . . . . . . . . . . . . . . . . . . . . . . . . . . . . . . . . . . . . . . . . . . . . . . . . . . 167Heat . . . . . . . . . . . . . . . . . . . . . . . . . . . . . . . . . . . . . . . . . . . . . . . . . . . . . . . . . . . . . . 167Transport . . . . . . . . . . . . . . . . . . . . . . . . . . . . . . . . . . . . . . . . . . . . . . . . . . . . . . . . . . 167
Recommendations . . . . . . . . . . . . . . . . . . . . . . . . . . . . . . . . . . . . . . . . 168
Annex A Definitions, abbreviations, acronyms and units . . . . . . . . . . . 171
Annex B References . . . . . . . . . . . . . . . . . . . . . . . . . . . . . . . . . . . . . . . 177
List of Figures
Executive summary
Figure E.1 • Regional trends in non-hydro power generation, 2000-09 . . . . . . . 16Figure E.2 • Factors influencing RE competitiveness and the role of policies . . . 17Figure E.3 • Cost-effectiveness and policy impact indicators for onshore
wind support policies, 2008/09. . . . . . . . . . . . . . . . . . . . . . . . . . . . 19Figure E.4 • Total cost of policy support in major PV markets, 2010 . . . . . . . . . 20Figure E.5 • Deployment journey . . . . . . . . . . . . . . . . . . . . . . . . . . . . . . . . . . . . 22Figure E.6 • Expanding RE deployment . . . . . . . . . . . . . . . . . . . . . . . . . . . . . . . 28
Chapter 2
Figure 2.1 • Selected RE sources and technologies . . . . . . . . . . . . . . . . . . . . . . . 35Figure 2.2 • Growth in global power generation from renewable sources,
2000-09 . . . . . . . . . . . . . . . . . . . . . . . . . . . . . . . . . . . . . . . . . . . . . 37Figure 2.3 • Growth in global power generation from non-hydro RE sources,
2000-09 . . . . . . . . . . . . . . . . . . . . . . . . . . . . . . . . . . . . . . . . . . . . . 37Figure 2.4 • Regional trends in non-hydro power generation, 2000-09 . . . . . . . 38Figure 2.5 • Developments in hydro power generation, 2000-09 . . . . . . . . . . . . 39Figure 2.6 • Global hydropower projects under construction, additional cumulative
capacity by year of expected commissioning . . . . . . . . . . . . . . . . . 39Figure 2.7 • Evolution of wind installed capacity (including offshore), 2000-10 40
001-30 pages debut AIE RENEWABLES.indd 10001-30 pages debut AIE RENEWABLES.indd 10 09/11/11 10:3609/11/11 10:36
© O
EC
D/IE
A, 2
011
Table of contents
11
Figure 2.8 • Global bioenergy power production, 2000-09 . . . . . . . . . . . . . . . . 41Figure 2.9 • Global installed PV capacity, 2005-10 . . . . . . . . . . . . . . . . . . . . . . 42Figure 2.10 • Evolution of market shares in PV module production, 2009
and 2010 . . . . . . . . . . . . . . . . . . . . . . . . . . . . . . . . . . . . . . . . . . . . 43Figure 2.11 • Electricity generation from geothermal energy, 2000-09 . . . . . . . . . 43Figure 2.12 • Investment costs of Danish onshore wind projects and global
average full load hours . . . . . . . . . . . . . . . . . . . . . . . . . . . . . . . . . . 45Figure 2.13 • Cost degression of solar PV modules, 1976-2010 . . . . . . . . . . . . . . 47Figure 2.14 • Bioenergy usage for heat, 2000-09 . . . . . . . . . . . . . . . . . . . . . . . . . 49Figure 2.15 • Non-bioenergy usage for heat, 2000-09 . . . . . . . . . . . . . . . . . . . . . 50Figure 2.16 • Installed solar water heater capacity, 2000-09 . . . . . . . . . . . . . . . . 50Figure 2.17 • Development of biofuels markets, 2000-09 . . . . . . . . . . . . . . . . . . 52Figure 2.18 • Projected costs of biofuels compared to petroleum gasoline,
2010-50 . . . . . . . . . . . . . . . . . . . . . . . . . . . . . . . . . . . . . . . . . . . . . 54Figure 2.19 • Global new investments in renewable energy, 2004-10,
billion USD . . . . . . . . . . . . . . . . . . . . . . . . . . . . . . . . . . . . . . . . . . . 55Figure 2.20 • Shares of RE technologies in each sector in 2035
according to WEO 2010 scenarios . . . . . . . . . . . . . . . . . . . . . . . . . 56Figure 2.21 • Renewable power generation 2000-09
and WEO 450 projection for 2020 . . . . . . . . . . . . . . . . . . . . . . . . . 58Figure 2.22 • Achieved versus required growth rates of RE technologies . . . . . . . 59Figure 2.23 • Biofuels production 2000-09 and WEO 450 projection for 2020 . . 60
Chapter 3
Figure 3.1 • Regional shares in attributed CO2 savings in 2008 . . . . . . . . . . . . . 67Figure 3.2 • Typology of country clusters by strategic policy drivers . . . . . . . . . . 72Figure 3.3 • Changes in percentage share of RE technologies
in power generation, 1990-2009 . . . . . . . . . . . . . . . . . . . . . . . . . . . 72Figure 3.4 • Changes in biofuels share, 1990-2009 . . . . . . . . . . . . . . . . . . . . . . 73Figure 3.5 • Barriers to RE technology deployment. . . . . . . . . . . . . . . . . . . . . . . 74Figure 3.6 • Different dimensions of RE technology competitiveness . . . . . . . . . 78Figure 3.7 • Duration for developing small-scale roof-top PV projects
in selected EU countries . . . . . . . . . . . . . . . . . . . . . . . . . . . . . . . . . 91Figure 3.8 • Investors' implicit willingness-to-accept certain policy risks for wind
energy investments . . . . . . . . . . . . . . . . . . . . . . . . . . . . . . . . . . . . . 94Figure 3.9 • Wind power diffusion in Denmark and the world, 1980-2008 . . . . 95Figure 3.10 • Deployment journey . . . . . . . . . . . . . . . . . . . . . . . . . . . . . . . . . . . . 98Figure 3.11 • Maturity of selected RE technologies . . . . . . . . . . . . . . . . . . . . . . . . 99Figure 3.12 • Flexibility Assessment Tool (FAST) . . . . . . . . . . . . . . . . . . . . . . . . . . 105
Chapter 4
Figure 4.1 • Illustration of the policy impact indicator (PII) . . . . . . . . . . . . . . . . . 109Figure 4.2 • Calculation of the remuneration adequacy indicator (RAI) . . . . . . . 113
001-30 pages debut AIE RENEWABLES.indd 11001-30 pages debut AIE RENEWABLES.indd 11 09/11/11 10:3609/11/11 10:36
© O
EC
D/IE
A, 2
011

Table of contents
12
Figure 4.3 • PII of wind support policies in OECD and BRICS countries, 2001-09 . . . . . . . . . . . . . . . . . . . . . . . . . . . . . . . . . . . . . . . . . . . . . 116
Figure 4.4 • RAI for onshore wind support policies in OECD and BRICS countries, 2008/09 . . . . . . . . . . . . . . . . . . . . . . . . . . . . 117
Figure 4.5 • RAI vs. PII for onshore wind support policies, 2008/09 . . . . . . . . . . 118Figure 4.6 • Total cost indicator for onshore wind, 2009 . . . . . . . . . . . . . . . . . . 120Figure 4.7 • PII of solar PV support policies in OECD and BRICS, 2001-09 . . . . 122Figure 4.8 • PII of solar PV support policies in selected OECD
and BRICS, 2001-10 . . . . . . . . . . . . . . . . . . . . . . . . . . . . . . . . . . . . 123Figure 4.9 • RAI of solar PV support polices in OECD and BRICS countries,
2008/09 . . . . . . . . . . . . . . . . . . . . . . . . . . . . . . . . . . . . . . . . . . . . . 124Figure 4.10 • PII and RAI of solar PV support policies in selected OECD and BRICS
countries . . . . . . . . . . . . . . . . . . . . . . . . . . . . . . . . . . . . . . . . . . . . . 125Figure 4.11 • Total cost indicator for solar PV in major markets, 2010 . . . . . . . . . 127Figure 4.12 • Spot market prices for solar-grade polysilicon and evolution
of German PV system retail prices . . . . . . . . . . . . . . . . . . . . . . . . . 130
Chapter 5
Figure 5.1 • Segmentation of renewable electricity production by region, with and without hydro power, 2009 . . . . . . . . . . . . . . . . . . . . . . . . . . . 135
Figure 5.2 • Non-hydro renewable electricity market share by country, 2009 . . 130Figure 5.3 • Financial new investment in renewable energy, 2004-10,
billion USD . . . . . . . . . . . . . . . . . . . . . . . . . . . . . . . . . . . . . . . . . . . 142Figure 5.4 • Expanding deployment to all clusters . . . . . . . . . . . . . . . . . . . . . . . 156
List of Tables
Executive summary
Table E.1 • Best practice policy principles . . . . . . . . . . . . . . . . . . . . . . . . . . . . . . . 23
Chapter 2
Table 2.1 • Power generation and growth rates (CAGR), 2000-09 . . . . . . . . . . . . . . 36Table 2.2 • 2009 renewables generation and WEO 450 Scenario targets
in 2020, 2030 and 2035 . . . . . . . . . . . . . . . . . . . . . . . . . . . . . . . . . . . . 56Table 2.3 • Necessary growth rates to meet 2020 WEO target . . . . . . . . . . . . . . . . 57Table 2.4 • Current status and priorities for the three energy sectors . . . . . . . . . . . . 64
Chapter 3
Table 3.1 • Savings in CO2 emissions between the no-RE scenario and the WEO 450 Scenario in 2030 . . . . . . . . . . . . . . . . . . . . . . . . . . . 69
Table 3.2 • Barriers to heat and renewable heat deployment . . . . . . . . . . . . . . . . . 76Table 3.3 • Characteristics of electricity support mechanisms . . . . . . . . . . . . . . . . . 85Table 3.4 • Comparison of RE technologies: status, scale,
global production and costs . . . . . . . . . . . . . . . . . . . . . . . . . . . . . . . . . 96
001-30 pages debut AIE RENEWABLES.indd 12001-30 pages debut AIE RENEWABLES.indd 12 09/11/11 10:3609/11/11 10:36
© O
EC
D/IE
A, 2
011
Table of contents
13
Chapter 4
Table 4.1 • Overview of alternative indicators of policy impact . . . . . . . . . . . . . . 108Table 4.2 • Assumptions for calculating reference intervals for RAI values . . . . . . 113Table 4.3 • Statistical analysis of wind energy support policy types . . . . . . . . . . . 115Table 4.4 • Normalised remuneration levels per MWh (2009)
and PII results (2008/09) for wind power . . . . . . . . . . . . . . . . . . . . . . 119Table 4.5 • Statistical analysis of solar PV energy support policy types . . . . . . . . . 123Table 4.6 • Normalised remuneration levels (2009)
and PII (2008/09) for solar PV . . . . . . . . . . . . . . . . . . . . . . . . . . . . . . . 126
Chapter 5
Table 5.1 • Regional grouping of studied countries . . . . . . . . . . . . . . . . . . . . . . . . 133Table 5.2 • Distributed capacity investments by country, 2010, billion USD . . . . . 143Table 5.3 • Renewable electricity generation targets, 2005 and 2010 . . . . . . . . . . 144Table 5.4 • Policy measures to stimulate take-up of biofuels . . . . . . . . . . . . . . . . . 145Table 5.5 • Development of the main policy support instruments
in OECD countries . . . . . . . . . . . . . . . . . . . . . . . . . . . . . . . . . . . . . . . 147Table 5.6 • Regional overview of policies targeting renewable heat . . . . . . . . . . . 150Table 5.7 • Regional overview of policies targeting renewable electricity
in BRICS . . . . . . . . . . . . . . . . . . . . . . . . . . . . . . . . . . . . . . . . . . . . . . . 151
Chapter 6
Table 6.1 • Best practice policy principles . . . . . . . . . . . . . . . . . . . . . . . . . . . . . . 163
001-30 pages debut AIE RENEWABLES.indd 13001-30 pages debut AIE RENEWABLES.indd 13 09/11/11 10:3609/11/11 10:36
© O
EC
D/IE
A, 2
011

001-30 pages debut AIE RENEWABLES.indd 14001-30 pages debut AIE RENEWABLES.indd 14 09/11/11 10:3609/11/11 10:36
© O
EC
D/IE
A, 2
011
Executive Summary
15
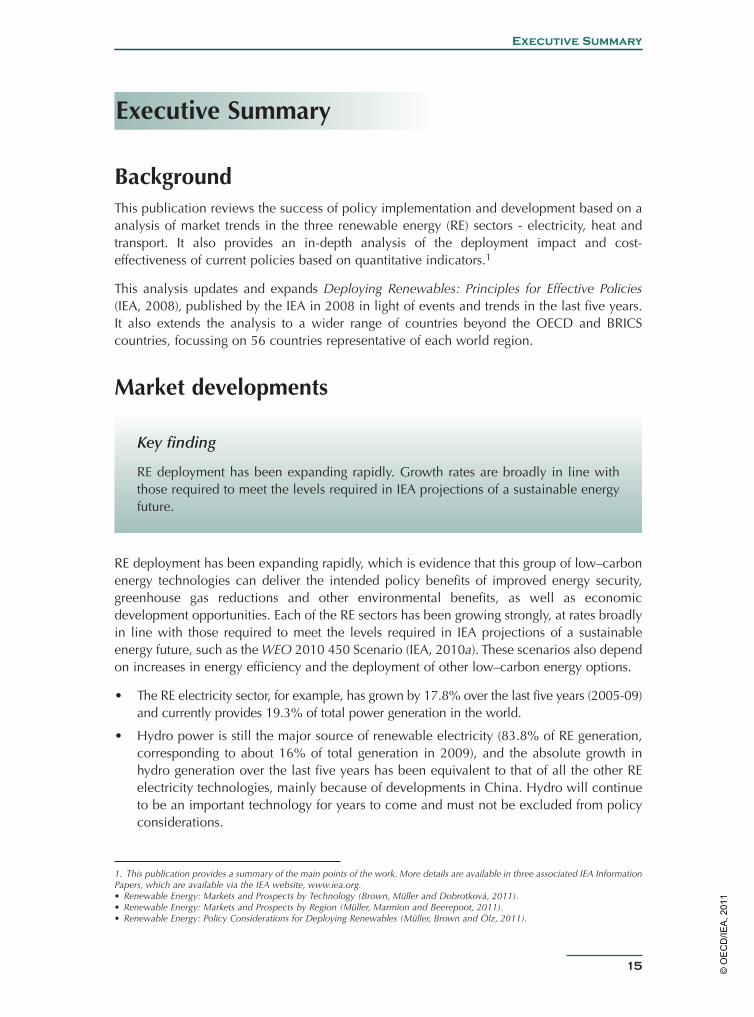
BackgroundThis publication reviews the success of policy implementation and development based on a analysis of market trends in the three renewable energy (RE) sectors - electricity, heat and transport. It also provides an in-depth analysis of the deployment impact and cost-effectiveness of current policies based on quantitative indicators.1
This analysis updates and expands Deploying Renewables: Principles for Effective Policies (IEA, 2008), published by the IEA in 2008 in light of events and trends in the last five years. It also extends the analysis to a wider range of countries beyond the OECD and BRICS countries, focussing on 56 countries representative of each world region.
Market developments
Key finding
RE deployment has been expanding rapidly. Growth rates are broadly in line with those required to meet the levels required in IEA projections of a sustainable energy future.
RE deployment has been expanding rapidly, which is evidence that this group of low–carbon energy technologies can deliver the intended policy benefits of improved energy security, greenhouse gas reductions and other environmental benefits, as well as economic development opportunities. Each of the RE sectors has been growing strongly, at rates broadly in line with those required to meet the levels required in IEA projections of a sustainable energy future, such as the WEO 2010 450 Scenario (IEA, 2010a). These scenarios also depend on increases in energy efficiency and the deployment of other low–carbon energy options.
• The RE electricity sector, for example, has grown by 17.8% over the last five years (2005-09) and currently provides 19.3% of total power generation in the world.
• Hydro power is still the major source of renewable electricity (83.8% of RE generation, corresponding to about 16% of total generation in 2009), and the absolute growth in hydro generation over the last five years has been equivalent to that of all the other RE electricity technologies, mainly because of developments in China. Hydro will continue to be an important technology for years to come and must not be excluded from policy considerations.
1. This publication provides a summary of the main points of the work. More details are available in three associated IEA Information Papers, which are available via the IEA website, www.iea.org.• Renewable Energy: Markets and Prospects by Technology (Brown, Müller and Dobrotková, 2011).• Renewable Energy: Markets and Prospects by Region (Müller, Marmion and Beerepoot, 2011). • Renewable Energy: Policy Considerations for Deploying Renewables (Müller, Brown and Ölz, 2011).
Executive Summary
001-30 pages debut AIE RENEWABLES.indd 15001-30 pages debut AIE RENEWABLES.indd 15 09/11/11 10:3609/11/11 10:36
© O
EC
D/IE
A, 2
011

16
Deploying Renewables: Executive Summary
• The other newer RE electricity technologies have also grown rapidly, by an impressive 73.6% between 2005 and 2009, a compound average growth rate (CAGR) of 14.8%. Wind has grown most rapidly in absolute terms and has overtaken bioenergy. Solar PV has grown at a growth rate of 50.2% (CAGR), and installed capacity reached about 40 GW by the end of 2010 (Figure E.1).
• Progress in RE electricity penetration was focused in the OECD and in Brazil, India and China. The OECD was the only region where the deployment of less mature technologies (such as solar PV, offshore wind) reached a significant scale, with capacities in the order of GWs.
• Renewable heat grew by 5.9% between 2005 and 2009. Although the use of biomass is still the dominant technology (and includes the use of “traditional” biomass with low efficiency for heating and cooking), growth in solar heating, and to a lesser extent geothermal heating technologies, has been strong, with an overall growth rate of nearly 12% between 2005 and 2009. Growth was particularly driven by rapid increases in solar heating in China.
• The production and use of biofuels have been growing rapidly, and in 2009 they provided 53.7 Mtoe, equivalent to some 3% of road transport fuels (or 2% of all transport fuels).The biofuels sector has been growing very rapidly (26% CAGR in 2005-09). Biofuels production and consumption are still concentrated in Brazil, the United States and in the European Union. The main centres for ethanol production and consumption are the United States and Brazil, while Europe produces and consumes mainly biodiesel. The remaining markets in other regions and the rest of the world account for only 6% of total production and for 3.3% of consumption. Trade in biofuels plays a limited, yet increasingly important role.
Figure E.1 Regional trends in non-hydro power generation, 2000-09
0
100
200
300
400
500
600
700
BioenergyOECD
Bioenergy BRICS
BioenergyRoW
Wind OECDWind BRICSWind RoWGeothermal
Solar PVSolar CSP
Tide, waveand ocean
2000 2001 2002 2003 2004 2005 2006 2007 2008 2009
TWh
Key point
Growth in non-hydro renewable electricity was driven by wind and to a lower extent biomass, in the OECD, China and India from 2000 to 2009.
001-30 pages debut AIE RENEWABLES.indd 16001-30 pages debut AIE RENEWABLES.indd 16 09/11/11 10:3609/11/11 10:36
© O
EC
D/IE
A, 2
011

Executive Summary
17
RE competitiveness and economic support
Key finding
A portfolio of RE technologies is becoming cost-competitive in an increasingly broad range of circumstances, in some cases providing investment opportunities without the need for specific economic support, but economic barriers are still important in many cases. A range of significant non-economic barriers is also delaying progress.
RE technologies may not generally be cost-competitive under current pricing mechanisms, and so may be inhibited by an economic barrier. The market expansion of RE technologies, however, has been accompanied by cost reductions in critical technologies, such as wind and solar PV, and such trends are set to continue. The portfolio of RE technologies, which includes established hydro power, geothermal and bioenergy technologies is now, therefore, cost-competitive in an increasingly broad range of circumstances, providing investment opportunities without the need for specific economic support. For example, wind projects have successfully competed with other generation projects (including gas) for long-term power purchase contracts in Brazil without special support measures, and solar water heating has expanded rapidly in China due to its favourable economics. Taking the portfolio as a whole, RE technologies should no longer be considered only as high–cost, immature options, but potentially as a valuable component of any secure and sustainable energy economy, providing energy at a low cost with high price stability.
Where technologies are not yet competitive, economic support for a limited amount of time may be justified by the need to attach a price signal to the environmental and energy security benefits of RE deployment, when these are not reflected by current pricing mechanisms. Support is also justified to allow the newer RE technologies to progress down the learning curve and so provide benefits at lower cost and in larger scale in the near future (Figure E.2).
Figure E.2 Factors influencing RE competitiveness and the role of policies
Pric
e {
Costreductions
{Externalities (e.g. environmental,
price risk)
Conventional RenewableConventional Renewable
Policy interventionNo policy
Key point
Policies should aim at internalising externalities and unlocking RE technology learning.
001-30 pages debut AIE RENEWABLES.indd 17001-30 pages debut AIE RENEWABLES.indd 17 09/11/11 10:3609/11/11 10:36
© O
EC
D/IE
A, 2
011
18
Deploying Renewables: Executive Summary
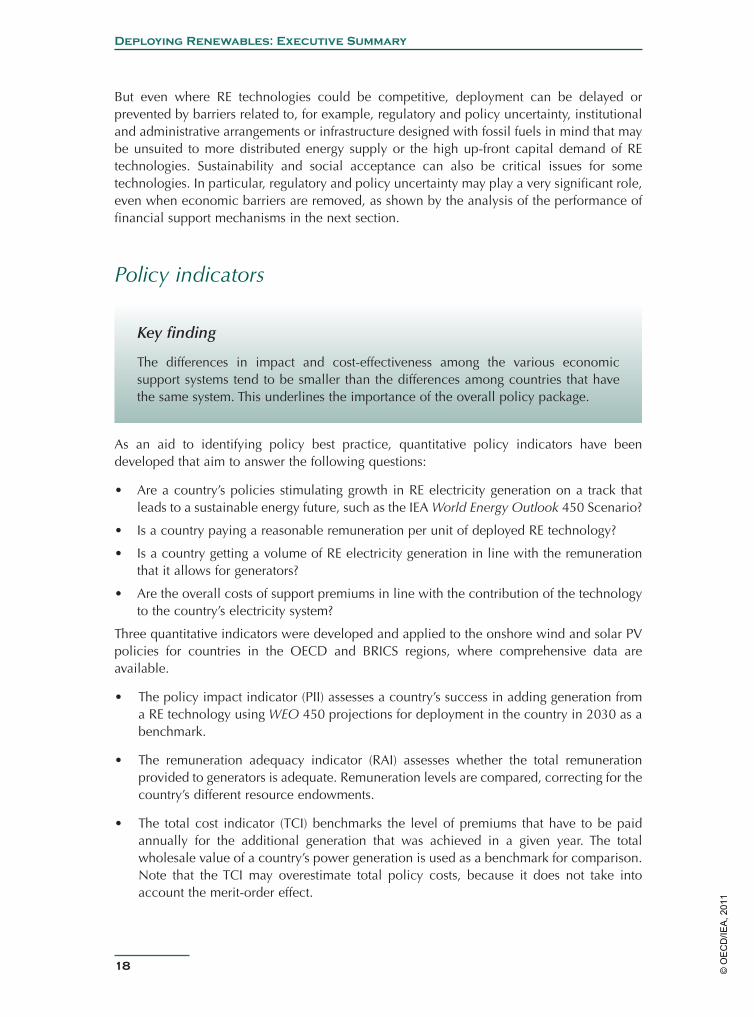
But even where RE technologies could be competitive, deployment can be delayed or prevented by barriers related to, for example, regulatory and policy uncertainty, institutional and administrative arrangements or infrastructure designed with fossil fuels in mind that may be unsuited to more distributed energy supply or the high up-front capital demand of RE technologies. Sustainability and social acceptance can also be critical issues for some technologies. In particular, regulatory and policy uncertainty may play a very significant role, even when economic barriers are removed, as shown by the analysis of the performance of financial support mechanisms in the next section.
Policy indicators
Key finding
The differences in impact and cost-effectiveness among the various economic support systems tend to be smaller than the differences among countries that have the same system. This underlines the importance of the overall policy package.
As an aid to identifying policy best practice, quantitative policy indicators have been developed that aim to answer the following questions:
• Are a country’s policies stimulating growth in RE electricity generation on a track that leads to a sustainable energy future, such as the IEA World Energy Outlook 450 Scenario?
• Is a country paying a reasonable remuneration per unit of deployed RE technology?
• Is a country getting a volume of RE electricity generation in line with the remuneration that it allows for generators?
• Are the overall costs of support premiums in line with the contribution of the technology to the country’s electricity system?
Three quantitative indicators were developed and applied to the onshore wind and solar PV policies for countries in the OECD and BRICS regions, where comprehensive data are available.
• The policy impact indicator (PII) assesses a country’s success in adding generation from a RE technology using WEO 450 projections for deployment in the country in 2030 as a benchmark.
• The remuneration adequacy indicator (RAI) assesses whether the total remuneration provided to generators is adequate. Remuneration levels are compared, correcting for the country’s different resource endowments.
• The total cost indicator (TCI) benchmarks the level of premiums that have to be paid annually for the additional generation that was achieved in a given year. The total wholesale value of a country’s power generation is used as a benchmark for comparison. Note that the TCI may overestimate total policy costs, because it does not take into account the merit-order effect.
001-30 pages debut AIE RENEWABLES.indd 18001-30 pages debut AIE RENEWABLES.indd 18 09/11/11 10:3609/11/11 10:36
© O
EC
D/IE
A, 2
011

Executive Summary
19
The analysis for recent years shows that both feed-in tariffs (FITs) and tradable green certificates (TGC) schemes can have a significant impact on deployment levels, and be cost effective, or not (Figure E.3). This analysis highlights the importance of other factors, e.g. the overall level of investor confidence engendered by the whole policy portfolio and the extent of non-economic barriers. For FITs the impact of these barriers is to deter deployment altogether. For TGCs the impact is to push up the support costs.
For wind, the indicators show that for the period 2001-09, FITs were significantly more effective in stimulating deployment than TGCs and other schemes. For 2008–09, however, this difference has largely disappeared. This change may be due to policy-learning effects as well as increasing technical and market maturity. The remuneration adequacy indicator shows that countries with TGC schemes tend to pay more than those using FITs.
The analysis also shows the increase in the number of countries who are now making serious efforts to deploy wind, compared to earlier years and to the number of countries engaging in PV deployment.
Figure E.3 Remuneration adequacy and policy impact indicators for onshore wind support policies, 2008/09
TUR
USA
CAN
MEX JPN
KOR
AUS
NZL
CHE
NOR
ISLAUT
BEL
CZE
DNK (14.5%)
FIN
FRA
DEU
GRC
HUN
IRL
ITA
LUX
NLD
POL
PRT
SVK
ESP
SWEGBR
RUS
CHNIND
BRA
ZAF0%
1%
2%
3%
4%
5%
6%
7%
8%
9%
10%
0 50 100 150 200 250 300 350 400 450
2008/09 policy impact indicator (%) Mainly FITs/FIPs
Mainly TGCs
Mainly other/multiple
None
RAI (thousand USD/MW per year)too low too high
Note: See Annex A for ISO country codes feed-in premiums (FIPs).
Key point
On average, feed-in systems have a better trade-off between impact and remuneration level than certificate systems.
001-30 pages debut AIE RENEWABLES.indd 19001-30 pages debut AIE RENEWABLES.indd 19 09/11/11 10:3609/11/11 10:36
© O
EC
D/IE
A, 2
011

20
Deploying Renewables: Executive Summary
A similar analysis for solar PV shows that nearly all countries with growing markets have used FITs. The impact of policies in countries actively promoting solar PV has been higher than for wind, with several countries experiencing very rapid growth, which in some cases (particularly the Czech Republic and Spain) has led to very high overall policy costs (Box E.1 and Box 4.1). The deployment was stimulated by the attractive and secure rates of return available to investors, with tariffs remaining high at a time when system prices were falling rapidly. PV expansion grew dramatically in 2010 in the Czech Republic, the year for which the total cost indicator was calculated, leading to a very large volume of annual premiums, corresponding to almost 18% of the total wholesale value of the entire Czech system (Figure E.4). High total costs are also an issue in other markets, such as Spain, where a boom took place in 2008 (which is not reflected in the 2010 additional premiums). In Germany and Italy, high rates of deployment are also causing comparably high total support costs.
Figure E.4 Total cost of policy support in major PV markets, 2010
0.00% 0.50% 1.00% 1.50% 2.00% 2.50% 3.00%
Additional annual premiums (share of wholesale value of total generation)
Additional share in annual generation
Japan
Australia
Belgium
other 26countries
Czech Republic
France
Germany
Greece
Italy
Slovak Republic
0%
2%
4%
6%
8%
10%
12%
14%
16%
18%
20%Mainly FITs
/FIPs
Mainly TGCs
Mainly other/multiple
None
Key point
Rapid growth of Solar PV has been confined to a few countries. In some countries support has involved the payment of premiums which have amounted to a high proportion of the total wholesale value of generation.
001-30 pages debut AIE RENEWABLES.indd 20001-30 pages debut AIE RENEWABLES.indd 20 09/11/11 10:3609/11/11 10:36
© O
EC
D/IE
A, 2
011

Executive Summary
21
Policy principles and priorities
Key finding
The critical barriers which can deter or slow down deployment change as the market for a technology develops. Policy makers need to adjust their priorities as deployment grows, taking a dynamic approach. The impact of support policies depends on the adherence to key policy principles.
Table E.1 Best practice policy principles
Overarching principles
• Provide a predictable and transparent RE policy framework, integrating RE policy into an overall energy strategy, taking a portfolio approach by focusing on technologies that will best meet policy needs in the short and long term, and backing the policy package with ambitious and credible targets.
• Take a dynamic approach to policy implementation, differentiating according to the current maturity of each individual RE technology (rather than using a technology-neutral approach), while closely monitoring national and global market trends and adjusting policies accordingly.
• Tackle non-economic barriers comprehensively, streamlining processes and procedures as far as possible.
• At an early stage, identify and address overall system integration issues (such as infrastructure and market design) that may become constraints as deployment levels rise.
Inception Take-off Consolidation
Develop a clear roadmap, including targets that generate confi dence.
Provide a suitable mixture of support, which may include both capital and revenue support.
Ensure that the necessary regulatory framework is in place and streamlined.
Provide support for the continuing industry-led R&D work.
Ensure a predictable support environment, backed by credible and ambitious targets.
Ensure that adaptability to market and technology developments is built in as a key characteristic of the policy package.
Provide appropriate incentives to ensure continued growth in deployment, managing them dynamically to control total policy costs, and to encourage improved cost competitiveness.
Focus on non-economic barriers and implementation details.
Deal with integration issues (such as the biofuels blending wall or system integration of variable renewable power), and focus on enabling technologies.
Ensure that energy market design is commensurate with high levels of RE penetration and economic support can be progressively phased out.
Maintain public acceptance as deployment levels grow and projects have higher visibility and impact.
001-30 pages debut AIE RENEWABLES.indd 21001-30 pages debut AIE RENEWABLES.indd 21 09/11/11 10:3609/11/11 10:36
© O
EC
D/IE
A, 2
011

22
Deploying Renewables: Executive Summary
The main challenges to deployment change as progress is made along the deployment curve. The three phases of deployment are:
• an inception phase, when the first examples of technology are deployed under commercial terms;
• a take-off phase, when the market starts to grow rapidly; and
• a market consolidation phase, where deployment grows toward the maximum practicable level.
The impact of support policies depends on the adherence to key policy principles. This publication has reviewed the best practice policy principles described in the Deploying Renewables 2008 publication. Best practice can now be summarised in terms of a number of overarching principles that apply throughout the deployment journey, as well as some that are specific to particular deployment phases (Figure E.5, Table E.1).
The differences in deployment success on the national level reflect the extent to which these principles have been applied. Onshore wind developments, for example, demonstrate that those countries that have managed to induce a dynamic and stable market (Denmark, Germany, Spain, and, more recently, China and India) have adhered to the best practice policy principles (Müller, Marmion, Beerepoot). Countries that lack a comprehensive and stable policy framework for RE deployment, on the other hand, have seen boom-and-bust cycles in deployment and, accordingly, a less well-developed market, particularly in terms of the domestic supply chain.
Another important policy principle is the need for close monitoring of market developments and adequate policy reaction, as exemplified by developments in the solar PV market. In Germany, legislation provided for a regular policy review every two years. In mid-2010, unscheduled tariff reductions were enacted following consultation with industry when markets were overheating. This approach avoided the problems experienced in Spain, where regulation was not flexible enough to respond to an overheating PV market in 2008. Experience shows that retroactive changes to policies and support mechanisms have long lasting impacts on market confidence and need to be avoided.
InceptionAt this early stage, the market is still immature, the technologies are not well established, and the local supply chain is not in place. The financing institutions may perceive investment as risky. The priority for policy making is to create a secure investment environment that catalyses an initial round of investment, and to put in place the necessary legislative framework.
The main challenge in this phase is to develop a clear roadmap, including targets that generate confidence that the respective market is bound to grow sustainably and at a considerable volume. This requires providing a suitable mixture of financial policy support, which may include both capital and revenue costs. In addition, a streamlined regulatory framework must be in place. This will also stimulate industry-led R&D work in countries with the capacity and appetite to give priority to R&D.
Regarding the choice of incentive scheme, FITs provide the highest amount of certainty, and these systems have been very successful at this stage of deployment. Initial price finding may be difficult, even with a good knowledge of international trends. This challenge could be
001-30 pages debut AIE RENEWABLES.indd 22001-30 pages debut AIE RENEWABLES.indd 22 09/11/11 10:3609/11/11 10:36
© O
EC
D/IE
A, 2
011

Executive Summary
23
overcome through tendering of a pilot phase (for example, a large-scale demonstration). TGCs may not work that well during inception unless the targets, penalties and implementation details are well designed. In the absence of banding, novel technologies will not be deployed. The financial rewards are seen as less certain, and this may lead to investors demanding a risk premium, so pushing up overall policy costs.
For large-scale technologies with high technological risks (e.g. advanced biofuels, large scale enhanced geothermal), tenders may be a useful solution, because they include a price-finding mechanism, and the high transaction costs are less significant compared to overall project costs. Loan guarantees can be an additional risk mitigation instrument in these circumstances.
Figure E.5 Deployment journey
Market and operating
Inception Take-off Consolidation
regulation adaptation
Supporting technologies (e.g. power grids)
Manage growth and policy cost
Public acceptance
Economic deployment support for mass market
Priority market access
Supply chain development
Financing
Targets
Initial plants / large-scale demonstration
Institutional and humancapacity building
Resource/cost, technology portfolio assessment
Note: Intensity of shading corresponds to relative importance.
Key point
Policy priorities vary by phase of deployment.
001-30 pages debut AIE RENEWABLES.indd 23001-30 pages debut AIE RENEWABLES.indd 23 09/11/11 10:3609/11/11 10:36
© O
EC
D/IE
A, 2
011
24
Deploying Renewables: Executive Summary
Tax incentives are subject to frequent review, because they are directly linked to public budget. This characteristic could lead to problems for developers if projects experience delays, a common phenomenon at this stage. Therefore, the instrument is not best suited for the introduction of novel technologies.
Direct investment subsidies can provide an additional market boost by reducing up-front cost exposure. They are also applicable, where FITs are difficult to apply, for example, in the heat sector.
Take-offBy this stage, the deployment of the particular technology is underway within the national market, the supply chain is in place even if not fully developed, and financing institutions have increased knowledge of the technology. The priority for policy makers is to maintain or accelerate market growth, while managing overall policy costs.
Growth is ensured by establishing a predictable support environment, backed by credible and ambitious targets. At the same time, adaptability to market and technology developments must be built in as a key characteristic of the policy package. This adaptability includes providing appropriate incentives to ensure continued growth in deployment, while managing incentives to control total policy costs and encourage improved cost competitiveness of RE technologies. Mitigating and removing non-economic barriers has to be a priority.
In the electricity sector, past experience has shown that FIT schemes can lead to high deployment volumes at comparably low costs. In this phase, however, policy making needs to reap the benefits of learning and increased market maturity by scheduling and implementing ambitious tariff degression schedules aimed, first, at convergence with international benchmarks, and then further cost reductions as global costs decrease. These reductions materialise only when policy makers put sufficient pressure on industry to deliver.
For very modular technologies with rapid cost reduction potential (particularly solar PV), FITs can be challenging from a policy-making perspective, because overheating in the take-off phase can lead to very high total policy costs. Policy makers must, therefore, monitor market developments closely and incorporate a mechanism of deployment volume control into FIT systems (see Box E.1).
At this stage, setting a quota may be applicable in the electricity, heat and transport sectors. For the electricity sector, analysis has shown that TGC systems can lead to high deployment volumes in the take-off phase. These systems, however, are often associated with higher overall costs as compared to (well-designed) FITs. The data used in the current analysis may be too limited to draw a final conclusion, but the analysis suggests that TGCs may be the option of choice only where the government has a strong policy preference for market-based mechanisms.
Tenders can also be used in this phase to meet a certain quota. They are increasingly becoming the option of choice for the take-off phase of mature technologies, especially in emerging economies. Given that a sufficiently mature supply chain is present that supports the up-front risk of tendering schemes, tenders provide volume control while determining prices under competitive conditions. Experience in South American countries illustrates that tenders can be a very effective instrument at this stage of market development.
001-30 pages debut AIE RENEWABLES.indd 24001-30 pages debut AIE RENEWABLES.indd 24 09/11/11 10:3609/11/11 10:36
© O
EC
D/IE
A, 2
011

Executive Summary
25
In the heat sector, successful take-off policies have also used a type of mandate. For example, in 2000, Barcelona introduced a solar obligation, and its success resulted in the Spanish government developing a national solar obligation policy in 2006. Other regulatory approaches consist of requiring a share of a building’s heating demand to be generated by renewable energy, such as in the London “Merton rule” and the 2009 German building regulations.
In the transport sector, market take-off has been successfully stimulated using blending mandates. The success of a mandate depends on the prior establishment of a supply chain that will be able to meet the mandate (see inception phase). Mandates can be combined with tax breaks to limit the financial impact on consumers.
Box E.1 Controlling the cost of solar PV
With policy driven deployment of solar PV reaching scale in leading markets (e.g. Germany, Italy, Spain and the Czech Republic), the total cost of policy support has been drawing increasing attention (see Chapter 4).
While currently total policy costs can be a constraint for deployment, the very high cost of support is a transitory problem. Out of all the RE technologies, solar PV holds the promise of the most drastic cost reductions. The technology is semiconductor based or based on other innovative compounds, with learning occurring at a speed more similar to computer equipment than other energy technologies. In addition, the problem of total policy costs is currently exacerbated by the fact that most of the deployment is occurring in just a few markets.
To manage the policy costs associated with the rapid development of the solar PV market and avoid “PV bubbles”, governments need to take the following actions:
• Ensure that PV development and deployment are an integral part of the overall strategy aimed at deploying an appropriate portfolio of RE technologies, as part of the comprehensive overall energy strategy.
• Take an ambitious approach to tariff reductions. As noted above, solar PV has demonstrated a very steep learning curve. Governments need to sustain pressure on the PV industry to deliver such learning, and they need to programme ambitious tariff degression schedules to accompany cost reductions. Tariff degressions should be linked to international benchmarks (global PV module prices or globally best-in class system prices) as this avoids artificially keeping system prices above costs.
• Spread the burden of financing the technology’s learning curve. The current concentration of PV deployment in a handful of countries needs to be overcome. Once more countries engage in financing the technology’s learning curve, each country will face less of a burden.
• Avoid retroactive policy measures. Changing the economics of operating projects should be avoided, because this will increase the policy risk perception of investors and may drive up costs in the long term.
001-30 pages debut AIE RENEWABLES.indd 25001-30 pages debut AIE RENEWABLES.indd 25 09/11/11 10:3609/11/11 10:36
© O
EC
D/IE
A, 2
011

26
Deploying Renewables: Executive Summary
ConsolidationBy this stage, the technologies are well established, the market has grown substantially, supply chains are robust, and finance and public institutions have streamlined their procedures. The technologies are close to or fully cost-competitive.
The challenges in this phase relate to the integration of larger volumes of RE into the system. This involves some technical integration issues, such as the system integration of variable renewables. It also involves market impacts, particularly the impact of increasing levels of renewables deployment on existing market players, and non-economic factors, such as maintaining public acceptance as the scale and impact of deployment grows.
The recent IEA Harnessing Variable Renewables (2011b) study shows that the limits to integrating variable RE supplies depend on the characteristics of particular systems. From a technical perspective, the limits can be much less restrictive than is often thought, if a whole system approach is adopted, taking into account the flexibility of other generation technologies, the potential for load management, and grid interconnectivity as well as storage capacity. Such an approach will, however, require reforms of operating systems and regulatory reform, as well as significant investment in the necessary infrastructure (IEA 2011b).
In the consolidation phase, some continued economic support for RE technologies may be required, but policies may also need to introduce elements of competition between the RE technologies and conventional generation to incentivise further cost reductions and to optimise the overall generation costs. In practice, this policy shift can be achieved by modifying a number of the economic support mechanisms or creating hybrid systems, for example, by providing a uniform FIT for a number of technologies and moving to a premium rather than a fixed price, as Spain has done at a comparably early phase for wind. Consolidation can also be addressed by moving away from technology specific rewards within a TGC, such as providing different numbers of certificates for different technologies, and moving to a technology-neutral system once the costs of particular technologies converge, or by arranging multi-technology tenders (as in Brazil).
For the power sector, the fundamental market design problem is not addressed, however, by just choosing a more market-based instrument for RE support in the consolidation phase. Because most RE power technologies have very low marginal costs (with the exception of bioenergy), RE generators will almost always be able to sell their electricity on marginally priced wholesale energy markets. This trend pushes more costly generation out of the market, reducing the capacity factor of these plants. This reduction can lead to a situation where investment is inhibited and, in the long term, an insufficient amount of flexible dispatchable capacity is available to balance RE generation.
Such problems are likely to make a fundamental redesign of power markets necessary. The design must provide stable and long-term signals that appropriately reward low-carbon generation. It must offer economic incentives for the flexible operation that is required for example, to gas generators, hydro plant operators or electricity storage. New policies must reward the energy security benefits that renewables offer by decoupling costs from rising and erratic fossil fuel prices, and so insulate consumers from varying costs that generators usually pass on to them. Market design also needs to provide a higher degree of market harmonisation across systems allowing for competition.
001-30 pages debut AIE RENEWABLES.indd 26001-30 pages debut AIE RENEWABLES.indd 26 09/11/11 10:3609/11/11 10:36
© O
EC
D/IE
A, 2
011

Executive Summary
27
Such market redesign will be an essential step if renewable sources are to meet their potential. This is now the major challenge faced by policy makers in markets where RE technologies are playing or will play a major role, and needs to be the subject of much further thinking and analysis. This will be an important topic in the next stages of IEA research.
In the transport sector, consolidation challenges have emerged involving the “blending wall”. The United States has found it difficult to move to fuel blends containing higher levels of ethanol, and in Germany consumers have been rejecting the move to higher blends due to potential compatibility problems with conventional vehicles and a lack of comprehensive consumer information. These issues are being tackled successfully elsewhere, particularly via the introduction of fuel-flexible vehicles, for example in Brazil and Sweden.
Key challenges
Key finding
Current growth has been concentrated on certain technologies and in certain countries. Staying on track to deliver ambitious levels of RE will require that:
• the current momentum is sustained;
• the heat sector is tackled with priority;
• the full range of technologies is exploited; and
• the geographic base is broadened.
Although deployment has been growing rapidly, and good progress has been made in reducing costs, the challenges of keeping growth rates on track should not be underestimated. Current growth has been concentrated on certain technologies, particularly hydro power, wind and biofuels. The potential of the other technologies is not being exploited as rapidly, even though they are often technically proven. The range of countries where RE technologies are growing rapidly is also still limited. Keeping on track to deliver ambitious levels of RE will require that the full range of technologies is exploited, and that the geographic base is broadened (Figure E.7).
Specific challenges in each sector will need to be tackled if growth is to continue to accelerate. These challenges include:
Electricity
• maintaining investor confidence in market stability while managing the overall costs of policies;
• tackling the technical and policy challenges of integrating larger amounts of renewable electricity into the market;
• providing the necessary push to bring less mature technologies such as offshore wind and concentrating solar power into the market as long as these technologies demonstrate sufficient learning effects;
001-30 pages debut AIE RENEWABLES.indd 27001-30 pages debut AIE RENEWABLES.indd 27 09/11/11 10:3609/11/11 10:36
© O
EC
D/IE
A, 2
011

28
Deploying Renewables: Executive Summary
• bringing emerging technologies, such as ocean energy up to the deployment inception phase.
Heat• dealing with the specific non-economic organisational barriers to renewable heat
deployment, such as split-incentive barriers and the fragmented nature of the market;
• developing innovative policy measures that reconcile a large impact with cost-effectiveness.
Transport• addressing concerns about the sustainability of current biofuels technologies;
• tackling the barriers to the introduction of the advanced biofuels technologies.
An additional challenge across all RE sectors is broadening the base of countries that are deploying RE technologies in an ambitious way. Up to now deployment of the newer RE technologies has been focused in countries which have been fossil fuel importers, and who have felt the need to diversify their energy resources, but which have also been able to afford to develop and deploy the technologies while the costs have been high.
Figure E.6 Expanding RE deployment
GDP/capita
Ener
gy d
epen
denc
e
Rising fossil fuel
prices
RE costreductions
Fossil fuel importersLow GDP
Fossil fuel importersHigh GDP
Fossil fuel exportersLow GDP
Fossil fuel exportersHigh GDP
Key point
Fossil fuel exporting countries, as well as emerging and developing economies are becoming more likely to deploy renewables.
001-30 pages debut AIE RENEWABLES.indd 28001-30 pages debut AIE RENEWABLES.indd 28 09/11/11 10:3609/11/11 10:36
© O
EC
D/IE
A, 2
011
Executive Summary
29
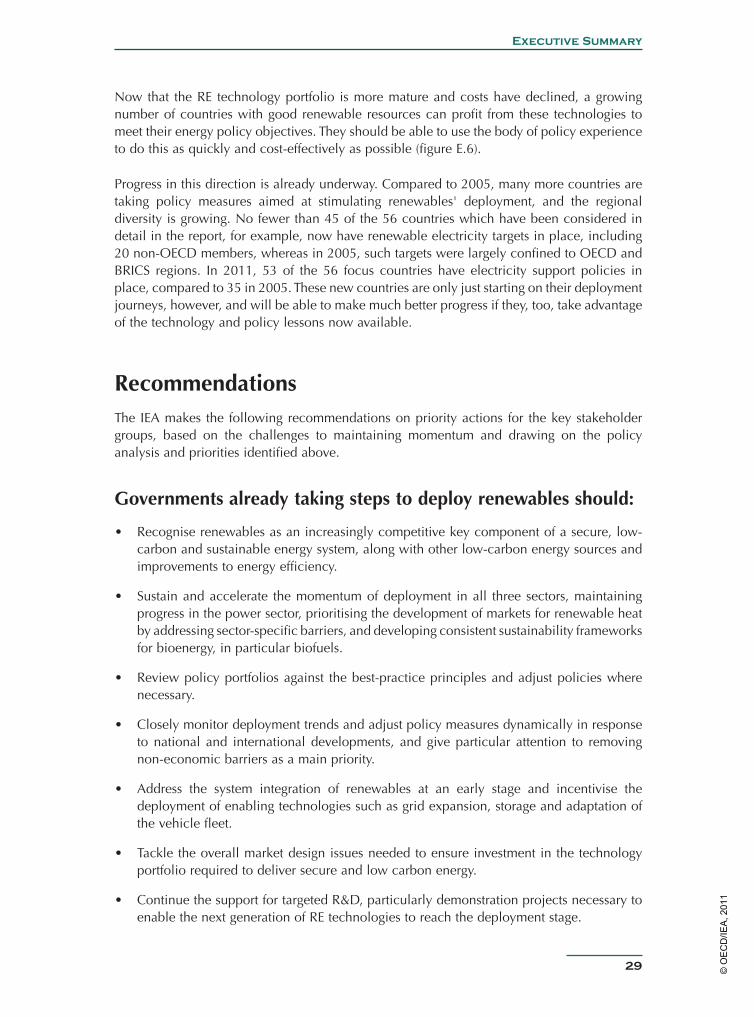
Now that the RE technology portfolio is more mature and costs have declined, a growing number of countries with good renewable resources can profit from these technologies to meet their energy policy objectives. They should be able to use the body of policy experience to do this as quickly and cost-effectively as possible (figure E.6).
Progress in this direction is already underway. Compared to 2005, many more countries are taking policy measures aimed at stimulating renewables' deployment, and the regional diversity is growing. No fewer than 45 of the 56 countries which have been considered in detail in the report, for example, now have renewable electricity targets in place, including 20 non-OECD members, whereas in 2005, such targets were largely confined to OECD and BRICS regions. In 2011, 53 of the 56 focus countries have electricity support policies in place, compared to 35 in 2005. These new countries are only just starting on their deployment journeys, however, and will be able to make much better progress if they, too, take advantage of the technology and policy lessons now available.
RecommendationsThe IEA makes the following recommendations on priority actions for the key stakeholder groups, based on the challenges to maintaining momentum and drawing on the policy analysis and priorities identified above.
Governments already taking steps to deploy renewables should:
• Recognise renewables as an increasingly competitive key component of a secure, low-carbon and sustainable energy system, along with other low-carbon energy sources and improvements to energy efficiency.
• Sustain and accelerate the momentum of deployment in all three sectors, maintaining progress in the power sector, prioritising the development of markets for renewable heat by addressing sector-specific barriers, and developing consistent sustainability frameworks for bioenergy, in particular biofuels.
• Review policy portfolios against the best-practice principles and adjust policies where necessary.
• Closely monitor deployment trends and adjust policy measures dynamically in response to national and international developments, and give particular attention to removing non-economic barriers as a main priority.
• Address the system integration of renewables at an early stage and incentivise the deployment of enabling technologies such as grid expansion, storage and adaptation of the vehicle fleet.
• Tackle the overall market design issues needed to ensure investment in the technology portfolio required to deliver secure and low carbon energy.
• Continue the support for targeted R&D, particularly demonstration projects necessary to enable the next generation of RE technologies to reach the deployment stage.
001-30 pages debut AIE RENEWABLES.indd 29001-30 pages debut AIE RENEWABLES.indd 29 09/11/11 10:3609/11/11 10:36
© O
EC
D/IE
A, 2
011

30
Deploying Renewables: Executive Summary
Governments not yet committed to large-scale RE deployment should:• Re-evaluate, in light of dramatic recent cost reductions, the opportunity of RE technologies
to provide affordable, safe and clean energy, particularly the potential of RE technologies to help meet rising energy demand.
• Increase the penetration of renewables by stimulating deployment as part of a strategy to develop a sustainable low-carbon energy system, taking advantage of the technology progress and policy experience now available.
More broadly governments and international organisations should:• Use existing international mechanisms, such as those provided by the Clean Energy
Ministerial and G20 for concerted efforts to develop a broad range of renewable energy technologies and to cooperate to bring the next-generation technologies into and through the market inception phases.
• Cooperate to allow tracking and monitoring of rates of deployment and share policy experience to allow refinement and dissemination of best practice in policy development.
• Reap the benefits of cooperating internationally between countries that are very rich in resources and those that can provide funds to develop resources (making sure that sustainable growth is stimulated in host countries, rather than perpetuating dependency).
• Provide support for capacity building and transfer of best practice in policy development to countries starting to develop their RE resources.
• Assist in the mobilisation of the finance necessary for deploying the RE technologies, particularly in emerging and developing countries by giving priority to the sector in the plans of multilateral and development banks.
The IEA work on monitoring trends within the RE market is evolving, given the fast moving and dynamic nature of the sector, the growing regional and technological diversity, and the continuing evolution of policy hot-spots as more and more countries progress along the policy journey. In particular, in 2012 a Medium-Term Renewables Market Report will be launched for the first time. This will track recent market and policy trends and look at shorter term market prospects. In addition a study of the needs for market reform and design will get underway.
001-30 pages debut AIE RENEWABLES.indd 30001-30 pages debut AIE RENEWABLES.indd 30 09/11/11 10:3609/11/11 10:36
© O
EC
D/IE
A, 2
011

Chapter 1: introduction
31
BackgroundThis publication updates Deploying Renewables: Principles for Effective Policies (IEA [International Energy Agency], 2008) in light of events and trends in the last five years. The present book also extends the geographic scope beyond the OECD and BRICS regions covered previously to include regions throughout the world. Overall, the book aims to answer the following questions:
• What are the main renewable energy (RE) market and policy trends worldwide, and how have they evolved over the last five years?
• What challenges are likely to restrict future progress in deploying renewable energy technologies (RE technologies)?
• What has been the experience of the best way to kick-start and sustain RE technology deployment in a given country, and how can other countries benefit from the experience and learning to date?
• Do the principles for effective policy developed in the 2008 publication still hold true, and are they applicable not only to renewable electricity but also to the heat and transport subsectors?
• How can the new issues associated with large-scale deployment best be tackled?
The analysis is based on the IEA unique access to energy data for countries around the world. The IEA has also extended its comprehensive database of RE policies in OECD countries to include information on RE policies from more than 75 countries (IEA, 2011a).
In carrying out this analysis, the IEA has formulated or extended new ideas that illuminate some of the recent developments and that also provide pointers to future policy evolution, both for countries with well-established RE sectors and for those still entering the field and putting new policies and measures in place. These new perspectives include:
• An analysis of the strategic reasons underpinning the pursuit of RE technology deployment by various countries. This analysis considers the pressure that countries are under to improve energy security (as represented by their status as energy importers or exporters) and their ability to pay the higher costs currently often associated with RE technologies (as indicated by their gross domestic product [GDP]/person). This strategic context helps explain how vigorously countries have been pursuing RE technologies, or will need to in the future.
• A recognition of the changing challenges that countries face as they embark along a policy journey that supports the expansion of RE deployment: from market inception, through a market take-off phase with steadily increasing deployment, and then into a consolidation phase where market design and integration issues become critical.
• An updated methodology for evaluating the impact and cost-effectiveness of the RE policies currently in place.
Chapter 1Introduction
031-64 Chap_1et2_AIE RENEWABLES.indd 31031-64 Chap_1et2_AIE RENEWABLES.indd 31 09/11/11 11:3109/11/11 11:31
© O
EC
D/IE
A, 2
011

32
Deploying Renewables: introduction
ContextRecent IEA scenario work (2010a, IEA 2010b) has emphasised the continuing need for the deployment of a comprehensive suite of low-carbon energy technologies. The world is entering a period of unprecedented uncertainty and price volatility in the energy markets as supply and demand patterns change. Increasing concerns are being raised about energy security across a broad range of energy carriers, including gas, coal and electricity as well as oil.
The need to respond to global climate change is also even more urgent than in 2008. Current policy commitments might lead to emission reductions of at most 20% by 2020 (IEA, 2010a). Much more needs to be done to reach a path that offers even a 50:50 chance of avoiding global warming of 2°C above 19th century temperatures. Waiting will only increase the cost of action and make success less likely. The consequences of higher levels of warming could be catastrophic, leading to mass migrations from the worst-affected areas and the potential for severe and prolonged regional conflicts. The need to deploy RE technologies and other low-carbon energy measures is, therefore, imperative.
The IEA is convinced that renewable energy, along with energy efficiency, nuclear energy, and carbon capture and storage (CCS), has a key role to play with respect to these challenges, as highlighted through its publications such as the World Energy Outlook 2010 (IEA, 2010a) and Energy Technology Perspectives 2010 (IEA, 2010b).
ProgressSince 2005, much progress has been made in developing RE resources (REN21 [Renewable Energy Policy Network for the 21st Century], 2011) and deploying RE technologies. The contribution from RE has been growing sharply; IEA analysis shows that electricity from non-hydro sources has increased by more than 70%, and the level of biofuel production by a factor of 2.5.
Compared to 2005, many more countries are now deploying RE technologies, and these technologies are now increasingly important in all analysed regions, rather than being of interest primarily to a handful of OECD countries.
Investment patterns are shifting, with the Asian market growing rapidly and China becoming a leader in RE manufacturing and the deployment of more competitive RE technologies.
The strong market growth has stimulated continuing cost reduction and increasing competitiveness. In some cases, the reductions have been dramatic, particularly for solar photovoltaics (PV). Many more examples are evident of RE technologies being deployed without special financial support measures, as the technologies prove themselves cost competitive in a broader range of situations.
Novel challengesInevitably, as the technologies mature and are more widely deployed and exploited in new markets, new issues and difficulties are emerging. Particular issues come to the fore as the level of deployment rises beyond the market inception stage. One issue involves how
031-64 Chap_1et2_AIE RENEWABLES.indd 32031-64 Chap_1et2_AIE RENEWABLES.indd 32 09/11/11 11:3109/11/11 11:31
© O
EC
D/IE
A, 2
011
Chapter 1: introduction
33
governments can balance the need for the stable and predictable policy environment necessary to encourage investment against the challenge of keeping incentive levels in line with rapidly reducing costs, and so avoid unnecessarily high policy costs and runaway rates of deployment.
Another issue involves how to integrate increasing levels of RE production into the existing energy infrastructure for electricity, heat and transport fuels (e.g. IEA, 2011b).
Although these issues may be seen as challenges typical of a new enterprise, ways of addressing them must be found quickly to enable continued expansion and indeed ramp up the pace of RE technology deployment, because the need to establish a path to a more sustainable energy future is increasingly urgent.
This publicationChapter 2 reviews the overall market development of each of the three RE sectors (electricity, heat and transport) and covers the following issues:
• the overall deployment trends for each sector (electricity, heat and transport), including:
- which technologies have contributed most to the increases in deployment;
- the regional trends in deployment; and
- the progress that has been made in reducing costs and the prospects for further improving cost competitiveness.
• a comparison of current trends with those levels required to meet aspirations for the greater RE contributions in low-carbon energy scenarios such as the IEA World Energy Outlook (WEO) 450 scenario;
• the opportunities opened up by recent deployment and cost reductions; and
• the key challenges that need to be tackled to deliver the potential for RE technologies.
Chapter 3 reviews progress in policy development. It focuses on the following issues:
• the main drivers for promoting RE as a component of the energy mix;
• the main barriers to RE deployment;
• the policy tools that have been successfully put to use to tackle them;
• the relevance of the policy principles developed in the 2008 edition of Deploying Renewables, the scope for extending them, and their applicability to the electricity, heat and transport sectors; and
• the policy challenges characteristic of different stages along the deployment journey, and how they can best be tackled.
Chapter 4 provides an in-depth analysis of the impact (in terms of their effect on deployment levels) and cost-effectiveness of current policies.
Chapter 5 reviews recent regional market and policy developments.
031-64 Chap_1et2_AIE RENEWABLES.indd 33031-64 Chap_1et2_AIE RENEWABLES.indd 33 09/11/11 11:3109/11/11 11:31
© O
EC
D/IE
A, 2
011

34
Deploying Renewables: introduction
Chapter 6 draws together overall conclusions and recommendations aimed at facilitating sustained growth in the sector.
This document provides a summary of the main issues. More details are available in three associated IEA Information Papers available via the IEA website, www.iea.org.
Renewable Energy: Markets and Prospects by Technology (Brown, Müller and Dobrotková, 2011) provides a detailed discussion of the status and prospects for ten key technology areas: bioenergy for electricity and heat, biofuels, geothermal energy, hydro energy, marine energy, solar energy (solar PV, concentrating solar power, and solar heating), and wind energy (onshore and offshore). Each technology discussion includes the current technical and market status; the current costs of energy production and cost trends; the policy environment; the potential and projections for the future; and an analysis of the prospects and key hurdles to future expansion.
Renewable Energy: Markets and Prospects by Region (Müller, Marmion and Beerepoot, 2011) provides a regional and country analysis covering 56 countries. For each region, the analysis covers recent market trends, policy developments, IEA projections, and an analysis of the mid-term potential.
Renewable Energy: Policy Considerations for Deploying Renewables (Müller, Brown and Ölz, 2011) provides a more detailed discussion of the drivers, benefits, challenges and policy tools relevant to RE deployment.
031-64 Chap_1et2_AIE RENEWABLES.indd 34031-64 Chap_1et2_AIE RENEWABLES.indd 34 09/11/11 11:3109/11/11 11:31
© O
EC
D/IE
A, 2
011
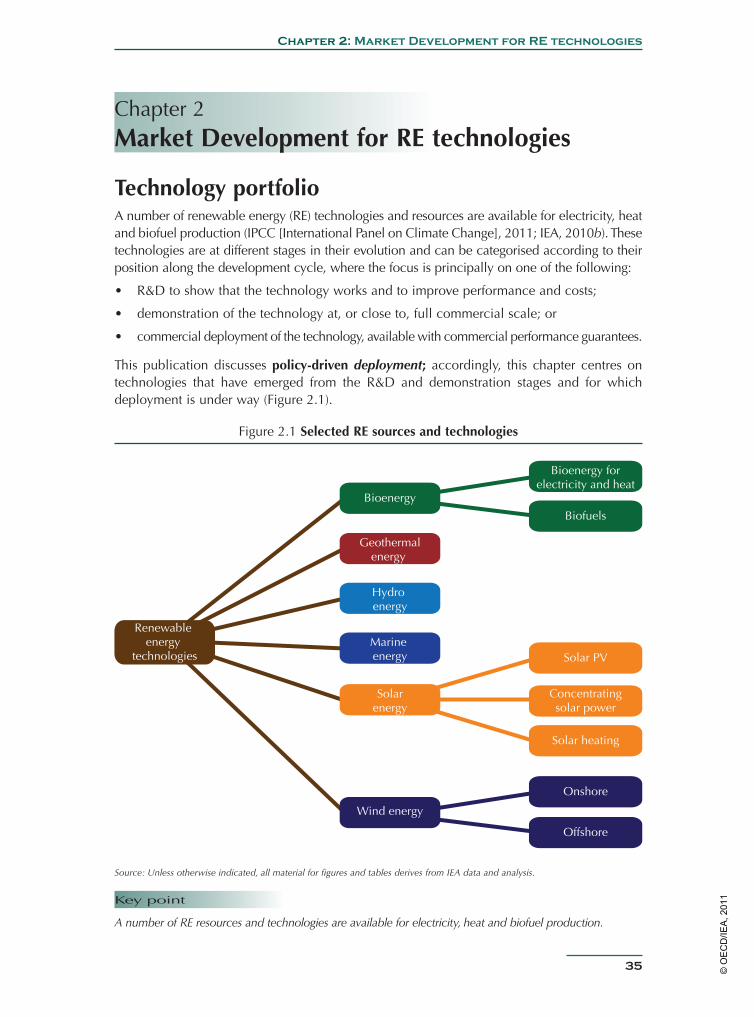
Chapter 2: Market Development for RE technologies
35
Technology portfolioA number of renewable energy (RE) technologies and resources are available for electricity, heat and biofuel production (IPCC [International Panel on Climate Change], 2011; IEA, 2010b). These technologies are at different stages in their evolution and can be categorised according to their position along the development cycle, where the focus is principally on one of the following:
• R&D to show that the technology works and to improve performance and costs;
• demonstration of the technology at, or close to, full commercial scale; or
• commercial deployment of the technology, available with commercial performance guarantees.
This publication discusses policy-driven deployment; accordingly, this chapter centres on technologies that have emerged from the R&D and demonstration stages and for which deployment is under way (Figure 2.1).
Figure 2.1 Selected RE sources and technologies
Renewable energy
technologies
Wind energy
Offshore
Onshore
Solar heating
Concentratingsolar power
Solar PV
Hydro energy
Marine energy
Renewable Energy
Technologies
Geothermalenergy
Solarenergy
Bioenergy
Bioenergy forelectricity and heat
Biofuels
Source: Unless otherwise indicated, all material for figures and tables derives from IEA data and analysis.
Key point
A number of RE resources and technologies are available for electricity, heat and biofuel production.
Chapter 2 Market Development for RE technologies
031-64 Chap_1et2_AIE RENEWABLES.indd 35031-64 Chap_1et2_AIE RENEWABLES.indd 35 09/11/11 11:3109/11/11 11:31
© O
EC
D/IE
A, 2
011

36
Deploying Renewables: Market Development for RE technologies
The development and deployment status of the various technologies in the portfolio differs markedly. Some technologies, such as hydro and geothermal, are very mature from a technical perspective. Others, such as marine energy and advanced biofuel technologies, are just emerging from the RD&D phase, with deployment at scale just starting to happen. The technologies also differ to the extent in which they can be cost competitive with other energy sources. (Cost-competitiveness, of course, also depends on the resources available where the technology is to be deployed.)
Based on the analysis by technology and region provided in the associated IEA Information Papers Renewable Energy: Markets and Prospects by Technology (Brown, Müller and Dobrotková, 2011) and Renewable Energy: Markets and Prospects by Region (Müller, Marmion and Beerepoot, 2011), the sections below review the main technical and regional deployment and cost trends, and identify the principal opportunities for further growth and the main associated challenges.
Deployment and cost trends: electricityGeneral deployment trendsElectricity generation from RE sources has been growing rapidly (Figure 2.2 and Table 2.1). Overall generation, including hydro power, grew by 35% between 2000 and 2009, and by 17% between 2005 and 2009. Global electricity consumption also grew strongly over the period, however, and the fraction of electricity provided by RE sources has just about kept pace with this global trend at 19.3% in 2009.
Hydro power is still the main source, providing 83.8% of all the electricity from RE sources in 2009. Hydro has grown by 24.1% since 2000, and a significant number of projects are planned (Figure 2.6).
Table 2.1 Power generation and growth rates (CAGR), 2000-09
Technology 2005 generation
2009 generation
Achieved growth rates
2000-09
Achieved growth rates
2005-09
TWh/y TWh/y % %Hydro 2 932 3 252 2.4 2.6Bioenergy for power 194 266 7.8 8.2Wind 104 273 27.2 27.3Solar PV 1 20 40.2 50.2CSP 1 1 5.4 9.0Geothermal 58 67 2.8 3.5Tide, wave and ocean 1 1 -1.5 -1.6Total 3 293 3 879 3.5 4.2Non-hydro 361 627 12.3 14.8
Note: Data is rounded to full TWh values. The sum of the individual figures may not tally with the total due to the rounding of numbers.
031-64 Chap_1et2_AIE RENEWABLES.indd 36031-64 Chap_1et2_AIE RENEWABLES.indd 36 09/11/11 11:3109/11/11 11:31
© O
EC
D/IE
A, 2
011

Chapter 2: Market Development for RE technologies
37
Figure 2.2 Growth in global power generation from renewable sources, 2000-09
0
500
1 000
1 500
2 000
2 500
3 000
3 500
4 000
4 500
Hydro
Bioenergy
Wind
Geothermal
Solar PV
CSP
Tide, waveand ocean
2000 2001 2002 2003 2004 2005 2006 2007 2008 2009
TWh
Key point
Electricity generation from RE sources has been growing strongly; hydro is still the main source.
Non-hydro RE technologies have been growing even more strongly from a low base, by 180% since 2000 and 73.7% since 2005 (Figure 2.3). Wind has grown particularly strongly, overtaking bioenergy as the second largest source of supply. PV has also grown very strongly, by 1 951% since 2000 and 410% since 2005. Other technologies such as bioenergy, geothermal and concentrating solar power (CSP) have also continued to grow but at lower rates.
Figure 2.3 Growth in global power generation from non-hydro RE sources, 2000-09
0
100
200
300
400
500
600
700
Bioenergy
Wind
Geothermal
Solar PV
CSP
Tide, waveand ocean
2000 2001 2002 2003 2004 2005 2006 2007 2008 2009
TWh
Key point
Non-hydro RE technologies have grown by 180% since 2000, with wind and PV growing particularly rapidly.
031-64 Chap_1et2_AIE RENEWABLES.indd 37031-64 Chap_1et2_AIE RENEWABLES.indd 37 09/11/11 11:3109/11/11 11:31
© O
EC
D/IE
A, 2
011
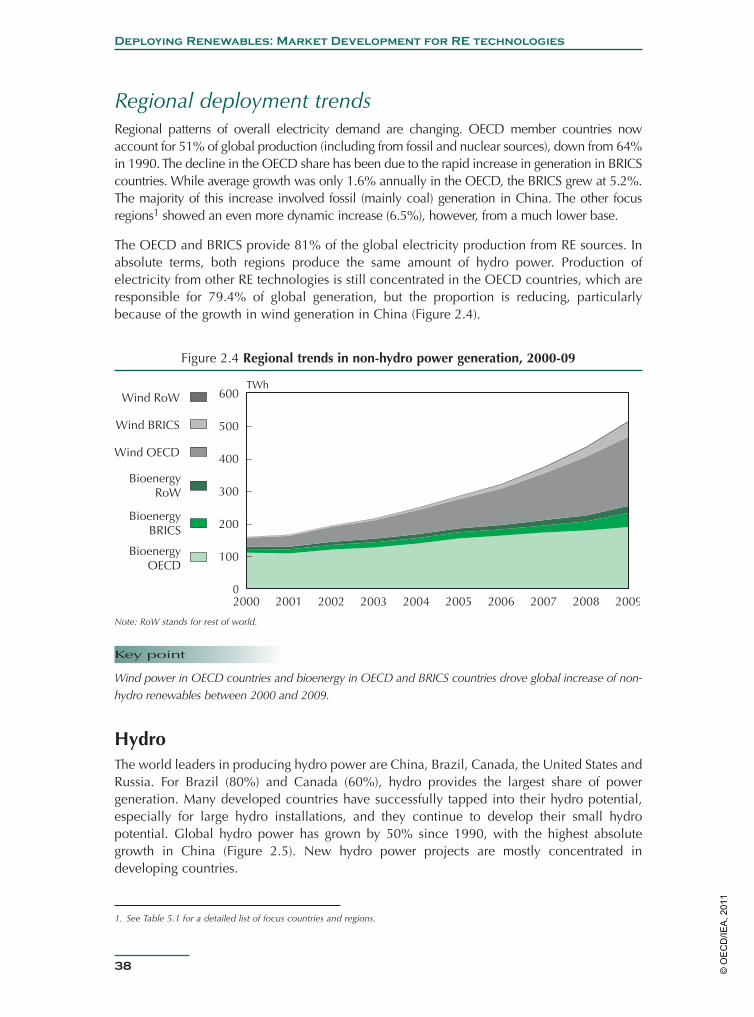
38
Deploying Renewables: Market Development for RE technologies
Regional deployment trendsRegional patterns of overall electricity demand are changing. OECD member countries now account for 51% of global production (including from fossil and nuclear sources), down from 64% in 1990. The decline in the OECD share has been due to the rapid increase in generation in BRICS countries. While average growth was only 1.6% annually in the OECD, the BRICS grew at 5.2%. The majority of this increase involved fossil (mainly coal) generation in China. The other focus regions1 showed an even more dynamic increase (6.5%), however, from a much lower base.
The OECD and BRICS provide 81% of the global electricity production from RE sources. In absolute terms, both regions produce the same amount of hydro power. Production of electricity from other RE technologies is still concentrated in the OECD countries, which are responsible for 79.4% of global generation, but the proportion is reducing, particularly because of the growth in wind generation in China (Figure 2.4).
Figure 2.4 Regional trends in non-hydro power generation, 2000-09
0
100
200
300
400
500
600
BioenergyOECD
Bioenergy BRICS
BioenergyRoW
Wind OECD
Wind BRICS
Wind RoW
2000 2001 2002 2003 2004 2005 2006 2007 2008 2009
TWh
Note: RoW stands for rest of world.
Key point
Wind power in OECD countries and bioenergy in OECD and BRICS countries drove global increase of non-hydro renewables between 2000 and 2009.
HydroThe world leaders in producing hydro power are China, Brazil, Canada, the United States and Russia. For Brazil (80%) and Canada (60%), hydro provides the largest share of power generation. Many developed countries have successfully tapped into their hydro potential, especially for large hydro installations, and they continue to develop their small hydro potential. Global hydro power has grown by 50% since 1990, with the highest absolute growth in China (Figure 2.5). New hydro power projects are mostly concentrated in developing countries.
1. See Table 5.1 for a detailed list of focus countries and regions.
031-64 Chap_1et2_AIE RENEWABLES.indd 38031-64 Chap_1et2_AIE RENEWABLES.indd 38 09/11/11 11:3109/11/11 11:31
© O
EC
D/IE
A, 2
011

Chapter 2: Market Development for RE technologies
39
Figure 2.5 Developments in hydro power generation, 2000-09
0
500
1 000
1 500
2 000
2 500
3 000
3 500
2000 2001 2002 2003 2004 2005 2006 2007 2008 2009
TWhRoW
Norway,India,
Venezuela,Japan,
Sweden
Russia
United States
Brazil
Canada
China
Key point
Increase in global hydro generation was concentrated in a few countries – mainly China – between 2000 and 2009.
In the next decade, hydro power will increase by approximately 180 GW of installed capacity if projects currently under construction proceed as planned. This increase corresponds to roughly one-quarter of currently installed capacity. One-third of this increase will be in China alone. Among OECD countries, Turkey will see the largest capacity additions. Brazil and India also have a large capacity under construction (Figure 2.6).
Figure 2.6 Global hydropower projects under construction, additional cumulative capacity by year of expected commissioning
0
20
40
60
80
100
120
140
160
180
200
2010 2011 2012 2013 2014 2015 2016 2017 2018 2019 2020
GWRoW
China
India
Brazil
ASEAN-9
Turkey
OECD*
Note: *OECD excluding Turkey.
Key point
One-third of the 180 GW global increases in hydro capacity until 2020 will occur in China.
031-64 Chap_1et2_AIE RENEWABLES.indd 39031-64 Chap_1et2_AIE RENEWABLES.indd 39 09/11/11 11:3109/11/11 11:31
© O
EC
D/IE
A, 2
011

40
Deploying Renewables: Market Development for RE technologies
WindGlobal wind energy production increased by 870% from 2000 to 2009, and by 260% from 2005 to 2009 (Figure 2.7). Globally, wind power has contributed the largest share of non-hydro renewable electricity since 2009, when it took over the leading position from biomass.
During the first half of the decade, Germany, Spain and the United States were responsible for the majority of the increase in deployed capacity and generation. In the case of the United States, deployment followed a series of boom-and-bust cycles.
The picture changed, starting from 2005, when mass deployment of wind energy began in China. In 2009, China deployed more wind turbine capacity than any other country in the world (GWEC [Global Wind Energy Council], 2011), and in 2010, half of the new capacity was installed there. At the same time, the number of new installations fell dramatically in the United States, as regulatory uncertainty exacerbated the negative impacts of the financial and economic crisis. Although Chinese capacity figures need to be interpreted with caution (because about 25% of capacity remained unconnected at the end of 2010), the overall trend is clear: the centre of gravity for wind energy markets has begun to shift to Asia, namely to China.
Figure 2.7 Evolution of wind installed capacity (including offshore), 2000-10
0
50
100
150
200
2000 2001 2002 2003 2004 2005 2006 2007 2008 2009 2010
GWRoW
India
Spain
Germany
United States
China
Source: Derived from IEA data and GWEC (2010).
Key point
China became the largest market for wind energy, having outrun the United States in 2009 in terms of newly installed capacity.
BioenergyElectricity supply from bioenergy has been rising steadily since 2000, and in 2009, bioenergy provided some 248 TWh of electricity, equivalent to 1.24% of global production. Power generation from biomass is still concentrated in OECD countries, but China and Brazil are also becoming increasingly important producers (Figure 2.8). Currently, bioenergy electricity is principally derived through combustion and power generation via steam turbines. Co-firing
031-64 Chap_1et2_AIE RENEWABLES.indd 40031-64 Chap_1et2_AIE RENEWABLES.indd 40 09/11/11 11:3109/11/11 11:31
© O
EC
D/IE
A, 2
011

Chapter 2: Market Development for RE technologies
41
of biomass with coal is an increasingly important route for using biomass for power production at a large scale. IEA Bioenergy Task 32’s on-line database that tracks co-firing globally now has over 200 entries (IEABCC [International Energy Agency Biomass Combustion and Cofiring], 2011). The long-term potential for bioenergy will be determined by the likely availability and costs of the fuel feedstocks. Thus the potential is inevitably uncertain because of the many factors influencing the availability of suitable wastes, residues and other potential fuels including energy crops. A study carried out for this publication (see Müller, Marmion and Beerepoot, 2011) estimates the bioenergy potential for heat and power in all 56 focus countries at 99 EJ. Moderate bioenergy scenarios suggest that, by 2050, the annual sustainable bioenergy potential could be between 200 and 500 EJ (IEA, 2011c). Residues from forestry and agriculture and other organic wastes could provide between 50 and 150EJ/y, with the remainder coming from surplus forestry growth or from energy crops (IEA, 2011c).
Figure 2.8 Global bioenergy power production, 2000-09
0
50
100
150
200
250
300
2000 2001 2002 2003 2004 2005 2006 2007 2008 2009
TWh
United States
Germany
China
Brazil
Japan
RoW
Key point
Bioenergy for power production grew most strongly in Germany and most recently in China.
Solar PVFrom 2000 to 2010, in terms of the annual rate of market growth, solar PV was the fastest-growing RE technology worldwide. Estimates suggest that cumulative installed capacity of solar PV reached roughly 40 GW at the end of 2010, up from 1.5 GW in 2000 (Figure 2.9). At least 17 GW were added in 2010, about 7.4 GW alone in Germany (BNA [Bundes netzorgentur], 2011). Based on first available data for 2010, Germany maintains its massive lead in the market. Italy and the Czech Republic have also seen a solar PV boom, as a result of generous feed-in tariffs (FITs) and rapidly decreasing costs.
In 2009, the last year for which a full data set is available, Germany, Spain, Japan, the United States, Italy and Korea accounted for over 90% of global cumulative PV capacity. PV growth in the United States has remained stable, while Japan continues to lead the way in Asia, adding almost 500 MW in 2009. China has announced ambitious targets, and over the next few years, China is likely to complement its role as a leader in PV manufacturing and export by also becoming a large domestic market.
031-64 Chap_1et2_AIE RENEWABLES.indd 41031-64 Chap_1et2_AIE RENEWABLES.indd 41 09/11/11 11:3109/11/11 11:31
© O
EC
D/IE
A, 2
011

42
Deploying Renewables: Market Development for RE technologies
Figure 2.9 Global installed PV capacity, 2005-10
2005 2006 2007 2008 2009 2010
GW
+29%+35%
+70%
+47%
+74%
0
5
10
15
20
25
30
35
40
45RoW
Czech Republic
United States
Italy
Japan
Spain
Germany
Source: Derived from IEA data and IEAPVPS (International Energy Agency Photovoltaic Power Systems Programme, 2011); BP (2011); BNEF (2011a); ErDF (Électricité Réseau Distribution France, 2011); BNA (2011).
Key point
Global solar PV capacity increased sharply due to strong growth in a few markets.
The regional distribution of PV module production shows a very different trend (Figure 2.10). As the overall production grew from 7 517 MW in 2009 to 18 097 MW in 2010, China became the world’s largest manufacturer of solar modules. It increased its share in global production from 39% in 2009 to 55% in 2010. Cell manufacturers in other countries, especially those with company headquarters in the United States, lost market share. The contribution from American manufacturers decreased from 23% in 2009 to 13% in 2010.
GeothermalOverall growth in geothermal electricity generation reached 17.8% between 2005 and 2009. Geothermal electricity provides a significant share of total electricity demand in Iceland (25%), El Salvador (22%), Kenya and the Philippines (17% each), and Costa Rica (13%). In absolute figures, in 2009, the United States produced the most geothermal electricity: 16 603 GWhe/yr from an installed capacity of 3 093 MWe (Figure 2.11).
Cost trends and scope for improvementThe growth in RE global capacity and contribution to electricity supply has been accompanied by cost reductions, particularly for onshore wind and solar. Cost reduction trends are not so easy to follow or to project for the other leading technologies (hydro, bioenergy and geothermal). These technologies are much better established in the market and rely on standard engineering components, such as boilers, turbines, etc. Some scope for cost reduction, nonetheless, exists for these technologies, too.
031-64 Chap_1et2_AIE RENEWABLES.indd 42031-64 Chap_1et2_AIE RENEWABLES.indd 42 09/11/11 11:3109/11/11 11:31
© O
EC
D/IE
A, 2
011
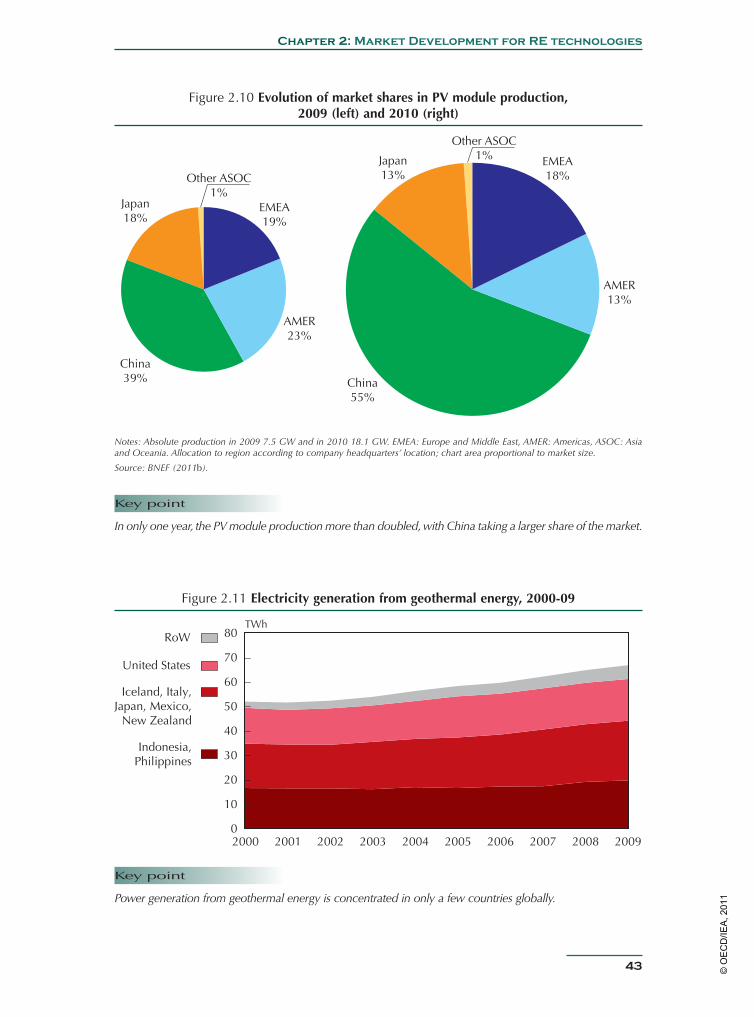
Chapter 2: Market Development for RE technologies
43
Figure 2.10 Evolution of market shares in PV module production, 2009 (left) and 2010 (right)
Other ASOC1% EMEA
18%
AMER13%
Japan13%
China55%
Other ASOC1%
EMEA19%
AMER23%
Japan18%
China39%
Notes: Absolute production in 2009 7.5 GW and in 2010 18.1 GW. EMEA: Europe and Middle East, AMER: Americas, ASOC: Asia and Oceania. Allocation to region according to company headquarters’ location; chart area proportional to market size.
Source: BNEF (2011b).
Key point
In only one year, the PV module production more than doubled, with China taking a larger share of the market.
Figure 2.11 Electricity generation from geothermal energy, 2000-09
0
10
20
30
40
50
60
70
80RoW
United States
Iceland, Italy,Japan, Mexico,
New Zealand
Indonesia,Philippines
TWh
2000 2001 2002 2003 2004 2005 2006 2007 2008 2009
Key point
Power generation from geothermal energy is concentrated in only a few countries globally.
031-64 Chap_1et2_AIE RENEWABLES.indd 43031-64 Chap_1et2_AIE RENEWABLES.indd 43 09/11/11 11:3109/11/11 11:31
© O
EC
D/IE
A, 2
011

44
Deploying Renewables: Market Development for RE technologies
HydroIn many cases, hydro power provides low-cost electricity competitively without financial support.
The initial investment needs for particular projects must be studied individually due to the unique nature of each hydro power project. Construction costs for new hydro power projects in OECD countries are usually less than USD 2 million/MW for large-scale hydro (> 300 MW), and USD 2 to 4 million/MW for small- and medium-scale hydro (< 300 MW). Parameters affecting investment costs and the return on investment include the project scale, which can range from over 10 000 MW to less than 0.1 MW; the project location; the presence and size of reservoir(s); the use of the power supplied for baseload or peak load or both; and possible other benefits alongside power production, such as flood control, irrigation, freshwater supply, etc. Operation and maintenance costs are estimated at between USD 5 to 20/MWh for new medium to large hydro plants and approximately twice as much for small hydro (IEA, 2010c).
The generation costs of electricity from new hydro power plants vary widely, although they are often in a range of USD 50 to 100/MWh. Generation costs per MWh are determined by the amount of electricity produced annually. Many hydro power plants are deliberately operated for peak-load demands and backup for frequency fluctuation, which increases both the generation costs and the value of the electricity produced. Because most of the generation cost is associated with the depreciation of fixed assets, the generation cost decreases if the projected plant lifetime is extended. As such, the financial regime is a key factor. Many hydro power plants built 50 to 100 years ago are fully amortised and continue to operate efficiently (IEA, 2010c).
The capacity of many existing hydro power plants could be raised by 5 to 20% through the installation of new and more efficient turbines. Such refurbishment projects may be easier to accomplish than new plants from a technical and social point of view and would provide faster and more cost-effective additional generation than new plant construction (IEA, 2010c).
WindWind power is already among the most cost-competitive renewable energy sources in areas where the wind resource is good. Depending on turbine prices, financing modalities, and environmental factors (such as resource and accessibility of site), the cost of onshore wind power is currently in the range of about USD 40-160/MWh.2
Since the start of mass deployment of wind energy in the early 1980s, prices of wind turbines have seen sharp cost reductions that were reflected in shrinking investment costs of wind power projects. Still today, technology efficiency gains are ongoing (Figure 2.12). More improved towers, efficient blades and drive trains, lighter nacelles (rotor plus generator) and fewer components mean a higher electricity output per unit of materials required in the manufacturing process. In addition, the manufacturing process can still be further optimised (IPCC, 2011).
Market conditions, e.g. surging demand in times of boom in key markets such as the United States, as well as fluctuations in commodity prices (steel and copper), have a notable impact on turbine prices. In addition, certain manufacturers have a very large share in some national
2. Assumptions: total project costs of USD 1 400 to USD 2 500 per kW, annual operation and maintenance of 2.5% of project costs, full load hours between 1 800 and 3 500, weighted average cost of capital of 6.5% and a project lifetime between 25 to 20 years.
031-64 Chap_1et2_AIE RENEWABLES.indd 44031-64 Chap_1et2_AIE RENEWABLES.indd 44 09/11/11 11:3109/11/11 11:31
© O
EC
D/IE
A, 2
011
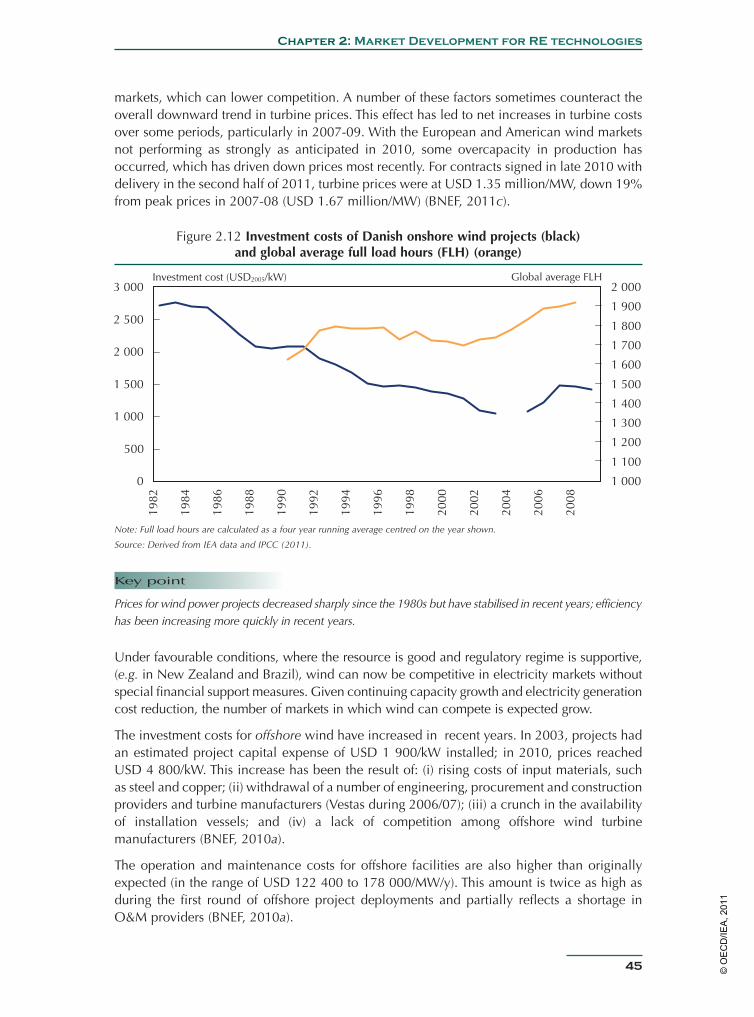
Chapter 2: Market Development for RE technologies
45
markets, which can lower competition. A number of these factors sometimes counteract the overall downward trend in turbine prices. This effect has led to net increases in turbine costs over some periods, particularly in 2007-09. With the European and American wind markets not performing as strongly as anticipated in 2010, some overcapacity in production has occurred, which has driven down prices most recently. For contracts signed in late 2010 with delivery in the second half of 2011, turbine prices were at USD 1.35 million/MW, down 19% from peak prices in 2007-08 (USD 1.67 million/MW) (BNEF, 2011c).
Figure 2.12 Investment costs of Danish onshore wind projects (black) and global average full load hours (FLH) (orange)
Investment cost (USD2005/kW)
0
500
1 000
1 500
2 000
2 500
3 000
1 000
1 100
1 200
1 300
1 400
1 500
1 600
1 700
1 800
1 900
2 000Global average FLH
1982
1984
1986
1988
1990
1992
1994
1996
1998
2000
2002
2004
2006
2008
Note: Full load hours are calculated as a four year running average centred on the year shown.
Source: Derived from IEA data and IPCC (2011).
Key point
Prices for wind power projects decreased sharply since the 1980s but have stabilised in recent years; efficiency has been increasing more quickly in recent years.
Under favourable conditions, where the resource is good and regulatory regime is supportive, (e.g. in New Zealand and Brazil), wind can now be competitive in electricity markets without special financial support measures. Given continuing capacity growth and electricity generation cost reduction, the number of markets in which wind can compete is expected grow.
The investment costs for offshore wind have increased in recent years. In 2003, projects had an estimated project capital expense of USD 1 900/kW installed; in 2010, prices reached USD 4 800/kW. This increase has been the result of: (i) rising costs of input materials, such as steel and copper; (ii) withdrawal of a number of engineering, procurement and construction providers and turbine manufacturers (Vestas during 2006/07); (iii) a crunch in the availability of installation vessels; and (iv) a lack of competition among offshore wind turbine manufacturers (BNEF, 2010a).
The operation and maintenance costs for offshore facilities are also higher than originally expected (in the range of USD 122 400 to 178 000/MW/y). This amount is twice as high as during the first round of offshore project deployments and partially reflects a shortage in O&M providers (BNEF, 2010a).
031-64 Chap_1et2_AIE RENEWABLES.indd 45031-64 Chap_1et2_AIE RENEWABLES.indd 45 09/11/11 11:3109/11/11 11:31
© O
EC
D/IE
A, 2
011

46
Deploying Renewables: Market Development for RE technologies
The estimated levelised costs of electricity (LCOE) generation for offshore projects commissioned in 2010 range between approximately ct USD 0.18/kWh and ct USD 0.19/kWh, other estimates range between ct USD 0.10/kWh and ct USD 0.19/kWh. This figure is bound to increase, however, for projects coming on-line in the near future. LCOE are very sensitive to delays in construction, because early revenues count most in calculating project returns. A project delay of one year translates into an increase of LCOE on the order of 5-10% (BNEF, 2010a).
The further maturation of the market, especially learning-by-doing effects regarding deployment and increased competition along the offshore value chain, promise future cost reductions. Given the ambitious deployment plans of governments in the United Kingdom and Germany, however, increased demand may be reflected in continuously high prices, similar to what was observed in solar PV between 2000 and 2005.
BioenergyIn favourable circumstances (for example, where the fuel resource is low cost or its use as fuel avoids disposal costs), producing electricity from biomass can be cost competitive. The costs of heat and/or power production from bioenergy depend, however, not only on the technology and operational scale but also on the quality, type, availability and cost of biomass feedstocks, and on the pattern of energy demand (especially whether there is a steady demand for heat). As a result, cost estimates are inevitably in a wide range. The investment costs for a biomass plant with a capacity of 25-100 MWe are between USD 2 600/kW and USD 4 100/kW. With a fuel cost of USD 1.25/GJ to USD 5/GJ, the electricity cost would be between USD 0.069/kWh and USD 0.15/kWh at a 7% discount rate (IPCC, 2011). The capital cost of co-firing is much lower (USD 430/kW to USD 900/kW, depending on configuration) and, at the same fuel costs, provides electricity at USD 0.022/kWh to USD 0.067/kWh (IPCC, 2011).
Many key components of bioenergy systems (such as boilers) are very well established, and the scope for cost reduction may be limited. Considerable scope for overall project cost reduction may still be available, however, through cost-effective design and plant standardisation, where this is possible. Costs can be expected to fall in particular markets as capacity grows and stimulates larger-scale, and more competitive supply chain opportunities for equipment and more efficient fuel supply chains.
Solar PVDepending on insolation levels, electricity from PV is competitive now in many off-grid and remote situations, and is coming close to being competitive with retail power prices in favourable markets, which have high insolation levels and high peak power prices. In most markets, however, a considerable price gap still exists, so deployment is still dependent on financially supportive policies.
Current spot market prices for solar modules are between USD 1.80/Wp and USD 2.27/Wp for crystalline modules and between USD 1.37/Wp and USD 1.65/Wp for thin-film modules (pvXchange, 2011). Prices vary significantly between markets, however. Total system costs (in June 2011) are between USD 3 300/kWp and USD 5 800/kWp for rooftop systems and between USD 2 700/kWp and USD 4 100/kWp for ground-mounted systems (IEAPVPS, 2011; BSW [Bundesverband Solarwirtschaft], 2011). Note that these costs are decreasing quickly and may well be out of date at the time of publication. The resulting generation costs depend on cost of capital and insulation. Taking the above system costs, levelised costs of
031-64 Chap_1et2_AIE RENEWABLES.indd 46031-64 Chap_1et2_AIE RENEWABLES.indd 46 09/11/11 11:3109/11/11 11:31
© O
EC
D/IE
A, 2
011
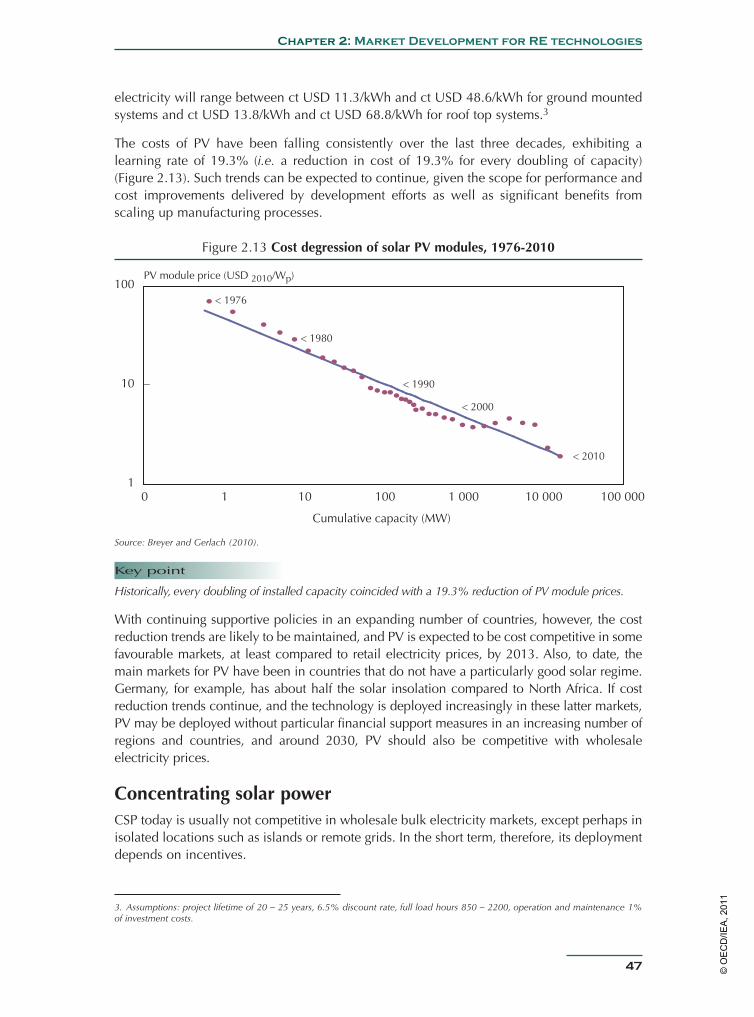
Chapter 2: Market Development for RE technologies
47
electricity will range between ct USD 11.3/kWh and ct USD 48.6/kWh for ground mounted systems and ct USD 13.8/kWh and ct USD 68.8/kWh for roof top systems.3
The costs of PV have been falling consistently over the last three decades, exhibiting a learning rate of 19.3% (i.e. a reduction in cost of 19.3% for every doubling of capacity) (Figure 2.13). Such trends can be expected to continue, given the scope for performance and cost improvements delivered by development efforts as well as significant benefits from scaling up manufacturing processes.
Figure 2.13 Cost degression of solar PV modules, 1976-2010
< 1976
< 1980
< 1990
< 2000
< 2010
1
10
100
1 0 10 100 1 000 10 000 100 000
Cumulative capacity (MW)
PV module price (USD 2010/Wp)
Source: Breyer and Gerlach (2010).
Key point
Historically, every doubling of installed capacity coincided with a 19.3% reduction of PV module prices.
With continuing supportive policies in an expanding number of countries, however, the cost reduction trends are likely to be maintained, and PV is expected to be cost competitive in some favourable markets, at least compared to retail electricity prices, by 2013. Also, to date, the main markets for PV have been in countries that do not have a particularly good solar regime. Germany, for example, has about half the solar insolation compared to North Africa. If cost reduction trends continue, and the technology is deployed increasingly in these latter markets, PV may be deployed without particular financial support measures in an increasing number of regions and countries, and around 2030, PV should also be competitive with wholesale electricity prices.
Concentrating solar powerCSP today is usually not competitive in wholesale bulk electricity markets, except perhaps in isolated locations such as islands or remote grids. In the short term, therefore, its deployment depends on incentives.
3. Assumptions: project lifetime of 20 – 25 years, 6.5% discount rate, full load hours 850 – 2200, operation and maintenance 1% of investment costs.
031-64 Chap_1et2_AIE RENEWABLES.indd 47031-64 Chap_1et2_AIE RENEWABLES.indd 47 09/11/11 11:3109/11/11 11:31
© O
EC
D/IE
A, 2
011
48
Deploying Renewables: Market Development for RE technologies
For large (50 MW), state-of-the-art trough plants, current investment costs are USD 4.2/W to USD 8.4/W, depending on labour and land costs, the amount and distribution of direct normal irradiance (DNI) and, above all, the amount of storage and the size of the solar field (IEA, 2010d). Plants without storage that benefit from excellent DNI are on the low side of the investment cost range; conversely, plants with large storage and a higher load factor but at locations with lower DNI (around 2000 kWh/m2/year) are on the high side. Depending primarily on capital costs and resource, costs of electricity generation can range between USD 0.18/kWh and USD 0.30/kWh. Storage capacity has comparably low impacts on levelised costs. Primarily, storage is incorporated to shift electricity production and not because of its effect on levelised costs.
Investment costs per watt are expected to decrease for larger trough plants, going down by 12% when moving from 50 MW to 100 MW, and by about 20% when scaling up to 200 MW (IEA, 2010d). Costs associated with power blocks, balance-of-plant and grid connection are expected to drop by 20%–25% as plant capacity doubles. Investment costs are also likely to be driven down by increased competition among technology providers, mass production of components and greater experience in the financial community with investing in CSP projects. Investment costs for trough plants could fall by 10%–20% with implementation of direct steam generation (DSG), which allows higher working temperatures and better efficiencies. Turbine manufacturers will need to develop effective power blocks for the CSP industry. In total, investment costs have the potential to be reduced by 30%–40% in the next decade (IEA, 2010d).
GeothermalWhere an accessible high-temperature geothermal resource exists, generation costs can be competitive with alternatives.
Geothermal electricity development costs vary considerably, because they depend on a wide range of conditions, and whether the project is a greenfield site or expansion of an existing plant. Development costs are also strongly affected by the prices of commodities such as oil, steel and cement. In 2008, the capital costs of a greenfield geothermal electricity development ranged from USD 2 000/kWe to USD 4 000/kWe for flash plant developments and USD 2 400/kWe to USD 5 900/kWe for binary developments (IEA, 2011d).
Typical O&M costs also vary depending on the plant. They range from USD 9/MWhe (large flash, binary in New Zealand) to USD 25/MWhe (small binary in the United States), excluding well replacement drilling costs (IEA, 2011d). When make-up wells are considered to be part of O&M costs, which is common in the geothermal electric industry, O&M costs are estimated at USD 19/MWhe to USD 24 /MWhe as a worldwide average (IPCC, 2011), although they can be as low as USD 10/MWhe to USD 14 /MWhe in New Zealand (Barnett and Quinlivan, 2009).
On average, production costs for hydrothermal high-temperature flash plants have been calculated to range from USD 50/MWhe to USD 80/MWhe. Production costs of hydrothermal binary plants vary on average from USD 60/MWhe to USD 110/MWhe. Some binary plants have higher upper limits: levelised costs for new greenfield plants can be as high as USD 120/MWhe in the United States and USD 200/MWhe in Europe, for small plants and lower-temperature resources (IEA, 2011d).
031-64 Chap_1et2_AIE RENEWABLES.indd 48031-64 Chap_1et2_AIE RENEWABLES.indd 48 09/11/11 11:3109/11/11 11:31
© O
EC
D/IE
A, 2
011
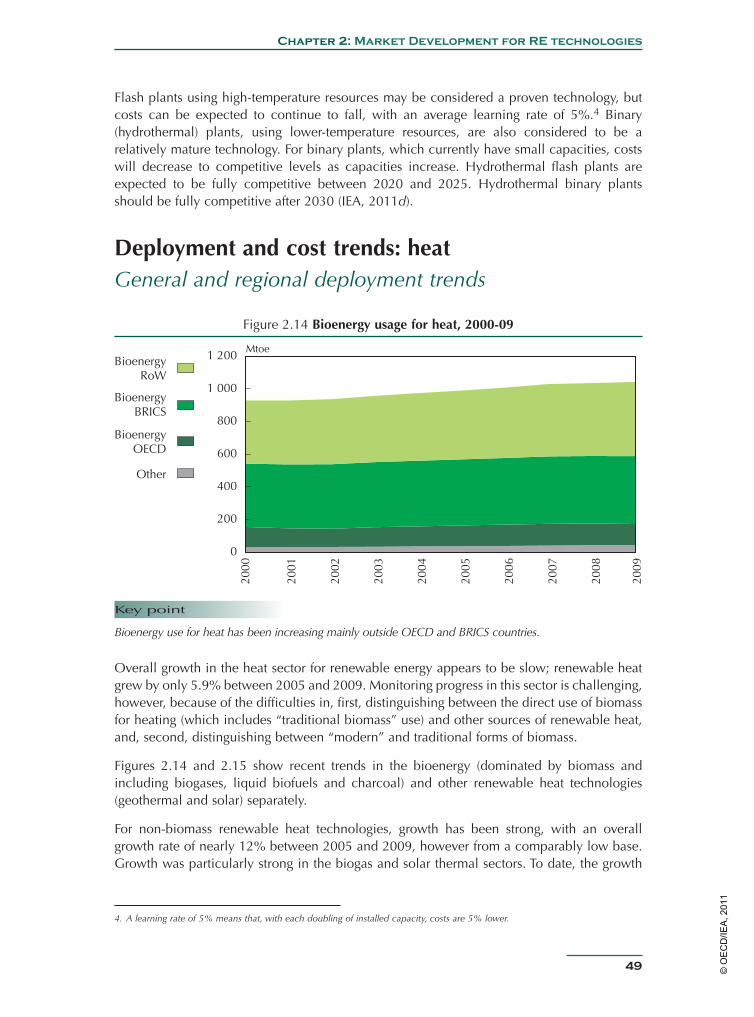
Chapter 2: Market Development for RE technologies
49
Flash plants using high-temperature resources may be considered a proven technology, but costs can be expected to continue to fall, with an average learning rate of 5%.4 Binary (hydrothermal) plants, using lower-temperature resources, are also considered to be a relatively mature technology. For binary plants, which currently have small capacities, costs will decrease to competitive levels as capacities increase. Hydrothermal flash plants are expected to be fully competitive between 2020 and 2025. Hydrothermal binary plants should be fully competitive after 2030 (IEA, 2011d).
Deployment and cost trends: heatGeneral and regional deployment trends
Figure 2.14 Bioenergy usage for heat, 2000-09
Mtoe
2000
2001
2002
2003
2004
2005
2006
2007
2008
2009
0
200
400
600
800
1 000
1 200BioenergyRoW
BioenergyBRICS
BioenergyOECD
Other
Key point
Bioenergy use for heat has been increasing mainly outside OECD and BRICS countries.
Overall growth in the heat sector for renewable energy appears to be slow; renewable heat grew by only 5.9% between 2005 and 2009. Monitoring progress in this sector is challenging, however, because of the difficulties in, first, distinguishing between the direct use of biomass for heating (which includes “traditional biomass” use) and other sources of renewable heat, and, second, distinguishing between “modern” and traditional forms of biomass.
Figures 2.14 and 2.15 show recent trends in the bioenergy (dominated by biomass and including biogases, liquid biofuels and charcoal) and other renewable heat technologies (geothermal and solar) separately.
For non-biomass renewable heat technologies, growth has been strong, with an overall growth rate of nearly 12% between 2005 and 2009, however from a comparably low base. Growth was particularly strong in the biogas and solar thermal sectors. To date, the growth
4. A learning rate of 5% means that, with each doubling of installed capacity, costs are 5% lower.
031-64 Chap_1et2_AIE RENEWABLES.indd 49031-64 Chap_1et2_AIE RENEWABLES.indd 49 09/11/11 11:3109/11/11 11:31
© O
EC
D/IE
A, 2
011
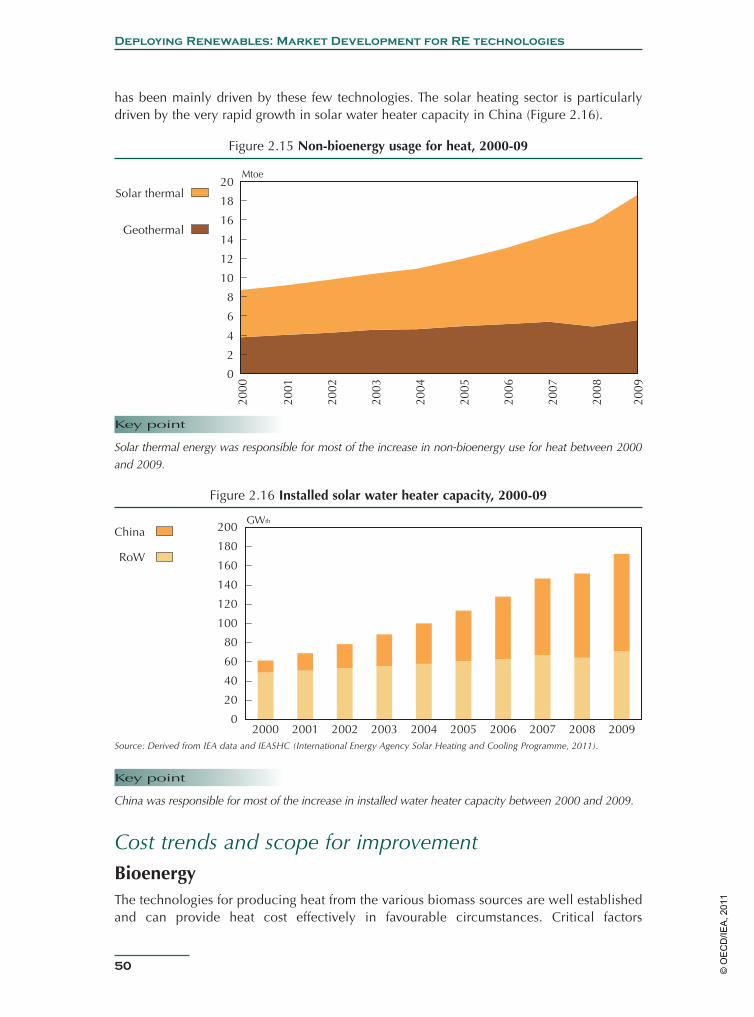
50
Deploying Renewables: Market Development for RE technologies
has been mainly driven by these few technologies. The solar heating sector is particularly driven by the very rapid growth in solar water heater capacity in China (Figure 2.16).
Figure 2.15 Non-bioenergy usage for heat, 2000-09
Mtoe
0
2
4
6
8
10
12
14
16
18
20
2000
2001
2002
2003
2004
2005
2006
2007
2008
2009
Solar thermal
Geothermal
Key point
Solar thermal energy was responsible for most of the increase in non-bioenergy use for heat between 2000 and 2009.
Figure 2.16 Installed solar water heater capacity, 2000-09
GWth
0
20
40
60
80
100
120
140
160
180
200
2000 2001 2002 2003 2004 2005 2006 2007 2008 2009
China
RoW
Source: Derived from IEA data and IEASHC (International Energy Agency Solar Heating and Cooling Programme, 2011).
Key point
China was responsible for most of the increase in installed water heater capacity between 2000 and 2009.
Cost trends and scope for improvementBioenergyThe technologies for producing heat from the various biomass sources are well established and can provide heat cost effectively in favourable circumstances. Critical factors
031-64 Chap_1et2_AIE RENEWABLES.indd 50031-64 Chap_1et2_AIE RENEWABLES.indd 50 09/11/11 11:3109/11/11 11:31
© O
EC
D/IE
A, 2
011
Chapter 2: Market Development for RE technologies
51
influencing the competitiveness of bioenergy heating systems include the scale, heat load constancy, and the availability and cost of the fuels. System and fuel costs also vary significantly between markets. The scale of heating plants, for example, can vary between 5 kW and many megawatts. At a small scale, investment costs vary between USD 310/kWth and USD 1 200/kWth (IPCC, 2011).
Significant cost reduction potential is limited, although costs can be expected to fall in particular markets as capacity grows, stimulating larger-scale and more competitive supply chain opportunities, for equipment and more efficient fuel supply chains. The Carbon Trust in the United Kingdom has estimated that, during the market development phase, capital cost reductions of around 25% should be possible (Carbon Trust, 2007).
Solar water heatingThe costs of providing heat from solar collectors depend greatly on the solar resource available in a particular location and on the availability of a supply chain operating at sufficient scale to provide low-cost collectors. In favourable circumstances, however, the technology can be cost effective. A cost comparison of water heaters in China, for example, indicates that, although the upfront cost of solar water heaters is higher than electric or gas water heaters, the average annual cost over the heater lifetime is considerably lower (IEA, 2010a).
GeothermalBased on the range of capital and operating costs that apply for power generation, geothermal heat may be competitive for district heating where a resource with sufficiently high temperature is available and an adaptable district heating system is in place. Geothermal heat may also be competitive in applications where a high, continuous heat demand exists and where no need exists for a large distribution system, e.g. greenhouses (IEA, 2011d).
Deployment and cost trends: transportGeneral and regional deployment trendsWell-developed and commercial processes are available today to produce biofuels. These processes include sugar- and starch-based ethanol, oil-crop-based biodiesel, and biogas derived from anaerobic digestion processes. Typical feedstocks used in these processes include sugarcane and sugar beet, starch-bearing grains such as corn and wheat, oil crops such as rape (canola), soybean and oil palm, and, in some cases, animal fats and used cooking oils.
Renewable fuels such as bioethanol and biodiesel have been expanding rapidly and currently supply about 2% of total global transport fuel requirements, or about 3% of road transport fuel.
The renewable transport sector has been growing at a much higher rate than the electricity sector, at an average annual growth rate of 20% since 2000 and an average annual growth rate of 26% since 2005. Production is currently dominated by ethanol in Brazil (where an ethanol for fuel programme was initiated in the 1970s) and in the United States, stimulated
031-64 Chap_1et2_AIE RENEWABLES.indd 51031-64 Chap_1et2_AIE RENEWABLES.indd 51 09/11/11 11:3109/11/11 11:31
© O
EC
D/IE
A, 2
011

52
Deploying Renewables: Market Development for RE technologies
by the ambitious targets associated with the Renewable Fuel Standard (Figure 2.17). In the European Union, where growth has been driven by the specific biofuels requirements under the Renewable Energy Directive, the emphasis has been on biodiesel production.
Figure 2.17 Development of biofuels markets, 2000-09
Mtoe
0
10
20
30
40
50
60
2000 2001 2002 2003 2004 2005 2006 2007 2008 2009
RoWbiofuels
Brazilbioethanol
United Statesbioethanol
EU-27biodiesel
Key Point
Global biofuels production is concentrated in Brazil, the United States and the European Union.
The produced fuels can be blended with gasoline or diesel fuels and used in conventional vehicles (typically in blends of 5%-15%). Ethanol can also be used alone or in much higher blends in modified or “flex-fuel” vehicles. Methane gas produced from biomass via anaerobic digestion can be used as a vehicle fuel, possibly blended with methane from fossil fuel sources.
These routes to biofuels could be readily deployed because they are based on well-established and proven technologies, and on widely produced crops. Growth has been concentrated in three major markets: Brazil, the United States and the European Union. Many other countries are initiating blending mandates, and these mandates are likely to be similarly effective in increasing the share of bioethanol or biodiesel blended into road transport fuel. The IEA Medium Term Oil & Gas Markets 2011 (IEA, 2011e) forecasts that biofuels output will rise by nearly 30% by 2016.
Drawbacks associated with these fuels, however, include:
• some limitations on the extent to which the fuels produced can be used by the current vehicle fleet (the so-called blending wall), which can restrict the level of biofuels used. Such restrictions can be addressed by stimulating changes in the vehicle fleet (for example, by encouraging the deployment of “flex-fuel” vehicles that can operate on a wide range of blends of ethanol and gasoline;
• the need for fuel transport and blending infrastructure, which may not be compatible with the existing infrastructure developed for fossil fuels;
• the variability of biodiesel depending on the fuel feedstock; and
• the sensitivity of biofuel production costs to feedstock prices.
031-64 Chap_1et2_AIE RENEWABLES.indd 52031-64 Chap_1et2_AIE RENEWABLES.indd 52 09/11/11 11:3109/11/11 11:31
© O
EC
D/IE
A, 2
011
Chapter 2: Market Development for RE technologies
53
In particular, concerns have been raised about the overall sustainability of the production and use of these fuels. The concerns focus on the competition between food and fuel for the feedstocks and the overall greenhouse gas balance for the production and use of the fuels given the emissions associated with land-use change. These issues have led to policy measures to encourage the production of fuels with better greenhouse gas balance and to constrain the level of biofuels that can be produced from conventional sources and processes.
These concerns have also led to efforts to develop new technologies using fuel feedstocks that do not compete with food production and produce fuels that can replace or be blended with fossil fuels such as gasoline, diesel and kerosene. Such technologies are under development, but even the most mature are just reaching the stage where the first commercial plants are being brought into production, and so the technologies are not generally yet ready for widespread deployment. The IEA Technology Roadmap: Biofuels for Transport (IEA, 2011c) envisages a major shift to these advanced processes over time, and that the role of all but the best-performing conventional biofuels will be reduced.
Taken together, these issues mean that the rate of growth in these markets is likely to slow. The United States is reaching the volumes for corn-based ethanol production to meet the Renewable Fuels Standard. Future growth in the United States will require other fuels that meet the United States’ “advanced biofuels” criteria, and will depend on the success in bringing forward plants capable of producing ethanol from cellulosic raw materials. In Brazil, poor harvests and high world sugar prices are pushing up ethanol prices, reducing production and inhibiting investment in additional capacity. The European Union (EU) Renewable Energy Directive (EU, 2009) contains a requirement to reach 10% biofuels in transport, but concerns have been raised about the overall sustainability of biofuels and the ability to supply fuels that meet the tightening greenhouse gas balance standards. Concerns also exist in the United States and parts of Europe as blending levels approach the “blending wall”; the United States is finding difficulties in moving to an E15 blend, and German consumers are rejecting the move to an E10 rather than E5 blend.
Cost trends and scope for improvement
Bioethanol and biodiesel are not currently cost competitive with gasoline or diesel prices, except in some markets (notably Brazil) when production costs are low (IEA, 2011c).
The costs of producing conventional biofuels are largely based on the costs of the feedstock, which typically make up 45%-70% of overall production costs. The costs are also affected by the income that can be derived from co-products such as Dried Distillers Grains with Solubles (DDGS) or glycerines, or from other energy products such as the electricity that can be produced from residues such as bagasse and lignin, or from excess heat generated. Although these technologies are mature, continuing opportunities are available for cost reductions and improvements in process efficiency (for example, by using more effective amylase enzymes, decreasing ethanol concentration costs, and enhanced use of by-products, etc.)
Production costs, compared to gasoline, may vary in the future (Figure 2.18).
031-64 Chap_1et2_AIE RENEWABLES.indd 53031-64 Chap_1et2_AIE RENEWABLES.indd 53 09/11/11 11:3109/11/11 11:31
© O
EC
D/IE
A, 2
011
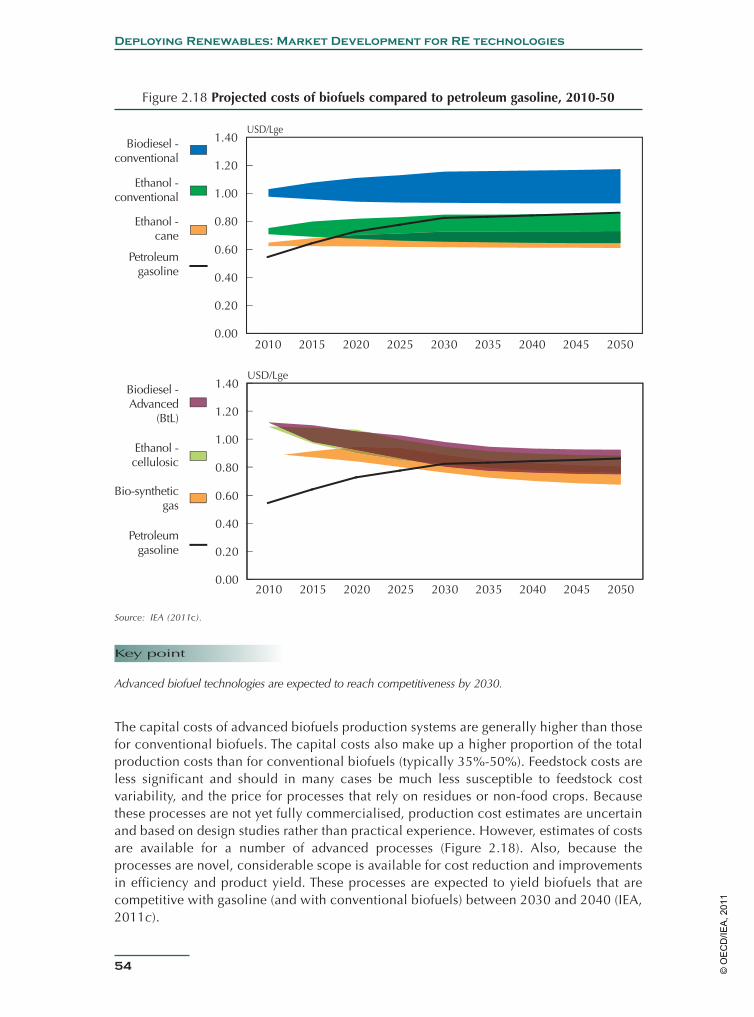
54
Deploying Renewables: Market Development for RE technologies
Figure 2.18 Projected costs of biofuels compared to petroleum gasoline, 2010-50
0.00
0.20
0.40
0.60
0.80
1.00
1.20
1.40
2010 2015 2020 2025 2030 2035 2040 2045 2050
USD/LgeBiodiesel -
conventional
Ethanol -conventional
Petroleumgasoline
Ethanol -cane
USD/Lge
0.00
0.20
0.40
0.60
0.80
1.00
1.20
1.40
2010 2015 2020 2025 2030 2035 2040 2045 2050
Biodiesel -Advanced
(BtL)
Ethanol -cellulosic
Bio-syntheticgas
Petroleumgasoline
Source: IEA (2011c).
Key point
Advanced biofuel technologies are expected to reach competitiveness by 2030.
The capital costs of advanced biofuels production systems are generally higher than those for conventional biofuels. The capital costs also make up a higher proportion of the total production costs than for conventional biofuels (typically 35%-50%). Feedstock costs are less significant and should in many cases be much less susceptible to feedstock cost variability, and the price for processes that rely on residues or non-food crops. Because these processes are not yet fully commercialised, production cost estimates are uncertain and based on design studies rather than practical experience. However, estimates of costs are available for a number of advanced processes (Figure 2.18). Also, because the processes are novel, considerable scope is available for cost reduction and improvements in efficiency and product yield. These processes are expected to yield biofuels that are competitive with gasoline (and with conventional biofuels) between 2030 and 2040 (IEA, 2011c).
031-64 Chap_1et2_AIE RENEWABLES.indd 54031-64 Chap_1et2_AIE RENEWABLES.indd 54 09/11/11 11:3109/11/11 11:31
© O
EC
D/IE
A, 2
011
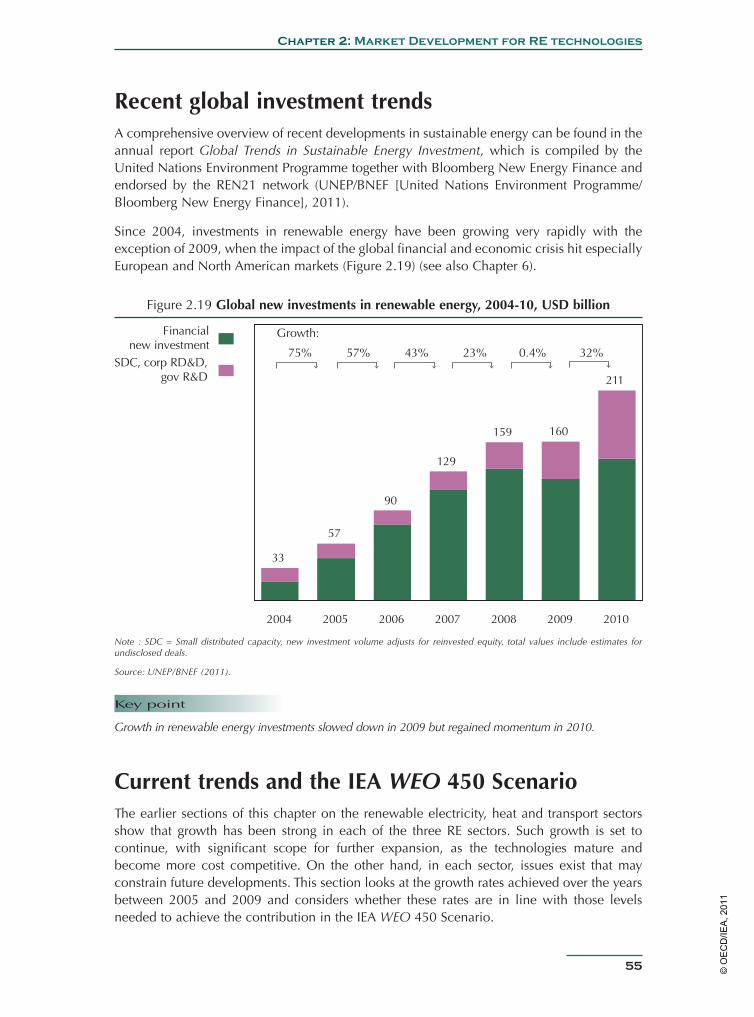
Chapter 2: Market Development for RE technologies
55
Recent global investment trendsA comprehensive overview of recent developments in sustainable energy can be found in the annual report Global Trends in Sustainable Energy Investment, which is compiled by the United Nations Environment Programme together with Bloomberg New Energy Finance and endorsed by the REN21 network (UNEP/BNEF [United Nations Environment Programme/Bloomberg New Energy Finance], 2011).
Since 2004, investments in renewable energy have been growing very rapidly with the exception of 2009, when the impact of the global financial and economic crisis hit especially European and North American markets (Figure 2.19) (see also Chapter 6).
Figure 2.19 Global new investments in renewable energy, 2004-10, USD billion
75% 57% 43% 23% 0.4% 32%
33
57
90
129
159 160
211
2004 2005 2006 2007 2008 2009 2010
Financialnew investment
SDC, corp RD&D,gov R&D
Growth:
Note : SDC = Small distributed capacity, new investment volume adjusts for reinvested equity, total values include estimates for undisclosed deals.
Source: UNEP/BNEF (2011).
Key point
Growth in renewable energy investments slowed down in 2009 but regained momentum in 2010.
Current trends and the IEA WEO 450 ScenarioThe earlier sections of this chapter on the renewable electricity, heat and transport sectors show that growth has been strong in each of the three RE sectors. Such growth is set to continue, with significant scope for further expansion, as the technologies mature and become more cost competitive. On the other hand, in each sector, issues exist that may constrain future developments. This section looks at the growth rates achieved over the years between 2005 and 2009 and considers whether these rates are in line with those levels needed to achieve the contribution in the IEA WEO 450 Scenario.
031-64 Chap_1et2_AIE RENEWABLES.indd 55031-64 Chap_1et2_AIE RENEWABLES.indd 55 09/11/11 11:3109/11/11 11:31
© O
EC
D/IE
A, 2
011
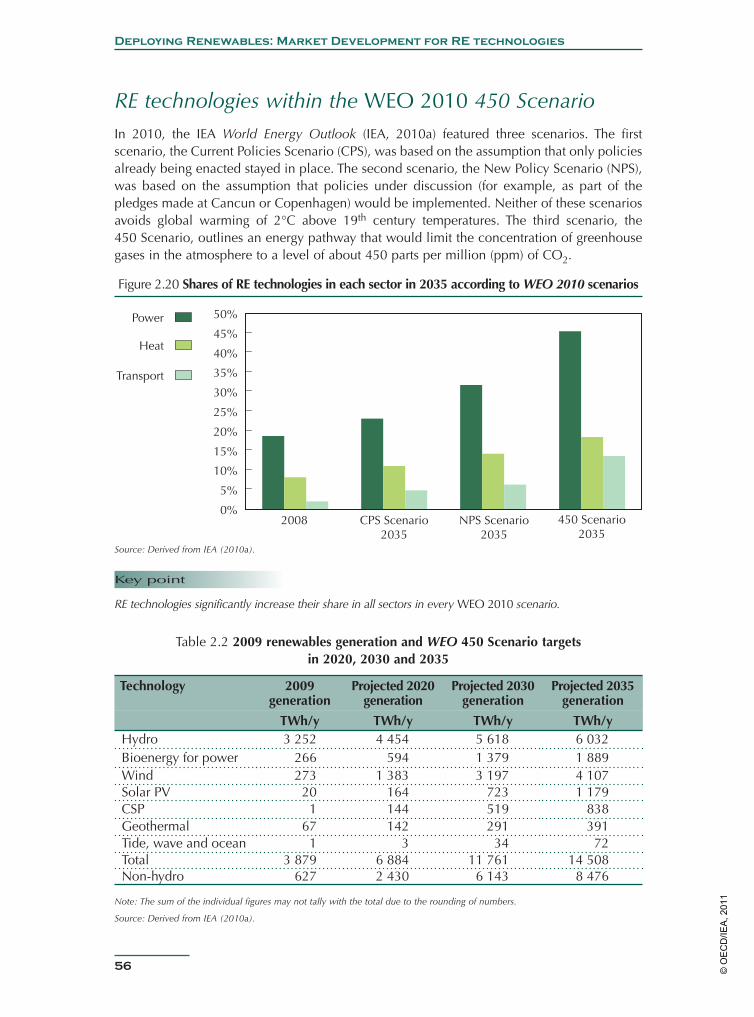
56
Deploying Renewables: Market Development for RE technologies
RE technologies within the WEO 2010 450 ScenarioIn 2010, the IEA World Energy Outlook (IEA, 2010a) featured three scenarios. The first scenario, the Current Policies Scenario (CPS), was based on the assumption that only policies already being enacted stayed in place. The second scenario, the New Policy Scenario (NPS), was based on the assumption that policies under discussion (for example, as part of the pledges made at Cancun or Copenhagen) would be implemented. Neither of these scenarios avoids global warming of 2°C above 19th century temperatures. The third scenario, the 450 Scenario, outlines an energy pathway that would limit the concentration of greenhouse gases in the atmosphere to a level of about 450 parts per million (ppm) of CO2.
Figure 2.20 Shares of RE technologies in each sector in 2035 according to WEO 2010 scenarios
0%
5%
10%
15%
20%
25%
30%
35%
40%
45%
50%
2008 CPS Scenario2035
NPS Scenario2035
450 Scenario2035
Power
Heat
Transport
Source: Derived from IEA (2010a).
Key point
RE technologies significantly increase their share in all sectors in every WEO 2010 scenario.
Table 2.2 2009 renewables generation and WEO 450 Scenario targets in 2020, 2030 and 2035
Technology 2009 generation
Projected 2020 generation
Projected 2030 generation
Projected 2035 generation
TWh/y TWh/y TWh/y TWh/yHydro 3 252 4 454 5 618 6 032Bioenergy for power 266 594 1 379 1 889Wind 273 1 383 3 197 4 107Solar PV 20 164 723 1 179CSP 1 144 519 838Geothermal 67 142 291 391Tide, wave and ocean 1 3 34 72Total 3 879 6 884 11 761 14 508Non-hydro 627 2 430 6 143 8 476
Note: The sum of the individual figures may not tally with the total due to the rounding of numbers.
Source: Derived from IEA (2010a).
031-64 Chap_1et2_AIE RENEWABLES.indd 56031-64 Chap_1et2_AIE RENEWABLES.indd 56 09/11/11 11:3109/11/11 11:31
© O
EC
D/IE
A, 2
011
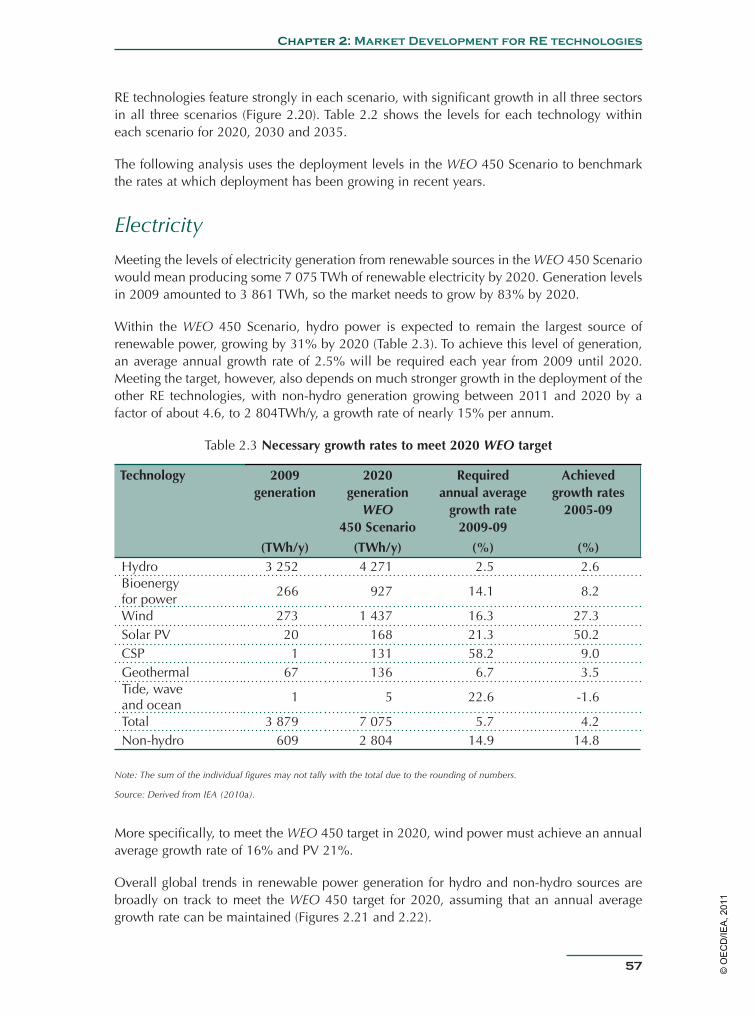
Chapter 2: Market Development for RE technologies
57
RE technologies feature strongly in each scenario, with significant growth in all three sectors in all three scenarios (Figure 2.20). Table 2.2 shows the levels for each technology within each scenario for 2020, 2030 and 2035.
The following analysis uses the deployment levels in the WEO 450 Scenario to benchmark the rates at which deployment has been growing in recent years.
Electricity
Meeting the levels of electricity generation from renewable sources in the WEO 450 Scenario would mean producing some 7 075 TWh of renewable electricity by 2020. Generation levels in 2009 amounted to 3 861 TWh, so the market needs to grow by 83% by 2020.
Within the WEO 450 Scenario, hydro power is expected to remain the largest source of renewable power, growing by 31% by 2020 (Table 2.3). To achieve this level of generation, an average annual growth rate of 2.5% will be required each year from 2009 until 2020. Meeting the target, however, also depends on much stronger growth in the deployment of the other RE technologies, with non-hydro generation growing between 2011 and 2020 by a factor of about 4.6, to 2 804TWh/y, a growth rate of nearly 15% per annum.
Table 2.3 Necessary growth rates to meet 2020 WEO target
Technology 2009 generation
2020 generation
WEO 450 Scenario
Required annual average
growth rate 2009-09
Achieved growth rates
2005-09
(TWh/y) (TWh/y) (%) (%)Hydro 3 252 4 271 2.5 2.6Bioenergy for power
266 927 14.1 8.2
Wind 273 1 437 16.3 27.3Solar PV 20 168 21.3 50.2CSP 1 131 58.2 9.0Geothermal 67 136 6.7 3.5Tide, wave and ocean
1 5 22.6 -1.6
Total 3 879 7 075 5.7 4.2Non-hydro 609 2 804 14.9 14.8
Note: The sum of the individual figures may not tally with the total due to the rounding of numbers.
Source: Derived from IEA (2010a).
More specifically, to meet the WEO 450 target in 2020, wind power must achieve an annual average growth rate of 16% and PV 21%.
Overall global trends in renewable power generation for hydro and non-hydro sources are broadly on track to meet the WEO 450 target for 2020, assuming that an annual average growth rate can be maintained (Figures 2.21 and 2.22).
031-64 Chap_1et2_AIE RENEWABLES.indd 57031-64 Chap_1et2_AIE RENEWABLES.indd 57 09/11/11 11:3109/11/11 11:31
© O
EC
D/IE
A, 2
011

58
Deploying Renewables: Market Development for RE technologies
Figure 2.21 Renewable power generation 2000-09 and WEO 450 projection for 2020
0
50
100
150
200
250
300
350
400
450
500
2000 2001 2002 2003 2004 2005 2006 2007 2008 2009 WEO2020
TWhTide, wave and ocean
CSP
Solar PV
Geothermal
2000 2001 2002 2003 2004 2005 2006 2007 2008 2009 WEO2020
TWh
0
200
400
600
800
1 000
1 200
1 400
1 600
1 800
2 000
Bioenergy
Wind
2000 2001 2002 2003 2004 2005 2006 2007 2008 2009 WEO2020
TWh
0
500
1 000
1 500
2 000
2 500
3 000
3 500
4 000
4 500
5 000Hydro
Key point
All RE technologies must grow to meet WEO 2020 targets, with non-hydro renewables requiring the largest relative increase.
031-64 Chap_1et2_AIE RENEWABLES.indd 58031-64 Chap_1et2_AIE RENEWABLES.indd 58 09/11/11 11:3109/11/11 11:31
© O
EC
D/IE
A, 2
011
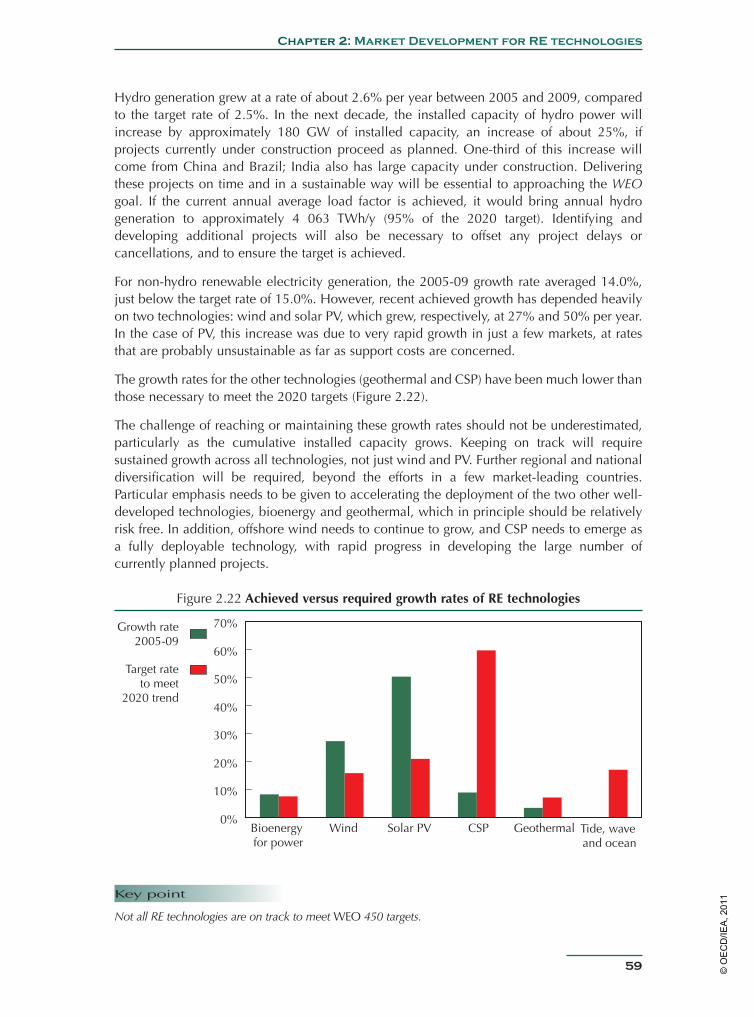
Chapter 2: Market Development for RE technologies
59
Hydro generation grew at a rate of about 2.6% per year between 2005 and 2009, compared to the target rate of 2.5%. In the next decade, the installed capacity of hydro power will increase by approximately 180 GW of installed capacity, an increase of about 25%, if projects currently under construction proceed as planned. One-third of this increase will come from China and Brazil; India also has large capacity under construction. Delivering these projects on time and in a sustainable way will be essential to approaching the WEO goal. If the current annual average load factor is achieved, it would bring annual hydro generation to approximately 4 063 TWh/y (95% of the 2020 target). Identifying and developing additional projects will also be necessary to offset any project delays or cancellations, and to ensure the target is achieved.
For non-hydro renewable electricity generation, the 2005-09 growth rate averaged 14.0%, just below the target rate of 15.0%. However, recent achieved growth has depended heavily on two technologies: wind and solar PV, which grew, respectively, at 27% and 50% per year. In the case of PV, this increase was due to very rapid growth in just a few markets, at rates that are probably unsustainable as far as support costs are concerned.
The growth rates for the other technologies (geothermal and CSP) have been much lower than those necessary to meet the 2020 targets (Figure 2.22).
The challenge of reaching or maintaining these growth rates should not be underestimated, particularly as the cumulative installed capacity grows. Keeping on track will require sustained growth across all technologies, not just wind and PV. Further regional and national diversification will be required, beyond the efforts in a few market-leading countries. Particular emphasis needs to be given to accelerating the deployment of the two other well-developed technologies, bioenergy and geothermal, which in principle should be relatively risk free. In addition, offshore wind needs to continue to grow, and CSP needs to emerge as a fully deployable technology, with rapid progress in developing the large number of currently planned projects.
Figure 2.22 Achieved versus required growth rates of RE technologies
0%
10%
20%
30%
40%
50%
60%
70%
Bioenergy for power
Wind Solar PV CSP Geothermal Tide, wave and ocean
Growth rate2005-09
Target rateto meet
2020 trend
Key point
Not all RE technologies are on track to meet WEO 450 targets.
031-64 Chap_1et2_AIE RENEWABLES.indd 59031-64 Chap_1et2_AIE RENEWABLES.indd 59 09/11/11 11:3109/11/11 11:31
© O
EC
D/IE
A, 2
011
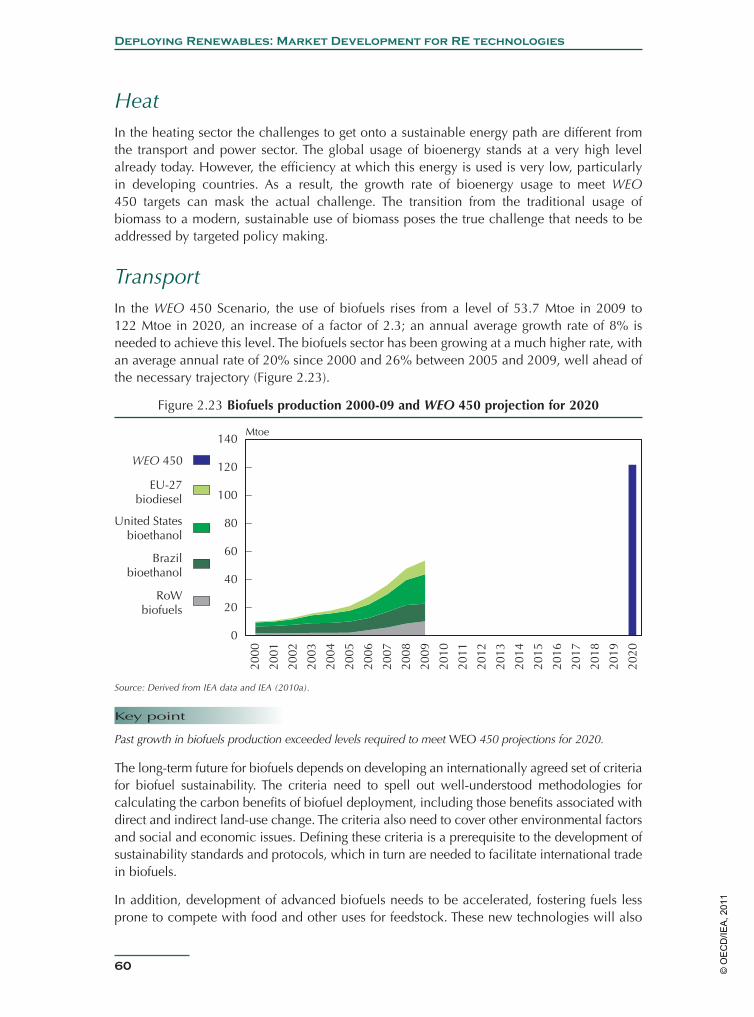
60
Deploying Renewables: Market Development for RE technologies
HeatIn the heating sector the challenges to get onto a sustainable energy path are different from the transport and power sector. The global usage of bioenergy stands at a very high level already today. However, the efficiency at which this energy is used is very low, particularly in developing countries. As a result, the growth rate of bioenergy usage to meet WEO 450 targets can mask the actual challenge. The transition from the traditional usage of biomass to a modern, sustainable use of biomass poses the true challenge that needs to be addressed by targeted policy making.
TransportIn the WEO 450 Scenario, the use of biofuels rises from a level of 53.7 Mtoe in 2009 to 122 Mtoe in 2020, an increase of a factor of 2.3; an annual average growth rate of 8% is needed to achieve this level. The biofuels sector has been growing at a much higher rate, with an average annual rate of 20% since 2000 and 26% between 2005 and 2009, well ahead of the necessary trajectory (Figure 2.23).
Figure 2.23 Biofuels production 2000-09 and WEO 450 projection for 2020
2000
2001
2002
2003
2004
2005
2006
2007
2008
2009
2010
2011
2012
2013
2014
2015
2016
2017
2018
2019
2020
Mtoe
0
20
40
60
80
100
120
140
RoWbiofuels
Brazilbioethanol
United Statesbioethanol
EU-27biodiesel
WEO 450
Source: Derived from IEA data and IEA (2010a).
Key point
Past growth in biofuels production exceeded levels required to meet WEO 450 projections for 2020.
The long-term future for biofuels depends on developing an internationally agreed set of criteria for biofuel sustainability. The criteria need to spell out well-understood methodologies for calculating the carbon benefits of biofuel deployment, including those benefits associated with direct and indirect land-use change. The criteria also need to cover other environmental factors and social and economic issues. Defining these criteria is a prerequisite to the development of sustainability standards and protocols, which in turn are needed to facilitate international trade in biofuels.
In addition, development of advanced biofuels needs to be accelerated, fostering fuels less prone to compete with food and other uses for feedstock. These new technologies will also
031-64 Chap_1et2_AIE RENEWABLES.indd 60031-64 Chap_1et2_AIE RENEWABLES.indd 60 09/11/11 11:3109/11/11 11:31
© O
EC
D/IE
A, 2
011
Chapter 2: Market Development for RE technologies
61
produce fungible fuels (thereby avoiding blending issues) and also fuels better suited to long-haul transport (by air, sea and road); this is where IEA analysis suggests that biofuels can make the largest contribution in the future (IEA, 2011c).
Opportunities for expanding deploymentAlthough RE technology deployment has increased substantially over the last five years, only a small proportion of the total potential has so far been exploited. Meeting the WEO 450 levels will require achieving only a relatively small share of the potential.
To date, the electricity and heat technologies have been largely unexploited (Brown, Müller and Dobrotková, 2011). Some uncertainty exists about how much of the bioenergy and biofuels resource can be made available sustainably, given the potential competition for resources and land between increasing demands for food and energy production (IEA, 2011c.)
With the increased deployment and cost reductions for RE technologies, a portfolio now exists of technically proven and increasingly cost-competitive technologies for energy generation. The existence of this portfolio should allow good progress, at lower costs, in countries where deployment is under way. Particular opportunities are available for widespread deployment of the well-developed and most cost-competitive technologies such as hydro, wind, geothermal (for electricity and heat), bioenergy for electricity and heat, and solar water heating, where technical confidence is high and where additional costs of deployment are low (or zero). Over the next 10 years, this portfolio should be augmented by solar PV and CSP technologies, if a supply of projects is developed and projected cost reductions can be demonstrated.
With the improved confidence in the technologies and greater cost-competitiveness, the technologies can now be deployed in a broader range of countries where the resource is favourable, not only in countries that are able and willing to provide high levels of financial support. Many emerging and developing economies are endowed with good RE resources such as sun, wind, biomass and geothermal.
Resource conditions in the developing economies are often better than in countries where deployment has been fostered. Parts of North Africa, for example, have about twice as much solar radiation as parts of Germany, so PV generation levels will be higher and costs subsequently lower. Developing economies also often have high generation costs and face rapidly rising electricity demand. In these economies, therefore, opportunities are increasing for RE technologies to make a contribution as part of a secure and sustainable energy portfolio.
Key challengesElectricityHow quickly the electricity sector for RE technologies grows depends on increasing the contribution from the more mature technologies (hydro, wind, bioenergy and geothermal). At the same time, if low-carbon energy scenarios are to be achieved for 2020 and 2030, the
031-64 Chap_1et2_AIE RENEWABLES.indd 61031-64 Chap_1et2_AIE RENEWABLES.indd 61 09/11/11 11:3109/11/11 11:31
© O
EC
D/IE
A, 2
011
62
Deploying Renewables: Market Development for RE technologies
technologies that have just reached the deployment stage (such as CSP, offshore wind and the ocean technologies) also need to be brought forward into the market.
Accelerating the deployment of the more mature technologies will require maintaining supportive policies in the countries where deployment is already under way. To facilitate this, policy makers need to ensure that their policies and support measures have a real impact and are as cost effective as possible. Issues to be addressed include how to integrate increasing levels of RE generation into the existing system and how to design an overall electricity market for a portfolio of low-carbon energy generating sources.
Progress will also require diversification to a broader range of countries. Achieving this goal is now made easier by the increasing maturity and cost-competitiveness of the technologies, but some specific technology transfer and capability building effort, facilitated internationally, will be needed to stimulate this process. A wealth of policy experience is now available to help meet the objective of regional diversification (see Chapter 3).
Dedicated RD&D and targeted support for market deployment of the newer technologies are also needed to bring these technologies to large-scale deployment and demonstrate that reliable performance and the projected cost-reductions can be delivered.
HeatIn principle, the heat sector for RE technologies should be well placed to expand rapidly and sustainably. The technologies are well developed and can be cost-competitive where resources are easily available. As discussed in Chapter 3, additional barriers affecting deployment in the sector stem from the more diverse nature of the heat sector, the fragmented and relatively unregulated market, and the difficulties of transporting heat. In addition, the technology systems are more diverse than those in the electricity and biofuels sectors.
In general, the sector has not received as much attention from policy makers as the electricity and transport sectors, except in particular countries and sub-sectors (for example, solar water heating in Israel). Signs are now evident, however, of policy attention being given to the heat sector (for example, inclusion of renewable heat in National Action Plans in the framework of the European Union’s Renewable Energy Directive). A concerted effort is required to highlight national opportunities for cost-competitive applications of renewable heat (for example, for hot water production or drying in countries with a good solar regime). Much potential also exists for sharing best policy practices from countries that have made good progress in developing renewable heat markets (e.g. Austria), and also for learning from policy experience in the electricity sector, where market stimulation via feed-in tariffs (FITs), for example, has led to cost reductions, thereby opening up wider market opportunities.
TransportThe critical issues that will determine and may constrain future deployment of biofuels involve concerns about the sustainability of the current feedstocks and processes and their compatibility with current vehicle fleets and infrastructure.
As noted earlier, for the conventional technologies (bioethanol and biodiesel), the main challenge is to develop an internationally agreed set of criteria for biofuel sustainability.
031-64 Chap_1et2_AIE RENEWABLES.indd 62031-64 Chap_1et2_AIE RENEWABLES.indd 62 09/11/11 11:3109/11/11 11:31
© O
EC
D/IE
A, 2
011

Chapter 2: Market Development for RE technologies
63
The criteria need to spell out well-understood methodologies for calculating the carbon benefits of their deployment, including those benefits associated with direct and indirect land-use change. The criteria also need to cover other environmental factors, and social and economic issues. Defining these criteria is a prerequisite to the development of sustainability standards and protocols, which, in turn, are needed to facilitate international trade in biofuels.
Development of advanced biofuels also needs to be accelerated, fostering fuels less prone to compete for feedstock with food and other uses. Some of these new technologies will also produce fungible fuels (i.e. that are interchangeable with fossil fuels, and thereby avoiding blending issues) and also fuels that are better adjusted to long-haul transport (by air, sea and road); this is where IEA analysis suggests that biofuels can make the largest contribution in the future (IEA, 2011c).
These advanced processes are still at the development, demonstration and early deployment stages. Their deployment will rely on continued efforts in R&D by private and public sectors, and critically on the deployment of the first full-scale commercial facilities. This is the major challenge in this sector, because technical, commercial and political risks are associated with their introduction. In particular, the production costs from the early plants will be higher than the anticipated future costs, and in some cases also higher than those of biofuels produced by conventional processes. As a result, the market introduction may need to rely on differential support for the products and be backed up by specific mandates that encourage the introduction of these processes and fuels.
Also, the scale of the likely investments makes it difficult for governments to provide support for early-stage plants by the usual mechanisms such as capital grants, even for countries such as the United States or the European Union. Government support, involving grants and loan guarantees, and some novel mechanisms, involving public-private partnerships, are likely to be needed to bring these technologies to full-scale operation.
PrioritiesThe analysis above shows that each of the three sectors has been growing sharply and at rates close to those needed to meet the level of RE technologies within the IEA WEO 450 Scenario for 2020. The good progress thus far, however, has been reliant on relatively few technologies and concentrated in relatively few countries.
A portfolio now exists of well-proven RE technologies that are increasingly able to provide cost-competitive energy. The need is increasing to provide solutions that can help improve energy security and reduce carbon emissions. The opportunity and the need are, therefore, converging.
Although the prospects look good, however, the challenges associated with keeping up the momentum must not be underestimated. Meeting the challenges will require good progress across all technologies and in a broader range of countries and regions, and each sector poses specific challenges that will require dedicated action by policy makers in individual countries and internationally. Table 2.4 provides a summary of the state of play today and the priorities for action in the near and medium terms for each sector.
031-64 Chap_1et2_AIE RENEWABLES.indd 63031-64 Chap_1et2_AIE RENEWABLES.indd 63 09/11/11 11:3109/11/11 11:31
© O
EC
D/IE
A, 2
011
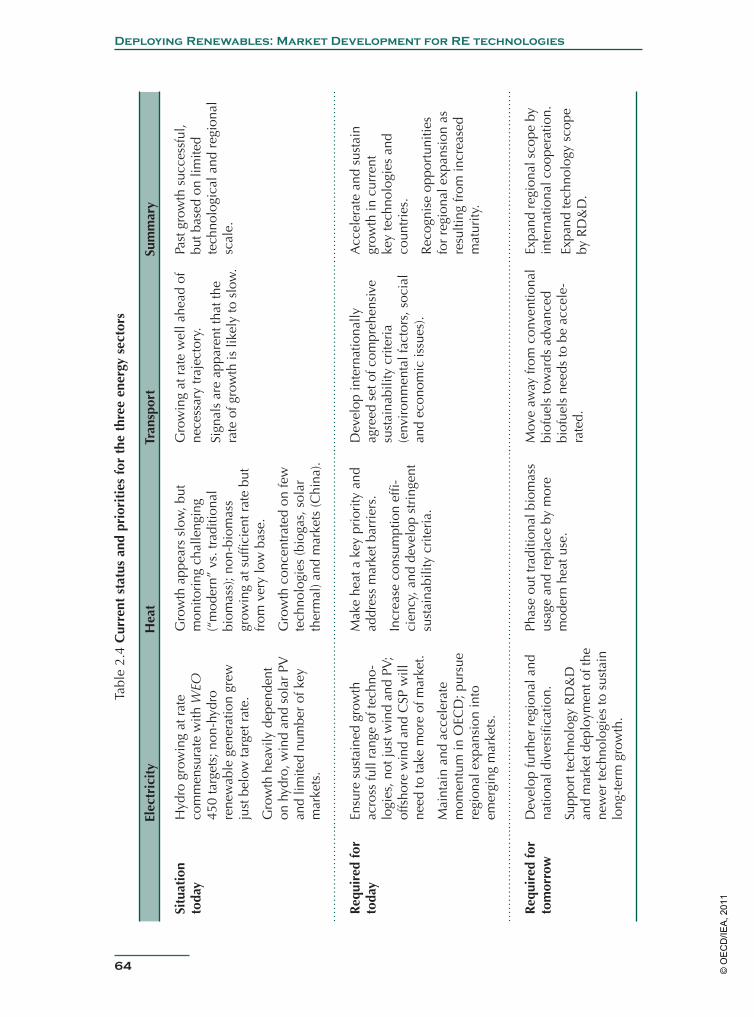
64
Deploying Renewables: Market Development for RE technologies
Tabl
e 2.
4 C
urre
nt s
tatu
s an
d pr
iori
ties
for
the
thr
ee e
nerg
y se
ctor
s
Elec
tric
ity
Hea
tTr
ansp
ort
Sum
mar
y
Situ
atio
n to
day
Hyd
ro g
row
ing
at r
ate
com
men
sura
te w
ith W
EO
450
targ
ets;
non
-hyd
ro
rene
wab
le g
ener
atio
n gr
ew
just
bel
ow ta
rget
rat
e.
Gro
wth
hea
vily
dep
ende
nt
on h
ydro
, win
d an
d so
lar
PV
and
limite
d nu
mbe
r of
key
m
arke
ts.
Gro
wth
app
ears
slo
w, b
ut
mon
itori
ng c
halle
ngin
g (“
mod
ern”
vs.
trad
ition
al
biom
ass)
; non
-bio
mas
s gr
owin
g at
suf
fi cie
nt r
ate
but
from
ver
y lo
w b
ase.
Gro
wth
con
cent
rate
d on
few
te
chno
logi
es (b
ioga
s, s
olar
th
erm
al) a
nd m
arke
ts (C
hina
).
Gro
win
g at
rat
e w
ell a
head
of
nece
ssar
y tr
ajec
tory
. Si
gnal
s ar
e ap
pare
nt th
at th
e ra
te o
f gro
wth
is li
kely
to s
low
.
Past
gro
wth
suc
cess
ful,
but b
ased
on
limite
d te
chno
logi
cal a
nd r
egio
nal
scal
e.
Req
uire
d fo
r to
day
Ensu
re s
usta
ined
gro
wth
ac
ross
full
rang
e of
tech
no-
logi
es, n
ot ju
st w
ind
and
PV;
offs
hore
win
d an
d C
SP w
ill
need
to ta
ke m
ore
of m
arke
t.
Mai
ntai
n an
d ac
cele
rate
m
omen
tum
in O
ECD
; pur
sue
regi
onal
exp
ansi
on in
to
emer
ging
mar
kets
.
Mak
e he
at a
key
pri
ority
and
ad
dres
s m
arke
t bar
rier
s.
Incr
ease
con
sum
ptio
n ef
fi -ci
ency
, and
dev
elop
str
inge
nt
sust
aina
bilit
y cr
iteri
a.
Dev
elop
inte
rnat
iona
lly
agre
ed s
et o
f com
preh
ensi
ve
sust
aina
bilit
y cr
iteri
a (e
nvir
onm
enta
l fac
tors
, soc
ial
and
econ
omic
issu
es).
Acc
eler
ate
and
sust
ain
grow
th in
cur
rent
ke
y te
chno
logi
es a
nd
coun
trie
s.
Rec
ogni
se o
ppor
tuni
ties
for
regi
onal
exp
ansi
on a
s re
sulti
ng fr
om in
crea
sed
mat
urity
.
Req
uire
d fo
r to
mor
row
Dev
elop
furt
her
regi
onal
and
na
tiona
l div
ersi
fi cat
ion.
Supp
ort t
echn
olog
y R
D&
D
and
mar
ket d
eplo
ymen
t of t
he
new
er te
chno
logi
es to
sus
tain
lo
ng-t
erm
gro
wth
.
Phas
e ou
t tra
ditio
nal b
iom
ass
usag
e an
d re
plac
e by
mor
e m
oder
n he
at u
se.
Mov
e aw
ay fr
om c
onve
ntio
nal
biof
uels
tow
ards
adv
ance
d bi
ofue
ls n
eeds
to b
e ac
cele
-ra
ted.
Expa
nd r
egio
nal s
cope
by
inte
rnat
iona
l coo
pera
tion.
Ex
pand
tech
nolo
gy s
cope
by
RD
&D
.
031-64 Chap_1et2_AIE RENEWABLES.indd 64031-64 Chap_1et2_AIE RENEWABLES.indd 64 09/11/11 11:3109/11/11 11:31
© O
EC
D/IE
A, 2
011
Chapter 3: Policies for Deploying Renewables
65
IntroductionThe review of recent data in Chapter 2 demonstrates that deployment is expanding rapidly in all three renewable energy (RE) sectors: electricity, heat and transport. Some renewable energy technology (RE technology) applications are already cost competitive, and others will become so as technology costs continue to reduce and fossil fuel prices rise. In many cases, however, a gap still exists between the costs of energy from renewable sources and those from conventional fossil-based sources, particularly when account is not taken of the external costs associated with the environmental impacts of fossil fuels. Even where this cost gap has been closed, RE technologies face other barriers that can impede or even prevent their deployment into an energy system primarily designed for the use of fossil fuels. Policy actions must aim to remove these barriers if the levels of RE technologies in the energy supply mix are going to continue to rise.
A wealth of experience is now available of developing and implementing policy measures to assist RE technologies into the market. These policies have also been shown to have an impact, as evidenced by the growing deployment. Based on the detailed reviews of deployment by technology and by region carried out as part of this programme (Brown, Müller and Dobrotková, 2011; Müller, Marmion and Beerepoot, 2011), this chapter reviews the experience so far, and identifies trends and best practices in policy making. For a more detailed discussion of the rationale behind renewable energy policies, and the challenges to deployment and the policy tools to meet them, see the associated IEA Information Paper Renewable Energy: Policy Considerations for Deploying Renewables (Müller, Brown and Ölz, 2011).
The current chapter also looks forward to new policy challenges that will be associated with higher levels of deployment and with increasingly cost-competitive RE technology options. These challenges must be effectively tackled if RE is to play the sort of role in the world energy economy envisaged in scenarios such as the IEA WEO 450 Scenario.
The discussion considers the following questions:
• How does the development and deployment of RE make a contribution to energy and economic policy, and what are the benefits of increasing deployment levels?
• What are the main barriers to RE deployment?
• How do policy requirements change as deployment progresses, and what are the key requirements at each stage? What policy tools have been used to tackle economic barriers?
• What new policy challenges are associated with higher levels of RE deployment, and how can they best be tackled?
Chapter 3Policies for Deploying Renewables
065-106 Chapter 3 AIE RENEWABLES.indd 65065-106 Chapter 3 AIE RENEWABLES.indd 65 09/11/11 11:2709/11/11 11:27
© O
EC
D/IE
A, 2
011
66
Deploying Renewables: Policies for Deploying Renewables
Renewable energy: drivers and benefitsThe development and deployment of RE can make a contribution to energy, environmental and economic policy in three interacting areas: energy security, reduction of CO2 emissions and other environmental impacts of energy use, and economic development.
Energy securityEnergy security involves the provision of sufficient and reliable energy supplies to satisfy demand at all times and at affordable prices, while also avoiding environmental impacts. More recent definitions take a longer-term perspective and recognise that only energy sources that reconcile economic factors with sustainability will be able to guarantee security in the long term. Availability, affordability and sustainability of energy supply are interlinked facets of overall energy security. The importance that countries assign to each facet varies, depending on aspects such as their natural resource endowment, their stage of economic development and local environmental priorities.
Increasing the role of RE technologies can improve energy availability by providing improved diversity, and by providing a more distributed and modular energy supply that is less prone to interruption. Renewable sources may themselves have some associated security issues, which may be due to resource fluctuations, such as the diurnal and seasonal variations in wind and solar, or changes in hydro generation when rainfall levels are lower than expected.Such factors must also be considered in any energy security appraisal, particularly when renewable sources provide a significant proportion of supply in any energy sector.
RE technologies reduce the need for fossil fuels, thereby reducing import bills and improving the balance of payments, or for energy-producing countries, making more energy potentially available for export. Using indigenous supplies insulates economies from both the risk of rising energy prices and short-term price volatility (Bazilian and Roques, 2008). It also shelters consumers from these volatile and rising prices, which energy suppliers currently often pass straight through to their customers. Integrating several studies on the link between oil prices and gross domestic product (GDP), Awerbuch and Sauter (2006) estimate a loss of 0.5% in GDP for a 10% oil price increase for the United States and the European Union.
Although RE technologies are often thought of as expensive options, several technologies, including wind power, are now cost-competitive when the resource conditions are favourable. The costs of other technologies, especially solar PV, have been falling rapidly. Thus the technologies are increasingly affordable, particularly when taking the full costs of the alternatives into account, including environmental costs, and when taking a longer-term view on the rising and volatile fossil fuel prices. (See the section entitled Why Provide Economic Support for Technologies? later in this chapter for a fuller discussion of cost-competitiveness.)
A full definition of energy security needs to include the long-term consequences of a given energy strategy. Current global patterns of energy production and consumption are unsustainable for two reasons. First, proceeding on a business-as-usual path will lead to unacceptable increases in global average temperature levels. The consequences of higher levels of warming could be catastrophic, leading to mass migrations away from the worst-affected areas, and the potential for severe and prolonged regional conflicts. Second, the world will eventually run out of fossil
065-106 Chapter 3 AIE RENEWABLES.indd 66065-106 Chapter 3 AIE RENEWABLES.indd 66 09/11/11 11:2709/11/11 11:27
© O
EC
D/IE
A, 2
011
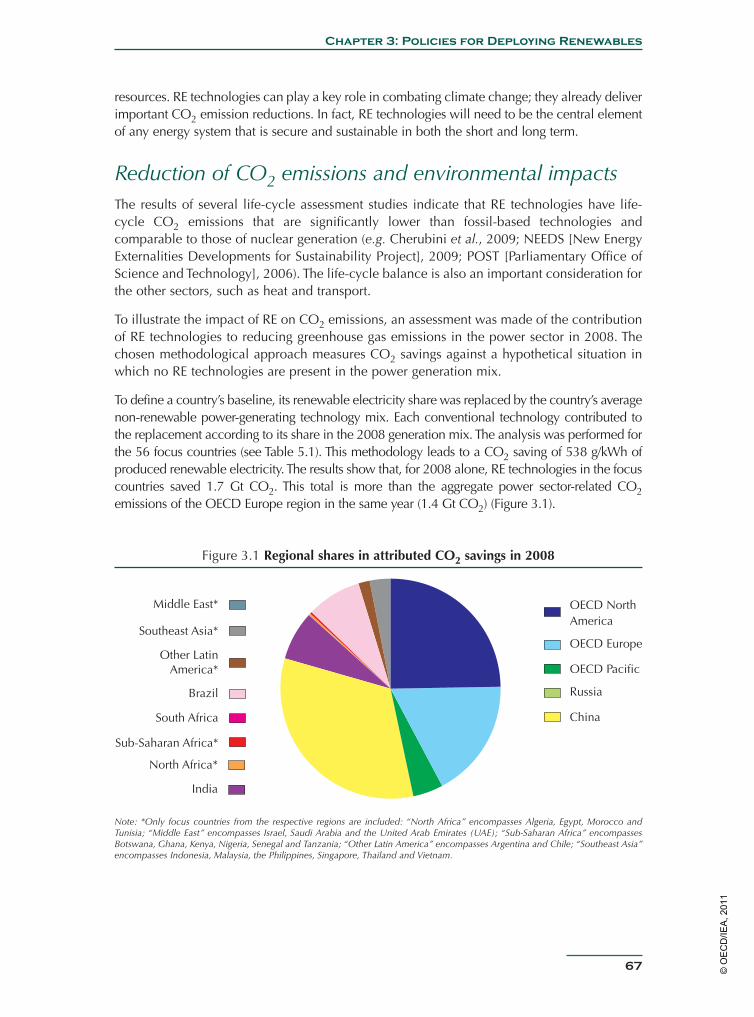
Chapter 3: Policies for Deploying Renewables
67
resources. RE technologies can play a key role in combating climate change; they already deliver important CO2 emission reductions. In fact, RE technologies will need to be the central element of any energy system that is secure and sustainable in both the short and long term.
Reduction of CO2 emissions and environmental impactsThe results of several life-cycle assessment studies indicate that RE technologies have life-cycle CO2 emissions that are significantly lower than fossil-based technologies and comparable to those of nuclear generation (e.g. Cherubini et al., 2009; NEEDS [New Energy Externalities Developments for Sustainability Project], 2009; POST [Parliamentary Office of Science and Technology], 2006). The life-cycle balance is also an important consideration for the other sectors, such as heat and transport.
To illustrate the impact of RE on CO2 emissions, an assessment was made of the contribution of RE technologies to reducing greenhouse gas emissions in the power sector in 2008. The chosen methodological approach measures CO2 savings against a hypothetical situation in which no RE technologies are present in the power generation mix.
To define a country’s baseline, its renewable electricity share was replaced by the country’s average non-renewable power-generating technology mix. Each conventional technology contributed to the replacement according to its share in the 2008 generation mix. The analysis was performed for the 56 focus countries (see Table 5.1). This methodology leads to a CO2 saving of 538 g/kWh of produced renewable electricity. The results show that, for 2008 alone, RE technologies in the focus countries saved 1.7 Gt CO2. This total is more than the aggregate power sector-related CO2 emissions of the OECD Europe region in the same year (1.4 Gt CO2) (Figure 3.1).
Figure 3.1 Regional shares in attributed CO2 savings in 2008
OECD NorthAmerica
OECD Europe
OECD Pacific
Russia
China
India
Middle East*
North Africa*
Sub-Saharan Africa*
South Africa
Brazil
Other LatinAmerica*
Southeast Asia*
Note: *Only focus countries from the respective regions are included: “North Africa” encompasses Algeria, Egypt, Morocco and Tunisia; “Middle East” encompasses Israel, Saudi Arabia and the United Arab Emirates (UAE); “Sub-Saharan Africa” encompasses Botswana, Ghana, Kenya, Nigeria, Senegal and Tanzania; “Other Latin America” encompasses Argentina and Chile; “Southeast Asia” encompasses Indonesia, Malaysia, the Philippines, Singapore, Thailand and Vietnam.
065-106 Chapter 3 AIE RENEWABLES.indd 67065-106 Chapter 3 AIE RENEWABLES.indd 67 09/11/11 11:2709/11/11 11:27
© O
EC
D/IE
A, 2
011
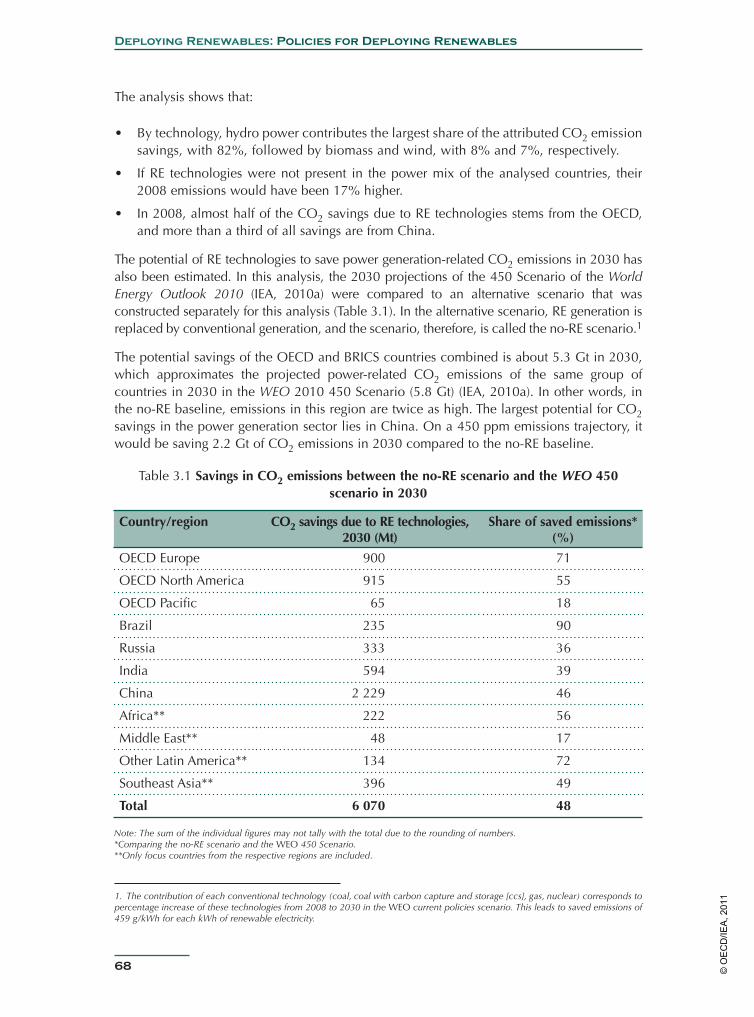
68
Deploying Renewables: Policies for Deploying Renewables
The analysis shows that:
• By technology, hydro power contributes the largest share of the attributed CO2 emission savings, with 82%, followed by biomass and wind, with 8% and 7%, respectively.
• If RE technologies were not present in the power mix of the analysed countries, their 2008 emissions would have been 17% higher.
• In 2008, almost half of the CO2 savings due to RE technologies stems from the OECD, and more than a third of all savings are from China.
The potential of RE technologies to save power generation-related CO2 emissions in 2030 has also been estimated. In this analysis, the 2030 projections of the 450 Scenario of the World Energy Outlook 2010 (IEA, 2010a) were compared to an alternative scenario that was constructed separately for this analysis (Table 3.1). In the alternative scenario, RE generation is replaced by conventional generation, and the scenario, therefore, is called the no-RE scenario.1
The potential savings of the OECD and BRICS countries combined is about 5.3 Gt in 2030, which approximates the projected power-related CO2 emissions of the same group of countries in 2030 in the WEO 2010 450 Scenario (5.8 Gt) (IEA, 2010a). In other words, in the no-RE baseline, emissions in this region are twice as high. The largest potential for CO2 savings in the power generation sector lies in China. On a 450 ppm emissions trajectory, it would be saving 2.2 Gt of CO2 emissions in 2030 compared to the no-RE baseline.
1. The contribution of each conventional technology (coal, coal with carbon capture and storage [ccs], gas, nuclear) corresponds to percentage increase of these technologies from 2008 to 2030 in the WEO current policies scenario. This leads to saved emissions of 459 g/kWh for each kWh of renewable electricity.
Table 3.1 Savings in CO2 emissions between the no-RE scenario and the WEO 450 scenario in 2030
Country/region CO2 savings due to RE technologies, 2030 (Mt)
Share of saved emissions* (%)
OECD Europe 900 71
OECD North America 915 55
OECD Pacifi c 65 18
Brazil 235 90
Russia 333 36
India 594 39
China 2 229 46
Africa** 222 56
Middle East** 48 17
Other Latin America** 134 72
Southeast Asia** 396 49
Total 6 070 48
Note: The sum of the individual figures may not tally with the total due to the rounding of numbers.*Comparing the no-RE scenario and the WEO 450 Scenario.**Only focus countries from the respective regions are included.
065-106 Chapter 3 AIE RENEWABLES.indd 68065-106 Chapter 3 AIE RENEWABLES.indd 68 09/11/11 11:2709/11/11 11:27
© O
EC
D/IE
A, 2
011

Chapter 3: Policies for Deploying Renewables
69
Economic development
The deployment of RE technologies is frequently given high priority within a comprehensive strategy towards more sustainable economic growth, sometimes summarised by the term “green growth” (OECD [Organisation for Economic Co-operation and Development], 2011). The technologies featured prominently in economic recovery packages in 2008/09.
RE technologies are able to contribute to sustainable economic development by allowing exploitation of natural but replenishing resources, providing new sources of natural capital. The technologies allow countries with good solar or wind resources, for example, to exploit these resources as “new” assets to support their own energy needs. RE technologies may even allow countries to exploit RE resources with long-term export potential, by producing biofuels sustainably, or by using high levels of solar radiation to generate exportable electricity via RE technologies, as proposed in the DESERTEC project (Müller, Marmion and Beerepoot, 2011b).
The costs of importing fossil fuels and the increasing volatility of prices can depress economic development and growth. The net cost of importing fossil fuels into the United States, for example, was about USD 410 billion in 2008 alone (EIA [Energy Information Administration], 2010), representing more than 3% of the country’s GDP. The situation is similar in many other OECD countries. Developing countries without abundant domestic fuel resources spend even higher percentages of their GDP on net fossil imports. For these countries, their fossil fuel import bills pose a serious impediment to economic development. Yet, IEA estimates show that investment in low-carbon energy systems provides an extraordinary return: the USD 46 trillion investment required globally between 2010 and 2050 to deliver low-carbon energy systems, a 17% increase over current spending, would yield cumulative fuel savings equal to USD 112 trillion (IEA, 2010b). These savings are in addition to the avoided negative impacts of climate change (all of which can also be calculated to have a monetary value/cost).
China’s recent success in RE technology deployment demonstrates that emerging economies can also use green growth strategies in the energy sector to promote more sustainable growth overall (Box 3.1).
Job creation is an important economic policy objective for all governments. Deploying RE technologies can lead to positive net employment effects. In its 2008 Green Jobs report, the United Nations Environment Programme (UNEP) concludes that “compared to fossil-fuel power plants, renewable energy generates more jobs per unit of installed capacity, per unit of power generated and per dollar invested” (UNEP, 2008). Based on 2006 data, the report estimates the global number of jobs in the RE sector at 2.3 million or more. Newer estimates (REN21, 2011) have further raised this number to 3.5 million. Broken down by subsector, the REN21 estimate is as follows: 630 000 workers in wind power, 350 000 in solar PV and more than 1.5 million in biofuels. In Germany, analysis shows that the renewables sector now employs about 360 000 people (BMU, 2011).2
2. The IEA RETD implementing agreement is carrying out an analysis of “employment and innovation effects of renewables” (EID-EMPLOY project). The project team is currently developing methodological guidelines for estimating the employment impacts of renewable energy use (forthcoming in late 2011).
065-106 Chapter 3 AIE RENEWABLES.indd 69065-106 Chapter 3 AIE RENEWABLES.indd 69 09/11/11 11:2709/11/11 11:27
© O
EC
D/IE
A, 2
011
70
Deploying Renewables: Policies for Deploying Renewables
RE markets can be expected to grow rapidly in the future due to climate change mitigation and energy security imperatives. Jobs created in this sector, therefore, have a sustainable long-term perspective, a key element to consider when appraising the labour market effect of government support policies.
Innovation and industrial developmentSeveral established RE market leaders (including Germany, Denmark and Japan) have long placed industrial and economic development objectives at the centre of their support for RE technologies (Jochem et al., 2008; Mizuno, 2010).
These countries encouraged the creation of strong industrial clusters and developed vibrant domestic markets by putting in place stable, enabling policy frameworks along the innovation chain, along with favourable investment conditions for innovative RE technologies, including solar PV and wind. They specialised at an early stage in the supply of novel RE technologies that were characterised by high knowledge intensity and learning potential, and thus the countries became front-runners in terms of innovation. This strategy helped them establish a first-mover advantage in exports as global trade and competition for RE technologies expanded (Jochem et al., 2008; Walz, Helfrich and Enzmann, 2009).
Box 3.1 Green growth in China’s 12th Five-Year Plan
The Green Development section of China's 12th Five-Year Plan (FYP, 2011-15) highlights the country's aspiration to move toward a greener economy. The Plan is a strategic national roadmap, setting priorities regarding China's future socioeconomic development, and providing guidelines and targets for policy making at the sectoral and sub-national level.
The Green Development theme identifies six strategic pillars:
• respond to climate change;
• strengthen resource saving and management;
• develop the “circular economy”;
• enhance environmental protection;
• promote ecosystem protection and recovery; and
• strengthen systems for water conservation and natural disaster prevention.
These pillars entail several new binding targets (e.g. carbon emission per unit of GDP to be reduced by 17% by 2015; nitrogen oxide [NOx] and nitrogen air emissions to be reduced by 10% by 2015), in addition to targets continued from the 11th FYP (e.g. energy intensity, sulfur dioxide [SO2] and chemical oxygen demand [COD] pollution). Detailed policy guidelines are also provided in the 12th FYP; for instance, energy-efficiency technology demonstration and diffusion programmes are emphasised as the engine of both energy saving and new growth opportunities.
Source: OECD (2011).
065-106 Chapter 3 AIE RENEWABLES.indd 70065-106 Chapter 3 AIE RENEWABLES.indd 70 09/11/11 11:2709/11/11 11:27
© O
EC
D/IE
A, 2
011

Chapter 3: Policies for Deploying Renewables
71
Certain factors improve a country’s ability to benefit from a first-mover advantage in external trade, including:
• technology characteristics that form obstacles to international relocation;
• positive market conditions in the country, which strengthen learning-by-doing and learning-by-using;
• innovation-friendly regulation in the country;
• technological capability of the country; and
• the competitiveness of related industry clusters in the country (Walz, Helfrich and Enzmann, 2009).
Technological capabilities and innovation success in RE technologies result from a broad range of beneficial factors influencing the innovation chain, not merely from effective research and development (R&D) efforts. Patent activity is one important indicator of a country’s level of specialisation in certain technologies and a measure of future potential for market share growth. A comparison of patent activity indicates the relative strength of Germany and Denmark in generating patent-worthy innovations in wind energy technologies, while the United States, Germany and Japan show the highest shares of patents for solar PV-related innovations. The EU bloc as a whole, which also encompasses important RE leaders such as Germany, Denmark and Spain, shows the largest patent shares for biomass and biogas, wind and solar thermal technologies (Mizuno, 2010).
Mapping policy drivers: the energy security/GDP matrixMany factors influence the extent to which countries adopt RE technologies as part of their energy portfolio. RE technology adoption is determined by a country’s available resources and the relative priorities given to the policy issues discussed above, which in turn are influenced by the overall economic situation, as well as relevant cultural issues. This complex interaction gives rise to a country’s specific policy and market context for RE technologies.
Change is often said to be driven either by desperation or inspiration. In the energy sphere, change can be driven by concerns about energy security and the negative impacts of unstable energy prices and long-term energy access (desperation). Countries facing energy security concerns (that is, those that rely heavily on energy imports) could be expected to take measures to improve their energy independence or to diversify their energy portfolios though a number of initiatives, including developing RE technologies.
Change can also be driven by a willingness to improve the global and local environment, or to stimulate innovation and economic development (inspiration). To date, when RE technologies have been relatively expensive compared to fossil fuel alternatives, the countries that are most able to afford a package of measures to promote RE as a way of achieving local and global benefits are likely to be the early adopters and developers.
To put an individual country’s situation into the global context, the IEA has developed a matrix that maps countries according to two dimensions (Figure 3.2). The first dimension is the country’s dependence on certain energy commodities such as fossil fuels. This perspective allows quantifying the extent to which energy security concerns may be driving RET deployment.
The second dimension is the country’s economic strength, as measured by gross domestic product (GDP) per capita, adjusted for purchasing power. This perspective serves as a proxy
065-106 Chapter 3 AIE RENEWABLES.indd 71065-106 Chapter 3 AIE RENEWABLES.indd 71 09/11/11 11:2709/11/11 11:27
© O
EC
D/IE
A, 2
011

72
Deploying Renewables: Policies for Deploying Renewables
for the relative ability to afford the necessary measures and investments to foster increased levels of RE technology development and deployment to provide climate change mitigation, environmental protection and industrial development.3
Figure 3.2 Typology of country clusters by strategic policy drivers
Energy securityconcerns
Environmental policies affordable / in place
Energy affordability and poverty concerns
Lower GDPper capita
Higher GDPper capita
Net energy exporters
Net energy importers
e.g. Algeria e.g. Canada
e.g. Thailand e.g. Germany
Key point
Energy security concerns and a country’s GDP level influence RE policy commitment.
Figure 3.3 Changes in percentage share of RE technologies in power generation, 1990-09
-15%
-10%
-5%
0%
5%
10%
15%
20%
0 5 10 15 20 25 30 35 40
GDP/capita (thousand USDPPP)
Importers
Exporters
Note: Data includes wind, bioenergy and solar power. Black line shows result of regression analysis.
Key point
Changes in RE shares in power generation depend on GDP and the import dependence of a country.
3. Recent other work also uses a similar grouping approach to identify effective strategies for scaling-up renewable energy investments worldwide (Reid et al., 2010).
065-106 Chapter 3 AIE RENEWABLES.indd 72065-106 Chapter 3 AIE RENEWABLES.indd 72 09/11/11 11:2709/11/11 11:27
© O
EC
D/IE
A, 2
011
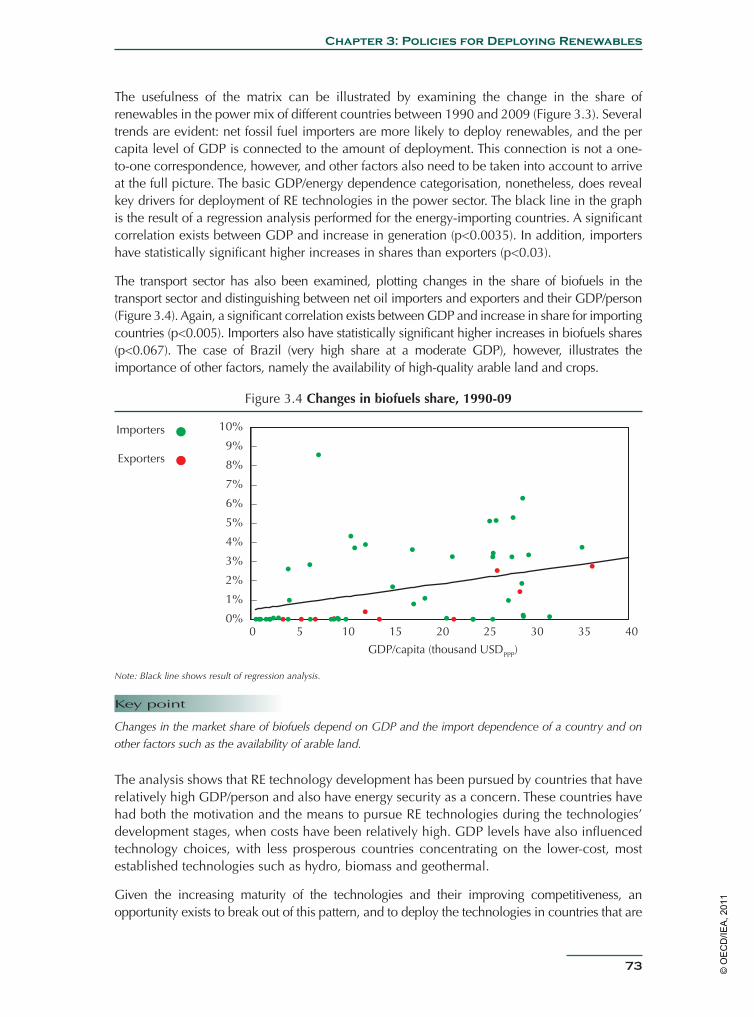
Chapter 3: Policies for Deploying Renewables
73
The usefulness of the matrix can be illustrated by examining the change in the share of renewables in the power mix of different countries between 1990 and 2009 (Figure 3.3). Several trends are evident: net fossil fuel importers are more likely to deploy renewables, and the per capita level of GDP is connected to the amount of deployment. This connection is not a one-to-one correspondence, however, and other factors also need to be taken into account to arrive at the full picture. The basic GDP/energy dependence categorisation, nonetheless, does reveal key drivers for deployment of RE technologies in the power sector. The black line in the graph is the result of a regression analysis performed for the energy-importing countries. A significant correlation exists between GDP and increase in generation (p<0.0035). In addition, importers have statistically significant higher increases in shares than exporters (p<0.03).
The transport sector has also been examined, plotting changes in the share of biofuels in the transport sector and distinguishing between net oil importers and exporters and their GDP/person (Figure 3.4). Again, a significant correlation exists between GDP and increase in share for importing countries (p<0.005). Importers also have statistically significant higher increases in biofuels shares (p<0.067). The case of Brazil (very high share at a moderate GDP), however, illustrates the importance of other factors, namely the availability of high-quality arable land and crops.
Figure 3.4 Changes in biofuels share, 1990-09
Importers
Exporters
0%
1%
2%
3%
4%
5%
6%
7%
8%
9%
10%
0 5 10 15 20 25 30 35 40
GDP/capita (thousand USDPPP)
Note: Black line shows result of regression analysis.
Key point
Changes in the market share of biofuels depend on GDP and the import dependence of a country and on other factors such as the availability of arable land.
The analysis shows that RE technology development has been pursued by countries that have relatively high GDP/person and also have energy security as a concern. These countries have had both the motivation and the means to pursue RE technologies during the technologies’ development stages, when costs have been relatively high. GDP levels have also influenced technology choices, with less prosperous countries concentrating on the lower-cost, most established technologies such as hydro, biomass and geothermal.
Given the increasing maturity of the technologies and their improving competitiveness, an opportunity exists to break out of this pattern, and to deploy the technologies in countries that are
065-106 Chapter 3 AIE RENEWABLES.indd 73065-106 Chapter 3 AIE RENEWABLES.indd 73 09/11/11 11:2709/11/11 11:27
© O
EC
D/IE
A, 2
011

74
Deploying Renewables: Policies for Deploying Renewables
less affluent but where the resource conditions are good and the need for expansion in energy services is high. Indeed this new trend is starting to emerge, as the regional analysis shows, with many non-OECD countries introducing policies to support RE technologies and a broader range of countries taking the opportunity to include RE technologies in their energy portfolio.
Barriers to RE technology deploymentEconomic barriersThe costs of many of the RE technologies have been a major barrier to their widespread market introduction, because they have not been economically competitive with fossil-fuel-based energy sources. To enable market introduction, policy measures have been required to bridge the economic gap, and to make projects profitable from a project developer’s point of view. An economic barrier is judged to be present if the cost of a given technology is above the cost of competing alternatives, even under optimal market conditions. Although some RE technologies are now cost competitive where resources and market conditions are favourable, this barrier must be addressed to create a stable and profitable market for investors and to support additional deployment (Ragwitz et al., 2007; IEA, 2008).
Figure 3.5 Barriers to RE technology deployment
Technical barriers
Infrastructurebarriers
PolicySite
choiceExternalbenefits
and costs
Up-frontcost
Noise,visual, etc.
Gridintegration
Capital demand and
operation costs
Economic barriers
Regulatory and administrativebarriers
Financial barriers
Market barriersPublic acceptance and
environmenal barriers
Key point
Different types of barriers to RE technology deployment are closely linked and may work together to hinder deployment.
Non-economic barriersEven where the economic barriers have been addressed, a range of other non-economic barriers can exist and can either prevent deployment altogether (no matter how high the willingness-to-pay) or lead to higher costs than necessary or distorted prices.
065-106 Chapter 3 AIE RENEWABLES.indd 74065-106 Chapter 3 AIE RENEWABLES.indd 74 09/11/11 11:2709/11/11 11:27
© O
EC
D/IE
A, 2
011
Chapter 3: Policies for Deploying Renewables
75
These barriers can be differentiated further (Lamers, 2009; Painuly, 2001):
• Regulatory and policy uncertainty barriers, which relate to bad policy design, or discontinuity and/or insufficient transparency of policies and legislation.
• Institutional and administrative barriers, which include the lack of strong, dedicated institutions, lack of clear responsibilities, and complicated, slow, or non-transparent permitting procedures.
• Market barriers, such as inconsistent pricing structures that disadvantage RE technologies, asymmetrical information, market power, subsidies for fossil fuels, and the failure of costing methods to include social and environmental costs.
• Financial barriers associated with an absence of adequate funding opportunities and financing products for RE technologies.
• Infrastructure barriers that mainly centre on the flexibility of the energy system, e.g. the power grid, to integrate/absorb RE technologies.
• Lack of awareness and skilled personnel relating to insufficient knowledge about the availability and performance of RE technologies as well as insufficient number of skilled workers.
• Public acceptance and environmental barriers linked to experience with planning regulations and public acceptance of RE technologies.
Note that other categorisations are possible, and the different types of barriers are closely related (Figure 3.5). The importance of the barriers differs for each technology and market, and the priority changes as a technology matures along the commercialisation and deployment path. Also, as one barrier is overcome, others may become apparent.
The analysis of the effectiveness of policies (see Chapter 4) indicates that non-economic barriers may have a more important role than the choice between differing mechanisms for overcoming economic barriers.
Barriers in the electricity sectorPast initiatives for the development of RE technologies for the electricity sector have largely focused on the economic factors, and the reduction of economic barriers has been the main focus of support measures undertaken. Past success stories of the development and deployment of RE technologies, e.g. in certain European Union countries, underline that barriers can be overcome by targeted policy action (see e.g. Ragwitz et al., 2007).
However, non-economic barriers play just as important a role in shaping the cost of renewable energy projects and are judged more difficult to address than economic barriers (see e.g. IEA, 2008). A number of non-economic barriers to renewable electricity deployment persist in many locations. Administrative hurdles can lead to long project lead times. Planning delays and restrictions, lack of co-ordination between different authorities, and authorisation delays can all jeopardise the success of a development. Grid access and electricity market design can hinder the delivery of electricity and undermine the value of variable renewable technologies, such as, wind and solar. Inadequate information and training opportunities, and lack of social acceptance, can have significant negative impacts. Illustrative examples of non-economic barriers in the EU-25, organised by RE technology and by country, as
065-106 Chapter 3 AIE RENEWABLES.indd 75065-106 Chapter 3 AIE RENEWABLES.indd 75 09/11/11 11:2709/11/11 11:27
© O
EC
D/IE
A, 2
011

76
Deploying Renewables: Policies for Deploying Renewables
perceived by stakeholders, are presented in Coenraads, Voogt and Morotz (2006), Sawin (2006), Edge (2006). Research projectshave also been conducted dedicated to barriers to wind power (Wind Barriers, 2011) and solar PV (PV Legal, 2011) in the European Union.
Barriers in the heat sectorIn the past, the heat sector has suffered a lack of policy attention, but signs are evident of this trend changing. One example is the inclusion of renewable heat in National Action Plans in the framework of the European Union’s Renewable Energy Directive (EU, 2009).
Stimulating a market for heat requires dealing with challenges that are different and sometimes more difficult to overcome than in the electricity and transport sectors. A number of key barriers to renewable heat deployment may arise (Table 3.2).
Whether produced by fossil fuels or RE, heat is often produced on-site. When heat is produced in small individual heating systems, surplus heat cannot be “fed” into a grid as with electricity. Surplus heat produced in small individual heating systems can also only be stored in a limited way, because the storage medium with the highest heat storage capacity per volume, water, still requires considerable space.
Table 3.2 Barriers to heat and renewable heat deployment
Barriers to heat (general) Barriers to renewable heat
Fragmented market: millions of owners/developers, district heating operators and industries
Renewable heat production should be close to heat sink (limited transportability, no grid for surplus, limited storage)
Gatekeepers between supply and demand (installers, architects)
Heat demand can be variable over time (space heating is seasonal)
Dynamics of heat market: space heating demand declining, power for heat in new buildings
Heat is a heterogeneous commodity: differing temperatures in both demand and renewable heat supply
“Split incentive” between building owner and consumer/tenant
Space heating demand correlates with the seasonal cycle as well as with some yields of RE technologies. Solar thermal heat is most commonly produced when heating demand is low and, therefore, is best used for supply of domestic hot water.
Heat demand differs in temperature levels per application. Assessments of the potential of renewable heat to supply space heating, domestic hot water and industrial process heat demands need to determine that temperatures produced by renewable heat technologies meet the temperature levels required.
Analysis of the potential for renewable heating technologies should also take into account that renewable heat supply may compete with developments in zero-energy buildings. In many OECD countries, the building sector is heading towards zero-energy buildings and is even being forced to do so in some countries that have announced imposition of zero-energy standards for buildings in the medium term (2015 or 2020). Such buildings will reduce energy
065-106 Chapter 3 AIE RENEWABLES.indd 76065-106 Chapter 3 AIE RENEWABLES.indd 76 09/11/11 11:2709/11/11 11:27
© O
EC
D/IE
A, 2
011

Chapter 3: Policies for Deploying Renewables
77
space heating demand by extreme insulation measures, use of passive solar energy and balanced ventilation systems with heat recovery. These buildings might not need a heating system at all or will have a remaining heat demand that is too low for (renewable) district heating to be economically feasible. These developments, however, will take place in the newly developed building sector, and the existing building sector at least in most OECD countries will still outnumber the newly developed buildings for a long time. In non-OECD countries, the situation is the opposite, with many new buildings soon outnumbering existing stock.
Barriers in the transport sectorCurrently available biofuels could be readily deployed, because they are based on well-established and proven technologies and use crops that are widely produced. As noted in Chapter 2, a number of drawbacks, however, are associated with these fuels, including the overall sustainability of the production and use of these fuels, some limitations on the extent to which the fuels produced can be used by the current vehicle fleet (the so-called blending wall), the need for infrastructure for transporting and blending the fuels, the variability of biodiesel, and the sensitivity of biofuel production costs to feedstock prices.
These concerns have led to efforts to develop and deploy a new suite of technologies that can use feedstocks without competing for materials that can also be used food, and/or that produce fuels that can replace or be blended with fossil fuels such as gasoline, diesel and kerosene.
The best-developed of these technologies are at the point where the first commercial-scale plants are coming into production. Others are at the pre-commercial demonstration stage, and others are at earlier stages in the development life-cycle. To date, only a few large-scale facilities employing these technologies are in operation, and current production levels of these fuels are low.
Tackling economic barriers to deploymentRE technologies are becoming increasingly cost competitive, at least in markets where the resources are good and the market is mature, but the immediate costs of the technologies are still often higher than those of fossil-based alternatives. Specific policy measures are needed to tackle the economic barriers to deployment if RE markets are to continue to grow. In the initial deployment phase, policy solutions must be introduced to maintain market growth and encourage cost improvements. This section reviews the experience of using a variety of policy tools to do this.
Why provide economic support for technologies?Three factors influence whether and when a technology is considered “cost competitive” and why providing economic support is justifiable.
The first factor involves externalities. Based on estimates of the capital and operating costs of various technologies, a levelised cost of energy (LCOE) can be calculated and compared, taking into account the likely lifetimes of the systems and an appropriate discount rate. The LCOE, however, does not tell the whole story. Some adjustment is justified or necessary,
065-106 Chapter 3 AIE RENEWABLES.indd 77065-106 Chapter 3 AIE RENEWABLES.indd 77 09/11/11 11:2709/11/11 11:27
© O
EC
D/IE
A, 2
011

78
Deploying Renewables: Policies for Deploying Renewables
because the external benefits and costs (such as those resulting from greenhouse gas emissions, pollution remediation and damage to health) are not fully internalised. This failure to include externalities penalises the more environmentally friendly RE technologies when compared to their fossil-based equivalents. Support for the technologies can be seen as “buying” the associated environmental benefits.
A second factor stems from the differences between the patterns of expenditure associated with most RE technology projects and those using fossil fuels. Most of the expenditure for RE technologies is associated with one-time, up-front capital costs, with operational costs being less significant because no ongoing fuel costs exist. By contrast, fossil fuel systems tend to have much lower capital costs but higher, fluctuating operational fuel costs, which are likely to rise into the future. Once investment has been made, RE technology projects offer stable energy generation costs. The costs of fossil-fuel generation are subject to price movements, which are generally passed on to consumers. RE technologies, therefore, provide some shelter from price increases and price volatility. The assessment of cost competitiveness thus should also take into account the likely variation in fossil fuel prices over the project lifetime.
Figure 3.6 Different dimensions of RE technology competitiveness
Pric
e {Costreductions
{Externalities (e.g. environmental,
price risk)
Conventional RenewableConventional Renewable
Policy interventionNo policy
Key point
Support policies are needed to drive down costs. Policies targeting non-renewable energy need to level the playing field for RE technologies.
The third factor relates to the state of maturity of a particular technology (and in a particular market). Many RE technologies are at an early stage in their development life when compared to the better-established fossil-fuel technologies. Fewer opportunities have been possible for cost reduction through R&D and experience gained in operation, and the markets have not yet been of a size to allow scale-up and efficiencies in manufacturing and assembly. If support is provided to bridge the economic gap and stimulate the market, it will provide opportunities for learning and cost reduction. RE technologies such as PV and wind have a good track record of following classic cost-reduction learning curves. Technologies that seem expensive today are capable of becoming competitive given the necessary deployment and learning. Economic support today can be justified as “buying” the learning that will lead to lower-cost technologies in the future.
065-106 Chapter 3 AIE RENEWABLES.indd 78065-106 Chapter 3 AIE RENEWABLES.indd 78 09/11/11 11:2709/11/11 11:27
© O
EC
D/IE
A, 2
011

Chapter 3: Policies for Deploying Renewables
79
Support in the form of legislation and a regulatory framework may also be necessary, and justified, when an established technology is first introduced into a new market and a competitive market is being established. Such support aims to stimulate market growth and cost reduction, and so should be seen as a transitional measure (until costs converge) and subject to regular review and adjustment as costs reduce (Figure 3.6).
Objectives of economic support policiesFrom a government’s point of view, the objectives of RE policy are: (i) to stimulate an appropriate portfolio of RE activity so as to deliver the potential contributions to energy security, climate policy, and economic development, as a part of an overall energy strategy; and (ii) to deliver these benefits as cost-effectively as possible.
To meet these energy policy objectives, most governments rely on investment by industry and other stakeholders to deliver projects with the necessary capacity. Governments, therefore, need to establish conditions such that industry and other players are confident that they will earn a reasonable return on their investments over the project lifetimes.
This principle applies to RE technology projects, but even more so to the manufacturing plants and other facilities needed to produce the necessary hardware, and the other parts of the supply chain such as installers. These entities require assurance of a continuing flow of projects over a period of years or even decades to justify investment.
The finance sector, too, needs to be confident that it will see a return on its investments. The sector will be willing to provide the necessary finance only if it judges that the balance between the risks and returns are acceptable, and particularly that the political risks associated with projects are reasonable. Representatives of the industry and finance sectors frequently stress the need for policies to be secure, stable and transparent (IEA, 2008). If policies fail to meet their expectations, and are not “investment-grade policies”, either little will happen, or the costs will be increased to offset the perceived policy risks.
Governments and industry share many of the objectives associated with developing a growing RE market, and successful deployment depends on a partnership between government, industry and the finance sector. In the long term, all wish to see a stable and self-sustaining market. In the short run, however, objectives may differ because industry will seek to maximise revenues and profit, while government will want to acquire the benefits of increased market penetration at as low a cost as possible. These differences in objectives inevitably can cause some conflict, particularly when governments wish to reduce tariffs or to manage deployment rates to meet overall strategies or expenditure patterns.
Support policy options for the electricity sectorA number of well-developed policy options have been developed to address the economic barriers faced by RE technologies in the electricity market sector. These options include:
• Feed-in tariffs (FITs) guarantee the generator of renewable electricity a certain price per kWh at which electricity is bought. The tariff is set over a long period of time, commonly 20 years. Note that the tariff is fixed during the entire period of support (sometimes indexed to inflation). Tariff adjustments are made only for new plants. Although originally
065-106 Chapter 3 AIE RENEWABLES.indd 79065-106 Chapter 3 AIE RENEWABLES.indd 79 09/11/11 11:2709/11/11 11:27
© O
EC
D/IE
A, 2
011
80
Deploying Renewables: Policies for Deploying Renewables
intended to be the only remuneration to generators, some later FITs provide a premium above market prices. Generators then have two sources of income: one from selling power directly on the market and an additional feed-in premium (FIP). Some governments have put annual caps on the amount of capacity that can benefit from FIT support in a certain time period to restrict the overall policy costs. Caps can also take the form of a limit on total expenditure, as in Malaysia.
• Tradable green certificates (TGCs) systems are based on the idea of separating the actual power and its "greenness". The power is sold on the normal market. In addition, generators of RE can sell a certificate that represents a certain amount of renewable electricity that they generated. A separate market is established for these certificates. Demand for certificates is ensured by establishing a quota obligation. Certificates are sold to large consumers or retailers of electricity that are obliged to buy a certain number of these certificates. The size of the quota obligation is an upper bound for the annual generation volume, because prices would drop sharply if there were an oversupply of certificates. TGC schemes usually include a fine that the entities under the obligation have to pay if they fail to buy enough certificates. In most cases, this penalty rate determines an upper bound for the value of certificates. In their original form, certificates did not differentiate by technology. Today some schemes issue more certificates for the same amount of electricity produced by more expensive, yet promising technologies to stimulate deployment of a portfolio of technologies.
• Tenders are used when a regulatory authority announces that it wishes to install a certain capacity of a given technology or suite of technologies. Project developers then apply to build the project and name the price at which they are willing to develop the project. Tenders commonly contain specific requirements (e.g. shares of local manufacturing, details of technological specifications, maximum price per unit of energy). The bidder with the lowest offer is selected and can go ahead with the project. Usually the parties sign a long-term contract (power purchasing agreement). Tenders are frequently used to meet government-set quotas in systems where there is no trading of certificates.
• Tax incentives or credits are used, particularly in the United States, to support RE technologies. An important prerequisite for this scheme to function is that tax credits can be traded, as is the case in the United States. If a wind farm operator generates USD 100 worth of tax deductions, the project owner can sell this deduction to companies that can then deduct this amount from their taxes.
• Direct cash grants/rebates can be used to reduce investment costs and so improve returns for investors. In the United States, the Section 1603 grant scheme works as follows: RE technology project developers get back 30% of the investment costs in cash. This payment lowers the effective price that project developers see and, therefore, makes the technology more competitive. This measure was introduced after the market for tax credits (see previous bullet) had collapsed due to the economic and financial crisis in 2009.
The in-depth regional analysis (see Renewable Energy:Markets and Prospects by Region [Müller, Marmion and Beerepoot, 2011]) revealed several trends among global support policies. FITs and FIPs are the dominant support policies for wind power and solar PV in the majority of focus countries, particularly in OECD Europe.
065-106 Chapter 3 AIE RENEWABLES.indd 80065-106 Chapter 3 AIE RENEWABLES.indd 80 09/11/11 11:2709/11/11 11:27
© O
EC
D/IE
A, 2
011

Chapter 3: Policies for Deploying Renewables
81
The United States pursues a specific approach that involves relying mainly on quota obligations on the state level, while relying on tax incentives and, most recently, cash grants on the federal level. China has taken a portfolio approach in supporting its RE deployment, combining FIT policies with quota obligations and other instruments. Brazil has turned to tenders for regulating RE technology deployment. In Brazil’s 2011capacity auctions, wind energy was more competitive than gas generation without particular support for wind energy.
The mechanisms presented differ in several ways. They differ in the extent to which regulators can manage the rate and volume of deployment. They provide different opportunities to manage the prices paid to developers, and to control overall policy costs, and they provide different levels of security and certainty about the income that developers will receive. They also involve differing levels of bureaucracy, which make them more or less suited, for example, to small-scale deployment.
Deployment rate and volume
In most FIT systems, the price paid for a certain amount of energy is fixed, and the market volume is unconstrained. This type of scheme has worked very well for a number of technologies (such as onshore wind), but it has proved problematic for a number of countries that have used FITs as a financial support instrument for solar PV. With fixed FIT tariffs and rapidly falling PV module prices, rates of return became highly attractive, leading to an explosion of capacity, and extremely high overall policy costs. Some special factors relating to PV, however, underpin this problem (see Chapter 4).
To avoid such situations, policy making needs to take several factors into account. Policies should be designed in a way that makes them adapt to changes in system costs in a predictable way: by providing a clear schedule for regular review, by linking degression rates to deployment volumes, or by indexing support levels to globally traded PV equipment prices, as far as transparent markets exist.
Announcing decreases in support levels in advance can lead to a rush for projects to take advantage of higher tariffs while they are in place. If tariff digressions occur in combination with other relevant deadlines (such as closure of the financial year for claiming tax reductions), a rush effect can be even more pronounced. Such pressure on markets can lead to unnecessary spikes in deployment cost.
Policy measures can either introduce a limit to the capacity supported at a particular price or follow the German “breathing cap” mechanism.4 The deployment should also be co-ordinated internationally to ensure that a few countries do not have a dominant share of the global market.
The situation also depends on the structure of global markets. Pronounced spill-over effects between countries will happen when levels of support are modified in one national market while deployment is concentrated in only a few markets. If the market is shared among more countries, such effects will be less marked.
4. The German feed-in law couples tariff evolution to deployment. If deployment exceeds a certain amount, tariffs are cut more; if deployment lags behind, tariffs are cut less. This procedure, however, only takes domestic market data into account. Incorporating global data (module price index) may lead to some further refinement of the mechanism.
065-106 Chapter 3 AIE RENEWABLES.indd 81065-106 Chapter 3 AIE RENEWABLES.indd 81 09/11/11 11:2709/11/11 11:27
© O
EC
D/IE
A, 2
011

82
Deploying Renewables: Policies for Deploying Renewables
In principle, the tax-credit mechanism also contains no explicit mechanism for controlling volumes, leaving aside the more theoretical constraint that deductions can take place only up to the level of total taxation. The levels of incentive, however, are usually lower, and no examples exist of “run-away” deployment involving such schemes.5
Such volume problems do not occur using the TGC, tendering and grant-based systems. These systems have built-in ways of controlling the deployment volumes such as controlling how the TGC cap moves, tendering for set levels of capacity or constraining the budget available for capital support. These systems also allow the overall rate of deployment to be managed, although, in the case of TGC schemes, the total volume, rather than levels of specific technologies, is influenced by the cap. TGC systems, though, are capable of adjusting certificate prices up to the point where deployment will pick up. Compared to FIT systems that provide too low tariffs, TGC systems are less likely to have zero deployment; this quality can be seen as a built-in volume control of TGC.6
As regards the capacity for TGCs, the situation is complementary. The market determines the price of a certificate and kilowatt-hours of electricity, while policy steers the market volume through the quota obligation.
The properties of policy mechanisms are not the only factors shaping deployment dynamics. Technology properties are also of importance: a very modular technology is simply more difficult than a more bulky technology to steer on a certain path (e.g. solar PV and biogas vs. offshore wind and CSP).
Price
FIT systems allow a disaggregated set of specific prices to be established for particular technologies, within particular scale ranges, and in particular applications (for example, building integrated and stand-alone PV). Individual prices can be adjusted in the light of market trends or to provide signals to the market that further price reductions need to be delivered. To take advantage of the flexibility, regular reviews of the tariffs are required, and the ability to carry out these regular reviews needs to be built into the legislation. To provide market certainty, the schedule for reviews needs to be clear; on the other hand, approaching tariff deadlines can be a cause of accelerated deployment, as investors rush to secure the higher tariff levels.
For TGCs, the “buy-out fee” determines the value of the green certificate, and hence the maximum price at which the RE can be sold. In some cases, such as the United Kingdom, a recycling mechanism feeds back the buy-out fees to eligible generators. This mechanism increases the value of the certificate, but also introduces a variable element that depends on the extent to which the generation cap has been reached. Originally most TGC schemes were technology neutral, and provided one certificate per unit of electricity to all eligible technologies. This arrangement attracted investment in the most cost-competitive technologies, but did little to bring forward capacity in the newer or more expensive parts of the portfolio.
5. Tax deductions can be an element of an “overheating” system. This was recently the case in Belgium, where tax deductions, combined with a TGC system, led to very rapid deployment.6. This can also help to explain why certificates are sometimes more costly than FITs, as TGCs can “buy away” non-economic barriers such as administrative hurdles by providing higher returns.
065-106 Chapter 3 AIE RENEWABLES.indd 82065-106 Chapter 3 AIE RENEWABLES.indd 82 09/11/11 11:2709/11/11 11:27
© O
EC
D/IE
A, 2
011
Chapter 3: Policies for Deploying Renewables
83
Banded schemes, which offer more or fewer certificates per unit for different technologies, have been introduced to assist in developing a wider portfolio without over- or under-rewarding investors in different technologies. Reviews of the banding levels allow the returns to investors to be tuned in light of technology cost evolution and market developments. TGCs can, therefore, provide a level of price control, although the extent to which fine-tuning can be carried out is usually less than for FITs. In addition, floor prices can be introduced for certificate trading. This strategy may increase the certainty of revenue streams for investors and thus stimulate deployment.
FITs, banded TGC schemes and schemes with price floors require that the regulators have good market knowledge in establishing tariff levels that neither over- nor under-reward investors.
Tendering schemes avoid this problem by establishing a competitive bidding situation and allowing industry to come forward with prices. The prices and overall costs of the tender are not managed, but they can be controlled by setting a maximum price that would be payable. In some cases, tenders are offered for generation at a fixed cost over a number of years. Tendering is thus a good mechanism for price discovery and for ensuring competitive pricing. In recent auctions in Brazil, bidders were required to guarantee a certain price over the entire project period. This requirement had the effect that wind power was able to bid at a lower price than gas, due to the uncertainty of future Brazilian gas prices.
One risk is that developers will bid too low to secure the tender and then find returns on investment too low to secure financing for the project. Developers may even “game” the system by deliberately bidding too low. Once project development has progressed for some time, the developers may pressure governments (which want to meet their targets and are now dependent on project success to do so) to retroactively raise prices.
Tax-incentive schemes have no way of influencing prices; projected returns on investment with the incentives are either sufficient to stimulate investment, or not.
Capital grant schemes can be tuned to provide some measure of price control, for example, by providing a grant at a certain percentage of capital costs up to a certain limit.
Investor securityAnother important difference between FITs and TGCs is the risk exposure of generators. Under a classic FIT scheme, generators receive a fixed income for each unit of electricity and, therefore, are not exposed to market price fluctuations at all (except in some adapted versions, where a premium above the electricity rate is paid). In any case, FITs and FIPs do not expose generators to the price volatility of a certificate.
Under a TGC scheme, generators are exposed to both electricity market and certificate market risk. Generators can mitigate this risk by securing long-term power purchase agreements (PPAs) covering the value of the electricity and certificates, but at some discount.7 Investors may use conservative income values in preparing their investment cases, and so seek higher returns to mitigate these perceived higher risks.
7. Note that quota obligations can exist in the absence of a certificate market. This is the case under some Renewable Portfolio Standards. In such cases, the party that is obliged to fulfil a certain quota can directly sign a PPA with a project developer. Examples even exist of using a FIT (paid by a party obliged to meet the quota obligation) to IPPs.
065-106 Chapter 3 AIE RENEWABLES.indd 83065-106 Chapter 3 AIE RENEWABLES.indd 83 09/11/11 11:2709/11/11 11:27
© O
EC
D/IE
A, 2
011

84
Deploying Renewables: Policies for Deploying Renewables
Tenders, when linked to secure PPAs at fixed or indexed power prices, provide a high level of security to developers and investors.
Another element of security relates to the longevity of the support schemes, which is important for building investor confidence that a viable overall market, not just a few projects, will be created. This is particularly important for the equipment supply industry. FITs and TGC schemes are usually promoted as long-running mechanisms that provide such security. The cost of the support schemes is usually funded by passing on additional costs to consumers. This arrangement insulates the project from public expenditure reviews and cuts.
Tenders, tax incentives and grant schemes offer less security in this sense, because they are usually of more limited duration. Tax breaks and capital grants are also dependent on public expenditure and budget uncertainties and are, therefore, vulnerable to cuts. These conditions are more likely to lead to stop-go patterns of deployment, and this is not conducive to investment in the manufacturing facilities needed to support large-scale deployment. The US wind industry, which is principally stimulated by tax incentives, experiences these swings in deployment levels. Such boom-and-bust cycles can lead to spikes in equipment prices during a boom phase, because the high uncertainty prevents the development of a robust supply chain.
Transaction costs and complexityThe policy options also differ with respect to their transaction costs and complexity. Under a FIT, the distribution grid operator is usually responsible for paying the generator. The contractual arrangements and procedures can be simplified. FITs are often very effective in establishing a low-risk environment that is needed to kick-start markets and allow smaller players to enter the market.
With a TGC system, generators need to sell on the certificate and power markets. The complexity and transaction costs associated with such systems are higher and not as accessible to smaller investors as FITs. The United Kingdom, where a TGC scheme has been the principal tool for incentivising renewable investment for more than 10 years, introduced a FIT scheme in 2010, focused on projects below 5 MW.
For similar reasons, tenders are best suited to larger-scale developers and investors, whereas tax-based incentives and grant schemes can be applied at different scales.
TGC systems, however, can be adapted to facilitate the involvement of smaller generators. Guaranteed price floors, or the option of selling certificates to government bodies for small-scale projects, are examples of how to adapt TGC systems to the need of small generators, such as private households or small community projects.
065-106 Chapter 3 AIE RENEWABLES.indd 84065-106 Chapter 3 AIE RENEWABLES.indd 84 09/11/11 11:2709/11/11 11:27
© O
EC
D/IE
A, 2
011

Chapter 3: Policies for Deploying Renewables
85
Overall characterisationThe characteristics of the various mechanisms are summarised in Table 3.3.
Table 3.3 Characteristics of electricity support mechanisms
FIT/FIP TGC Tender Tax incentive Capital grant
Deployment volume management
Diffi cult unless designed with capacity cap.
Built-in but not techno-logy specifi c.
Good. None. Possible via cap on grant volumes.
Price control Very specifi c control possible; frequent reviews required.
Price capped by buy-out fee and set by market; price fl oors can be introduced.
Good. None. Possible by setting maxi-mum grant levels.
Investor security
High, some exposure to electricity market fl uctuations for FIPs.
Exposed to electricity and certifi -cate market risks; can be mitigated by fl oors.
High once concession is obtained, very low during bidding phase.
High but susceptible to budget cuts.
High but susceptible to budget cuts; especially attractive at high discount rates.
Transaction costs/complexity
Relatively simple if procedures streamlined and applicable to small developers.
Complex, best for larger developers; can be mitigated by introducing public buyer for small projects.
Relatively straight-forward but best for larger projects; risk of too aggressive bidding and “gaming”.
Relatively simple as part of overall tax management.
Relatively simple.
Support policy options for the heat sector
Heat policy options
Policy design and analysis for renewable heat have not received as much focus as that for renewable electricity, and a number of key additional barriers are holding back the deployment of renewable heat. Direct capital cost subsidies and tax incentives or soft loans for the purchase of a renewable heating system are to date the most widely adopted financial mechanism in the European Union for the support of renewable heat (Connor et al., 2009).
065-106 Chapter 3 AIE RENEWABLES.indd 85065-106 Chapter 3 AIE RENEWABLES.indd 85 09/11/11 11:2709/11/11 11:27
© O
EC
D/IE
A, 2
011

86
Deploying Renewables: Policies for Deploying Renewables
More recent innovative policies include renewable obligations, such as a solar obligation in Spain, renewable heat obligations in new buildings in parts of the United Kingdom and Germany, and a yet-to-be-introduced renewable heat feed-in tariff in the United Kingdom.
Capital cost subsidies are the dominating policies for renewable heat technology, and in some cases have been used for a long time, as e.g. in the case of solar thermal technologies, where subsidy schemes started early 1980s. In these long time spans, a capital cost subsidy often exists on a stop-and-go basis.8 The stop-and-go nature of capital cost subsidies reveals one of its weaknesses: the subsidy scheme usually depends directly on the public budget and therefore alters with a changing political agenda. Another disadvantage is the absent guarantee of producing renewable heat, because the subsidy is usually provided upfront without checking compliance of (properly) installing the equipment. Advantages of capital cost subsidy schemes consist of the low transaction cost relative to other schemes, especially if an administration used to handle subsidy schemes is already operational. A capital cost subsidy, being a direct transfer of money upon purchase, might (psychologically) be considered very attractive to individual consumers who are used to paying for their heating/hot water installation as a one-time investment. This perspective can differ from country to country, however. In some countries, consumers are familiar with borrowing money for this purpose.
A number of tax-related instruments can positively affect the economics of renewable heat technology, based on creating either new revenue to subsidise renewable heat technology or different forms of tax breaks for renewable heat technology. Tax revenues can come from taxation of fossil fuels or raising taxes elsewhere with revenue directed towards renewable energy. Tax breaks can include VAT exemptions, tax credits, and deductions from income tax or company tax. Tax-related instruments are effectively subsidised from the public purse and have often proven to be able to remain rather stable. An argument that can be made against tax incentives is that they are not consistent with the “polluter–pays” principle in those situations where businesses are subsidised to make investments more profitable.
Soft loans provide access to finance below the market rate to tackle the barrier of high initial capital costs. Loans can be made available through state-owned banks so that the government, or the government agency, becomes a lender for specific purposes. Acceptability of soft loans depends on cultural and historic preferences in different countries. Cultural preferences determine whether consumers prefer to take out loans for a heating installation or to pay from their own capital. The preference common in a country influences the potential successfulness of a soft loan scheme.
More recently, renewable heat policies tend to favour regulatory approaches for the renewable heat market. In 2000, Barcelona introduced a solar obligation, and its success resulted in the Spanish government developing a national solar obligation policy in 2006. Because a solar obligation incentivises one specific technology, such a policy should be introduced only in cases where no competition exists with other renewable technologies for the same purpose. Weaknesses of the solar obligation include the need to check compliance and the lack of an incentive for surpassing the required level of the obligation. The solar obligation is not an entirely new policy though; this policy was introduced in Israel in 1980 (Box 3.2). Other regulatory approaches consist of requiring a share of a building’s heating demand to be generated by
8. E.g. in the Netherlands, a capital cost subsidy for solar thermal systems had first been introduced in 1988 and was adjusted in 1992, 1995, 1997, 2000 and stopped in 2003. A subsidy scheme was reintroduced in 2009.
065-106 Chapter 3 AIE RENEWABLES.indd 86065-106 Chapter 3 AIE RENEWABLES.indd 86 09/11/11 11:2709/11/11 11:27
© O
EC
D/IE
A, 2
011

Chapter 3: Policies for Deploying Renewables
87
renewable energy, such as in the London “Merton rule” and the German 2009 building regulations. This type of obligation allows for competition among renewable (heating) technologies, but still lacks an incentive for surpassing the required renewable share in heating demand, which in the case of the Merton rule consists of a modest 10% renewables. When applied to new buildings only, the deployment effect may be limited, as in OECD countries where annual construction rates are on average about 1% of the total building stock. In both examples of regulatory instruments, policies focus on the building level, which can disfavour medium- and large-scale options that are most relevant at the scale of a building district.
Box 3.2 Solar obligations Israel
In 1980, Israel was the first country to make solar thermal systems obligatory in new residential buildings, with the aim of reducing the country's dependence on imported energy. The solar thermal obligation applies to all new buildings, except those used for industrial or trade purposes or as a hospital, and those higher than 27 metres. The required daily heat output of the solar system differs according to the use of the building and on the kind of solar system installed. Due to the solar obligation, solar thermal systems are now a mainstream technology in the water heater market without any financial support. In Israel, solar thermal has reached the critical mass of market size necessary to create self-sustained growth without any subsidy. Today, Israel has over 1.3 million solar water heaters, saving an estimated 8% of Israel’s electricity consumption as a result of mandatory solar water heating installations (ESTIF [European Solar Thermal Industry Federation], 2007). Today more than 90% of Israel's solar thermal market is in the voluntary segment, including installation on existing buildings and systems larger than required by law. Due to decreased prices, typical payback times are about three to four years (ESTIF, 2007).
In early 2011, the United Kingdom announced the introduction of a Renewable Heat Incentive, which will be the first initiative for a feed-in tariff type of policy for the heat market (DECC [Department of Energy and Climate Change], 2011). In Germany, the introduction of a renewable heat feed-in tariff policy has been explored but pushed aside in favour of an obligation type policy (see Bürger et al., 2008). Ideally, a renewable heat feed-in tariff scheme, as with such systems for renewable electricity, should allocate and distribute the additional costs of renewable heating technology among all heating fuel consumers according to the “polluter-pays” principle. Complications of introducing to the renewable heat market a feed-in tariff scheme that is similar to those used for renewable electricity arise from some key differences in delivery of heat as compared to electricity (Bürger et al., 2008). The more heterogeneous delivery of heat and of fuels used for heat production means that a far more diverse group of companies supplies the market. Failure to include any companies supplying heat energy in the mechanism when assigning costs will effectively result in those companies gaining an economic advantage over their competitors.
A key problem in a renewable heating feed-in tariff scheme is that of assessment of generated heat output. The cost of heat metering relative to any available subsidy is likely to continue to be a disincentive for smaller generators, suggesting that an alternative is needed. An additional factor makes metering for small-scale production problematic. Generally no “grid” exists to which excess domestic heat can be delivered. Installing a meter may, therefore, create an incentive for overproduction of heat, i.e. “heat production with open windows”.
065-106 Chapter 3 AIE RENEWABLES.indd 87065-106 Chapter 3 AIE RENEWABLES.indd 87 09/11/11 11:2709/11/11 11:27
© O
EC
D/IE
A, 2
011

88
Deploying Renewables: Policies for Deploying Renewables
Renewable heating policies: need for customised approaches?
General policy principles for renewable policy design also count for incentivising renewable heat: it requires long-term predictable and stable policies and transitional incentives, decreasing over time, to foster and monitor technological innovation and move technologies quickly towards market competitiveness. The different levels of technological maturity represented by the renewable heat technologies mean that they require different policy instruments.
Renewable electricity policy experience may provide useful when developing renewable heat policy. Care must be taken, though, when copying instruments from the renewable power sector to the renewable heating sector, because the heat sector is very different from the power sector in complexity of delivery and (distributed) generation of heat and the more fragmented market for heat. Because many renewable heat technologies are targeted to individual or local consumers, cultural preferences can determine the successfulness of policies, much more so than in the globalised world of investors in the power sector.
In countries with considerable shares of district heating, the importance of this sector in realising a decarbonisation of the heat market is very relevant, and local authorities can have a huge influence in enhancing the deployment of renewable heat. Not only “national policies” are needed to increase renewable heat deployment; “regional” or “local” policies also have an important impact. Because heat should be consumed close to its production, local authorities may as well have the capability of developing “heat policy plans”. These plans can map out heat supply, on the one hand (e.g. waste heat from industry and electricity production as well as locally available renewable heat resources) and heat demand, on the other hand. Many examples already exist of local authorities that successfully influenced deployment of renewable energy, with renewable heat often playing an important role (IEA, 2010e).
Renewable heat policies have so far mainly targeted the building sector. Policy makers should be aware that nearly half of the final energy for heat is consumed in the industry sector and thus requires policy attention as well. Especially in warm climate countries, industrial process heat is often responsible for enormous shares in total final energy use. In many of these countries, renewable heat resources (e.g. solar heat) are abundantly available, but policy intervention is needed to reveal the potential.
Due to the specific characteristics of the delivery and trading of heat, the heterogeneity of heat as an energy commodity, the local constraints in availability of renewable heat resources, and the climate-dependent heat demand, renewable heat policies may not be able to follow any ready-made concept. Renewable heat policies may need local approaches and approaches that may be different for each target group, e.g. depending on whether the policy covers commercial heat production or on-site domestic heat. More analysis of heat policies will be needed to be able to identify most effective and efficient custom-made renewable heat policies.
Support policy options for the transport sector
In the transport sector, the principal policy tools for stimulating demand for biofuels are blending mandates coupled with fuel duty rebates. A mandate legally requires fuel retailers to add a certain percentage of biofuels to the conventional fuel. Mandates are now in place in nearly 50 countries (IEA, 2011c) (Table 5.4).
065-106 Chapter 3 AIE RENEWABLES.indd 88065-106 Chapter 3 AIE RENEWABLES.indd 88 09/11/11 11:2709/11/11 11:27
© O
EC
D/IE
A, 2
011
Chapter 3: Policies for Deploying Renewables
89
Blending mandates are a suitable measure to drive biofuel use and production. They need to be sufficiently ambitious to drive biofuel deployment, without inducing undesired competition with food and fibre production. Mandates alone, however, are not enough to promote the deployment of the technologies that perform best in terms of land use, energy efficiency, GHG reductions, and social and economic impacts. This is particularly true for advanced biofuels, which are currently disadvantaged by higher production costs.
The United States is the only country with a specific quota for cellulosic biofuels. The EU Renewable Energy Directive (EU, 2009) promotes lignocellulosic biofuels, as well as biofuels from algae, wastes and residues, by counting their contribution twice toward the 2020 target. Neither support policy sufficiently addresses the higher production costs of advanced biofuels compared with conventional biofuels and fossil fuels.
To drive development of biofuels that provide considerable emission savings and at the same time are socially and environmentally acceptable, support measures need to be based on the performance. Minimum GHG savings for biofuels as mandated in the US Renewable Fuel Standard II (RFS II) and the EU Directive are important steps to ensure that biofuel use contributes to emission reduction targets. Another approach is to directly link financial support to life-cycle CO2-emission reductions (calculated with a standard life-cycle analysis [LCA] methodology agreed on internationally) and support those biofuels that perform best with regard to CO2 savings. In both cases, advanced biofuels could profit because they promise particularly high GHG savings. However, well-performing conventional biofuels would be supported equally, meaning that the approach would not address the cost disadvantage that advanced biofuels face in the short term.
On their own, neither specific advanced biofuel quota nor performance-based support measures seem to be effective in addressing the higher production cost of advanced biofuels in the short term. Specific transitional measures may thus be needed to support the introduction of the new technologies, for instance through tax incentives or measures analogous to FITs in the electricity sector when RE technologies first enter the market.
Financial incentives could be coupled to the use of co-products, such as waste heat, to promote efficient use of by-products (e.g. a mechanism similar to the co-generation bonus for biogas electricity in Germany). Rewarding best practices in the cultivation of feedstocks can also help to promote the use of sustainable biofuels.
Tackling non-economic barriers
Much focus and attention have been placed on policies to address economic barriers, but persistent non-economic barriers, such as government energy policies skewed against RE and high administrative burdens, can seriously affect the prospects for deployment. These barriers can have a significant financial impact; especially if they obstruct the early investment-intensive project cycle phases (project development, financial closure and construction). This obstruction increases the required investment return, thereby raising levelised generation costs. The right policies can overcome most barriers. Measures to reduce these barriers can include streamlining administrative procedures and ensuring that supportive rather than conservative institutions are in place.
065-106 Chapter 3 AIE RENEWABLES.indd 89065-106 Chapter 3 AIE RENEWABLES.indd 89 09/11/11 11:2709/11/11 11:27
© O
EC
D/IE
A, 2
011

90
Deploying Renewables: Policies for Deploying Renewables
The following examples are just a selection of the types of difficulties that RE technology deployment tends to experience and the solutions that have been found so far. The selection does not seek to identify the “worst” cases. Rather it aims to give more life to the otherwise very abstract notion of non-economic barriers.
Renewable heat markets often suffer from split incentives.Persons renting an apartment (tenants) normally cover the operating costs of the apartment, including the cost of warm water and heating. Owners of real estate, on the other hand, are commonly in charge of covering the costs of investments, such as a new heating system. If a more effi cient or environ-mentally friendly option has a higher up-front cost, building owners are less likely to buy this option. This is true even if the total costs of the application are lower, i.e. the benefi ts outweigh the additional costs in the long term. This type of barrier has proven to be a major problem for the larger market penetration of solar heating systems and more effi cient space heating sys-tems.
The Dutch residential valuation system aims at resolving split incentives.
In general, two basic approaches may be taken to resolve this problem. The fi rst approach is to create mandatory standards for the effi ciency of new buildings or the technologies that need to be used. This type of policy has fostered the deployment of solar water heaters in Israel since the 1980s. Spain and Germany also have such obligations for new buildings.A second, innovative approach to address the problem of split incentives in existing buildings has recently been conceived in the Netherlands. In the Netherlands, some 32% of the housing stock consists of social housing, managed by housing associations. This sector is heavily regulated by the central government by means of a system that prescribes maximum rents relating to housing quality, the so-called “residential valuation scheme”. Up to now, this system complicated energy conservation initiatives, because housing associations did not benefi t from increasing the energy label of their stock: the split-incentive. From 1 July 2011, the “residential valuation scheme” is expected to attribute a valuation to the energy label of a property, which allows the housing association to raise the rent whenever the energy label is improved. The tenant is expected to benefi t from the new scheme as well, because the scheme is designed in such a way that the rent increase will be less than the savings on the energy bill.M
arke
t
+
–
065-106 Chapter 3 AIE RENEWABLES.indd 90065-106 Chapter 3 AIE RENEWABLES.indd 90 09/11/11 11:2709/11/11 11:27
© O
EC
D/IE
A, 2
011

Chapter 3: Policies for Deploying Renewables
91
Renewable project developers needed a large number of permits in Italy.In Italy, the Autorizzazione Unica (AU) was conceived to provide a one-stop-shop agency that brings together all administrations involved in PV permitting. However, responsibilities still rested with separate administrations, and coordination between different bodies was required. A 2008 study found that no fewer than 50 different permits were required for renewable projects (Ecorys, 2008). In mid-2010, the AU process was still seen as a major bottleneck in PV deployment, according to a study on barriers to PV deployment (PVLegal, 2010). Recently the Italian govern-ment has undertaken measures to resolve this problem, e.g. the Ministerial decree of 10 September 2010 and the decree DLgs. 28/2011.
Leaders in renewables deployment have streamlined permitting procedures.
In the case of small rooftop PV installations, waiting for permits can be a large part of the time required for project development. A study performed for the European Commission (Ecorys, 2008) obtained the results shown in Figure 3.7. At the time, Germany was the only country in the sample that had streamlined “one-stop-shop” permitting procedures. It is also the only country in the study where waiting for permits did not consume more than 50% of the total project development time.9A
dmin
istr
ativ
e
+
–
Figure 3.7 Duration for developing small-scale roof-top PV projects in selected EU countries
Weeks
0
10
20
30
40
50
60
Bul
gari
a
Cze
ch R
epub
lic
Fran
ce
Ger
man
y
Gre
ece
Italy
Net
herl
ands
Port
ugal
Slov
enia
Spai
n
Other
Waitingon permits
Note: Average values shown; error bars show minimum and maximum total durations.
Source: PV Legal (2010). 9
9. Note that one has to be careful when interpreting these results. Long waiting times may indicate an efficient system operating under a large number of requests, or an inefficient system under a normal load. However, given the very dynamic PV deployment in Germany in 2008, it is clear that mere pressure on administrations due to high deployment rates (as was the case in Spain) cannot explain long waiting times alone.
065-106 Chapter 3 AIE RENEWABLES.indd 91065-106 Chapter 3 AIE RENEWABLES.indd 91 09/11/11 11:2709/11/11 11:27
© O
EC
D/IE
A, 2
011

92
Deploying Renewables: Policies for Deploying Renewables
Weak power grids are a bottleneck for Chinese wind power.The government of China has put in place favourable policy and legislation that contribute to the fast growth of renewables. The Renewable Energy Law (National People‘s Congress, 2010) remains the most relevant to overall in-tegration. Under this law, power grid operators are requested to “buy all the grid-connected power produced with renewable energy within the cove-rage of their power grid, and provide grid-connection service for the gene-ration of power with renewable energy”. This should be achieved through grid connection agreements between grid operators and renewable power generation companies. In reality, implementation of this specifi c clause has been inconsis-tent. When local grids are saturated, and cannot accommodate all the incoming electricity or easily transmit the electricity surplus through to adjacent grids, grid companies typically curtail electricity generated by wind farms. This practice refl ects the fact that on-grid prices for coal-fi -red plants are cheaper than those for wind; as result, variable and more expensive wind power loses ground to the cheaper and more reliable electricity from coal plants. In addition to paying out more to bring wind power onto the grid, grid companies are forced to shoulder part of the costs of physically connecting the wind farms. Obviously, the grid companies have little incentive to integrate power sources that increase unpredictability and net variability of their power systems. In Inner Mongolia, the speed and magnitude of mega wind farm construction leave little time for the grid to react to the sudden infl ux of variable electricity from one year to another. It is estimated that the total ins-talled capacity doubled over the course of 2010 (pending release of offi cial data). Insuffi cient inter-regional grid connection causes a substantial wind-power bottleneck.
China has adapted legislation and made grid extension a priority.
In view of the above diffi culties, a revised Renewable Energy Law took effect in April 2010. The revised law now “obliges” grid companies to guarantee the purchase of a minimum amount of electricity from renewable energy. In addition, the 12th fi ve-year plan identifi es grid expansion as a priority area of action. It aims to “Accelerate the construction of outward power supply projects from large coal power, hydro power and wind power bases, and create some cross-regional power transmission channels using advanced technologies. Complete 330 kV or above power transmission lines of 200 000 kilometres.”Although China has started to tackle the issue as a priority, it remains to be seen whether curtailment and non-connection of capacity will be eradicated.
Source: Cheung (2011) and National Development and Reform Commission (NDRC, 2011). Infr
astr
uctu
re
+
–
065-106 Chapter 3 AIE RENEWABLES.indd 92065-106 Chapter 3 AIE RENEWABLES.indd 92 09/11/11 11:2709/11/11 11:27
© O
EC
D/IE
A, 2
011
Chapter 3: Policies for Deploying Renewables
93
The stop-and-go approach of wind energy support in the United States has led to boom-and-bust cycles in deployment.In the United States, a suite of state and federal level incentives is used to support wind power. The US policy approach has been fl awed with uncer-tainty. The two main federal instruments for wind energy support (Investment Tax Credit [ITC] and Production Tax Credit [PTC]) are cases in point: the PTC was enacted in 1992 and currently provides the equivalent of ct USD 2.2 kWh for wind power production in the form of a tax credit. The PTC expired for the fi rst time in July 1999. In December 2000, it was extended throughout the end of 2001. It expired again in 2001, but was extended in March 2002, only to expire again at the end of 2003. It was not renewed until October 2004. It was then extended twice (2005 and 2008), in each case only a few months before its expiration. In February 2009, the PTC was extended until 2012 (DSIRE [Da-tabase of State Incentives for Renewables and Effi ciency], 2011). The ITC was subject to similar last-minute extensions.
Financing the deployment of RE technologies independant of the annual budget increases regulatory certainty.
One reason why the United States has such a changing support environment is the volatile political situation, combined with the fact that tax credits directly infl uence the federal budget. This factor always makes tax credits subject to poli-tical debate. Other support systems (the majority of FITs and certifi cate systems) are not refi nanced from the public budget. In these cases, electricity consumers pay a premium on their bills to support deployment. This method has proven to be a more stable approach to support. However, close attention needs to be paid so as not to put a too large burden on consumers and possible distribution effects from low income consumers to more wealthy consumers who own RE assets.
Reg
ulat
ory
+
–
065-106 Chapter 3 AIE RENEWABLES.indd 93065-106 Chapter 3 AIE RENEWABLES.indd 93 09/11/11 11:2709/11/11 11:27
© O
EC
D/IE
A, 2
011
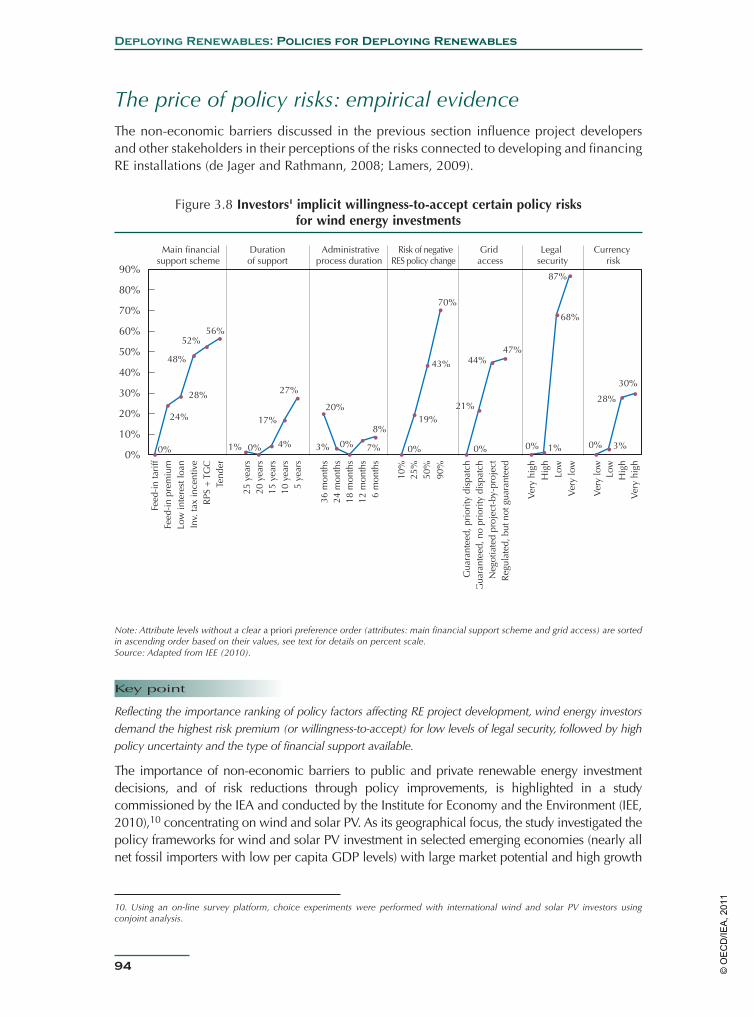
94
Deploying Renewables: Policies for Deploying Renewables
The price of policy risks: empirical evidenceThe non-economic barriers discussed in the previous section influence project developers and other stakeholders in their perceptions of the risks connected to developing and financing RE installations (de Jager and Rathmann, 2008; Lamers, 2009).
Figure 3.8 Investors' implicit willingness-to-accept certain policy risks for wind energy investments
0%
24%
28%
48%
52%56%
1% 0% 4%
17%
27%
20%
3% 0% 7%
8%
0%
19%
43%
0%
21%
44%47%
0% 1%
68%
87%
70%
0% 3%
28%
30%
0%
10%
20%
30%
40%
50%
60%
70%
80%
90%
Feed
-in
tari
ffFe
ed-i
n pr
emiu
mLo
w in
tere
st lo
anIn
v. ta
x in
cent
ive
RPS
+ T
GC
Tend
er
25 y
ears
20 y
ears
15 y
ears
10 y
ears
5 ye
ars
36 m
onth
s24
mon
ths
18 m
onth
s12
mon
ths
6 m
onth
s
10%
25%
50%
90%
Gua
rant
eed,
pri
ority
dis
patc
hG
uara
ntee
d, n
o pr
iori
ty d
ispa
tch
Neg
otia
ted
proj
ect-
by-p
roje
ctR
egul
ated
, but
not
gua
rant
eed
Ver
y hi
ghH
igh
Low
Ver
y lo
w
Ver
y lo
wLo
wH
igh
Ver
y hi
gh
Main financialsupport scheme
Durationof support
Administrativeprocess duration
Risk of negativeRES policy change
Grid access
Legal security
Currency risk
Note: Attribute levels without a clear a priori preference order (attributes: main financial support scheme and grid access) are sorted in ascending order based on their values, see text for details on percent scale.Source: Adapted from IEE (2010).
Key point
Reflecting the importance ranking of policy factors affecting RE project development, wind energy investors demand the highest risk premium (or willingness-to-accept) for low levels of legal security, followed by high policy uncertainty and the type of financial support available.
The importance of non-economic barriers to public and private renewable energy investment decisions, and of risk reductions through policy improvements, is highlighted in a study commissioned by the IEA and conducted by the Institute for Economy and the Environment (IEE, 2010),10 concentrating on wind and solar PV. As its geographical focus, the study investigated the policy frameworks for wind and solar PV investment in selected emerging economies (nearly all net fossil importers with low per capita GDP levels) with large market potential and high growth
10. Using an on-line survey platform, choice experiments were performed with international wind and solar PV investors using conjoint analysis.
065-106 Chapter 3 AIE RENEWABLES.indd 94065-106 Chapter 3 AIE RENEWABLES.indd 94 09/11/11 11:2709/11/11 11:27
© O
EC
D/IE
A, 2
011
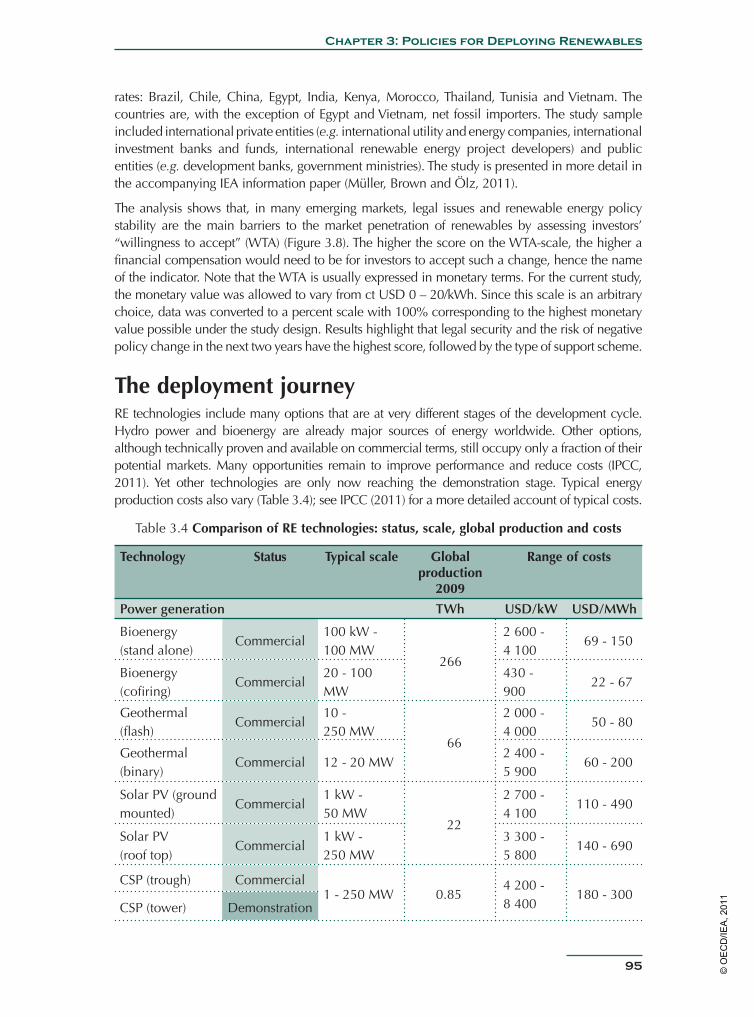
Chapter 3: Policies for Deploying Renewables
95
rates: Brazil, Chile, China, Egypt, India, Kenya, Morocco, Thailand, Tunisia and Vietnam. The countries are, with the exception of Egypt and Vietnam, net fossil importers. The study sample included international private entities (e.g. international utility and energy companies, international investment banks and funds, international renewable energy project developers) and public entities (e.g. development banks, government ministries). The study is presented in more detail in the accompanying IEA information paper (Müller, Brown and Ölz, 2011).
The analysis shows that, in many emerging markets, legal issues and renewable energy policy stability are the main barriers to the market penetration of renewables by assessing investors’ “willingness to accept” (WTA) (Figure 3.8). The higher the score on the WTA-scale, the higher a financial compensation would need to be for investors to accept such a change, hence the name of the indicator. Note that the WTA is usually expressed in monetary terms. For the current study, the monetary value was allowed to vary from ct USD 0 – 20/kWh. Since this scale is an arbitrary choice, data was converted to a percent scale with 100% corresponding to the highest monetary value possible under the study design. Results highlight that legal security and the risk of negative policy change in the next two years have the highest score, followed by the type of support scheme.
The deployment journeyRE technologies include many options that are at very different stages of the development cycle.Hydro power and bioenergy are already major sources of energy worldwide. Other options, although technically proven and available on commercial terms, still occupy only a fraction of their potential markets. Many opportunities remain to improve performance and reduce costs (IPCC, 2011). Yet other technologies are only now reaching the demonstration stage. Typical energy production costs also vary (Table 3.4); see IPCC (2011) for a more detailed account of typical costs.
Table 3.4 Comparison of RE technologies: status, scale, global production and costs
Technology Status Typical scale Global production
2009
Range of costs
Power generation TWh USD/kW USD/MWh
Bioenergy (stand alone)
Commercial100 kW - 100 MW
266
2 600 - 4 100
69 - 150
Bioenergy (cofi ring)
Commercial 20 - 100 MW
430 - 900
22 - 67
Geothermal (fl ash)
Commercial10 - 250 MW
66
2 000 - 4 000
50 - 80
Geothermal (binary)
Commercial 12 - 20 MW2 400 - 5 900
60 - 200
Solar PV (ground mounted)
Commercial1 kW - 50 MW
22
2 700 - 4 100
110 - 490
Solar PV (roof top)
Commercial1 kW - 250 MW
3 300 - 5 800
140 - 690
CSP (trough) Commercial1 - 250 MW 0.85
4 200 - 8 400
180 - 300CSP (tower) Demonstration
065-106 Chapter 3 AIE RENEWABLES.indd 95065-106 Chapter 3 AIE RENEWABLES.indd 95 09/11/11 11:2709/11/11 11:27
© O
EC
D/IE
A, 2
011

96
Deploying Renewables: Policies for Deploying Renewables
Table 3.4 (Continued) Comparison of RE technologies: status, scale, global production and costs
Technology Status Typical scale Global production
2009
Range of costs
Power generation TWh USD/kW USD/MWh
Hydro (large) Commercial100 kW - 10,000 MW
3 077
1 000 - 2 000
18 - 100
Hydro (small and medium)
Commercial100 kW - 300 MW
2 000 - 4 000
50 - 100
Wind onshore Commercial1 kW - 500 MW
3441 400 - 2 500
40 - 160
Wind offshore Commercial100 - 1000 MW
33 200 - 5 800
100 - 190
Wave and tidal R&D,D100 kW -2 MW
0.534 500 - 5 000
200 - 350
Technology Status Typical scale
Global production 2009
Range of costs
Heating and cooling ktoe PJ USD/MWth
USD/GJ
Solar water heating
Commercial1 - 70 kWth
13 027 545120 - 1 800
3.6 - 170
Geothermal (district heating)
Commercial 4 - 45 MWth 5 239 219
600 - 1 600
14 - 31
Geothermal (building heating)
Commercial100 kWth - 1 MWth
1 600 - 3 900
24 - 65
Traditional biomass
Commercial 0-5 kWth 10 10 35042301
NA NA
Modern biomass Commercial5 kWth - 30 MWth
22300 - 1 200
15 - 77
Technology Status Typical scale
Global production 2009
Range of costs
Transport fuels ktoe PJ USD/LGE
Bioethanol from sugar and starch
Commercial 38 497 1 612 0.6 - 0.8
Biodiesel from oil crops
Commercial 15 046 6300.95 -
1.05
Advanced biofuels
R&D,D 0.9 - 1.1
Source: IEA data and analysis, IPCC (2011).
065-106 Chapter 3 AIE RENEWABLES.indd 96065-106 Chapter 3 AIE RENEWABLES.indd 96 09/11/11 11:2709/11/11 11:27
© O
EC
D/IE
A, 2
011

Chapter 3: Policies for Deploying Renewables
97
The evolution of RE technologies can be considered in terms of market diffusion theory (e.g.Usha Rao and Kishore, 2009). This theory assumes that the market grows slowly initially, picks up speed with time and accelerates up to a certain peak, after which it starts slowing down again. Finally growth becomes slower and slower until the market eventually saturates. Plotting the total market size over time produces an S-shaped curve.
The S-shape of the evolution of wind power in Denmark can clearly be identified (Figure 3.9). By contrast, the global picture differs: wind power has just entered the phase in which diffusion theory predicts the most rapid increase.
Figure 3.9 Wind power diffusion in Denmark and the world, 1980-2008
Note: The increase in wind capacity in 2009 in Denmark is largely due to the offshore park Horns Rev 2.
Key point
The Danish onshore wind market has reached the consolidation phase. The global wind market is taking off.
Stages on the journeyThe main challenges to deployment change as progress is made along this deployment curve. The three phases are:
• An inception phase, when the first examples of technology are deployed under commercial terms. Costs at this stage may be relatively high, so the desirable deployment levels may be constrained to manage overall policy costs.
• A take-off phase, when the market starts to grow rapidly. During this phase the costs may be expected to fall, and the aim is to manage the incentives and deployment levels so as to secure deployment in a managed way as far as overall policy cost is concerned. If costs fall, more widespread deployment can be promoted.
• A market consolidation phase, where deployment grows toward the maximum practicable level.
Through these phases, challenges evolve as RE market growth rates accelerate and penetration levels increase correspondingly. In general terms, as market development progresses, certain deployment barriers may occur, and consequently certain issues require policy intervention
0
50
100
150
200
250
300
0
5%
10%
15%
20%
25%
30%TWh
Globalelectricity
production from wind
(TWh)
Wind'sshare
of installedcapacity in Denmark
(%)
1980
1981
1982
1983
1984
1985
1986
1987
1988
1989
1990
1991
1992
1993
1994
1995
1996
1997
1998
1999
2000
2001
2002
2003
2004
2005
2006
2007
2008
2009
065-106 Chapter 3 AIE RENEWABLES.indd 97065-106 Chapter 3 AIE RENEWABLES.indd 97 09/11/11 11:2709/11/11 11:27
© O
EC
D/IE
A, 2
011

98
Deploying Renewables: Policies for Deploying Renewables
(Figure 3.10). Analysis shows that the barriers at each stage are common to each of the three RE sectors (electricity, heat and transport).
Figure 3.10 Deployment journey
Market and operating
Inception Take-off Consolidation
regulation adaptation
Supporting technologies (e.g. power grids)
Manage growth and policy cost
Public acceptance
Economic deployment support for mass market
Priority market access
Supply chain development
Financing
Targets
Initial plants / large-scale demonstration
Institutional and humancapacity building
Resource/cost, technology portfolio assessment
Note: Shading reflects relative importance.
Key point
Policy priorities vary by phase of deployment.
Based on their status and the principal barriers that they face, RE technologies can be considered to occupy different positions along the policy deployment journey (Figure 3.11).
065-106 Chapter 3 AIE RENEWABLES.indd 98065-106 Chapter 3 AIE RENEWABLES.indd 98 09/11/11 11:2709/11/11 11:27
© O
EC
D/IE
A, 2
011

Chapter 3: Policies for Deploying Renewables
99
Figure 3.11 Maturity of selected RE technologies
Technology Sector DemonstrationCommercialisation
Inception Take-off Consolidation
Biomass
Electricity and heat
Transport
Geothermal
Hydro
Marine
Solar
Heat
Electricity
Wind
Thermal gasification
Enhancedgeothermal
Hydro
CSPtrough
CSPtower
Offshore wind Onshore wind
Solar water heatersSolar cooling
Wave Tidal and stream
CofiringAnerobicdigestion
Conventional biofuelsAdvanced biofuels
Modern boilersand stoves
Conventionalgeothermal
PV - 3rdgeneration
PVcristalline and
thin-film
Key point
Several technologies are in the market consolidation phase, meeting normal commercial terms and providing competitive energy in their leading markets. Other technologies have reached the market inception phase and are ready to enter the market in volume.
Developing a national market
The comparison of the status of the wind market in Denmark and on a global scale (Figure 3.9) shows that the Danish onshore wind market is consolidated, while the global market is currently taking off. More generally, the deployment phase of a given technology differs from country to country. In addition, the global market status has important implications for policy making.
Some countries have chosen to take a leading role in the development of certain technologies, even though such arole involves high costs associated with RD&D and the expensive first stages of deployment when system costs are still high. For example, Japan and Germany were involved in the initial phases of PV deployment, and the United Kingdom is now aiming to take a leading role in the development and eventual deployment of marine energy technologies. These leading roles are often motivated by the expectation of significant economic benefits that will arise from being early movers and adopters. Maintaining such a
065-106 Chapter 3 AIE RENEWABLES.indd 99065-106 Chapter 3 AIE RENEWABLES.indd 99 09/11/11 11:2709/11/11 11:27
© O
EC
D/IE
A, 2
011

100
Deploying Renewables: Policies for Deploying Renewables
lead once the technologies mature can be challenging and requires continuing high-level innovation (see page 70).
When countries seek to introduce new technology options into their economies, they can, of course, benefit from international experience and learning, particularly as they can access commercially available technology that has been deployed in other markets, and so benefit from technical improvements and costs reductions that should make introduction easier and less costly. They will still face many of the inhibiting barriers in their own market, however.Technologies may have to be adapted to local conditions. The local supply chain (for example, for installation and maintenance services) will need time to develop. Because of a lack of commercial and physical infrastructure, these initial projects are likely to be more expensive than those in well-developed markets. Many of the non-economic barriers will have to be tackled in ways that are compatible with local market structures, legislation and regulations. Time will also be required to build up the regulatory and commercial capacity.
In many ways, policy journeys need to be repeated in each new country, although hopefully the process can be short-circuited by making use of technology learning and cost reduction, along with the policy lessons learned in more mature markets.
Overarching policy requirementsThe following sections discuss the policy requirements for each of the three deployment phases. Some overarching policy requirements, however, apply in all three stages.
The renewable policy should be an integral part of an overall energy strategy or plan, designed to meet overall energy, environmental and economic policy goals. The policy should be based on the best available evidence about the available resources and technologies. Depending on the resource endowment, the structure of the existing energy system and expected patterns of consumption, different technologies are best suited for the needs of a specific country. A portfolio of technologies best suited to meet requirements should be developed.
An important component of a successful policy package, and an essential element in building the necessary investor confidence, involves clear, transparent and credible targets, for the long, medium and short term, backed up by specific policy measures to tackle the economic and non-economic barriers.
Given the differences in status and costs for the technologies in the RE portfolio, policy makers need to tailor policies and incentives to bring forward the specific technologies required rather than using a technology-neutral approach (at least in the inception and take-off phases). This approach allows for targeted support to bring forward the required portfolio without providing too high levels of support for technologies that are close to being competitive. It also provides enough support to bring forward technologies at an earlier stage of deployment to allow progress down the cost curve. In the medium term, this approach is likely to be lower cost than a “one-size fits all” approach. The RE policy must also be integrated with other initiatives and policy measures (for example, with the establishment of carbon instruments) (Philibert, 2011).
Policy makers and regulators have to respond dynamically to the market, given the market’s rapidly changing nature and fluctuating costs. Policy makers must also play an active role in
065-106 Chapter 3 AIE RENEWABLES.indd 100065-106 Chapter 3 AIE RENEWABLES.indd 100 09/11/11 11:2709/11/11 11:27
© O
EC
D/IE
A, 2
011
Chapter 3: Policies for Deploying Renewables
101
the market. They must understand what is happening in the market (both in the country in question and internationally), monitor and review progress toward objectives, and fine-tune measures in the light of successes and failures. This requirement applies throughout the policy journey and for technologies at each stage of development.
Market inceptionDuring the inception phase, the main issues to be addressed include:
• establishing the costs and potential of the technology so as to be able to set targets in an informed way;
• establishing the feasibility and credibility of deploying the technology via pilot or demonstration plants;
• ensuring that grid or market access can be achieved;
• developing the institutional capacity required to manage and monitor deployment (e.g. permitting issues);
• establishing a supply chain capability (including local installers, maintenance contractors, etc.); and
• identifying and tackling other institutional barriers to initial deployment.
Key policy priorities at this stage include:
• establish a clear roadmap, including targets that provide confidence that policies will support the market introduction of these technologies into the future, as long as performance and cost targets can be achieved;
• provide a suitable mixture of support, including support for the capital costs (via grants and/or loan guarantee systems) and revenue support (for example, via enhanced electricity tariffs or ring-fenced quotas for production within certificate trading schemes or blending mandates);
• ensure the necessary regulatory framework is in place, and streamline processes and procedures as far as possible; and
• support the continuing industry-led R&D work needed to optimise performance and reduce costs, with industry increasingly taking on the R&D investments costs as the technology matures.
Policy measures must help to ensure a smooth transition from the R&D and demonstration stages into the early stages of deployment. Significant challenges, mostly linked to a lack of coordinated policies to reduce investor risk and the resulting funding gap, can hamper the transition. The absence of adequate financing means that the point at which innovative energy technologies might be deployed in the market and prove themselves on a large scale may be delayed, or at worst fail, a phenomenon commonly termed the commercialisation “valley of death” (Mizuno, 2010).
This issue is a particular problem for technologies that are not modular (such as solar PV and wind, where individual cells or turbines can be tested) but need to be developed at a large scale early on in the development cycle. In these cases, the commercial risk is substantial, and the sums of funding needed to catalyse the projects are on a scale that
065-106 Chapter 3 AIE RENEWABLES.indd 101065-106 Chapter 3 AIE RENEWABLES.indd 101 09/11/11 11:2709/11/11 11:27
© O
EC
D/IE
A, 2
011

102
Deploying Renewables: Policies for Deploying Renewables
exceeds funding available within many national energy RD&D budgets. Examples include large-scale demonstration of advanced biofuels production and demonstration of offshore wind arrays and marine energy devices. In these cases, innovative thinking is needed on how public and private funding mechanisms can be brought together to facilitate the necessary progress, perhaps via the development of loans guarantees and similor instruments.
The policy approach for market inception also depends on whether a country aims to move a technology down its learning curve as part of deployment, or wants to benefit from past learning and deploy an already mature technology.
These two goals have important differences. The first approach represents a technology leader; the second represents a technology follower.
In a technology leader country, the inception phase allows for the first introduction of full-scale installations provided under commercial terms (e.g. with performance guarantees) and subject to routine regulatory and legislative provisions. This phase aims to establish the credibility of the technology under commercial conditions, demonstrate effective operation at a full scale, and establish capital and operating cost baselines. Costs are likely to be high, because design costs are high and the supply chain is immature. Financing is difficult and costly, because investments are seen as technically and commercially risky and reliant on continuing public-sector support. Technologies often receive both capital and revenue support during this phase, because projects are often some way from being cost competitive in their markets. During this phase, too, anticipated costs may actually rise as problems are identified and solved.
Technologies that are currently in the inception phase of technology-leading countries include offshore wind energy, enhanced geothermal systems, concentrating solar power and advanced biofuels. Each technology has significant technical potential and scope for cost reduction, and features strongly within the IEA Scenarios, which to some extent rely on their successful and early deployment. Each technology, however, is also still perceived as technically and commercially more risky that those further along the development journey, and costs are still relatively high compared to alternatives.
Technology follower countries typically wait until particular technologies are well-established internationally and until costs have reduced. They are then able to progress through the inception phase more rapidly and at lower cost.
Take-offIn the subsequent take-off phase, further emphasis needs to be given to the challenges of providing the right support structures that lead to deployment as effectively and efficiently as possible; and continuing to tackle and remove non-economic barriers.
A significant economic barrier is likely to arise, reflecting the global picture or involving additional costs associated with the earlier stages of deployment such as absence of a local supply chain infrastructure, perceived market uncertainties or non-economic barriers. Policy measures need to provide support mechanisms that maintain market growth as cost-effectively as possible. As deployment rates rise, the overall policy support costs can escalate. The critical challenge, therefore, is to set deployment goals that keep costs within affordable limits while providing sufficient incentives for investors.
065-106 Chapter 3 AIE RENEWABLES.indd 102065-106 Chapter 3 AIE RENEWABLES.indd 102 09/11/11 11:2709/11/11 11:27
© O
EC
D/IE
A, 2
011

Chapter 3: Policies for Deploying Renewables
103
Policy portfolios at this stage should meet the following requirements.
• Ensure a stable support environment, backed by credible and ambitious targets.
Countries that have been successful in stimulating deployment at low cost always provided stable framework conditions that create investment confidence. A first and important step is to communicate policy objectives with clear, credible and quantitative targets.
• Ensure flexibility is a key characteristic of the policy package.
This flexibility should include regular annual or bi-annual reviews of the support instruments. Adaptation to changing market conditions can also be hardwired into the regulation itself, e.g. by linking FIT levels to deployment volumes or quotas to certificate prices.
• Introduce transitional incentives, decreasing over time.
Transitional incentives that decrease over time are required to stimulate technological learning and resulting cost reductions. When setting support levels for RE technologies, governments frequently announce a certain target range for return rates on a project basis; typically internal rates of return (IRRs) are calculated at 7-12%. This approach can lead to over-subsidisation. RE technology assets tend to be priced based on the value provided for the project developer. An excessive tariff leads to higher system prices, as part of the excess profits is absorbed at earlier levels of the value chain. If national system prices are taken as a given, this effect may not be identified clearly. Benchmarking prices across countries is an important tool to avoid excessive tariffs.
• Consider the impact of global trends on your national market.
When expanding RE technology markets today, countries are strongly influenced by market developments on the global scale and in other national markets. For example, tariff degressions need to account for global deployment trends, because global learning influences national system prices. Tariff changes in other markets change the relative competitiveness of a given market and can influence deployment dynamics.
• Build on the experience of early movers, but acknowledge that the game will have changed.
Although early movers provide valuable experiences for how to kick-start a mass RE technology market, policy makers need to acknowledge the limitations of replicating the same approach. Conditions change more quickly today, and old tools may not be up to speed. Recognition of these changes may imply shorter review cycles and quicker degression schedules.
• Focus on non-economic barriers and implementation details.
Failures in policy impact and cost-effectiveness may stem from non-economic barriers or implementation details. The PV boom in Spain, for example, went out of control partially because the relevant law included a moderate capacity cap. Tariffs, however, were guaranteed for another year after the cap had been reached. During this period, most of the Spanish PV bubble unfolded because of the short project lead times of solar PV projects.
065-106 Chapter 3 AIE RENEWABLES.indd 103065-106 Chapter 3 AIE RENEWABLES.indd 103 09/11/11 11:2709/11/11 11:27
© O
EC
D/IE
A, 2
011

104
Deploying Renewables: Policies for Deploying Renewables
Market consolidation
The priorities for the market consolidation phase are:
• Dealing with the integration issues that arise once a market share threshold is reached (blending wall, grid constraints, etc.) and focusing on enabling technologies (storage, vehicle fleet).
• Ensuring that the overall energy market design is appropriate to bring forward the range of renewable options required to meet energy strategy goals, and promoting the most competitive technologies.
• Maintaining and building public acceptance as deployment levels grow and projects have greater visual impact.
Compared to the other phases, much less experience has been accumulated on how to approach the challenges in the consolidation phase, and some issues have only now begun to emerge.
Integration
For RE technologies that depend on enabling technologies, bottlenecks can emerge once deployment exceeds a given threshold. The two most important examples are system integration of variable renewables (such as wind or solar technologies) with the electric grid and the blending wall for certain biofuels. In both cases, the limitation is not within the technology itself, but rather an issue arising from the interaction of this technology with the existing system (power system and grid in the first case, vehicle fleet in the latter). Policy making must identify and tackle these bottlenecks early on, even if the impact is still only limited.
A recent IEA study (IEA, 2011b) shows that the grid’s capacity to accommodate variable electricity depends on a number of factors including the flexibility of the rest of the generation system and of the consumer load, the extent to which the grid is interconnected to other grids, and the associated storage capacity. The study developed the Flexibility Assessment Tool (FAST) (Figure 3.12). Several case studies have shown that the achievable levels of penetration vary significantly depending on the characteristics outlined above, but are generally higher than often thought.
The recent problems of introducing higher ethanol blends (E10) in Germany and the potential constraint to higher levels of ethanol use in the United States illustrate the potential significance of these integration bottlenecks to the transport sector. In the short term, these challenges may be managed by altering standards when possible, backed up by clear communication with the consumer base. In the longer term, such problems can be solved either by stimulating changes in the vehicle fleet (for example, by encouraging the deployment of flex-fuel vehicles) or by facilitating the move to advanced biofuels that can be flexibly interchanged with fossil products.
065-106 Chapter 3 AIE RENEWABLES.indd 104065-106 Chapter 3 AIE RENEWABLES.indd 104 09/11/11 11:2709/11/11 11:27
© O
EC
D/IE
A, 2
011
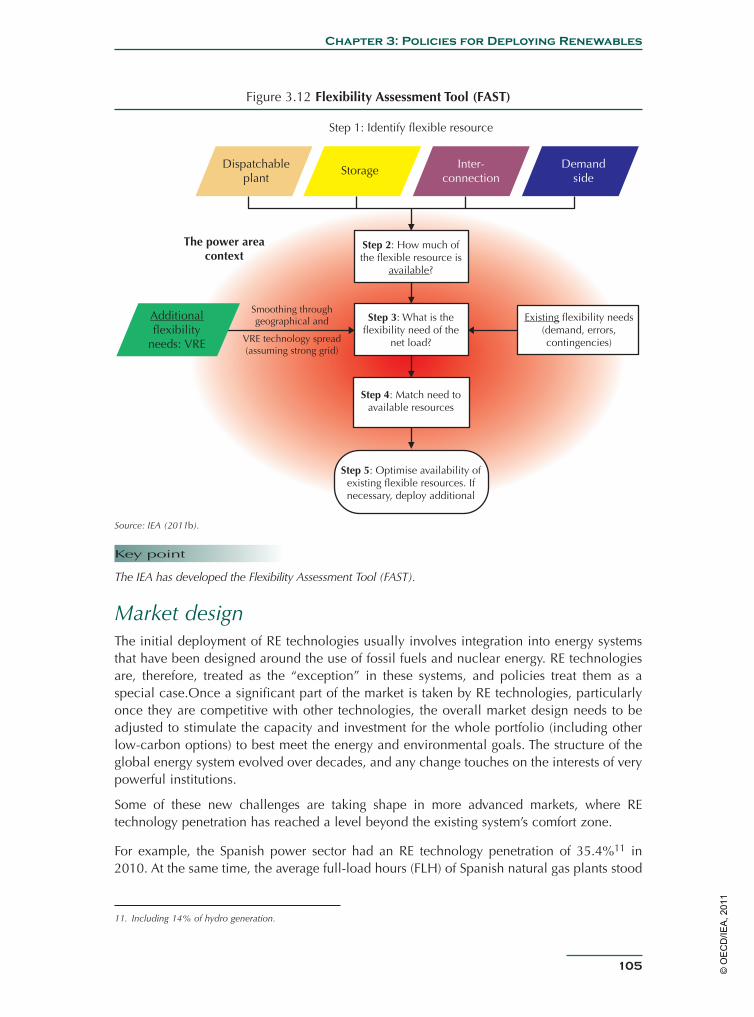
Chapter 3: Policies for Deploying Renewables
105
Figure 3.12 Flexibility Assessment Tool (FAST)
Dispatchableplant
Demandside
Inter-connection
Storage
Step 1: Identify flexible resource
The power areacontext
Smoothing throughgeographical andAdditional
flexibilityneeds: VRE
Step 2: How much ofthe flexible resource is
available?
Step 5: Optimise availability ofexisting flexible resources. Ifnecessary, deploy additional
Step 4: Match need toavailable resources
Step 3: What is theflexibility need of the
net load?
Existing flexibility needs(demand, errors,contingencies)VRE technology spread
(assuming strong grid)
Source: IEA (2011b).
Key point
The IEA has developed the Flexibility Assessment Tool (FAST).
Market designThe initial deployment of RE technologies usually involves integration into energy systems that have been designed around the use of fossil fuels and nuclear energy. RE technologies are, therefore, treated as the “exception” in these systems, and policies treat them as a special case.Once a significant part of the market is taken by RE technologies, particularly once they are competitive with other technologies, the overall market design needs to be adjusted to stimulate the capacity and investment for the whole portfolio (including other low-carbon options) to best meet the energy and environmental goals. The structure of the global energy system evolved over decades, and any change touches on the interests of very powerful institutions.
Some of these new challenges are taking shape in more advanced markets, where RE technology penetration has reached a level beyond the existing system’s comfort zone.
For example, the Spanish power sector had an RE technology penetration of 35.4%11 in 2010. At the same time, the average full-load hours (FLH) of Spanish natural gas plants stood
11. Including 14% of hydro generation.
065-106 Chapter 3 AIE RENEWABLES.indd 105065-106 Chapter 3 AIE RENEWABLES.indd 105 09/11/11 11:2709/11/11 11:27
© O
EC
D/IE
A, 2
011
106
Deploying Renewables: Policies for Deploying Renewables
at just 2 560 FLH (29%). At this low rate of capacity utilisation, investors cannot easily recover capital costs. This trend is bound to intensify and affect a larger number of countries as RE technology deployment is scaled up. This growth will lead not only to technical integration challenges but also to market design challenges as the incumbent generation structure is scaled down.
As RE technologies reach the consolidation phase and their quantities increase, the markets that have been designed for fossil fuel generation start to be perturbed. Giving new technologies priority market access affects incumbent market players. The most expensive fossil-fuelled generation is replaced by RE technologies, thereby lowering the overall fossil-derived market value of RE technologies, making some expensive-to-operate plants redundant, and reducing the operating time of other plants. The fossil plants are then required to operate more flexibly to match the variable renewable resources, but are not rewarded for this flexibility. In this circumstance, the investment in the flexible plant that is needed to complement the variable renewables is not likely to occur.
Because of such issues, current market structures are unlikely to provide an appropriate, secure and low-carbon generation mix into the future. To meet consumer needs, as well as energy security and climate change goals, a market redesign is needed with the following features:
• providing stable and long-term signals that reward low-carbon generation appropriately;
• offering rewards and incentives for the flexible generation capacity and operation that is required (for example, to gas generators, hydro plant operators, or electricity storage);
• rewarding the energy security benefits that renewables bring by decoupling costs from rising and erratic fossil fuel prices, and so insulating consumers from these varying costs that generators usually pass on to them; and
• providing a degree of market harmonisation across interconnected grids.
Such market redesign will be an essential step if renewable sources are to meet their potential. This is now the major challenge faced by policy makers in markets where RE technologies are playing a major role or are expected to play a significant role. Once RE technologies have achieved this level, additional economic incentives will no longer be needed for RE technologies, and their deployment will be pulled by consumer demand and general market forces.
065-106 Chapter 3 AIE RENEWABLES.indd 106065-106 Chapter 3 AIE RENEWABLES.indd 106 09/11/11 11:2709/11/11 11:27
© O
EC
D/IE
A, 2
011

Chapter 4: Economic Support Policies for Electricity
107
The performance of a market deployment policy can be judged by its impact on a number of parameters, i.e. installed capacity, energy production, reduction in costs and prices, technological learning, industrial impacts such as domestic manufacturing capacity and related employment effects, and public acceptance (Sawin, 2006). Other important criteria could include greenhouse gas emission reductions, increased energy security and environmental benefits. Which parameter is best suited for assessing policy performance depends on the question that the analysis aims to answer.
The current analysis focuses on four fundamental questions:
• Are a country’s policies stimulating a growth in RE electricity generation on a track that leads to a sustainable energy future, such as the WEO 450 Scenario?
• Is a country paying a reasonable remuneration per unit of deployed RE technology?
• Is a country getting RE electricity generation in line with the remuneration that it allows for generators?
• Are the overall costs of support premiums in line with the contribution of the technology to the country’s electricity system?
To answer these questions, three quantitative indicators were developed:
• The policy impact indicator (PII) assesses a country’s success in adding generation from a RE technology using WEO 450 projections for deployment in the country in 2030 as a benchmark.
• The remuneration adequacy indicator (RAI) assesses whether the total remuneration provided to generators is adequate. Remuneration levels are compared, correcting for the country’s different resource endowments.
• The total cost indicator (TCI) benchmarks the level of premiums that have to be paid annually for the additional generation that was achieved in a given year. The total wholesale value of a country’s power system is used as a benchmark for comparison. Note that the TCI may overestimate total policy costs, because it does not take into account the merit-order effect.
In addition to the isolated analysis of the three indicators, the impact (PII) and remuneration (RAI) indicators are correlated. The individual analysis aims at answering the first two questions. The comparison explores the connection of remuneration level and policy impact, i.e. targets the third question. The total cost indicator (TCI) addresses the fourth question in the above list.
The current analysis builds upon and adapts prior work presented and discussed in Deploying Renewables: Principles for Effective Policies (IEA, 2008). In this publication, the analysis also seeks to measure the effectiveness of policies for promoting RE technologies. It considers the average impact over the period 2001 to 2009, and for the years 2008/09, as well as for 2010 in selected cases.
Chapter 4Economic Support Policies for Electricity: Impact and Cost-Effectiveness Indicators
107-132 Chapitre 4 AIE RENEWABLES.indd 107107-132 Chapitre 4 AIE RENEWABLES.indd 107 09/11/11 10:4309/11/11 10:43
© O
EC
D/IE
A, 2
011

Deploying Renewables: Economic Support Policies for Electricity
108
The next sections explain the methodology developed to calculate each of these indicators and then presents and discusses the results for selected countries.
Methodological approach
Regional and technology coverageThe analysis in this publication assesses policies for all the OECD member countries and the BRICS countries. These two regions were selected because of their greater experience of policy development, which allows analysis of the largest current markets for RE technologies while keeping the overall number of countries at a manageable size. The analysis for calculating the PII also requires disaggregating IEA scenario projections to the national level, which is most reliably achievable for OECD and BRICS countries. The analysis is further restricted to wind and solar PV, where comprehensive data on costs and prices are most readily available and the most prominent policy issues have emerged.
The categorisation of countries to certain policy instruments is done according to the most important instrument for deployment. Where schemes came into force in mid to late 2009, policies were not taken into consideration. It is clear that a broad comparison across a large number of countries will not be able to reflect all the details in the policy environment on all political levels (national, state, community).
Policy impact indicator (PII)The PII assesses progress towards a defined goal and provides a measure of the impact of policies on stimulating deployment. It measures the percent of the gap between 2005 generation and WEO 2030 target that was closed in a given year. The indicator allows a comparison of the policy effectiveness in different countries in stimulating deployment for different technologies.
In addition to the PII, several other indicators can be used to measure policy effectiveness (Table 4.1).
The PII is an adaptation of the methodology developed in the framework of a number of EU research projects (e.g. Held et al., 2010; Ragwitz et al., 2007a) and the 2008 edition of the IEA Deploying Renewables (IEA, 2008).
The PII uses as a benchmark the levels of power generation (TWh) required to meet the IEA World Energy Outlook (WEO) (IEA, 2010a) 450 Scenario projections for 2030. The indicator is based on the additional RE generation achieved in a given year in a given country. This additional generation is divided by the difference between the annual generation of the country in 2005 and that required to meet the WEO 450 Scenario by 2030 (Figure 4.1). Note that the calculation of generated electricity is based on capacity figures and normalised full-load hours in the case of solar and wind (given that reliable capacity data was available). Full-load hours were normalised according to the procedure described in the European Union’s RES Directive (EU, 2009).
107-132 Chapitre 4 AIE RENEWABLES.indd 108107-132 Chapitre 4 AIE RENEWABLES.indd 108 09/11/11 10:4309/11/11 10:43
© O
EC
D/IE
A, 2
011
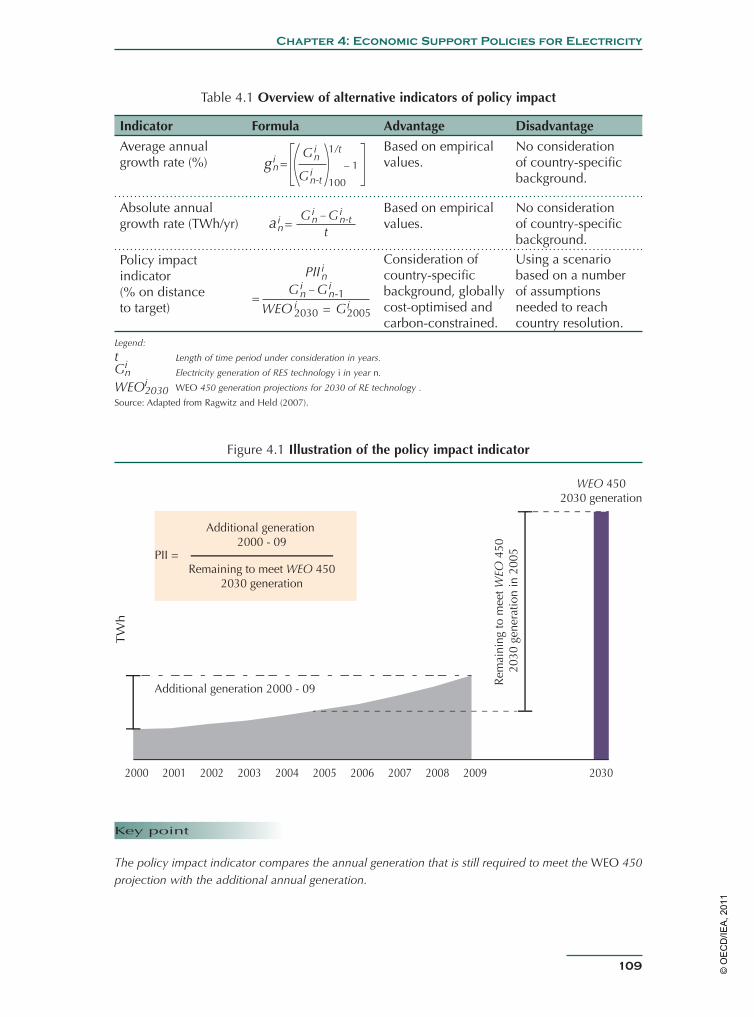
Chapter 4: Economic Support Policies for Electricity
109
Figure 4.1 Illustration of the policy impact indicator
Key point
The policy impact indicator compares the annual generation that is still required to meet the WEO 450 projection with the additional annual generation.
Table 4.1 Overview of alternative indicators of policy impact
Indicator Formula Advantage Disadvantage
Average annual growth rate (%) =
Gingi
nGi
n-t
1/t
100
– 1
Based on empirical values.
No consideration of country-specifi c background.
Absolute annual growth rate (TWh/yr) =ai
n tGi
n Gin-t–
Based on empirical values.
No consideration of country-specifi c background.
Policy impact indicator(% on distance to target)
== Gi
2005WEO i2030
Gin Gi
n-1–
PII in
Consideration of country-specifi c background, globally cost-optimised and carbon-constrained.
Using a scenario based on a number of assumptions needed to reach country resolution.
Legend:
t Length of time period under consideration in years.G i
n Electricity generation of RES technology i in year n.
WEO i2030 WEO 450 generation projections for 2030 of RE technology .
Source: Adapted from Ragwitz and Held (2007).
2000 2001 2002 2003 2004 2005 2006 2007 2008 2009 2030
TW
h
WEO 4502030 generation
Rem
aini
ng to
mee
t WEO
450
20
30 g
ener
atio
n in
200
5
Additional generation 2000 - 09
PII = Remaining to meet WEO 450
2030 generation
Additional generation 2000 - 09
107-132 Chapitre 4 AIE RENEWABLES.indd 109107-132 Chapitre 4 AIE RENEWABLES.indd 109 09/11/11 10:4309/11/11 10:43
© O
EC
D/IE
A, 2
011
Deploying Renewables: Economic Support Policies for Electricity
110
The current approach differs from the 2008 publication, where impact was measured against the remaining mid-term potential (IEA, 2008). Another important difference is that the base year for measuring impact is set to a fixed value. The rationale for using an updated impact indicator is that it allows unbiased comparisons across countries of different sizes, starting points in terms of renewable energy deployment, and levels of ambition of renewable energy policies and targets. It also is based on a cost optimised, carbon-constrained development path, which means that the costs of technologies constrain the 2030 objective. In addition, freezing the base year to calculate the remaining generation facilitates the interpretation of effectiveness from one year to the next.1
Because the WEO does not project every country on the national level, WEO projections were disaggregated to the national level where needed. Due to the detailed analysis required for a national breakdown of the regional WEO projections, only OECD member countries, along with the five BRICS countries, were selected for closer analysis. This disaggregation of the WEO 2030 projections to the country level, however, can be challenging. To minimise the potential for error, the disaggregation was performed using outside data where appropriate. Besides the mid-term potentials, a number of other data were incorporated, e.g. in the case of OECD-EU countries, the National Renewable Action Plans under the EU RES Directive (EU, 2009) were used for disaggregation.
A number of issues affect the rate of deployment. Of particular interest is to see whether any particular sort of financial support mechanism offers advantages. The different characteristics of the various types of schemes are likely to have an impact over and above the level of financial support offered. As explained earlier, FITs and FIPs do not usually place a constraint on the rate of deployment, so the rate is determined by the willingness of investors to bring forward projects, perhaps constrained by the capability and capacity of the supply chain and of the administrative systems. TGCs constrain capacity through the size of the cap and the rate at which the cap is increased. They also allow the certificate prices to adjust upwards to stimulate at least some deployment. Tendering schemes also provide a way of managing the rate of capacity growth, because the tendering party can directly control the volume.
The rate of deployment that a country judges to be desirable is a reflection of its strategy for increasing renewables deployment. EU countries, for example, may want to accelerate deployment between now and 2020 to fulfil their commitments under the Renewable Energy Directive. They may also want to restrict the early rate of deployment for technologies judged to be relatively expensive until global developments help reduce costs.
Other factors also affect the rate at which deployment is growing. In particular, time is an important element. If deployment follows the S-curve model, growth is initially constrained as the supply chain is put in place and the administrative systems are streamlined. Capacity then grows more quickly until the market starts to saturate and good project opportunities become rarer. The PII could, therefore, be expected to start low, rise, and then tail off.
1. Caution is warranted when comparing the PII results in the current publication to its predecessor (IEA, 2008). Because the time horizon of the 2008 publication is the year 2020, the remaining annual generation figures are, in general, lower compared to the 2030 benchmark used in the current publication. This difference implies that the same deployment in absolute terms will yield a lower effectiveness. This reflects the fact that RES generation projections for 2030 in the WEO 450 scenario can be higher than the 2020 realisable potential, which was used in the 2008 publication.
107-132 Chapitre 4 AIE RENEWABLES.indd 110107-132 Chapitre 4 AIE RENEWABLES.indd 110 09/11/11 10:4409/11/11 10:44
© O
EC
D/IE
A, 2
011
Chapter 4: Economic Support Policies for Electricity
111
Finally, it should be kept in mind that – all other factors remaining constant – a higher resource endowment leads to a higher PII. This attribute of the indicator is a desired property. It takes into account that choosing a technology that matches a country’s resource portfolio delivers better results.
Remuneration adequacy indicator (RAI)The level of financial support paid to a renewable energy producer is a crucial characteristic of renewable energy policy support. The level of financial support significantly influences policy impact as well as the total support costs.
Support levels need to be sufficient to stimulate capacity growth by offering a predictable profitability level to potential investors, but should avoid windfall profits stemming from support levels exceeding the real requirements. Setting support levels in a way that meets both objectives has been challenging for regulators in the past, especially for quickly developing technologies such as solar PV (see Box 4.1).
The price level that is adequate for a technology within a particular country depends on the availability of resources (wind, solar energy, etc.) and the global level of costs and market maturity (i.e. its status in terms of the deployment journey). It also depends on the maturity of the local market and is affected by the availability of a local supply chain, confidence in and experience of administrative procedures, the attitude of the financing sector, etc. These factors interact and make it hard to arrive at a “reasonable” incentive level that remains valid for months or even years. For example, a massive change in deployment rates in a foreign market or an increase in capacity may quickly drive down system costs globally.
The remuneration adequacy indicator (RAI) aims to establish a fair comparison between remuneration levels in different countries. The following three factors need to be considered to achieve this goal.
• Payment schedule of incentives Different types of incentive have different characteristics over time, depending, for instance, on whether they relate to up-front investment costs or operating returns. Therefore, the remuneration for each technology in each country is expressed as a levelised return over a fixed period and discounted at a fixed rate.
• Influence of resource endowment For those RE technologies that do not require a fuel (wind, solar), the generation costs depend only on the cost of investment, the costs of capital/debt and the cost of maintenance. The project returns, however, are proportional to the available resource. Consequently, in regions where resource levels are higher (i.e. where more wind or sun is present), the tariffs for RE technologies should be lower. These differences in resource levels need to be taken into account when a comparison between countries is made.
• Interaction between incentive levels and system prices Prices charged for systems reflect the value that the system provides to the buyer. For example, solar panel sellers price their systems according to the income, including incentives that can be generated in a given country and the profitability for developers. The sellers try to take a share of any excess remuneration. In comparing incentive levels between countries, policy makers need to establish the extent to which system prices are higher because of external factors, and the extent to which they are driven up by too high incentives.
107-132 Chapitre 4 AIE RENEWABLES.indd 111107-132 Chapitre 4 AIE RENEWABLES.indd 111 09/11/11 10:4409/11/11 10:44
© O
EC
D/IE
A, 2
011

Deploying Renewables: Economic Support Policies for Electricity
112
The RAI is designed to take account of these factors.
First, the RAI is calculated taking into account two different types of remuneration: up-front and per MWh remuneration (Figure 4.2). Up-front remuneration includes all payments made at the beginning of the project, such as cash rebates. In addition, tax incentives are assumed to be received at the beginning of the project. Per MWh remuneration includes wholesale market revenues, certificate revenues, and FIT/FIP payments as appropriate. Because incentives vary, depending on details of a given installation (size, sub-technology), the average-to-maximum remuneration is calculated based on the tariffs in place in 2009. Wholesale market and certificate prices are assumed to remain stable at 2009 values. To account for the incentive payment-scheduling issue, both investment streams are levelised to 20 years, with a discount rate of 6.5% (Formula 4.1).2 The net present value of all payments to generators of renewable electricity is calculated. This quantity includes tax credits, investment grants, feed-in payments or certificate revenues, and, as far as applicable, revenues from selling electricity on the market. Other support instruments are not covered by the current analysis.
Formula 4.1 Calculation of the annualised remuneration level for RES-E
=NPVRemunerationt
(1 + i)t�n
t = 1
=A . NPVi1 – (1 + i)-n
NPV Net Present Value
i Interest rate
t Year
n Payback time
Second, to remove the effect of differences in resource endowment, the total per MWh remuneration is then multiplied with the full-load hours that can be expected in each country. For both streams, remuneration is now expressed in terms not of USD/MWh but rather in USD/MW per year, i.e. capacity rather than energy. Paying support according to the amount of electricity generated is desirable to incentivise efficient use of resources. But when a comparison between countries is made, comparing incentives per capacity is more accurate, because it corrects for the influence of resource availability.3
The RAI converts incentive levels to a scale that makes it possible to compare between countries. Some benchmark should be available, however, to allow a judgment as to whether the payments per unit of capacity are reasonable. One can also calculate possible profit ranges for generators, taking into account national system costs. This approach is very valuable in showing a mismatch between system prices and incentive levels in a country, but it does not account for the interaction effect between system prices and incentive levels (the third factor in the list of factors to account for above).
2. This discount rate was adopted in accordance with the 2008 publication (IEA, 2008).3. One may argue that it is less efficient to deploy capacity where resources are low. This is correct, but this dimension is already accounted in the design of the PII. If good resources would also lead to a better RAI, high-resource countries would benefit twice.
107-132 Chapitre 4 AIE RENEWABLES.indd 112107-132 Chapitre 4 AIE RENEWABLES.indd 112 09/11/11 10:4409/11/11 10:44
© O
EC
D/IE
A, 2
011

Chapter 4: Economic Support Policies for Electricity
113
So, thirdly, to avoid this problem, the following approach has been adopted: For each technology, a range of system and financing costs has been established (Table 4.2). From this data, a range of minimum and maximum values for RAI is derived. This range serves as a benchmark to give a first indication if incentives are too high or low.
Table 4.2 Assumptions for calculating reference intervals for RAI values
Low cost High costProject parametersWeighted average cost of capital (WACC) 4% 7.50%Project lifetime 25 20WindInvestment costs (USD/kW) 1 750 2 100O&M (% of capital expenses) 2.50% 2.50%Reference annual cost (thousand USD/MW per year)
112 206
Solar PVInvestments costs (USD/kW) 3 800 6 500O&M (% of capital expenses) 1% 1%Reference annual cost (thousand USD/MW per year)
243 637
Note: Parameters reflect typical ranges for the analysis period.
Systematic differences may or may not exist between the cost-effectiveness of the various types of support mechanisms. Other factors, however, affect the level of support needed to stimulate deployment. At the start of the deployment journey in a particular country, the costs of deployment are likely to be above world cost levels, as a competitive local supply chain forms itself, developers and suppliers accumulate experience, additional costs are involved
Figure 4.2 Calculation of the remuneration adequacy indicator (RAI)
6.5% discount rate20 years duration
price pr MW
6.5% discount rate20 years duration
multiply by full load hours
Up-frontremuneration
(% of investment)
Up-front remuneration
(standard levelisation)
RemunerationAdequacyIndicator
Per MWh remuneration
(different duratons)
Per MWh remuneration
(standard levelisation)
Annual generation remuneration
(standard levelisation,resource corrected)
+
+
Key point
RAI expresses total remuneration in terms of USD/MW per year.
107-132 Chapitre 4 AIE RENEWABLES.indd 113107-132 Chapitre 4 AIE RENEWABLES.indd 113 09/11/11 10:4409/11/11 10:44
© O
EC
D/IE
A, 2
011

Deploying Renewables: Economic Support Policies for Electricity
114
in dealing with regulatory and administrative systems, and the finance sector develops confidence in the market. At the early stage, the costs are likely to be above the estimated international benchmark levels. Over time, policy makers should hope and expect to see rapid convergence with these levels.
The range of observed remuneration, however, is quite broad. This broad range reflects: (i) local differences in the ease of project development, and (ii) price differentials due to market maladjustments. Although the first factor will persist in the long term, policy making should aim to close that part of the international price spread that is due to policy-induced market problems.
Total cost indicator (TCI)With deployment volumes reaching the mass scale, overall policy costs have increasingly come under close scrutiny. The different types of electricity market structure make it difficult to assess the additional premiums that are paid on top of market price. Policy makers also need to compare total premium payments to the amount of electricity that a country gets through the payment of premiums.
An attempt was made to quantify the total cost of policy support between countries, the total cost indicator (TCI). The TCI is specified by the amount of the additional annual premiums that are paid for additional generation produced in a given year. The annual premiums are expressed in percent of the total wholesale value of all the electricity generated. The TCI is plotted together with the share that the additional generation achieved in a given year has compared to total generation.
The following example illustrates how the indicator is calculated. Assume country A has generated 80 GWh of wind power in 2008 and 85 GWh of wind power in 2009. Its additional generation will be 5 GWh. Let us assume further that the total generation is 1 TWh, the average wholesale price per MWh is USD 50 and generators get USD 75 per MWh of wind power. The total value of electricity is then million USD 50.4 Total premiums are USD 125 000 or 0.25% of the total wholesale value. This additional generation accounts for 0.5% of the generated electricity. To get 0.5% additional generation, the country needed to pay 0.25% of the wholesale value of electricity in premiums.
Note that the TCI does not take into account the lowering of wholesale prices that occur due to higher penetration. This effect is known as the merit order effect. This effect can have a large impact on wholesale prices. For example, the reduction in wholesale price due to wind power in Ireland for 2011 is projected to match the premiums that are paid to wind power generators, i.e. wind power support in Ireland is cost neutral for consumers if the merit order effect is taken into account (Clifford and Clancy, 2011).
4. 1 TWh = 1 000 000 MWh times USD 50.
107-132 Chapitre 4 AIE RENEWABLES.indd 114107-132 Chapitre 4 AIE RENEWABLES.indd 114 09/11/11 10:4409/11/11 10:44
© O
EC
D/IE
A, 2
011

Chapter 4: Economic Support Policies for Electricity
115
Indicator analysis for onshore windPolicy impact indicatorAnalysis of support policies for onshore wind in OECD and BRICS countries indicates a wide range of policy impact indicator (PII) values (Table 4.3) (Figure 4.3).5
Table 4.3 Statistical analysis of wind energy support policy types
Feed-in tariffs (17 countries)
Certificate schemes (6 countries)
All (35 countries, 5 w/o policies)
2001-09 2008-09 2001-09 2008-09 2001-09 2008-09(%) (%) (%) (%) (%) (%)
Maximum 9.82 14.51 3.18 6.90 9.82 14.51Minimum 0 -0.14 0.70 0.84 0.00 -0.14Average 3.23 4.03 2.11 3.56 2.40 3.32
Key point
The difference in the PII between certificate schemes and FITs has decreased from 2001 to 2009.
For the overall period of 2001-09, the average PII in countries using a feed-in tariff (FIT) was 3.23%, 1.5 times that of countries using certificate schemes (2.11%). Of the ten countries with the highest PII, seven of the top eight were using FITs (Denmark, Germany, Spain, Portugal, Ireland, Canada and Netherlands). New Zealand ranks fifth in the absence of dedicated policy support. Only one country using certificates is in the top ten (Italy).
This difference has decreased, however: the 2008/09 PII values show a country average of 4.0% for FITs and 3.6% for certificate schemes. Among the top ten countries for this period, six used a FIT (Denmark, Portugal, Spain, Hungary, Germany and Korea) and two a certificate scheme (Italy and Sweden). New Zealand ranked third, and the United States ranked ninth (using mainly federal tax credits and state-level quota obligations, some of them combined with a certificate system). Because only six countries out of the whole sample (35 countries) rely mainly on certificate schemes, while 17 use FITs, countries using FITs can not be considered systematically more effective. To phrase it differently: the large number of countries with FITs in the top ten reflects the larger number of countries using this instrument in the sample rather than a systematic difference in the impact of certificates and FITs.
Both FITs and certificate schemes have increased their average impact. But certificate schemes showed a stronger relative increase and are now close to a more similar average effectiveness level. Taking 2009 data only, TGC systems even fared slightly better than FITs (4.75% vs. 4.36%).
The reasons for this development could lie in a number of factors. First, the systems may have been subject to learning effects and, therefore, perform better in recent years. Another cause
5. Note that only those years during which a policy was in place are used in the calculation. See the policy overview table in Chapter 5 for details on when policies came into effect.
107-132 Chapitre 4 AIE RENEWABLES.indd 115107-132 Chapitre 4 AIE RENEWABLES.indd 115 09/11/11 10:4409/11/11 10:44
© O
EC
D/IE
A, 2
011

Deploying Renewables: Economic Support Policies for Electricity
116
may be the low effectiveness of certificate systems in the past: because many sites with good resources and available land still exist, deployment is easier after some learning has occurred. This conclusion is in line with the observation that two countries using a FIT and with high past effectiveness are now exhibiting lower levels (Germany and Austria).
Figure 4.3 PII of wind support policies in OECD and BRICS countries, 2001-09
Average policy impact indicator (%) 2008/09Average policy impact indicator (%) 2001- 09
Mainly FITs / FIPs Mainly TGCs Mainly other / multiple None
0%
2%
4%
6%
8%
10%
12%
14%
16%
Aus
tria
Can
ada
Fran
ceG
erm
any
Gre
ece
Hun
gary
Irel
and
Kor
eaLu
xem
bour
gN
ethe
rlan
dsPo
rtug
alSl
ovak
Rep
ublic
Switz
erla
ndTu
rkey
Den
mar
kC
zech
Rep
ublic
Spai
nA
ustr
alia
Bel
gium Ita
lyJa
pan
Pola
ndSw
eden
Uni
ted
Kin
gdom
Sout
h A
fric
aU
nite
d St
ates
Finl
and
Bra
zil
Chi
naIn
dia
Icel
and
Mex
ico
New
Zea
land
Nor
way
Rus
sia
Key point
FIT systems had a higher PII over the period of 2001-09. TGC systems show a stronger increase in PII over 2008/09.
Remuneration adequacy indicatorUsing the methodology outlined above, analysis also calculated the remuneration adequacy indicator (RAI) for support of onshore wind for each OECD and BRICS country (Figure 4.4). The shaded area indicates the typical range of costs per installed capacity, as calculated above, and provides a benchmark. The methodology corrects for differences in wind resource, so only local factors such as labour costs and infrastructure conditions influence the RAI level. Remuneration levels outside the benchmark levels imply either unusual levels of cost, perhaps associated with overcoming non-economic barriers (for example, during the early stages of market development) or that incentive levels are higher or lower than would be expected if they aim at providing moderate revenues.
107-132 Chapitre 4 AIE RENEWABLES.indd 116107-132 Chapitre 4 AIE RENEWABLES.indd 116 09/11/11 10:4409/11/11 10:44
© O
EC
D/IE
A, 2
011

Chapter 4: Economic Support Policies for Electricity
117
Figure 4.4 RAI for onshore wind support policies in OECD and BRICS countries, 2008/09
Mainly FITs / FIPs Mainly TGCs Mainly other / multiple None
Remuneration adequacy indicator (USD/MW per year)
Aus
tria
Can
ada
Cze
ch R
epub
licD
enm
ark
Fran
ceG
erm
any
Gre
ece
Hun
gary
Irel
and
Kore
aLu
xem
bour
gN
ethe
rlan
dsPo
rtug
alSl
ovak
Rep
ublic
Spai
nSw
itzer
land
Turk
eyA
ustr
alia
Bel
gium Ita
lyJa
pan
Pola
ndSw
eden
Uni
ted
Kin
gdom
Bra
zil
Indi
aC
hina
Finl
and
Nor
way
Sout
h A
fric
a
Uni
ted
Stat
esIc
elan
dM
exic
oN
ew Z
eala
ndN
orw
ayR
ussi
a0
50 000
100 000
150 000
200 000
250 000
300 000
350 000
400 000
450 000
Key point
The majority of OECD and BRICS countries have RAI scores within the reference range. Countries using TGCs relatively deviate from the reference more often.
The majority of countries lie within the two boundary cases, but in some cases with well-established markets (e.g. the United Kingdom) remuneration levels are higher than anticipated. In terms of total remuneration, the average for FITs is USD thousand 176.1/MW per year, and the average for TGCs is USD thousand 213.5/MW per year, a difference of 20%. In addition, out of the six countries that utilise a certificate system (Belgium, Italy, Japan, Sweden, United Kingdom and Australia), four are among the nine countries that provide payments way above the indicated range. Although the sample size is very small (17 FIT/FIP and 6 TGC), this difference is significant on a level of p < 0.086 (t-Test assuming equal variances).
Remuneration adequacy versus impact analysisEven larger variations between countries become apparent, however, when plotting PII versus RAI (Figure 4.5). Countries that have similar RAI scores show very large differences with respect to impact as measured by PII.
For example, although Switzerland is paying more than Denmark, the latter country is many times more effective as measured by the PII indicator. This situation is due, on the one hand,
107-132 Chapitre 4 AIE RENEWABLES.indd 117107-132 Chapitre 4 AIE RENEWABLES.indd 117 09/11/11 10:4409/11/11 10:44
© O
EC
D/IE
A, 2
011
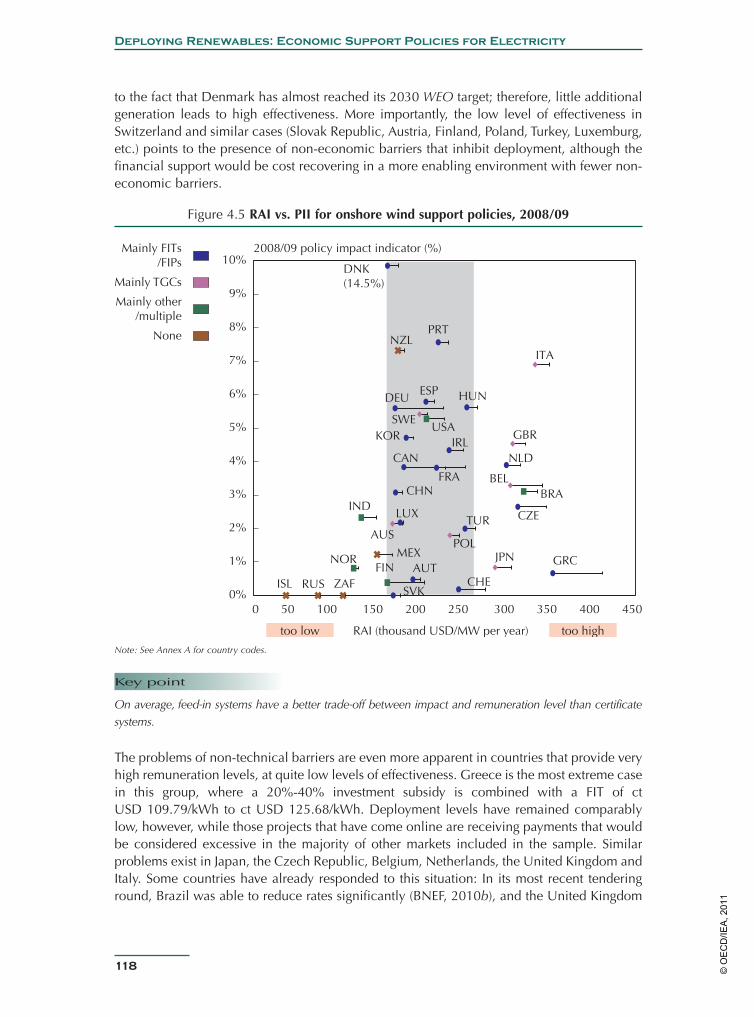
Deploying Renewables: Economic Support Policies for Electricity
118
to the fact that Denmark has almost reached its 2030 WEO target; therefore, little additional generation leads to high effectiveness. More importantly, the low level of effectiveness in Switzerland and similar cases (Slovak Republic, Austria, Finland, Poland, Turkey, Luxemburg, etc.) points to the presence of non-economic barriers that inhibit deployment, although the financial support would be cost recovering in a more enabling environment with fewer non-economic barriers.
Figure 4.5 RAI vs. PII for onshore wind support policies, 2008/09
TUR
USA
CAN
MEX JPN
KOR
AUS
NZL
CHE
NOR
ISLAUT
BEL
CZE
DNK (14.5%)
FIN
FRA
DEU
GRC
HUN
IRL
ITA
LUX
NLD
POL
PRT
SVK
ESP
SWEGBR
RUS
CHNIND
BRA
ZAF0%
1%
2%
3%
4%
5%
6%
7%
8%
9%
10%
0 50 100 150 200 250 300 350 400 450
2008/09 policy impact indicator (%) Mainly FITs/FIPs
Mainly TGCs
Mainly other/multiple
None
RAI (thousand USD/MW per year)too low too high
Note: See Annex A for country codes.
Key point
On average, feed-in systems have a better trade-off between impact and remuneration level than certificate systems.
The problems of non-technical barriers are even more apparent in countries that provide very high remuneration levels, at quite low levels of effectiveness. Greece is the most extreme case in this group, where a 20%-40% investment subsidy is combined with a FIT of ct USD 109.79/kWh to ct USD 125.68/kWh. Deployment levels have remained comparably low, however, while those projects that have come online are receiving payments that would be considered excessive in the majority of other markets included in the sample. Similar problems exist in Japan, the Czech Republic, Belgium, Netherlands, the United Kingdom and Italy. Some countries have already responded to this situation: In its most recent tendering round, Brazil was able to reduce rates significantly (BNEF, 2010b), and the United Kingdom
107-132 Chapitre 4 AIE RENEWABLES.indd 118107-132 Chapitre 4 AIE RENEWABLES.indd 118 09/11/11 10:4409/11/11 10:44
© O
EC
D/IE
A, 2
011
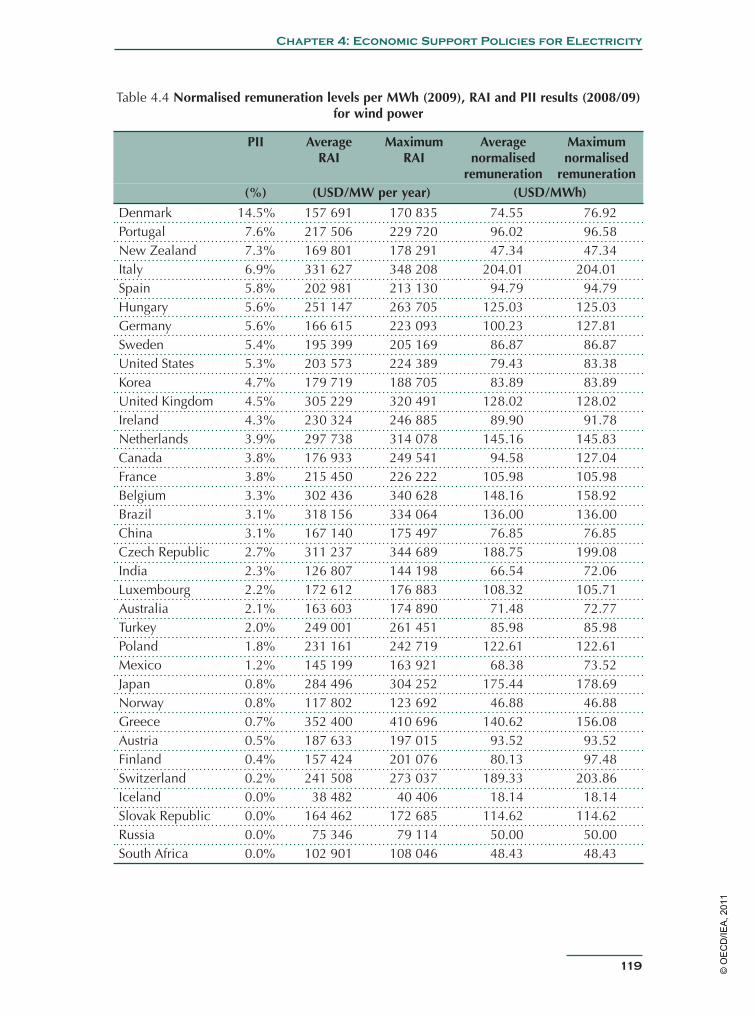
Chapter 4: Economic Support Policies for Electricity
119
Table 4.4 Normalised remuneration levels per MWh (2009), RAI and PII results (2008/09) for wind power
PII Average RAI
Maximum RAI
Average normalised
remuneration
Maximum normalised
remuneration (%) (USD/MW per year) (USD/MWh)
Denmark 14.5% 157 691 170 835 74.55 76.92Portugal 7.6% 217 506 229 720 96.02 96.58New Zealand 7.3% 169 801 178 291 47.34 47.34Italy 6.9% 331 627 348 208 204.01 204.01Spain 5.8% 202 981 213 130 94.79 94.79Hungary 5.6% 251 147 263 705 125.03 125.03Germany 5.6% 166 615 223 093 100.23 127.81Sweden 5.4% 195 399 205 169 86.87 86.87United States 5.3% 203 573 224 389 79.43 83.38Korea 4.7% 179 719 188 705 83.89 83.89United Kingdom 4.5% 305 229 320 491 128.02 128.02Ireland 4.3% 230 324 246 885 89.90 91.78Netherlands 3.9% 297 738 314 078 145.16 145.83Canada 3.8% 176 933 249 541 94.58 127.04France 3.8% 215 450 226 222 105.98 105.98Belgium 3.3% 302 436 340 628 148.16 158.92Brazil 3.1% 318 156 334 064 136.00 136.00China 3.1% 167 140 175 497 76.85 76.85Czech Republic 2.7% 311 237 344 689 188.75 199.08India 2.3% 126 807 144 198 66.54 72.06Luxembourg 2.2% 172 612 176 883 108.32 105.71Australia 2.1% 163 603 174 890 71.48 72.77Turkey 2.0% 249 001 261 451 85.98 85.98Poland 1.8% 231 161 242 719 122.61 122.61Mexico 1.2% 145 199 163 921 68.38 73.52Japan 0.8% 284 496 304 252 175.44 178.69Norway 0.8% 117 802 123 692 46.88 46.88Greece 0.7% 352 400 410 696 140.62 156.08Austria 0.5% 187 633 197 015 93.52 93.52Finland 0.4% 157 424 201 076 80.13 97.48Switzerland 0.2% 241 508 273 037 189.33 203.86Iceland 0.0% 38 482 40 406 18.14 18.14Slovak Republic 0.0% 164 462 172 685 114.62 114.62Russia 0.0% 75 346 79 114 50.00 50.00South Africa 0.0% 102 901 108 046 48.43 48.43
107-132 Chapitre 4 AIE RENEWABLES.indd 119107-132 Chapitre 4 AIE RENEWABLES.indd 119 09/11/11 10:4409/11/11 10:44
© O
EC
D/IE
A, 2
011
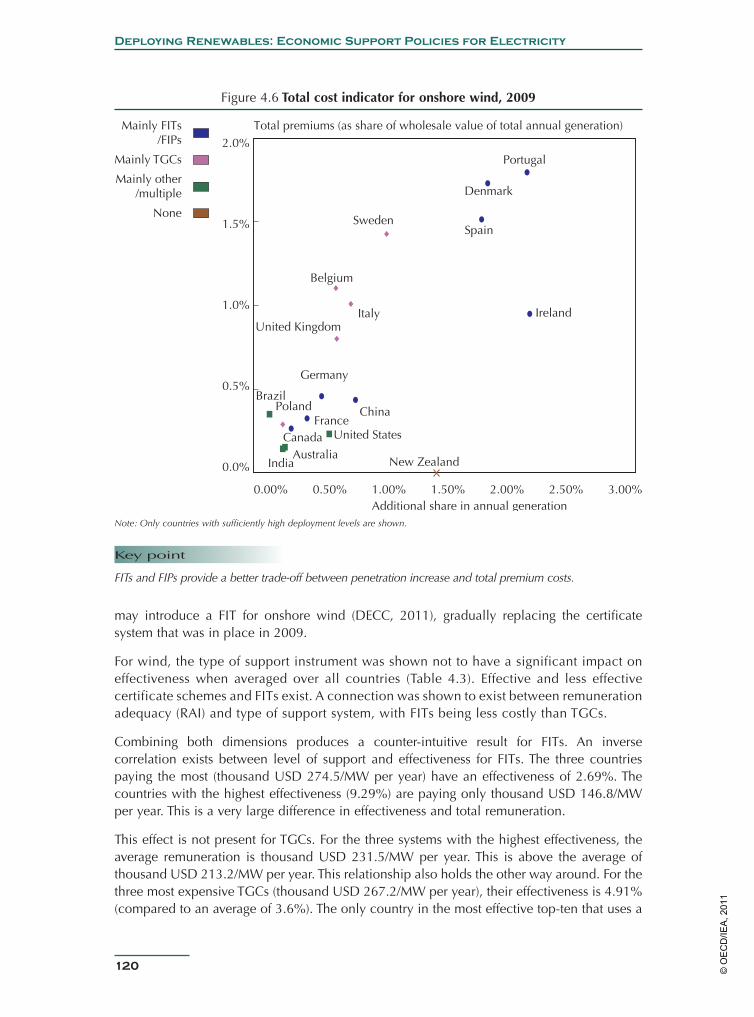
Deploying Renewables: Economic Support Policies for Electricity
120
may introduce a FIT for onshore wind (DECC, 2011), gradually replacing the certificate system that was in place in 2009.
For wind, the type of support instrument was shown not to have a significant impact on effectiveness when averaged over all countries (Table 4.3). Effective and less effective certificate schemes and FITs exist. A connection was shown to exist between remuneration adequacy (RAI) and type of support system, with FITs being less costly than TGCs.
Combining both dimensions produces a counter-intuitive result for FITs. An inverse correlation exists between level of support and effectiveness for FITs. The three countries paying the most (thousand USD 274.5/MW per year) have an effectiveness of 2.69%. The countries with the highest effectiveness (9.29%) are paying only thousand USD 146.8/MW per year. This is a very large difference in effectiveness and total remuneration.
This effect is not present for TGCs. For the three systems with the highest effectiveness, the average remuneration is thousand USD 231.5/MW per year. This is above the average of thousand USD 213.2/MW per year. This relationship also holds the other way around. For the three most expensive TGCs (thousand USD 267.2/MW per year), their effectiveness is 4.91% (compared to an average of 3.6%). The only country in the most effective top-ten that uses a
Figure 4.6 Total cost indicator for onshore wind, 2009
Note: Only countries with sufficiently high deployment levels are shown.
Key point
FITs and FIPs provide a better trade-off between penetration increase and total premium costs.
United States
New Zealand
Belgium
Denmark
FranceCanada
AustraliaIndia
Germany
IrelandItaly
Poland
Portugal
SpainSweden
United Kingdom
ChinaBrazil
0.0%
0.5%
1.0%
1.5%
2.0%
0.00% 0.50% 1.00% 1.50% 2.00% 2.50% 3.00%
Total premiums (as share of wholesale value of total annual generation)
Additional share in annual generation
Mainly FITs/FIPs
Mainly TGCs
Mainly other/multiple
None
107-132 Chapitre 4 AIE RENEWABLES.indd 120107-132 Chapitre 4 AIE RENEWABLES.indd 120 09/11/11 10:4409/11/11 10:44
© O
EC
D/IE
A, 2
011

Chapter 4: Economic Support Policies for Electricity
121
certificate scheme is the one that pays the highest remuneration (Italy). The case of Sweden, however, shows that certificate systems can reach significant effectiveness at low costs.6
Total cost indicatorCountries show large differences regarding the total premium payments as measured by the TCI. The lowest values are observed in New Zealand, where no additional premiums need to be paid for the 1.5% of electricity that was covered by new wind generation in 2009. Ireland also paid small premiums, while premiums were comparably large in Sweden, taking into account the smaller contribution of new wind. Portugal pays the highest total premiums for the wind power capacity that was deployed in 2009. The country also got a large amount from additional generation from wind power. Similar results are observed for Spain and Denmark (Figure 4.6). Once again, FIT systems show a better trade-off than TGC systems.
Indicator analysis for solar PVPolicy impact indicatorAs a general trend, policy effectiveness for solar PV deployment has increased across all countries over time (Figure 4.7). Because PV markets are evolving dynamically, the year 2010 is also shown for those countries for which data was already available and deployment high (Figure 4.8).
Countries can be very roughly sorted into five groups:
• Countries that show little or no increase in deployment and have no dedicated support scheme, very low support levels (Brazil, China, South Africa, Mexico, Russia, Norway, Iceland, New Zealand, Turkey, Ireland, Hungary and Denmark).
• Countries that have very low levels of deployment, even though they provide substantial financial support, such as India and, to a lesser extent, Greece (2010 effectiveness of 3.3%). Non-economic barriers are likely to be inhibiting deployment growth in these countries.
• Countries that show a continued and comparably smooth increase of effectiveness over time (United States, Japan, Switzerland and Canada) or an established effective environment (Germany).
• Countries that have seen a sudden jump in effectiveness (Australia, Belgium, Italy, Austria, Slovakia, France and the Czech Republic).
• Countries that had a peak in effectiveness but then showed very low levels of deployment.This group consists of Spain (where there was a boom in 2008, followed by market constraint in 2009 and 2010) and, to a lesser extent, Portugal and Korea.
The most important question for the next few years is whether the countries that are now in the fourth group (sudden jump) will consolidate and move into the third group (smooth deployment), or whether the markets will collapse, i.e. the fourth group move to the fifth
6. Note that regulation in Sweden in force in 2009 foresaw that up to 50% of total planning costs could be reimbursed. This support is not covered in the current calculation.
107-132 Chapitre 4 AIE RENEWABLES.indd 121107-132 Chapitre 4 AIE RENEWABLES.indd 121 09/11/11 10:4409/11/11 10:44
© O
EC
D/IE
A, 2
011

Deploying Renewables: Economic Support Policies for Electricity
122
group. In the cases where growth was excessive and abrupt (Czech Republic), policies are already in place that will likely choke off future deployment. In countries where growth has been strong but not excessive so far (in particular, Italy), policy makers will need to pay close attention to avoid overheating markets.
The absolute levels of effectiveness are much higher for solar PV than for wind energy, especially for 2010. This finding is due to larger-than-expected deployment volumes, but it also hints at the possible underestimation of the role of solar PV in the future energy mix in the World Energy Outlook 2010 (IEA, 2010a). The projections may have to be considered as too conservative in the light of recent developments.
Figure 4.7 PII of solar PV support policies in OECD and BRICS, 2001-09
0%
1%
2%
3%
4%
5%
6%
7%
8%
9%
Aus
tria
Can
ada
Fran
ceG
erm
any
Gre
ece
Kor
eaLu
xem
bour
gPo
rtug
alSl
ovak
Rep
ublic
Switz
erla
ndC
zech
Rep
ublic
Den
mar
kIta
lySp
ain
Hun
gary
Net
herl
ands
Bel
gium
Japa
nPo
land
Swed
enU
nite
d K
ingd
omA
ustr
alia
Uni
ted
Stat
esFi
nlan
dIn
dia
Chi
naB
razi
lIr
elan
dIs
land
Mex
ico
New
Zea
land
Nor
way
Rus
sia
Sout
h A
fric
aTu
rkey
Mainly FITs / FIPs Mainly TGCs Mainly other / multiple None
Average policy impact indicator (%) 2008/09Average policy impact indicator (%) 2001- 09
Key point
FITs and FIPs have been most effective in stimulating PV deployment.
107-132 Chapitre 4 AIE RENEWABLES.indd 122107-132 Chapitre 4 AIE RENEWABLES.indd 122 09/11/11 10:4409/11/11 10:44
© O
EC
D/IE
A, 2
011
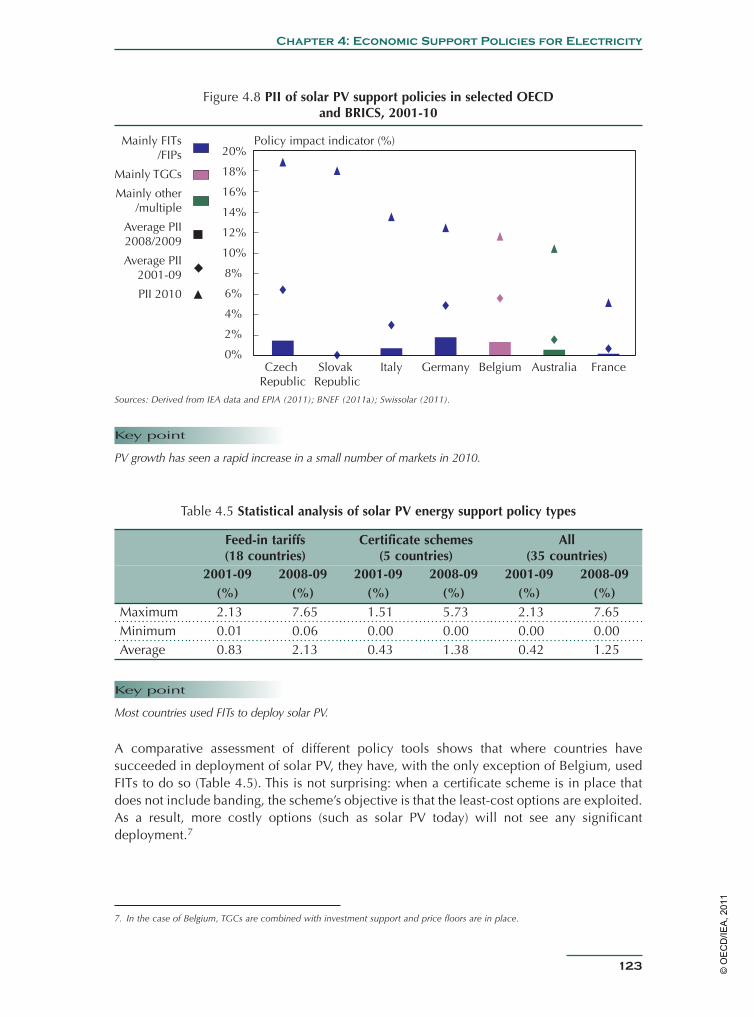
Chapter 4: Economic Support Policies for Electricity
123
Figure 4.8 PII of solar PV support policies in selected OECD and BRICS, 2001-10
0%
2%
4%
6%
8%
10%
12%
14%
16%
18%
20%
Czech Republic
Slovak Republic
Italy Germany Belgium Australia France
Average PII2008/2009
Average PII2001-09
PII 2010
Mainly FITs/FIPs
Mainly TGCs
Mainly other/multiple
Policy impact indicator (%)
Sources: Derived from IEA data and EPIA (2011); BNEF (2011a); Swissolar (2011).
Key point
PV growth has seen a rapid increase in a small number of markets in 2010.
Table 4.5 Statistical analysis of solar PV energy support policy types
Feed-in tariffs (18 countries)
Certificate schemes (5 countries)
All (35 countries)
2001-09 2008-09 2001-09 2008-09 2001-09 2008-09(%) (%) (%) (%) (%) (%)
Maximum 2.13 7.65 1.51 5.73 2.13 7.65Minimum 0.01 0.06 0.00 0.00 0.00 0.00Average 0.83 2.13 0.43 1.38 0.42 1.25
Key point
Most countries used FITs to deploy solar PV.
A comparative assessment of different policy tools shows that where countries have succeeded in deployment of solar PV, they have, with the only exception of Belgium, used FITs to do so (Table 4.5). This is not surprising: when a certificate scheme is in place that does not include banding, the scheme’s objective is that the least-cost options are exploited. As a result, more costly options (such as solar PV today) will not see any significant deployment.7
7. In the case of Belgium, TGCs are combined with investment support and price floors are in place.
107-132 Chapitre 4 AIE RENEWABLES.indd 123107-132 Chapitre 4 AIE RENEWABLES.indd 123 09/11/11 10:4409/11/11 10:44
© O
EC
D/IE
A, 2
011

Deploying Renewables: Economic Support Policies for Electricity
124
Remuneration adequacy indicatorAnalysis also calculated the RAI for support of solar PV for each OECD and BRICS country (Figure 4.9). The shaded area in Figure 4.9 marks the support range corresponding to worst- vs. best-case assumptions on reasonable levels of the remuneration. System prices fell by about 20% in 2009. This trend is reflected in the broad range of reasonable support levels. During 2009, this level shifted downwards, i.e. countries that had set tariffs that were still reasonable in early 2009 were over-subsidising at the end of the year.
Figure 4.9 RAI of solar PV support polices in OECD and BRICS countries, 2008/09
Aus
tria
Can
ada
Fran
ceG
erm
any
Gre
ece
Kore
aLu
xem
bour
gPo
rtug
alSl
ovak
Rep
ublic
Switz
erla
ndC
zech
Rep
ublic
Den
mar
kIta
lySp
ain
Hun
gary
Net
herl
ands
Bel
gium
Japa
nPo
land
Swed
enU
nite
d K
ingd
omA
ustr
alia
Uni
ted
Stat
esFi
nlan
dIn
dia
Chi
naB
razi
lIr
elan
dIc
elan
dM
exic
oN
ew Z
eala
ndN
orw
ayR
ussi
aSo
uth
Afr
ica
Turk
ey
Mainly FITs / FIPs Mainly TGCs Mainly other / multiple None
RAI (USD/MW per year)
0
100 000
200 000
300 000
400 000
500 000
600 000
700 000
800 000
900 000
1 000 000
Key point
A relatively large number of countries provide remuneration levels outside the adequate range.
Remuneration adequacy versus impact analysisThe change in reasonable support levels is important for interpreting the results of the effectiveness vs. efficiency analysis (Figure 4.10). The high effectiveness levels in the Czech Republic, Belgium and Germany were a result of this development. The Czech tariffs were not adjusted quickly enough, so the market overheated finally in 2010 (41.1% effectiveness). Spain had incentives in place in 2009 (and also 2008) that could have been considered too high even before the quick decrease in system costs in 2009. Not surprisingly, the Spanish market overheated in 2008-09 due to the very high support levels and a bug in policy design (Box 4.1).
107-132 Chapitre 4 AIE RENEWABLES.indd 124107-132 Chapitre 4 AIE RENEWABLES.indd 124 09/11/11 10:4409/11/11 10:44
© O
EC
D/IE
A, 2
011

Chapter 4: Economic Support Policies for Electricity
125
Figure 4.10 PII and RAI of solar PV support policies in selected OECD and BRICS countries
USA
CAN JPN
KOR
AUS
CHE
AUT
BEL
CZE
DNKFRA
DEU
GRC
ITA
LUXNLD
PRT
SVK
ESP
CHN IND0%
1%
2%
3%
4%
5%
6%
7%
8%
9%
0 100 200 300 400 500 600 700 800 900 1 000
2008/09 policy impact indicator (%)Mainly FITs/FIPs
Mainly TGCs
Mainly other/multiple
None
RAI (thousand USD/MW per year)too low too high
Note: Only countries with sufficiently high deployment levels are shown with name; see Annex A for ISO codes.
Key point
A number of countries were providing very high remuneration levels to generators in 2008/09, leading to rapid market growth.
In a different group of countries (Italy, Switzerland, Portugal and Greece), incentive levels were also set very high; however, impact remained low. On the one hand, this disparity points to non-economic barriers that stand in the way of deployment. On the other hand, once these barriers are overcome, if tariff levels are not adjusted, an overheating in these markets is possible. This outcome is likely to happen in Italy (2010 impact 13.7%), where no radical decrease in support levels has been implemented so far (May 2011).
Another group of countries has a modest impact and remuneration levels (Australia, France, Austria and United States). With stable incentives in place, the rapid cost reductions of PV and local learning effects would be expected to help these markets take off. Indeed, this was the case. All countries in this group saw a significant increase (2010 effectiveness levels were 10.6% in Australia, 5.3% in France, 5.17% in Austria and 1.04% in the United States). France had a considerable pipeline of projects that are not counted towards the 2010 effectiveness but some of which are eligible for support.
107-132 Chapitre 4 AIE RENEWABLES.indd 125107-132 Chapitre 4 AIE RENEWABLES.indd 125 09/11/11 10:4409/11/11 10:44
© O
EC
D/IE
A, 2
011

Deploying Renewables: Economic Support Policies for Electricity
126
Table 4.6 Normalised remuneration levels (2009), RAI and PII (2008/09) for solar PV
PII Average RAI
Maximum RAI
Average normalised
remuneration
Maximum normalised
remuneration (%) (USD/MW per year) (USD/MWh)
Spain 7.6% 762 514 823 653 522.91 508.30Czech Republic 6.6% 658 913 694 422 661.35 658.91Belgium 5.7% 422 430 691 158 847.83 544.10Germany 5.0% 449 080 588 528 597.53 478.74Korea 3.1% 629 763 661 251 491.37 491.37Italy 3.1% 805 049 950 899 754.68 670.87Switzerland 2.6% 607 642 814 210 917.35 718.84Portugal 2.2% 725 829 892 083 541.16 462.32Australia 1.7% 354 066 596 046 337.03 210.21Canada 1.1% 66 696 70 030 49.94 49.94Japan 1.0% 261 737 281 803 236.15 230.30France 0.8% 501 611 597 480 607.11 535.18Austria 0.7% 317 962 398 137 510.43 428.03United States 0.5% 401 282 686 583 519.68 318.92Greece 0.4% 733 403 849 654 704.56 638.57Netherlands 0.4% 338 997 389 521 535.74 489.56Denmark 0.4% 79 082 98 611 111.98 94.29Luxembourg 0.3% 383 703 424 240 490.91 466.20Hungary 0.1% 124 678 130 912 131.98 131.98Sweden 0.1% 40 752 42 789 66.79 66.79Finland 0.1% 35 718 37 504 47.00 47.00United Kingdom 0.1% 166 449 174 771 198.55 198.55Slovak Republic 0.1% 471 875 495 468 547.35 547.35China 0.1% 262 131 275 237 159.59 159.59Mexico 0.0% 28 066 29 469 51.84 51.84India 0.0% 632 614 664 245 380.91 380.91Turkey 0.0% 123 553 129 731 85.98 85.98New Zealand 0.0% 55 629 58 410 47.34 47.34Norway 0.0% 39 378 37 502 46.88 46.88Iceland 0.0% 14 511 15 236 18.14 18.14Ireland 0.0% 46 730 49 066 62.52 62.52Poland 0.0% 96 711 101 547 122.61 122.61Russia 0.0% 47 450 49 823 50.00 50.00Brazil 0.0% 58 684 61 618 35.73 35.73South Africa 0.0% 83 601 87 781 47.23 47.23
107-132 Chapitre 4 AIE RENEWABLES.indd 126107-132 Chapitre 4 AIE RENEWABLES.indd 126 09/11/11 10:4409/11/11 10:44
© O
EC
D/IE
A, 2
011

Chapter 4: Economic Support Policies for Electricity
127
The largest group of countries, however, includes those countries not providing support levels that are cost recovering even under optimal conditions. Accordingly, deployment has been mostly absent.
Total cost indicatorWith deployment of RE technologies that are still moving down the earlier phases of their learning curves (such as PV), at large volumes, the total support costs move to the centre of policy attention. To assess the overall burden that support policies put on the national energy system, the TCI was calculated for the additional generation produced in 2010 (Figure 4.11).
Figure 4.11 Total cost indicator for solar PV in major markets, 2010
0.00% 0.50% 1.00% 1.50% 2.00% 2.50% 3.00%
Additional annual premiums (share of wholesale value of total generation)
Additional share in annual generation
Japan
Australia
Belgium
other 26countries
Czech Republic
France
Germany
Greece
Italy
Slovak Republic
0%
2%
4%
6%
8%
10%
12%
14%
16%
18%
20%Mainly FITs
/FIPs
Mainly TGCs
Mainly other/multiple
None
Note: Only countries with sufficiently high deployment levels are shown.
Key point
Solar PV support requires the payment of comparably high premiums.
Due to its relatively small size, combined with very high tariffs, the Czech Republic is subject to the largest burden with respect to its overall power system. This share is almost twice as high as for Germany. Also, compared to onshore wind, much larger premiums need to be paid (Box 4.1).
107-132 Chapitre 4 AIE RENEWABLES.indd 127107-132 Chapitre 4 AIE RENEWABLES.indd 127 09/11/11 10:4409/11/11 10:44
© O
EC
D/IE
A, 2
011

Deploying Renewables: Economic Support Policies for Electricity
128
8. In the case of Germany, rooftop or small commercial installations account for 60% of new installed capacity in 2010, and 97% of all plants.
Box 4.1 Rapid growth in solar PV markets: PV bubbles
Larger than expected amounts of PV have been installed in a number of countries that have used FITs as the main instrument to promote deployment. These unexpectedly booming PV markets are causing difficulties for policy makers and stakeholders, and are creating tensions and a lively debate regarding the cost of support policies. The debate has spilled across to other renewable support policies, although the problem is essentially confined to PV because of its characteristics as discussed below.
Difficulties first became visible in Spain in 2008, when installed capacity reached 4 GW, almost ten times more than the official target at that time. In Italy, PV accelerated in 2010, with 3.45 GW cumulative capacity in 2010 and 4 GW awaiting connection (GSE [Gestoredei Servizi Elettrici], 2011).
By December 2010, France had approximately 0.97 GW installed and another 4 GW in the pipeline (which together represent almost 100% of the 2020 target), although new legislation has put constraints on the support eligibility of some of these projects depending on the phase of the project development reached in early 2011. The Czech Republic, with 1.9 GW cumulative installed capacity in 2010, is already above its 2020 1.7 GW target, according to CEPS, the national grid operator. In Germany, some 7.4 GW were installed in 2010. Although the growth rate exceeds that which would be consistent with the 2020 targets (about 3.6 GW/year), the German PV installed capacity targeted for 2020 is very large (52 GW) compared to installed capacity at the end of 2010 (17.3 GW). Thailand experienced similar problems. The introduction of a generous and uncapped feed-in premium, combined with a decline in PV system costs, led to an explosion of solar project applications. Applications in 2010 totalled 3.6 GW, more than six times the 2020 target of 550 MW.
Four considerations can help explain the PV boom and these related “PV bubbles”.
• PV is extremely modular, easy and fast to install, and accessible to the general public.
• PV investment has been sold both as a green investment at the individual level, and as a financial product. Hundreds of thousands of individuals have been offered PV project returns of about 7%-9%.8 PV was and still is commercially promoted as a long-term, risk-free, green investment instrument. At the same time, abundant equity has been available. Compared to this investment alternative, government bonds would yield between 2.0% and 5%.
• In addition, central monitoring of the rates of such installations is difficult, and system operators may have limited real-time information and means of controlling installation of PV plants, at least in some countries.
• PV suffered excessive incentives in some countries, providing unnecessary returns.
107-132 Chapitre 4 AIE RENEWABLES.indd 128107-132 Chapitre 4 AIE RENEWABLES.indd 128 09/11/11 10:4409/11/11 10:44
© O
EC
D/IE
A, 2
011
Chapter 4: Economic Support Policies for Electricity
129
Generous incentives, inconsistent with declining PV costs, have been and still are available. This situation has allowed for intermediaries to appear in the PV development business, because projects allow for relatively high returns. As a result, final investors harnessed reasonable returns, while intermediaries captured excessive remuneration. Incentives failed to adjust quickly enough to technology improvement and cost reductions. Although the market recognised how PV costs have been dropping sharply, regulation often did not follow a similar path. Potential market changes were not considered ex ante, and remuneration levels remained too high.
PV growth has been concentrated in a limited number of markets. As of early 2011, roughly 70% of cumulative global capacity is located in a small number of countries: Germany, Spain, Italy and the Czech Republic. Such a concentration of large global PV deployment in only a few markets inevitably leads to spikes in incentive costs, i.e. “PV bubbles”.
Renewables, and PV in particular, are also a relatively new industry, and all agents, including policy makers and regulators, face a “learning curve”. Some changes in the ways that policies are framed are necessary to provide an environment conducive to a growing market, while avoiding over-stimulating the market and leading to much higher-than-expected policy costs.
Supply and demand of components cannot be expected to keep in step during this inception phase, so deployment rates and costs can be expected to get out of equilibrium at some points. The situation that has led to the problems described above in Spain and other markets could well be exceptional and linked to some details of the regulations that were in place in Spain in 2007 (Real Decreto 661/2007), the strong market in Germany in 2009, and a supply shortage of solar-grade polysilicon.
The Royal Decree 661/2007 came into force in May 2007. It contained a target of 371 MW of cumulative installed capacity for solar PV installations receiving a FIT and 500 MW receiving a FIT premium. The law further included a provision that, once 85% of this target was reached, only those installations that registered in the following 12 months would receive the original incentive level. This provision triggered an installation rush of more than 3 000 MW in the following 12 months. This surge in development put pressure on PV module and component supply, which coincided with an already existing supply shortage of polysilicon. The shortage was exacerbated by strong PV module demand from Spain and Germany. Spot market prices for polysilicon peaked in Q1 2008, some three months after the onset of the Spanish PV rush (Figure 4.12).
At this point, the collapse of the Spanish market went hand-in-hand with the removal of the bottleneck in silicon supply and with new production capacity coming on-line. The market for PV systems reacted as can be expected. System costs decreased very quickly during 2009 (by about 20% in one year). Such a quick decrease had not been anticipated by regulators. Not surprisingly, markets took off where demand was not capped. This trend was true especially in Germany, as well as in the Czech Republic, but deployment increased across the globe (Figure 4.11).
107-132 Chapitre 4 AIE RENEWABLES.indd 129107-132 Chapitre 4 AIE RENEWABLES.indd 129 09/11/11 10:4409/11/11 10:44
© O
EC
D/IE
A, 2
011

Deploying Renewables: Economic Support Policies for Electricity
130
Figure 4.12 Spot market prices for solar-grade polysilicon and evolution of German PV system retail prices
050
100150200250300350400450500
Q1
Q2
Q3
Q4
Q1
Q2
Q3
Q4
Q1
Q2
Q3
Q4
Q1
Q2
Q3
Q4
Q1
Q2
Q3
Q4
Q1
Q2
Q1
Q2
Q3
Q4
2005 2006 2007 2008 2009 2010 2011
USD/kg
2 0002 5003 0003 5004 0004 5005 0005 5006 0006 500
USD/ kWp
Siliconprice
Systemprice
Note: Prices exclude VAT, Exchange rates USD/EUR 2005: 0.805, 2006: 0.797, 2007: 0.73, 2008: 0.684, 2009: 0.7198, 2010: 0.755, 2011: 0.755.
Source: Derived from IEA data, BNEF (2011d) and BSW (2011).
Key point
The peak of polysilicon prices occurred in Q1 2008. During 2008, PV system prices in Germany remained constant and saw a strong decrease in 2009.
Conclusions about electricity support policy toolsSupport policies for renewables work, but they do not all work equally well. The preceding analysis shows policies that have a large impact and are also cost effective, policies that have an impact but at a very high cost, as well as policies that fail to show an impact even though incentive levels could be considered to be excessive.
A general trend exists of feed-in systems performing better on cost-effectiveness as measured by the remuneration adequacy indicator (RAI), but the case of Sweden demonstrates that certificate schemes can have an impact and be cost effective.
The data on wind energy shows that high impact certificate schemes frequently are less cost effective than FITs (United Kingdom, Italy and Belgium), but this finding cannot be interpreted as a general defect of the policy mechanism itself. These countries may happen to be the ones that have very high levels of non-economic barriers.
Although highly cost-effective and high-impact countries all use FITs, a number of cases exist in which FIT systems have no impact, even in the presence of high support levels. The mere presence of a cost-recovering FIT or FIP is not sufficient to stimulate deployment.9
Two phenomena revealed above in the analysis of onshore wind merit a more in-depth discussion:
• the higher remunerations paid under certificate systems; and
• the negative correlation between impact and remuneration level of FITs.
9. The current data, however, does not rule out that achieving both very high impact and very high cost-effectiveness may require the use of a FIT.
107-132 Chapitre 4 AIE RENEWABLES.indd 130107-132 Chapitre 4 AIE RENEWABLES.indd 130 09/11/11 10:4409/11/11 10:44
© O
EC
D/IE
A, 2
011
Chapter 4: Economic Support Policies for Electricity
131
Regarding the first phenomenon, it is important to note that TGC systems are intended to find an appropriate market price to stimulate deployment. It is difficult to identify whether higher incentives under TGCs are a systematic disadvantage of the policy mechanism itself (perhaps because the market–based incentive is seen as more risky), or whether having an incentive that is not tailored to particular technologies means that incentives do not encourage price reduction. Alternatively, investors in these countries may happen to face higher costs associated with dealing with non-economic barriers (such as gaining planning permission or grid connections), or overall confidence in long-term market security may be lower.
In any case, certificate prices include many risk factors that are not a genuine property of RE technologies per se. On the contrary, legislative uncertainty and the full arsenal of non-economic barriers all contribute to driving up certificate prices. Policy makers need to recognise that high certificate prices may point to the need for non-economic policy engagement. If policy makers regard the high costs of RE certificates as a given, they may not adopt the best policy practice.
The same lesson can be learned for feed-in schemes but with price and volume reversing positions. FIT systems may exist where deployment is slow, even in the presence of comparably high incentives. Incentives may not be too low per se. Non-economic barriers are more likely slowing down deployment. The feed-in system will then respond in the only way it can: as prices are fixed, market volume remains negligible.
Regarding the second phenomenon, the impact/remuneration analysis for wind shows that those countries paying less with their FIT actually have a higher impact.10 This observation, however, does not imply that they are more effective because they are paying less. The inverse may hold: once markets are functioning well and have become mature, deployment faces fewer barriers. Lower remunerations, therefore, will suffice. In this context, the role of learning is of importance. Those countries that show high impact with high cost-effectiveness tend to be also those with a very long track record of policy support. Certificate systems catching up with FITs with regard to impact could also be a policy learning effect. Further analysis regarding the temporal, dynamic dimension of impact and remuneration adequacy would be required to gain a full understanding of this interaction.
Turning back to the discussion on certificate vs. feed-in systems, the current analysis shows that the difference between the systems tends to be smaller than the differences among countries with the same system. The focus on implementational detail and on non-economic barriers makes policies have a high impact at low costs. Policy making needs to recognise that a dynamic transition of the energy system requires active policy engagement above and beyond making a choice between FITs and TGCs. This is especially true for the early phases of market development. Policy making needs to signal a comprehensive and robust environment so investments can proceed at the lowest possible cost to society.
A wide range of policy tools is now available, and an experience base exists that should enable policy makers to avoid the major drawbacks of each tool. The choice of a particular mechanism should depend on a number of factors including:
10. Note that the sample size is too small for this result to reach statistical significance.
107-132 Chapitre 4 AIE RENEWABLES.indd 131107-132 Chapitre 4 AIE RENEWABLES.indd 131 09/11/11 10:4409/11/11 10:44
© O
EC
D/IE
A, 2
011

Deploying Renewables: Economic Support Policies for Electricity
132
• the technology and its development status globally and in the specific country or region;
• the intended investor base and the scale of projects involved; and
• the match with overall electricity market design.
FITs have demonstrated that they can have an impact in wide range of circumstances. Support levels can be tailored, but regular built-in tariff reviews are necessary to avoid over-rewarding investors as costs evolve. For very modular technologies with short development times and high learning rates (solar PV), a mechanism to prevent explosive growth (via a capacity or expenditure cap) is necessary. FITs do not expose the technologies to the direct competitive market with other technologies. They are, therefore, well suited to technologies that are some way from being competitive. In addition, if ambitious schedules for tariff reductions are built in, technological innovation and cost reduction can be encouraged, even for more mature options such as onshore wind. Implementing a feed-in system in the form of a premium on top of electricity market prices can be used to expose technologies to competition.
TGCs can also effectively stimulate deployment. Deployment volumes and prices can be controlled via caps, buy-out fees, price floors and banding, which rewards different technologies with specific measures. These controls, however, still risk over-rewarding some technologies. The costs to rate-payers in general may be higher due to price risks and increased transaction costs. The complexities involved with certificate trading mean that these systems are best suited for projects involving larger-scale investors. The overall nature of the support is perhaps best suited for the more mature technologies that are approaching competitiveness and as a market-based mechanism. TGCs are more in line with underlying notions of competitive electricity market design.
Tenders provide a high level of security for project investors once they have won a bid. In the initial phase of project development, however, tenders have a very high level of uncertainty for investors. This uncertainty can be a barrier in particular for smaller developers. An advantage of this mechanism is that it allows for competitive price discovery. This mechanism, therefore, provides a good opportunity to bring forward quantified levels of deployment at a low cost in the context of the local market. It is perhaps best suited to mature technologies that are becoming close to competitive. Even if penalties for non-construction or large delays are in place, the risk exists that some developers may underbid to win the tender, and then not be able to proceed.
Grants provide a relatively simple mechanism for encouraging deployment, but are perhaps best suited to technologies at or just leaving the demonstration stage, and for deployments at a limited scale or overall capacity. Grant schemes are often considered to be vulnerable to budget changes, so may not provide the long-term market certainty needed to develop supply chain capability. An advantage of grant schemes is that they can quickly substitute other mechanisms if these measures unexpectedly experience problems. The Section 1603 cash grant in the United States is an example for such an immediate reaction. It was adopted after the markets for tax reductions had come under pressure due to the economic downturn in 2009.
Tax incentives provide poor control of deployment volumes and prices, and exert little pressure on developers to control or reduce costs. They are susceptible to budget changes and so lead to stop-go deployment patterns not conducive to sustained growth in deployment levels.
107-132 Chapitre 4 AIE RENEWABLES.indd 132107-132 Chapitre 4 AIE RENEWABLES.indd 132 09/11/11 10:4409/11/11 10:44
© O
EC
D/IE
A, 2
011

Chapter 5: Going Global
133
This chapter is based on the information paper Renewable Energy: Markets and Prospects by Region (Müller, Marmion and Beerepoot, 2011), which tracks market and policy developments in 56 countries. For the current publication, these countries have been divided into six regional groups, according to OECD membership and common economic and geographical factors (Table 5.1).
Table 5.1 Regional grouping of studied countries
Region acronym Description Members
ASEAN-6 Subset of member countries of the Association of Southeast Asian Nations.
Indonesia, Malaysia, Philippines, Singapore, Thailand, Vietnam.
BRICS Five large emerging economies.
Brazil, Russia, India, China, South Africa.
MENA-7 Selection of countries from the Middle East and North Africa region.
Algeria, Egypt, Israel, Morocco, Saudi Arabia, Tunisia, United Arab Emirates.
OECD-30 All member countries of the OECD as of late 2009.
Australia, Austria, Belgium, Canada, Czech Republic, Denmark, Finland, France, Germany, Greece, Hungary, Iceland, Ireland, Italy, Japan, Korea, Luxembourg, Mexico, Netherlands, New Zealand, Norway, Poland, Portugal, Slovak Republic, Spain, Sweden, Switzerland, Turkey, United Kingdom, United States.
LA-2 Two Latin American countries.
Argentina, Chile.
SSA-6 Selection of Sub-Saharan African countries.
Botswana, Ghana, Kenya, Nigeria, Senegal, Tanzania.
This chapter provides brief summaries of the main market and policy trends in each of the regional groups. A detailed regional analysis can be found in the accompanying information paper (Müller, Marmion and Beereport, 2011). More details on policies are also available on-line via the IEA Global Renewable Energy Database (IEA, 2011a). In the information paper, regions are discussed with respect to:
• the recent market developments;
• policy developments in each of the six regional groups;
• IEA projections; and
• an analysis of the mid-term potential of renewable energy technologies in these regions.
Chapter 5Going Global
133-160 Chap_5 AIE RENEWABLES.indd 133133-160 Chap_5 AIE RENEWABLES.indd 133 09/11/11 10:4509/11/11 10:45
© O
EC
D/IE
A, 2
011

134
Deploying Renewables: Going Global
This discussion is supplemented by investment information on a regional level, based on recent information taken from UNEP/BNEF (2011).
The first part of this chapter briefly outlines the role that countries studied play in the global renewable energy sector. This general information is intended to put in perspective the subsequent discussion of each individual region.
The 56 countries taken together accounted for around 76% of the world’s population and 90% of global gross domestic product. They represent a large fraction of world energy use with:
• 89.8% of global electricity output;
• 88.1% of all road transport energy consumption; and
• 83.3% of global energy consumption for heat.
As far as RE is concerned the countries accounted for:
• 86.3% of global renewable electricity production;
• 99.7% of biogasoline and 95.7% of biodiesel consumption, as well as; and
• 75.5% of energy consumption for heat from renewable energy sources.
Large differences exist between the regions in the size of their electricity, heat and transport fuel markets. Differences are also evident in the overall generation and consumption trends.
Market trendsRenewable electricityThe pattern of global electricity generation and consumption is changing. As explained in Chapter 2, the share of total electricity produced within the OECD has been reducing due particularly to the rapid growth of generation in the BRICS countries, where the average annual growth rate was 5.2%, compared to 1.6% in the OECD. The other world regions are growing even more quickly but from a lower base.
The differences in growth rates should be considered when assessing the development of RE technologies in the different regions. Although rapid demand increase can be an opportunity for RE deployment, meeting very dynamic growth rates makes affordability a key issue, because of the large additional capacity which need to be financed. In addition, less developed energy sectors historically tend to have larger shares of hydro generation (for example, the SSA region). Hydro power expansion usually cannot match recent demand increases at a sufficiently quick pace, because many suitable sites have already been developed and project lead times are high. As a result, the overall share of renewables has actually decreased in a number of regions over the last 10 years despite increases in absolute terms.
Moderate demand increases in large and more developed economies can be met more readily by the deployment of RE technologies, in particular as far as non-hydro technologies are concerned.
The OECD and BRICS provide 81% of the global renewable electricity production (Figure 5.1). The OECD clearly leads in terms of non-hydro generation from renewable
133-160 Chap_5 AIE RENEWABLES.indd 134133-160 Chap_5 AIE RENEWABLES.indd 134 09/11/11 10:4509/11/11 10:45
© O
EC
D/IE
A, 2
011
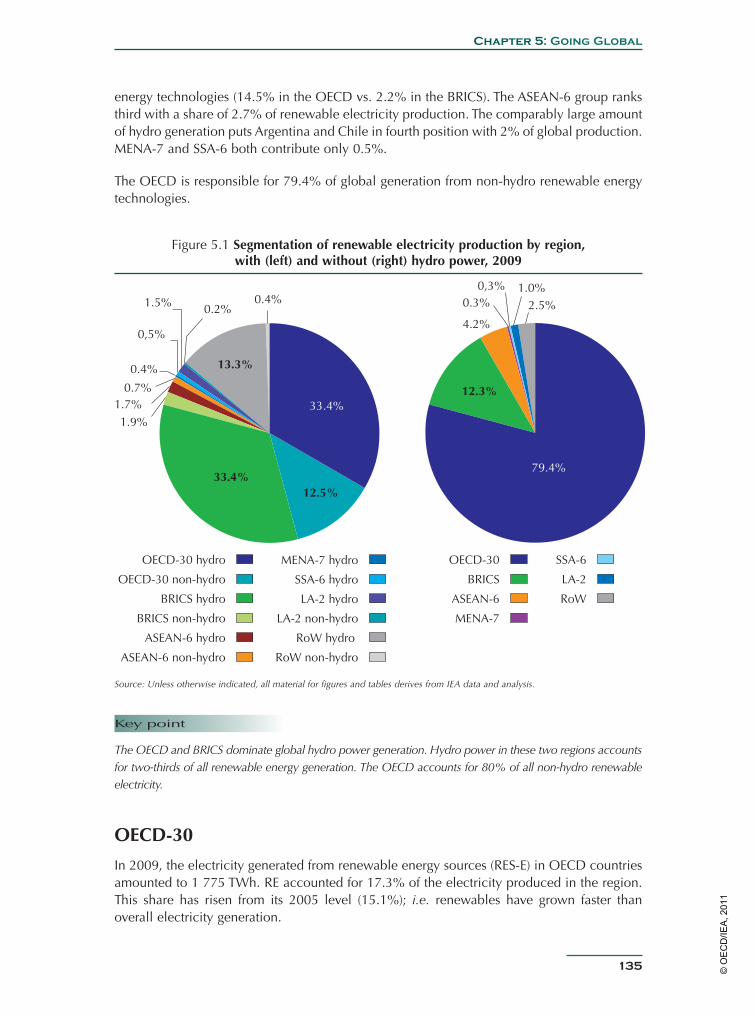
Chapter 5: Going Global
135
energy technologies (14.5% in the OECD vs. 2.2% in the BRICS). The ASEAN-6 group ranks third with a share of 2.7% of renewable electricity production. The comparably large amount of hydro generation puts Argentina and Chile in fourth position with 2% of global production. MENA-7 and SSA-6 both contribute only 0.5%.
The OECD is responsible for 79.4% of global generation from non-hydro renewable energy technologies.
Figure 5.1 Segmentation of renewable electricity production by region, with (left) and without (right) hydro power, 2009
1.7%0.7%
0.4%
1.5% 0.2%
13.3%
0.4%
33.4%
12.5%33.4%
1.9%
0,5%
OECD-30 hydro
OECD-30 non-hydro
BRICS hydro
BRICS non-hydro
ASEAN-6 hydro
ASEAN-6 non-hydro
MENA-7 hydro
SSA-6 hydro
LA-2 hydro
LA-2 non-hydro
RoW hydro
RoW non-hydro
4.2%
0.3%1.0%
2.5%
79.4%
12.3%
0,3%
OECD-30
BRICS
ASEAN-6
MENA-7
SSA-6
LA-2
RoW
Source: Unless otherwise indicated, all material for figures and tables derives from IEA data and analysis.
Key point
The OECD and BRICS dominate global hydro power generation. Hydro power in these two regions accounts for two-thirds of all renewable energy generation. The OECD accounts for 80% of all non-hydro renewable electricity.
OECD-30
In 2009, the electricity generated from renewable energy sources (RES-E) in OECD countries amounted to 1 775 TWh. RE accounted for 17.3% of the electricity produced in the region. This share has risen from its 2005 level (15.1%); i.e. renewables have grown faster than overall electricity generation.
133-160 Chap_5 AIE RENEWABLES.indd 135133-160 Chap_5 AIE RENEWABLES.indd 135 09/11/11 10:4509/11/11 10:45
© O
EC
D/IE
A, 2
011

136
Deploying Renewables: Going Global
Hydro power still dominates the OECD’s RES-E portfolio, with a share of 72.7%. This number has decreased since 2005, when it stood at 81.0%. Wind energy generation has more than doubled since 2005 (138% increase) and now is the second largest contributor, with a share of 12.6%. The share of biomass, renewable municipal waste, biogas and liquid biofuels increased only marginally to 11.2% in 2009 (from 10.3% in 2005). Geothermal electricity has contributed at a stable level of around 2.4% since 2005. The most dynamic development occurred for solar photovoltaics (PV). Its contribution reached the 1% level for the first time in 2009 after a fivefold increase since 2005 (compound annual growth rate [CAGR] of 52%).
Although the United States is the largest RE technology market in absolute terms, Germany, Spain and Portugal saw the steepest increase in penetration since 2000 (Figure 5.2).
Figure 5.2 Non-hydro renewable electricity market share by country, 2009
Germany15.6%
Spain9.8%
Japan5.4%
Italy4.2%
UK4.1%
Sweden2.9%
France2.6%
Rest of OECD21.5%
Canada2.3%
United States31.6%
Key point
Among the OECD countries, the United States has a dominant share of both total production of all renewable electricity and of non-hydro renewables.
BRICSIn 2009, the total electricity output of the BRICS countries was 6 337.4 TWh (31.6% of the global total). The BRICS accounted for 65% of the global increase in electricity demand since 2000.1
The share of renewables in BRICS countries shows a clear split between the countries in the group that have significant shares of renewables (Brazil, China and India) and those that have almost none (South Africa and Russia). Given the BRICS strong growth in demand (7.2% annual average from 2000 to 2009), it is remarkable that the share of renewables in the mix has remained fairly constant (21.5% in 2009, compared to 23.1% in 2000). This constant
1.The electricity sector in China grew annually at an average rate of 11.6%, accounting for 51% of the global demand increase.
133-160 Chap_5 AIE RENEWABLES.indd 136133-160 Chap_5 AIE RENEWABLES.indd 136 09/11/11 10:4509/11/11 10:45
© O
EC
D/IE
A, 2
011

Chapter 5: Going Global
137
share is due to the development in China and India. The share of renewables in China increased from 16.3% in 2000 to 17.3% in 2009. India also increased the penetration of renewables from 13.8% in 2000 to 14.1% in 2009.
Hydro dominates the renewables mix in all BRICS countries, with shares above 94% in the renewable portfolio in all countries but India (84.3%) and South Africa (82.2%). As far as the deployment of non-hydro RE technologies is concerned, Brazil achieved a strong increase in biomass-fired electricity production, while India and, sometime later, China deployed wind power on a large scale. China is now the largest market for onshore wind in the world.
ASEAN-6
In 2009, renewable electricity, mostly hydro and some geothermal, accounted for 15.2% of the total 596 TWh of electricity produced across the ASEAN-6. This share had gone down since 2000, when it stood at 17.7%. In the nine years from 2000 to 2009, total power generation grew at a higher CAGR than renewables: 5.7% vs. 3.94%.
In summary, only Thailand was able to maintain its penetration of renewables over the last 10 years, thanks to the development of its bioenergy sector. The other ASEAN-6 countries saw a drop in the contribution from renewables. However, hydro power historically had dominant shares in generation, especially in Vietnam, where more than half of the electricity came from hydro power in the year 2000 (36% in 2009).
MENA-7
In 2009, total electricity generation in the MENA-7 countries was 581 TWh. From 2000 to 2009, generation grew by an average of 6.3% annually. Non-renewable generation increased by 248 TWh since 2000 (almost a doubling), while renewables grew by only 3 TWh. Consequently, the share of renewables has remained low. In 2009, renewable energy sources accounted for 3.5% of total production. Morocco and Egypt have higher RE electricity penetration (14% and 10%, respectively), while in the other countries, RE only contributes 0%-1% of electricity.
The contribution from hydro is dominated by Egypt’s Aswan Dam (it delivers about 13 TWh and 14 TWh annually). The additional hydro power output since the year 2000 comes mainly from Morocco (adding about 2 TWh) and, to a lesser extent, from Algeria (adding about 0.3 TWh). Non-hydro renewables grew at an average rate of 25.2% since 2000, however from a very low base. The development of non-hydro resources was concentrated in Egypt, Morocco, Tunisia and Israel. As of 2009, none of the other countries reported any non-hydro generation.
Latin America
Argentina and Chile produced 65.2 TWh of electricity from renewable sources in 2009. This amount corresponded to a share of 40.3% of total generation (182.6 TWh). Chile has a higher share of renewables than Argentina (48.8% vs. 29.2%) and showed stronger growth in past years (CAGR of non-hydro renewables for 2000-09: 18.6% vs. 10.3%). The increase in total electricity consumption, combined with a decreasing output of hydro power, however, led to
133-160 Chap_5 AIE RENEWABLES.indd 137133-160 Chap_5 AIE RENEWABLES.indd 137 09/11/11 10:4509/11/11 10:45
© O
EC
D/IE
A, 2
011
138
Deploying Renewables: Going Global
a decreasing share of renewables in the mix in both countries. Hydro dominates the renewables portfolio with a share of 95% in Argentina and 85.3% in Chile.
Sub-Saharan Africa
In 2009, the total generation (all sources) in the Sub-Saharan Africa (SSA-6) countries amounted to 43.5 TWh. This is a very small amount compared to the region’s population of 235 million.2
The total share of renewables dropped from 52.8% in 2000 to 42.1% in 2009. Hydro power provided 91.2% of total renewable electricity in 2009. Geothermal made up 6.8% of the share (concentrated exclusively in Kenya), biomass contributed 1.9% and wind and solar energy contributed negligible shares. Renewable electricity did not grow as fast as total generation (CAGR 3.8% vs. 1.21%). Some diversity exists among the countries regarding the evolution of the renewables share.
Renewable heat
The overall consumption of energy to produce heat is more evenly spread among the regions than electricity. Heat plays an important role whatever the level of economic development, and more developed countries tend to produce and consume heat more efficiently, and to rely less on very inefficient use of traditional biomass.
The dominance of OECD and BRICS in the renewable heat sector is also less pronounced than for transport and electricity. The two main reasons for this are: (i) the more direct link between heat demand with population for cooking and hot water, and (ii) the widespread use of traditional biomass in less-developed countries. As regards the utilisation of biomass and waste as well as non-biomass renewables, the BRICS account for the largest share with 41.3%, followed by the OECD (12.9%), SSA-6 (10.8%) and ASEAN-6 (9.2%). MENA-7 countries and the LA-2 region contribute 0.4% and 0.6%, respectively.
Non-biomass renewables contributed only very small amounts. Shares above 0.1% were attained only in the BRICS (0.9%) and in the OECD (0.7%). This amount is due mainly to solar water heaters in China, and to geothermal heat in the OECD. In the MENA-7 region, non-biomass renewables contribute 25% of renewable energy consumption for heat. This share is due mainly to the large market penetration of solar water heaters in Israel.
OECD-30
In 2009, the total final consumption for heat was 1 282 million tonnes of oil equivalent (Mtoe). This number has decreased by 8.6% since 2000, when it stood at 1 402 Mtoe. Renewables had a share of 10.5% in 2009, up from 9% in 2000. Nearly all OECD countries show considerable shares of final energy consumption for heat, independent of climatic conditions.
2. The total generation corresponds to a per capita generation of 192.7 kWh per year, which is only 2.25% of the OECD average (8 572 kWh/year) and 1.4% of the United States (13 547 kWh/year). In other words, the average per capita generation for a single person in the United States was 70 times higher than in Sub-Saharan Africa.
133-160 Chap_5 AIE RENEWABLES.indd 138133-160 Chap_5 AIE RENEWABLES.indd 138 09/11/11 10:4509/11/11 10:45
© O
EC
D/IE
A, 2
011

Chapter 5: Going Global
139
In OECD, the fuel mix used for heat shows a dominance of fossil fuels, with about 53.4% of heat being fuelled by gas. This share has risen since 2000, when it stood at 49.9%. A quarter of energy consumption for heat was supplied by oil and about 10% by coal. Bioenergy, including some non-renewable waste, contributed 10.7% to the mix. Geothermal heat and solar thermal heat provide 0.3% of final energy consumption for heat.
BRICSIn 2009, the total final consumption for heat was 1 537 Mtoe. This amount corresponds to an increase of 35% since 2000. In the BRICS countries, the fuel mix used for heat is dominated by fossil fuels, particularly coal (43%), followed by gas and oil (13.5% and 14.7%, respectively). Total renewables had a share of 28.3%.3 This share has gone down from 2000 levels, when it stood at 35.12%. This decrease was due to the slow growth of renewables compared to total consumption for heat. Bioenergy had a share of 27.8%. Geothermal (0.1%) and solar (0.9%) provided only small shares.
By the end of 2009, 101.5 GWth of solar thermal heat, or 58.9%, of the total worldwide collector installations, was reported to come from China (Weiss et al., 2011). China is also reported to be the largest contributor to worldwide geothermal direct heat use. In Brazil, bioenergy for heat plays an important role, accounting for 53% of total consumption.
ASEAN-6In ASEAN countries, the total final consumption for heat applications was 190 Mtoe in 2009. This number has increased by 23% since 2000, when it stood at 154 Mtoe. Heat demand for space heating is nearly absent, and cultural preferences limit the demand for domestic hot water. Substantial shares of traditional biomass used residentially at very low efficiencies, however, make heat demand in this sector appear larger than it is.
The fuel mix used for heat shows a 50.4% share of combustible renewables used for heat. This amount consists of large shares of traditional biomass used in very low efficiencies. Oil comes in second with 22.3%, and coal and gas have shares of 16.3% and 9.3%, respectively. Geothermal heat and solar thermal heat do not contribute to the energy mix for heat in ASEAN-6.
MENA-7The total consumption for heat usage amounted to 87.6 Mtoe in 2009. This number has increased by 47% since 2000, when it stood at 60 Mtoe. In the MENA-7 region, the fuel mix used for heat shows a dominance of oil and gas, with a 46.7% share of oil and 48.0% share of gas used for heat. Renewable heat contributes to a 4.8% share in total final energy consumption for heat, with 3.6% coming from bioenergy. Geothermal heat and solar thermal heat provide a 1.2% of final energy consumption for heat.
The Mediterranean and desert climate conditions in MENA-7 result in a considerable (latent) cooling demand, which is expected to rise parallel to economic development. Demand for
3. Statistical differences arise due to the fact that the bioenergy category contains small amounts of non-renewable waste.
133-160 Chap_5 AIE RENEWABLES.indd 139133-160 Chap_5 AIE RENEWABLES.indd 139 09/11/11 10:4509/11/11 10:45
© O
EC
D/IE
A, 2
011
140
Deploying Renewables: Going Global
cooling coincides with the availability of renewable heat, i.e. when it is hot outside. This situation can be used to create synergies.
Latin AmericaIn Argentina and Chile, the fuel mix used for heat shows a large difference between the two countries. Argentina uses large quantities of its own gas (56.5%) and oil (34%); Chile is largely dependent on imported oil (46.7%), but also uses large quantities of combustible renewables (43.6%). Since the year 2000, the share of renewables in the heat-related total final consumption has remained stable in Chile (43.0%) and declined in Argentina (down from 11.5% in 2000 to 6.1% in 2009). The decline in Argentina is due to a decrease in absolute terms in the utilisation of biomass.
Sub-Saharan AfricaCombustible renewables are the dominant source of energy for heat. In 2009, they accounted for 95.6% of heat-related energy consumption. This share has remained stable since 2000. Some modern biomass usage exists in the energy sectors of Nigeria, Ghana and Tanzania.
The relatively high per capita energy use for heat in the SSA-6 countries results from substantial shares of traditional biomass use, particularly for cooking. In 2009, the total consumption related to heat amounted to 117.7 Mtoe. This amount is a 17% increase compared to 2000 levels. Low efficiencies make energy input much larger than actual heat demand.
Renewable transportThe OECD-30 region is still the largest consumer for road transport. Its share has declined from 70% to 60% between 1999 and 2009, mainly due a strong increase in the BRICS and the other regions.
The OECD alone accounted for two-thirds of global biofuels production and consumption. The main centre of ethanol production and consumption is the United States, while Europe produces and consumes mainly biodiesel. The OECD is the only region with a net import of biofuels.
The BRICS, in particular Brazil, are the second largest producer and consumer. Brazil dwarfs all other BRICS countries in both production and consumption.
The remaining markets in other focus regions and the rest of the world account for merely 6% of total production and for 3.3% of consumption.
Compared to total final consumption for road transport, the total amount of biofuels consumption is small. In 2009, all biofuels together had a share of 3.0% in global road transport consumption. The BRICS had a higher share of 5.0% in 2009 (4.3% in 1990 and 3.5% in 2000).
Brazil has been a pioneer in the development of biofuels. The country had a biofuels share of 20% in 1990. This share declined to a minimum of 12.5% in 2001 and stood at 22.8% in 2009.
133-160 Chap_5 AIE RENEWABLES.indd 140133-160 Chap_5 AIE RENEWABLES.indd 140 09/11/11 10:4509/11/11 10:45
© O
EC
D/IE
A, 2
011
Chapter 5: Going Global
141
OECD-30In OECD countries, the use of biofuels for transport, including bioethanol and biodiesel, increased by a factor of 8.7 between 2000 and 2009, and 3.1 between 2005 and 2009, and reached 35.2 Mtoe/year in 2009. As a result, the percentage of road transport fuel needs supplied by biofuels increased from 0.4% in 2000, to 1.1% in 2005 and to 3.4% in 2009.
Within the OECD, consumption of biofuels was dominated by the United States, where in 2009, over 63.9% of the total was consumed (22.1 Mtoe/year, increasing by a factor of 2.7 since 2005). This amount represents 4.4% of total road transport fuel consumption. Consumption also continued to rise significantly in the OECD countries that are part of the European Union, reaching 11.7 Mtoe, or 33.2% of the total (an increase by a factor of 3.8 since 2005). Consumption is also now increasing sharply from a low base in the other OECD countries, particularly because of large increases in Korea, Australia and Canada. Biofuels are an internationally traded commodity, so production and utilisation are to some extent geographically decoupled. Within the OECD, the production of biofuels for fuel use increased by a factor of 2.9 between 2005 and 2009, reaching 35.1 Mtoe/year. The United States was the largest producer (22.1 Mtoe/y). Together, Germany and France are responsible for about two-thirds of total EU production (3.8 and 3.5 Mtoe/y, respectively). Trade is especially prominent between OECD members but also with non-OECD members such as Brazil, Indonesia and earlier with Malaysia. The reasons include production cost differences and higher market values within the OECD countries.
Although biofuel production and use have been growing steadily since 2000 in each of the sub-regions, more detailed analysis of the pattern of biodiesel production within the European Union shows that, between 2007 and 2008, a significant drop in production occurred in some countries, notably Germany, but also the United Kingdom, Austria, Greece, Portugal and the Czech Republic.
BRICSIn BRICS countries, the production and use of biofuels continue to be dominated by Brazil (almost all ethanol). Between 2000 and 2009, consumption in Brazil rose from 6.1 Mtoe/y to 13.2 Mtoe/y, representing an increase from 14.3% to 22.9% of total road transport energy use. Biofuels use has also grown rapidly in China in the last few years, reaching 1.2 Mtoe/y in 2009, which is 1% of road transport energy use. Biofuel use has continued to grow steadily in India, reaching 163.9 ktoe/y in 2009, which is 0.36% of road transport fuel demand, all bioethanol. There is no recorded use of biofuels in either Russia or South Africa.
ASEAN-6Biofuels consumption for road transport is nearly absent in the ASEAN-6 countries, and currently plays a role only in the Philippines and Thailand. All ASEAN-6 countries produce biofuels, however; i.e. the region is a net exporter. The total production of biodiesel in the region reached 719.8 ktoe in 2009. Bioethanol had a smaller production of 247.7 ktoe in that year. These levels have greatly increased since 2000, when production was zero.
In early 2011, a large-scale advanced biofuels plant, producing hydrogenated vegetable oil via the Neste process, and located in Singapore, has come on-line. One of the first such plants in the world, it uses feedstocks from many parts of the Pacific region.
133-160 Chap_5 AIE RENEWABLES.indd 141133-160 Chap_5 AIE RENEWABLES.indd 141 09/11/11 10:4509/11/11 10:45
© O
EC
D/IE
A, 2
011

142
Deploying Renewables: Going Global
Latin AmericaIn Argentina, all production and consumption relate to biodiesel, mainly produced from soybeans. The production has grown very rapidly since 2006 and reached 1 027 Ktoe/y in 2009; however, consumption is static at 47.46 Ktoe/y (0.39% of road transport fuel demand).The surplus production is exported, principally to Europe. There is no recorded production or consumption of biofuels in Chile.
Regional investment trendsA comprehensive overview of recent developments in sustainable energy can be found in the annual report Global Trends in Sustainable Energy Investment, compiled by the United Nations Environment Programme together with Bloomberg New Energy Finance and endorsed by the REN21 network (UNEP/BNEF, 2011).
Although investments on the global level have been rising constantly (cf. Chapter 1), important differences exist in regional investment patterns (Figure 5.3). As a result of the international financial and economic crisis, investments fell in 2009 in North America and stagnated in Europe in that year. In 2010, the North American market recovered close to 2008 levels, while the decline continued in Europe. The current data, however, does not include investments in small-scale installations, which accounted for a significant portion of overall investments in Europe in 2009 and 2010 (Table 5.2).
Figure 5.3 Financial new investment in renewable energy, 2004-10, USD billion
3.810.3
24.6 29.4 32.219.7
30.1
2004 2005 2006 2007 2008 2009 2010
North America
9.018.4
27.3
46.6 47.6 4535.2
2004 2005 2006 2007 2008 2009 2010
Europe
0.5 2.8 4.7 7.7 15.7 9.4 13.1
2004 2005 2006 2007 2008 2009 2010
South America
0.3 0.1 1.5 1.5 2.4 2.4 5.0
2004 2005 2006 2007 2008 2009 2010
Middle East and Africa
5.6 11 18.3 26.2 34.445.7
59.3
2004 2005 2006 2007 2008 2009 2010
Asia and Oceania
Note: New investment volume adjusts for re-invested equity. Total values include estimates for undisclosed deals. This comparison does not include small-scale projects.
Source: UNEP/SEFI (2011).
Key point
Asia has become increasingly important for renewable energy investments.
133-160 Chap_5 AIE RENEWABLES.indd 142133-160 Chap_5 AIE RENEWABLES.indd 142 09/11/11 10:4509/11/11 10:45
© O
EC
D/IE
A, 2
011

Chapter 5: Going Global
143
Table 5.2 Distributed capacity investments by country, 2010, USD billion
Country Investment Growth (on 2009)
(billion USD) (%)Israel 0.4 90Belgium 0.6 16China 0.9 43Australia 0.9 74Czech Republic 2.3 163France 2.7 150Japan 3.3 48United States 4.5 49Italy 5.5 59Germany 34.3 132
Source: UNEP/BNEF (2011).
Key point
Small-scale projects are growing quickly from a low base in many countries. In Germany alone, investments in small-scale projects were equal to all investments in large-scale projects in the whole of Europe.
PoliciesThe analysis of deployment trends indicates that renewable energy production is still largely concentrated in the OECD and BRICS countries. Over the last five years, however, a substantial increase has occurred in the number of countries in other regions that have introduced policies supporting RE technologies, with an emphasis on the electricity sector. Given these policy initiatives, the regional pattern of renewable energy deployment can be expected to become more diverse in the coming years.
General trends
Renewable electricity
Targets
In 2005, about 30 out of the 56 focus countries had enacted official renewable electricity generation targets; of these, only 3 were non-OECD members: India, China and Thailand (Table 5.3). By 2011, this trend has completely changed, with no fewer than 45 of the 56 countries having renewable electricity targets in place, including 20 non-OECD members. In addition, many more of these countries have enacted technology-specific targets; e.g. Kenya has targeted 4 GW of geothermal installed capacity to be installed by 2030, and Malaysia is aiming to install 3 GW of new renewables by 2020. Others have a target for final energy consumption, such as Norway targeting 67.5% of renewables by 2020.
133-160 Chap_5 AIE RENEWABLES.indd 143133-160 Chap_5 AIE RENEWABLES.indd 143 09/11/11 10:4509/11/11 10:45
© O
EC
D/IE
A, 2
011

144
Deploying Renewables: Going Global
Table 5.3 Renewable electricity generation targets, 2005 and 2010
Region 2005 2010OECD-30 25 25BRICS 3 5ASEAN-6 2 4MENA-7 0 6LA-2 0 2SSA-6 0 3Total 30 45
Key point
Especially non-OECD member countries have adopted RE targets since 2005.
Regulatory measuresIn 2005, 35 of the 56 focus countries had adopted renewable electricity support policies, in the form of financing, pricing, fiscal or public bidding policies. All of these countries were either OECD members or part of the BRICS grouping, along with Indonesia, Thailand and the Philippines from South East Asia. In 2011, all focus countries except Iceland, Saudi Arabia and Botswana had implemented RE dedicated policies or incentives.
In 2005,18 of the 35 focus countries supporting renewable energy had enacted a feed-in tariff system, making it the most popular RE support policy. Out of these 18 countries, only 3 (Brazil, Thailand and Indonesia) were non-OECD members.
In 2011, 31 of the 56 focus countries have a feed-in tariff scheme in force, with a notably larger share of non-OECD members (12 out of 31). Several OECD members have introduced FITs in recent years, e.g. United Kingdom and Finland, but most new feed-in tariff schemes were introduced in emerging economies (e.g. China, India and South Africa), and in developing countries (e.g. Malaysia, Kenya, Tanzania and Algeria). In the OECD region, the emphasis has been on refining and updating policies in the light of experience.
In recent years, the share of countries relying on public competitive bidding process to auction renewable energy generation capacity has increased rapidly, with the Latin American region being a case in point (e.g. Mexico, Brazil, Argentina and Chile).
A large majority of focus countries in 2011 also rely on fiscal incentives (mainly VAT/income/investments tax and duty exemption).
Renewable heatIn the renewable heat sector, policy activity is still largely concentrated in the OECD and BRICS regions. In the European Union, the trend is towards policies that specifically encourage the use of renewable heating technologies, building on more general policies aimed at the building sector more generally, perhaps stimulated by the need to meet the requirements of the EU Renewable Energy Directive. In other regions, the emphasis has been on policies to incentivise the use of solar water heaters (for example, in China and Israel).
133-160 Chap_5 AIE RENEWABLES.indd 144133-160 Chap_5 AIE RENEWABLES.indd 144 09/11/11 10:4509/11/11 10:45
© O
EC
D/IE
A, 2
011

Chapter 5: Going Global
145
Renewable transport
In the renewable transport sector, around 50 countries have taken measures to stimulate take-up of biofuels (Table 5.4) including 20 from outside the OECD and BRIC regions.
Table 5.4 Policy measures to stimulate take-up of biofuels
Country/Region Current mandate/ target
Future mandate/target Current status (mandate (M)/ target (T))
Argentina E5, B7 n.a. M
Australia (New South Wales (NSW), Queensland (QL))
NSW: E4, B2 NSW: E6 (2011); QL: E5 (recently put on hold until autumn 2011)
M
Bolivia E10, B2.5 B20 (2015) T
Brazil E20-25, B5 n.a. M
Canada E5 (up to E8.5 in 4 provinces), B2-B3 (in 3 provinces)
B2 (nationwide) (2012)
M
Chile E5, B5 n.a. T
China (9 provinces) E10 (9 provinces) n.a. M
Colombia E10, B10 B20 (2012) M
Costa Rica E7, B20 n.a. M
Dominican Republic n.a. E15, B2 (2015) n.a.
European Union 5.75% biofuels 10% renewable energy in transport
T
India E10 E20, B20 (2017) T
Indonesia E3, B2.5 E5, B5 (2015); E15, B20 (2025)
M
Jamaica E10 Renewable energy in transport: 11% (2012); 12.5% (2015); 20% (2030)
M
Japan 500 Ml/y (oil equivalent)
800 Ml/y (2018) T
Kenya E10 (in Kisumu) n.a. M
Korea B2 B2.5 (2011); B3 (2012)
M
Malaysia B5 n.a. M
Mexico E2 (in Guadalajara) E2 (in Moterrey and Mexico City)
M
Mozambique n.a. E10, B5 (2015) n.a.
133-160 Chap_5 AIE RENEWABLES.indd 145133-160 Chap_5 AIE RENEWABLES.indd 145 09/11/11 10:4509/11/11 10:45
© O
EC
D/IE
A, 2
011

146
Deploying Renewables: Going Global
Country/Region Current mandate/ target
Future mandate/target Current status (mandate (M)/ target (T))
Norway 3.5% biofuelspossibly alignment with EU mandate
M
Nigeria E10 n.a. T
Paraguay E24, B1 n.a. M
Peru E7.8, B2 B5 (2011) M
Philippines E5, B2 E10, B5 (2011) M
South Africa n.a. 2% (2013) n.a.
Taiwan B2, E3 n.a. M
Thailand B33Ml/d ethanol, B5 (2011); 9Ml/d ethanol (2017)
M
Uruguay n.a. E5, B5 (2015) n.a.
United States48 billion litres of which 0.02 cellu-losic-ethanol
136 billion litres, of which 60 cellulosic-ethanol (2022)
M
Venezuela E10 n.a. T
Vietnam n.a.50Ml biodiesel, 500 Ml ethanol (2020)
n.a.
Zambia n.a. E5, B10 (2011) n.a.Source: IEA (2011c).
Policy developments by region
OECD-30The most important support policies for renewable electricity in OECD countries are feed-in tariffs (FITs), which are in place in 22 of 30 OECD members, and the combination of quota systems with tradable green certificates (TGCs) (Table 5.5).
Recent evolutions in the design of FITs mirror an acceleration in tariff adjustment to keep pace with generation cost, and a greater concentration of pricing policies for medium- and small-scale plants. Large-scale generation projects tend to rely on competitive bidding processes, such as in Italy where, as of January 2013, solar PV plants larger than 5 MW will be tendered through a auction system. In France, solar PV building installations larger than 100 kW and ground-mounted plants are tendered. Several countries (Italy and the United Kingdom) combine both tools. Other countries have switched from a FIT to a renewable portfolio standard (RPS) (South Korea), or are implementing innovative frameworks such as in Norway and Sweden, where a common TGC scheme is expected to be implemented as of January 2012. In the United Kingdom, a banded TGC quota supports technologies that are still at an early stage of development. Renewable energy policies focusing on the issue
Table 5.4 (continued) Policy measures to stimulate take-up of biofuels
133-160 Chap_5 AIE RENEWABLES.indd 146133-160 Chap_5 AIE RENEWABLES.indd 146 09/11/11 10:4509/11/11 10:45
© O
EC
D/IE
A, 2
011

Chapter 5: Going Global
147
Table 5.5 Development of the main policy support instruments in OECD countries
2000
2001
2002
2003
2004
2005
2006
2007
2008
2009
2010
2011
2012
133-160 Chap_5 AIE RENEWABLES.indd 147133-160 Chap_5 AIE RENEWABLES.indd 147 09/11/11 10:4509/11/11 10:45
© O
EC
D/IE
A, 2
011

148
Deploying Renewables: Going Global
2000
2001
2002
2003
2004
2005
2006
2007
2008
2009
2010
2011
2012
Table 5.5 (Continued) Development of the main policy support instruments in OECD countries
133-160 Chap_5 AIE RENEWABLES.indd 148133-160 Chap_5 AIE RENEWABLES.indd 148 09/11/11 10:4509/11/11 10:45
© O
EC
D/IE
A, 2
011
Chapter 5: Going Global
149
of grid integration (United Kingdom), expansion (Germany), and generation plants retrofitting (Denmark), are addressing the need for infrastructure adaptation and variable renewables integration.
At the EU level, member states renewed their political frameworks to meet binding targets for the overall share of renewable energy in gross final consumption, which was included in the EU directive on promotion of the use of energy from renewable sources (EU, 2009). A majority of EU countries have a FIT in place for electricity and blending mandates for transport, while financial incentives remain predominant in the heat sector. In Sweden and Denmark, CO2 emission taxations dramatically boosted renewable heat generation.
Tax incentives, investment subsidies and loan programs have also been used frequently in the electricity sector and are the most commonly used instruments in the heating sector. These incentives, together with biofuels blending mandates, dominate the federal landscape (United States), when individual states or counties have adopted FITs (Ontario, Canada; Australian Capital Territories, Australia), TGCs or RPS schemes (Nova Scotia, Canada; Minnesota, United States) or both (California, United States).
As for heat, policies directly targeting renewable heat have shown constant increase since 2005 (Table 5.6). Renewable heat used to be incorporated in indirect energy regulations or in multi-sectoral policies. This trend reversed in the years 2007/08, and heat-specific policies have become much more common in EU countries, perhaps because of the need for an increased emphasis on renewable heat necessitated by the Renewable Energy Directive, and the development of renewable energy action plans in each country. An emphasis is continuing on cash grants and loan programmes. Some states, however, are looking for policies that do not rely on funding from national budgets and have, therefore, adopted obligation and quota systems (Spain, Germany), while also applying the EU Energy Performance of Buildings Directive (EPBD). Although feed-in tariffs are rare in the heating sector, mainly because of the large number of stakeholders, the United Kingdom has introduced a heat FIT that remunerates industrial and commercial heat generation. Other remuneration schemes for private stakeholders are under consideration in a number of other countries, including Germany.
133-160 Chap_5 AIE RENEWABLES.indd 149133-160 Chap_5 AIE RENEWABLES.indd 149 09/11/11 10:4509/11/11 10:45
© O
EC
D/IE
A, 2
011

150
Deploying Renewables: Going Global
Table 5.6 Regional overview of policies targeting renewable heat
Pricing policies
Quantitative policies
Guidance/training
Tax & customincentives
Financialincentives
Targets
RD&D
1995-1999 1999-2004 2005-2006 2007-2008 2009 2010 2011
US
JP
ICKO
CA
FIAU IE
NO UK
HUDK
FI
AT
NL
AT CA
GR
CA
CA SW
JP
AU
DE
LU US
CZ
FI FR
DE NO
UK
FRAT
NO
NE
US
GR
SW
CZ
US
DK
DK
NZ
FR
NO
US
UKFI
IS KO
DE
SP
ATLU
SK
NO
NL
JPTH JP CHI
UK
SP
PO
CH
SK
SW
US GRIT
DK
DESL
PL IR AT
AU
DE
FR
DE
IC
FR
AT
JP
CA
FI
US
CA
NL
CH
US
IT
IN
IR
SK
TU
UK
AT
MA
AT
SW
FR
DK
UK
AU
TU
SW
CA
CA
IR
SK
US
NZ
FR
SI
BRAU
IR
LU
FR
SA NL
CHPO
TH FI
FR DE
IN
FRAUCZ
ITN SW SE
CY
LU TU
US UK
AU
DE BU
SLIT
PO
HU
PL
UK
FI
CZ
NLSA
FR
GR
PO
US
IT
KO
NZ
US
US
CL
AT
JP
IT
JP
MO
TUUG
SI
IN
SACHI
TU
MO
TU
CL
IT
AU
Direct RES-H policy
Indirect RES-H policy/general energy/clean techn/climate change strategy
Provincial or state level-in federal context-policies
All EU 27
Note: See Annex A for country codes.
Key point
Renewable heat used to be incorporated in indirect (red dots) energy regulations or multi-sectoral policies. This trend reversed in the years 2007/08, and heat-specific policies (blue) became more common.
BRICS
All the countries in the BRICS group, except for Russia, already had policies in place supporting renewables in 2005. To cope with energy demand increases, renewable energy policies of BRICS countries have experienced important changes over the past 50 to 10 years as governments have been looking for the most cost-efficient options to deploy RE technologies at a large scale so as to diversify their energy mix while supporting booming economic growth.Policies supporting RE electricity have been evolving (Table 5.7) in all countries except Russia.
As a general trend, BRICS have adopted FITs, auctions, grants and quantitative policies (portfolio standards, obligations and blending mandates) according to the size of the plant and/or the maturity of the technology on the national market.
133-160 Chap_5 AIE RENEWABLES.indd 150133-160 Chap_5 AIE RENEWABLES.indd 150 09/11/11 10:4509/11/11 10:45
© O
EC
D/IE
A, 2
011
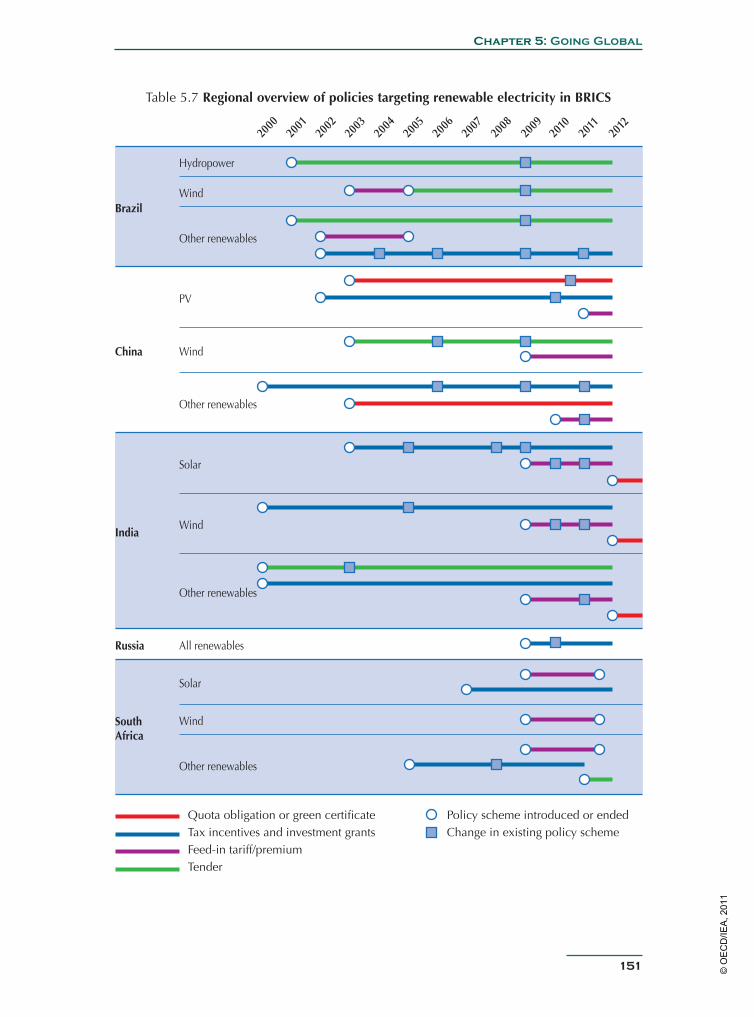
Chapter 5: Going Global
151
Table 5.7 Regional overview of policies targeting renewable electricity in BRICS
2000
2001
2002
2003
2004
2005
2006
2007
2008
2009
2010
2011
2012
133-160 Chap_5 AIE RENEWABLES.indd 151133-160 Chap_5 AIE RENEWABLES.indd 151 09/11/11 10:4509/11/11 10:45
© O
EC
D/IE
A, 2
011
152
Deploying Renewables: Going Global
Brazil initiated reverse tenders with long-term power purchase agreements (PPAs) for onshore wind in 2009, following up with biomass and small hydro auctions in the electricity sector over the past two years. Small-scale plants and household appliances still benefit from cash grants and soft loan programmes in both rural and urban areas (Proinfa, Luz paraTodos). In the transport sector, Brazil has the most ambitious ethanol blending mandate and also relies on auctions to meet increasing biofuel demand.
Similarly, South Africa switched from the 2009 RE FIT, which was unsuccessful despite high guaranteed tariffs, to a procurement process based on price competition. In July 2011, the National Energy Regulator of South Africa (NERSA) issued tenders for 1 000MW of new renewable energy generation capacity. In the heat sector, solar thermal appliances benefit from cash grants and generous rebate programmes as the government is aiming for the deployment of a million solar water heaters over the next five years to prevent further increases in the number of electric water heaters, which already total 4.2 million.
China relies on tenders for new deployment sectors, such as offshore wind or large-scale installations of solar PV, while FITs are used for more mature technologies (onshore wind and biomass, and since summer 2011 for small-scale installations of solar PV). Prior to the implementation of feed-in tariffs for solar PV and biomass applications, China had enacted several financial incentives and generation targets to boost demand (Golden Sun program) either in the electricity or the heating sectors. In the transport sector, China has set up ambitious blending mandates and relies on tax incentives. China’s 12th five-year plan also gives priority to RE technology innovation and the extensive expansion of the manufacturing sector.
The Indian renewable energy policy also went through significant changes, replacing, as of March 2011, its fragmented set of feed-in tariffs and premiums with the Indian Renewable Energy Certification scheme for renewable electricity plants larger than 250 kW. This scheme establishes mandatory obligation targets for each state and allows for certificates trading. Solar PV and solar thermal projects included in the Solar Mission can generate certificates, and quantitative targets are applied for biofuels.
ASEAN-6Nearly all the ASEAN-6 countries have adopted medium- and long-term targets for renewable energy, and all the ASEAN-6 countries except for Singapore have implemented biofuels blending mandates.
Over the past five years, a majority of ASEAN-6 countries have adopted feed-in tariff and premium schemes in the electricity sector, starting with Thailand in 2007. The Thai premium was adjusted twice to cope with the combined effect of a generous and uncapped premium and a decline in PV system costs, both leading to an explosion of solar project applications with a cumulative capacity of 3.6 GW.
Similarly, the Philippines Energy Regulatory Commission issued feed-in tariff rules in 2010, although these rules still have to be turned into an effective tariff scheme. In 2011, Malaysia enacted a feed-in tariff package, including both generation targets to 2030 and annual installation caps per technology. Such a precaution may avoid the overheating of renewable energy markets, as previously mentioned for solar PV in Thailand. Also in 2011, the Indonesian utility PT Perusahaan Listrik Negara guaranteed generators a fixed energy and
133-160 Chap_5 AIE RENEWABLES.indd 152133-160 Chap_5 AIE RENEWABLES.indd 152 09/11/11 10:4509/11/11 10:45
© O
EC
D/IE
A, 2
011

Chapter 5: Going Global
153
mandatory purchase tariff for the electricity generated from geothermal sources. In all four countries, pricing policies go along with priority grid access for electricity from renewable sources.
In general, technology-specific support policies in the region tend to rely on financial and fiscal incentives rather than on pricing policies. In Indonesia, total investments in geothermal benefit from a 30% net tax deduction, plant components are exempted from income duty, and specific financial and fiscal policies support the deployment of biofuel production, domestic consumption and export. Policies targeting biofuels have been enacted in the Philippines.
Indonesia, Malaysia and Thailand have introduced non-financial support mechanisms, including standard PPAs, preferential arrangements for small generators, and information support. Thailand is the only ASEAN-6 country to have a renewable heat policy, with installation grants being provided for solar collector surfaces. To date, however, these incentives have had limited success in fostering the expansion of renewable energy markets in many ASEAN-6 countries.
MENA-7All North African MENA-7 countries and Israel have introduced financial support mechanisms for renewable electricity, although the two other Middle Eastern countries (Saudi Arabia and United Arab Emirates) have not yet done so. In practice, however, the financial incentives have not encouraged much market deployment so far. This highlights the need for an overall reform of the energy sector, which is currently not well adapted to the needs of independent power producers (IPPs), is unattractive to private investors, and is constrained by ill-adapted institutions and infrastructures.
In the MENA region, and more especially in North Africa, renewable energy deployment has been happening in the context of large-scale programmes, such as the Mediterranean Solar Plan (MSP), the DESERTEC Industrial Initiative (DII) and Tunisian Solar Plan, rather than as a consequence of national regulations. Large-scale projects in Egypt (onshore wind), Morocco (solar PV) and Israel (CSP) have benefited from international donor institutions in the form of loans and grants programmes.
Egypt, which has the largest new RE installed capacity, relies on a tendering process for large-scale onshore wind projects. A FIT system for small- and medium-scale wind plants may be included in the future electricity law. Although Saudi Arabia has no dedicated renewable energy policies so far, the Electricity and Cogeneration Authority (ECRA) appears to be keen to finalise a regulatory framework for renewable electricity by 2011 with FIT levels likely to be based on a tender (Shamseddine, 2010).
Israel and Algeria have enacted feed-in tariff or premium systems for both electricity and heat from renewable sources, but such price incentives have been either too low (Israel) or not yet enacted (Algeria) to spur the deployment of targeted technologies.
Morocco, Israel and Tunisia have relied on VAT and income duty reductions both for solar PV electricity and solar thermal heat appliances. These incentives, by themselves, have not fostered RES-E market growth; although they facilitate the import of foreign RET equipment and components. In Tunisia, the PROSOL actively involves all the sector stakeholders,
133-160 Chap_5 AIE RENEWABLES.indd 153133-160 Chap_5 AIE RENEWABLES.indd 153 09/11/11 10:4509/11/11 10:45
© O
EC
D/IE
A, 2
011

154
Deploying Renewables: Going Global
particularly the finance sector, and the Solar Plan, based on private-public partnerships, appears as an innovative policy strategy and will enhance cooperation between both sectors. The UAE focus is on RD&D, but the establishment of Abu Dhabi as a global R&D and manufacturing hub for RE technologies is still at the demonstration phase, and a strong policy framework is not yet in place.
Latin AmericaBoth Argentina and Chile have announced renewable energy generation targets, including 8% of total energy consumption by the end of 2016 for Argentina, and target which has been a revised downward to 8% of electricity consumption from RES by 2020 for Chile. Blending mandates for biofuels are mandatory in Argentina and voluntary in Chile.
Although both countries have enacted laws to manage renewable energy deployment, including the 2006 Law on the Promotion of Power Generation from Renewable Energy Sources in Argentina and the Short Laws I and II in Chile, both countries have yet to develop a comprehensive policy framework.
In Argentina, the renewable support framework combines a FIT for wind, solar PV, geothermal energy, tidal energy, biomass, biogas and small-scale hydropower with ratings up to 30 MW, and a competitive tender process led by the public utility ENARSA, as initiated in the 2010 GENREN programme. The June 2010 competitive bidding tender, however, is an isolated effort to foster renewables growth without the backing of a comprehensive renewable energy policy framework or a clear strategic direction for Argentina’s overall energy policy. Although Argentina does not have a specific renewable heat policy, Buenos Aires enacted a solar thermal obligation of use in public buildings and private houses without access to the natural gas network.
In the context of electricity demand projected to grow at 5.4 % per year on average to 2030, Chile established Latin America’s first renewable energy portfolio standard for utilities (above 200 MW installed capacity), which requires them to obtain 5% of their electricity supply from new renewable energy technologies by 2010, with the target increasing to 10% by 2024. Although such targets are legally binding, with a penalty in case of non-compliance, it remains to be seen how effective they will prove. Chile also started auctioning generation capacity, announcing an international tender for a solar PV and CSP plant in 2009 and a future tender for 70 geothermal exploration concessions through 2011.
In the heating sector, the Chilean strategy aims to first create a strong certification system and quality standard, both for solar thermal appliances and for wood supply, in parallel with tax incentives.
Sub-Saharan AfricaIn all SSA-6 states, except for Botswana, specific support policies have been dedicated to renewable energy deployment over the past ten years. Only Kenya has adopted a feed-in tariff for electricity generation, adjusted in 2010, but Ghana and Botswana are expected to implement similar pricing policies in 2011 and 2012, respectively. Kenya is a frontrunner with regards to renewable energy policies, allowing experts to better understand how a feed-in-tariff can meet the specific needs of energy producers and consumers in the particular context of Sub-Saharan Africa. Although none of the SSA-6 focus states has enacted
133-160 Chap_5 AIE RENEWABLES.indd 154133-160 Chap_5 AIE RENEWABLES.indd 154 09/11/11 10:4509/11/11 10:45
© O
EC
D/IE
A, 2
011

Chapter 5: Going Global
155
renewable heat policies, Nigeria and Kenya have implemented a mandatory blending mandate, still unmet, and Senegal is providing tax incentives to biofuel producers.
Moreover, in Senegal, Nigeria, Tanzania and Ghana, renewable energy incentives have been included in general energy laws, in electricity acts, or in electrification and energy access strategies. In Tanzania, the premium awarded to small-scale renewable electricity producers in the Standardize Small Power Purchase tariff was enforced and will be annually reviewed under the 2010 Electricity Rules.
In all SSA-6 focus states, rural electrification programmes (REP) seek to expand existing grids in peri-urban and rural areas that are not remote and to kick-start renewable energy in mini- or off-grid systems elsewhere. In Senegal, the program for the Promotion of Renewable Energies, Rural Electrification and the Promotion of Sustainable Supply in domestic fuel (PERACOD) seeks to expand the electrification rate from 16% in 2007 to 50% by 2012 and 60% by 2022. The programme also provides independent power producers (IPPs) and end-users with installation subsidies for isolated solar PV systems and supports the deployment of solar lighting in remote villages
Regional initiatives and institutions are also a major tool for renewable energy deployment and energy access in the continent, with four main electricity pools redesigning grid extension and infrastructure deployment patterns. Regional institutions also deal with resource-specific sectors, with the Nile Basin Initiative (NBI) targeting sustainable generation, distribution and consumption of hydroelectricity among riparian states of the Nile.
Accelerating deployment in a broader range of countriesChapter 2 highlights the geographic concentration of RE deployment, and suggests that policy measures need to accelerate deployment in a broader range of countries if the market is to continue to grow in line with ambitious goals such as those in the WEO 450 Scenario.
Chapter 2 also demonstrates that the emphasis that governments currently put on renewables correlates with their level of import dependency. The analysis also shows how interest in renewables depends on prosperity as measured by GDP per person. This GDP dimension mainly influences technology choice, with wealthier countries taking a leadership role and engaging with the more costly technologies such as solar PV and offshore wind, whereas less prosperous nations are more engaged with better-established and lower-cost options such as hydro power or biomass. With technologies moving down their learning curve and costs reducing, and more countries reaching higher levels of GDP, more technologies become affordable.
Now that RE technologies are well established, technically proven and increasingly cost competitive, their exploitation no longer needs to be confined to the richer countries that also have energy security concerns. These countries can continue to develop their markets, using the policy experience discussed above to increase deployment as cost-effectively as possible, while also acting to bring forward the next wave of technologies still at the R&D or deployment inception phase. The time is now right for countries in other quadrants of the energy security/GDP matrix to exploit the broader range of technologies (Figure 5.4).
133-160 Chap_5 AIE RENEWABLES.indd 155133-160 Chap_5 AIE RENEWABLES.indd 155 09/11/11 10:4509/11/11 10:45
© O
EC
D/IE
A, 2
011
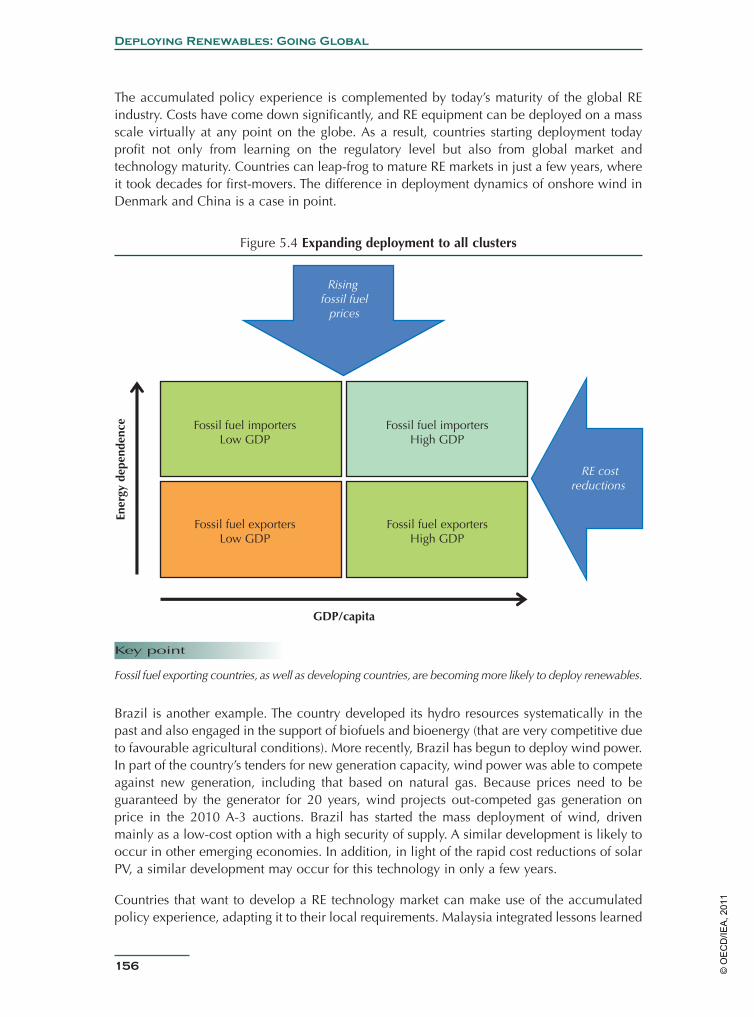
156
Deploying Renewables: Going Global
The accumulated policy experience is complemented by today’s maturity of the global RE industry. Costs have come down significantly, and RE equipment can be deployed on a mass scale virtually at any point on the globe. As a result, countries starting deployment today profit not only from learning on the regulatory level but also from global market and technology maturity. Countries can leap-frog to mature RE markets in just a few years, where it took decades for first-movers. The difference in deployment dynamics of onshore wind in Denmark and China is a case in point.
Figure 5.4 Expanding deployment to all clusters
GDP/capita
Ener
gy d
epen
denc
e
Rising fossil fuel
prices
RE costreductions
Fossil fuel importersLow GDP
Fossil fuel importersHigh GDP
Fossil fuel exportersLow GDP
Fossil fuel exportersHigh GDP
Key point
Fossil fuel exporting countries, as well as developing countries, are becoming more likely to deploy renewables.
Brazil is another example. The country developed its hydro resources systematically in the past and also engaged in the support of biofuels and bioenergy (that are very competitive due to favourable agricultural conditions). More recently, Brazil has begun to deploy wind power. In part of the country’s tenders for new generation capacity, wind power was able to compete against new generation, including that based on natural gas. Because prices need to be guaranteed by the generator for 20 years, wind projects out-competed gas generation on price in the 2010 A-3 auctions. Brazil has started the mass deployment of wind, driven mainly as a low-cost option with a high security of supply. A similar development is likely to occur in other emerging economies. In addition, in light of the rapid cost reductions of solar PV, a similar development may occur for this technology in only a few years.
Countries that want to develop a RE technology market can make use of the accumulated policy experience, adapting it to their local requirements. Malaysia integrated lessons learned
133-160 Chap_5 AIE RENEWABLES.indd 156133-160 Chap_5 AIE RENEWABLES.indd 156 09/11/11 10:4509/11/11 10:45
© O
EC
D/IE
A, 2
011
Chapter 5: Going Global
157
when designing its 2011 FIT law. The new regulation includes a dynamic capacity cap, which is increased if per-unit support costs are lower than expected. This measure puts a cap on total costs, while ensuring maximum capacity additions. Support is refinanced via a fixed 1% levy on electricity prices. Customers consuming less than 200 kWh per month, i.e. poorer households, are exempt from the levy. These innovations will prevent total support costs going out of control, as was earlier the case in a number of countries.
On a broader scale, the following conclusions can be drawn for the different country clusters:
• Low GDP importers have thus far concentrated on low-cost options such as biomass, geothermal and hydro. As wind has moved into the range of competitiveness in good resource sites, this option has become viable as well. Because RE technologies tend to be more capital intensive, however, low GDP regions, especially least-developed countries, need external support in raising the required amount of capital. If capital is given under concessional conditions, the RE options may be the least-cost option from the perspective of deploying countries. With RE technologies moving down their learning curve, waves of deployment may be observed, with new markets entering the stage. Solar PV, for example, could become a least-cost RET option in the Chinese and Indian markets.
• High GDP exporters have a comparably low incentive to deploy RE technologies from an energy security point of view. However, they have a sufficient capital base to build an industry sector around RE technologies. This factor is partially reflected in the ambition that oil exporters, such as the United Arab Emirates, are developing towards RE technologies. In any case, inefficient fossil fuel consumption subsidies need to be phased out immediately in these countries, while ensuring energy access to the poor part of the population.
• Low GDP exporters lack a strong driver to deploy RE technologies and also do not have the resources for more capital-intensive energy options. Linking fossil fuel exports to deployment of RE technologies may be an option for these countries in the medium term. Although international agreements (such as World Trade Organisation regulations) need to be respected, export contracts could be linked directly to the mass deployment of RE technologies in the exporting countries. In addition, a reform of subsidy schemes is necessary. Regulation should aim at ensuring energy access for the poor, while disincentivising wasteful consumption.
• Developed economies need to push radical efficiency gains in the existing system: if the entire world consumed energy as the majority of these countries do, consumption levels would be highly unsustainable. Industrialised countries have a special obligation in this respect, because the accumulation of capital in these countries was driven by fossil fuels.
• Developing economies are currently witnessing a rapid expansion of their energy sector. This is an opportunity to develop on a sustainable path. These countries will, however, stress energy affordability more than other aspects when making technology choices. Strong international cooperation and support (e.g. carbon finance instruments) will be critical to enabling investments in RE technologies in this group of countries.
The associated IEA Information Paper entitled Renewable Energy: Policy Considerations for Deploying Renewables includes a topical highlight on the particular issues associated with the acceleration of RE technologies in developing countries. Some of the ideas are summarised in Box 5.1.
133-160 Chap_5 AIE RENEWABLES.indd 157133-160 Chap_5 AIE RENEWABLES.indd 157 09/11/11 10:4509/11/11 10:45
© O
EC
D/IE
A, 2
011
158
Deploying Renewables: Going Global
Box 5.1 RE technologies in developing economies
RE technologies in developing countries have lower CO2 reduction costs than in developed countries due to the cost-competitiveness of RE technologies in decentralised energy applications. Furthermore, RE technologies in developing countries have the potential for a wide range of additional social, economic and environmental benefits, most importantly helping to extend affordable, reliable and clean energy access to the 1.5 billion people in rural areas of the developing world without grid access. Well-designed support programmes must be developed, therefore, to tackle the current barriers and challenges.
A necessary first step is to cut fossil fuel subsidies where they exist so as not to distort the market to the disadvantage of the renewable energies, while respecting the social dimension of energy pricing. Non-economic barriers also need to be addressed, e.g. by mitigating non-economic risks and using technical assistance to create enabling conditions for deployment, attract a significant amount of private financing and allow sustainable development in the regions. A very promising approach is to exploit the cost-competitiveness of renewables for off- and mini-grid applications by pushing forward programmes that provide structures for financing of small-scale off-grid projects. Another very important, but still underdeveloped, approach to accelerating diffusion of RE technologies is technology information-sharing. Funds need to be created for technology transfer, and appropriate incentives need to be designed for technology developers.
Role of international co-operationBeyond the engagement of individual countries, international co-operation will become more and more critical for successful deployment. Co-operation is needed to share the cost of bringing technologies to competitiveness, share policy experience, and facilitate the global expansion of deployment.
Sharing costs
As the preceding analysis has shown, current deployment of renewables has been growing rapidly. The growth so far, however, has mostly relied on extensive deployment in a small number of leading countries. In particular, a few countries have led the way in developing and deploying expensive technologies (such as PV). As the capacity has grown as a result of those efforts, costs have come down. This cost reduction has enabled other countries and regions to start deploying the technologies, to the point where some of the technologies can now compete without special support in markets. This progress then opens up even wider deployment opportunities in countries with good resources.
For technologies in the market inception and take-off phases, the concentration of RE technology development in a small number of countries can be damaging and is one of the factors leading to “price spikes and bubbles”. Sharing the early deployment stages among more countries would allow for more rapid progress along the development journey and less
133-160 Chap_5 AIE RENEWABLES.indd 158133-160 Chap_5 AIE RENEWABLES.indd 158 09/11/11 10:4509/11/11 10:45
© O
EC
D/IE
A, 2
011

Chapter 5: Going Global
159
erratic market development. Countries could also make progress in organising their market conditions by putting regulatory frameworks in place earlier, thereby shortening the time before the technologies enter the take-off and consolidation phases.
Countries already cooperate with each other during the RD&D phases, for example, through the IEA Implementing Agreements, but cooperative approaches to deployment are more difficult to organise. One possibility could be that countries with particular interests in specific key technologies could agree to align their deployment objectives, for example through the Clean Energy Ministerial process. If this approach were applied to some of the key technologies in the market inception and demonstration phases (such as enhanced geothermal, offshore wind, concentrating solar power, advanced biofuels and PV), it could help avoid some of the problems experienced, for example, with PV.
Similarly, a focused cooperative approach could be adopted to accelerate progress with some of the more developed technologies, such as bioenergy and geothermal, where deployment progress is slower than the rate required to be on track to meet the WEO 450 scenario targets.
Sharing experienceMuch is to be learned from international experience, both through best practice and also through recognizing problems encountered in one or more markets (e.g. the “PV bubbles”), and avoiding repeating them through better and earlier information sharing. The IEA is able to play a role here in monitoring policy developments and developing indicators and criteria that should allow countries to benchmark their policies. Going forward, more detailed case study analysis will be conducted of the policy portfolios in place in countries where policies have a high impact on deployment and at low cost.
Facilitating global deployment expansionAs argued above, RE technologies are no longer of interest only to richer countries able to afford the development and deployment costs of expensive technologies. RE technologies are increasingly competitive sources of energy in countries where the resource is good. This trend includes many emerging and developing economies. RE technologies can play a key role in helping these economies meet their expanding energy needs, reduce exposure to volatile and rising world energy prices, and at the same time reduce the carbon footprint of their expanding energy sector. If RE technologies do not play such a role, these countries risk being committed to a high-carbon energy supply in the same way as developed countries, and the inertia will make it hard to introduce the technologies later.
The market leaders have provided a legacy of well-developed and increasingly cost-competitive technologies, along with a body of policy experience that should aid the introduction of RE technologies into these new markets and allow them to proceed smoothly and rapidly along their deployment journey, particularly where resource conditions are often much more favourable and the prices of the conventional equivalents higher.
International cooperation has a key role to play in effecting such an expansion. The first role is in capacity building, i.e. to provide direct assistance and help in developing the skills needed to assess the best RE opportunities. Assistance is also needed to put in place appropriate policy frameworks, based on the best practice principles outlined above.
133-160 Chap_5 AIE RENEWABLES.indd 159133-160 Chap_5 AIE RENEWABLES.indd 159 09/11/11 10:4509/11/11 10:45
© O
EC
D/IE
A, 2
011

160
Deploying Renewables: Going Global
Establishing this policy framework should attract international interest in developing the market, and that interest, in turn, can stimulate the establishment of key parts of a local supply chain.
A further major role for international cooperation and support is associated with gaining access to the finance required to fund the capacity and infrastructure needs. Multi-lateral and development banks play an important part here.
133-160 Chap_5 AIE RENEWABLES.indd 160133-160 Chap_5 AIE RENEWABLES.indd 160 09/11/11 10:4509/11/11 10:45
© O
EC
D/IE
A, 2
011
Chapter 6: Conclusions and Recommendations
161
Market developments
RE deployment has been expanding rapidly, convincing evidence that this suite of low-carbon energy technologies can deliver the intended policy benefits of improved energy security, greenhouse gas reductions and other environmental benefits, and economic development opportunities. Each of the sectors has been growing strongly, at rates broadly in line with those required to meet the levels required in IEA projections for a sustainable energy future, such as the WEO 2010 450 Scenario. These scenarios also depend on increases in energy efficiency and the deployment of other low–carbon energy options.
RE competitiveness and economic support
RE technologies may not generally be cost-competitive under current pricing mechanisms, and so may be inhibited by economic barriers. The market expansion of RE technologies, however, has been accompanied by cost reductions in critical technologies such as wind and solar PV, and such trends are set to continue. The portfolio of RE technologies, which includes the established hydro power, geothermal and bioenergy technologies is now, therefore, cost-competitive in an increasingly broad range of circumstances, providing investment opportunities without the need for specific economic support. For example, wind projects have successfully competed with other generation projects (including gas) for long-term power purchase contracts in Brazil without special support measures, and solar water heating has expanded rapidly in China due to its favourable economics. Taking the portfolio as a whole, RE technologies should no longer be considered only as high–cost, immature options, but potentially as a valuable component of any secure and sustainable energy economy, providing energy at a low cost with high price stability.
Where technologies are not yet competitive, economic support for a limited amount of time may be justified by the need to attach a price signal to the environmental and energy security benefits of RE deployment, when these are not reflected by current pricing mechanisms. Support is also justified to allow the newer RE technologies to progress down the learning curve and so provide benefits at lower cost and in larger scale in the near future.
But even where RE technologies could be competitive, deployment can be delayed or prevented by barriers related to e.g. regulatory and policy uncertainty, institutional and administrative arrangements or infrastructure designed with fossil fuels in mind and that may be unsuited to more distributed energy supply or the high up-front capital demand of RE technologies. Sustainability and social acceptance can also be critical issues for some technologies. In particular, regulatory and policy uncertainty may play a very significant role, even when economic barriers are removed, as shown by the analysis of the performance of financial support mechanisms in the next section.
Chapter 6Conclusions and Recommendations
161-184 Chap 6 et annexe AIE RENEWABLES.indd 161161-184 Chap 6 et annexe AIE RENEWABLES.indd 161 09/11/11 10:4609/11/11 10:46
© O
EC
D/IE
A, 2
011

162
Deploying Renewables: Conclusions and Recommendations
Policy indicatorsThe quantitative analysis of economic support policies has shown that both FITs and TGC schemes can have a significant impact on deployment levels, and be cost effective, or not. This analysis highlights the importance of other factors, e.g. the overall level of investor confidence engendered by the whole policy portfolio and the extent of non-economic barriers. For FITs the impact of these barriers deters deployment altogether. For TGC’s the impact pushes up support costs.
For wind, the indicators show that for the period 2001-09, feed-in tariffs were significantly more effective in stimulating deployment than TGCs and other schemes. In 2008–09, however, this difference largely disappeared. This change may be due to policy-learning effects as well as increasing technical and market maturity. The remuneration adequacy indicator shows that countries with TGC schemes tend to pay more than those using FITs.
This analysis also shows the increase in the number of countries which are now making serious efforts to deploy wind, compared to earlier years and to the number of countries engaging in PV deployment.
A similar analysis for solar PV shows that nearly all countries with growing markets have used FITs. The impact of the policies in countries actively promoting solar PV has been higher than for wind, with several countries experiencing very rapid growth, which in some cases (particularly the Czech Republic and Spain) has led to very high overall policy costs. The deployment was stimulated by the very high and secure rates of return available to investors with tariffs remaining high at a time when system prices were falling rapidly. PV expansion grew dramatically in 2010 in the Czech Republic, the year for which the total cost indicator was calculated, leading to a very large volume of annual premiums, corresponding to almost 18% of the total wholesale value of the entire Czech system. High total costs are also an issue in other markets, such as Spain, where a boom took place in 2008 (which is not reflected in the 2010 additional premiums). In Germany and Italy, the high rates of deployment have also caused comparably high total support costs.
Policy principles and prioritiesThe main challenges to deployment change as progress is made along the deployment curve. The three phases of deployment are:
• an inception phase, when the first examples of technology are deployed under commercial terms;
• a take-off phase, when the market starts to grow rapidly; and
• a market consolidation phase, where deployment grows toward the maximum practicable level.
The impact of support policies depends on the adherence to key policy principles. This publication has reviewed the best practice policy principles described in the Deploying Renewables 2008 publication. Best practice can now be summarised in terms of a number of overarching principles that apply throughout the deployment journey, as well as some that are specific to particular deployment phases (Table 6.1).
161-184 Chap 6 et annexe AIE RENEWABLES.indd 162161-184 Chap 6 et annexe AIE RENEWABLES.indd 162 09/11/11 10:4609/11/11 10:46
© O
EC
D/IE
A, 2
011

Chapter 6: Conclusions and Recommendations
163
The differences in deployment success on the national level reflect the extent to which these principles have been applied. Onshore wind developments, for example, demonstrate that those countries that have managed to induce a dynamic and stable market (Denmark, Germany, Spain, and, more recently, China and India) have adhered to the best practice policy principles (Müller, Marmion, Beerepoot). Countries lacking a comprehensive and stable policy framework for RE deployment on the other hand, have seen boom-and-bust cycles in deployment and, accordingly, a less well-developed market, particularly in terms of the supply chain.
Table 6.1 Best practice policy principles
Overarching principles
• Provide a predictable and transparent RE policy framework, integrating RE policy into an overall energy strategy, taking a portfolio approach by focusing on technologies that will best meet policy needs in the short and long term, and backing the policy package with ambitious and credible targets.
• Take a dynamic approach to policy implementation, differentiating according to the current maturity of each individual RE technology (rather than using a technology-neutral approach) while closely monitoring national and global market trends and adjusting policies accordingly.
• Tackle non-economic barriers comprehensively, streamlining processes and procedures as far as possible.
• At an early stage, identify and address overall system integration issues (such as infrastructure and market design) that may become constraints as deployment levels rise.
Inception Take-off Consolidation
Develop a clear roadmap, including targets that generate confi dence.
Provide a suitable mixture of support, which may include both capital and revenue support.
Ensure that the necessary regulatory framework is in place and streamlined.
Provide support for the continuing industry-led R&D work.
Ensure a predictable support environment, backed by credible and ambitious targets.
Ensure that adaptability to market and technology developments is built in as a key characteristic of the policy package.
Provide appropriate incentives to ensure continued growth in deployment, managing them dynamically to control total policy costs, and to encourage improved cost competitiveness.
Focus on non-economic barriers and implementation details.
Deal with integration issues (such as the biofuels blending wall or system integration of variable renewable power), and focus on enabling technologies.
Ensure that energy market design is commensurate with high levels of RE penetration and economic support can be progressively phased out.
Maintain public acceptance as deployment levels grow and projects have higher visibility and impact.
161-184 Chap 6 et annexe AIE RENEWABLES.indd 163161-184 Chap 6 et annexe AIE RENEWABLES.indd 163 09/11/11 10:4609/11/11 10:46
© O
EC
D/IE
A, 2
011
164
Deploying Renewables: Conclusions and Recommendations
InceptionAt this stage, the market is still immature, the technologies are not well established, and the local supply chain is not in place. The financing institutions may perceive investment as risky. The priority for policy making is to create a secure investment environment that catalyses an initial round of investment, and to put in place the necessary legislative framework.
The main challenge is to develop a clear roadmap, including targets that generate confidence that the respective market is bound to grow sustainably and at a considerable volume. This requires providing a suitable mixture of support, which may include both capital and revenue costs. In addition, a streamlined regulatory framework must be in place. This will also stimulate industry-led R&D work in countries with the capacity and appetite to give priority to R&D.
Regarding the choice of incentive scheme, FITs provide the highest amount of certainty, and these systems have been very successful at this stage of deployment, given that a grid is present (which is true in the electricity and transport sectors). Initial price finding may be difficult, even with a good knowledge of international trends. This challenge could be overcome through tendering of a pilot phase (for example, a large-scale demonstration). TGCs may not work that well during inception unless the targets, penalties and implementation details are well designed. In the absence of banding, novel technologies will not be deployed. The financial rewards are seen as less certain, and this may lead to investors demanding a risk premium, so pushing up overall policy costs.
For large-scale technologies with high technological risks (offshore wind, advanced biofuels, large scale enhanced geothermal), tenders may be a useful solution, because they include a price-finding mechanism, and the high transaction costs are less significant compared to overall project costs. Loan guarantees can be an additional way of reducing risks in these circumstances.
Tax incentives are subject to frequent review therefore, because they are directly linked to public budget. This characteristic could lead to problems for developers if projects experience delays, a common phenomenon at this stage. Taking these issues together, the instrument is not best suited for the introduction of novel technologies.
Direct investment subsidies can provide an additional market boost by reducing up-front cost exposure. They are also applicable, where FITs are not applicable, for example, in the heat sector.
Take-offBy this stage, the deployment of the particular technology is underway within the national market, the supply chain is in place even if not fully developed, and financing institutions have increased knowledge of the technology. The priority for policy makers is to maintain or accelerate market growth, while managing overall policy costs.
Growth is ensured by establishing a predictable support environment, backed by credible and ambitious targets. At the same time, adaptability to market and technology developments must be built in as a key characteristic of the policy package. This adaptability includes providing appropriate incentives to ensure continued growth in deployment, while managing
161-184 Chap 6 et annexe AIE RENEWABLES.indd 164161-184 Chap 6 et annexe AIE RENEWABLES.indd 164 09/11/11 10:4609/11/11 10:46
© O
EC
D/IE
A, 2
011
Chapter 6: Conclusions and Recommendations
165
incentives to control total policy costs and encourage improved cost competitiveness of RE technologies. Mitigating and removing non-economic barriers has to be a priority.
In the electricity sector, past experience has shown that FIT schemes can lead to high deployment volumes at comparably low costs. In this phase, however, policy making needs to reap the benefits of learning and increased market maturity by scheduling and implementing ambitious tariff degression schedules aimed, first, at convergence with international benchmarks, and then further cost reductions as global costs decrease. These reductions materialise only when policy makers put sufficient pressure on industry to deliver.
For very modular technologies with rapid cost reduction potential (particularly solar PV), FITs can be challenging from a policy-making perspective, because overheating in the take-off phase can lead to very high total policy costs. Policy makers must, therefore, monitor market developments closely and incorporate a mechanism of deployment volume control into FIT systems.
At this stage, setting a quota may be applicable in the electricity, heat and transport sectors. For the electricity sector, analysis has shown that TGC systems can lead to high deployment volumes in the take-off phase. These systems, however, are often associated with higher overall costs as compared to (well-designed) FITs. The data used in the current analysis may be too limited to draw a final conclusion, but the analysis suggests that TGCs may be the option of choice only where the government has a strong policy preference for market-based mechanisms.
Tenders can also be used in this phase to meet a certain quota. They are increasingly becoming the option of choice for the take-off phase of mature technologies, especially in emerging economies. Given that a sufficiently mature supply chain is present that supports the up-front risk of tendering schemes, tenders provide volume control while determining prices under competition. Experience in South American countries illustrates that tenders can also be a very effective instrument at this stage of market development.
In the heat sector, successful take-off policies have also used a type of mandate. For example, in 2000, Barcelona introduced a solar obligation, and its success resulted in the Spanish government developing a national solar obligation policy in 2006. Other regulatory approaches consist of requiring a share of a building’s heating demand to be generated by renewable energy, such as in the London “Merton rule” and the 2009 German building regulations.
In the transport sector, market take-off has been successfully stimulated using blending mandates. The success of a mandate depends on the prior establishment of a supply chain that will be able to meet the mandate (see inception phase). Mandates can be combined with tax breaks to limit the financial impact on consumers.
Consolidation
By this stage, the technologies are well established, the market has grown substantially, supply chains are robust, and financing and public institutions have streamlined their procedures. The technologies are close to or fully cost-competitive.
161-184 Chap 6 et annexe AIE RENEWABLES.indd 165161-184 Chap 6 et annexe AIE RENEWABLES.indd 165 09/11/11 10:4609/11/11 10:46
© O
EC
D/IE
A, 2
011
166
Deploying Renewables: Conclusions and Recommendations
The challenges in this phase relate to the integration of larger volumes into the system. This involves some technical integration issues, such as the system integration of variable renewables. Also market impacts, particularly the impact of increasing levels of renewables deployment on existing market players, and on non-economic factors such as maintaining public acceptance as the scale and impact of deployment grows need to be addressed with priority.
The recent IEA publication Harnessing Variable Renewables study shows that the limits to integrating variable RE supplies depend on the characteristics of particular systems. From a technical perspective, the limits can be much less restrictive than is often thought, if a whole system approach is adopted, taking into account the flexibility of other generation technologies, the potential for load management, and grid interconnectivity as well as storage capacity. Such an approach will, however, require reforms of operating systems and regulatory reform, as well as significant investment in the necessary infrastructure (IEA 2011b).
In the consolidation phase, some continued economic support for RE technologies may be required, but policies may also need to introduce elements of competition between the RE technologies and conventional generation to incentivise further cost reductions and to optimise the overall generation costs. In practice, this policy shift can be achieved by modifying a number of the economic support mechanisms or creating hybrid systems for example, by providing a uniform FIT for a number of technologies and moving to a premium rather than a fixed price, as Spain has done at a comparably early phase for wind. Consolidation can also be addressed by reviewing banding and moving to a technology-neutral system within a TGC once the costs of particular technologies converge, or by arranging multi-technology tenders (as in Brazil).
The fundamental market design problem is not addressed, however, by just choosing a more market-based instrument for RE support in the consolidation phase of the power sector. Because most RE power technologies have very low marginal costs (with the exception of bioenergy), RE generators will almost always be able to sell their electricity on marginally priced wholesale energy markets. This trend pushes more costly generation out of the market, reducing the capacity factor of these plants. This reduction can lead to a situation where investment is inhibited and, in the long term, insufficient amount of flexible dispatchable capacity is available to balance RE generation.
Such problems are likely to make a fundamental redesign of power markets necessary. The design must provide stable and long-term signals that appropriately reward low-carbon generation. It must offer economic incentives for the flexible generation capacity and operation that is required for example, to gas generators, hydro plant operators or electricity storage. New policies must reward the energy security benefits that renewables offer by decoupling costs from rising and erratic fossil fuel prices, and so insulating consumers from these varying costs that generators usually pass on to them. Market design also needs to provide a higher degree of market harmonisation across systems allowing for competition.
Such market redesign will be an essential step if renewable sources are to meet their potential. This is now the major challenge faced by policy makers in markets where RE technologies are playing or will play a major role, and needs to be the subject of much further thinking and analysis. This will be an important topic in the next stages of IEA research.
161-184 Chap 6 et annexe AIE RENEWABLES.indd 166161-184 Chap 6 et annexe AIE RENEWABLES.indd 166 09/11/11 10:4609/11/11 10:46
© O
EC
D/IE
A, 2
011

Chapter 6: Conclusions and Recommendations
167
In the transport sector, consolidation challenges have emerged involving the “blending wall”. The United States has found it difficult to move to a E15 blend. In Germany consumers are resisting the move to an E10 rather than E5 blend, due to potential compatibility problems with conventional vehicles and a lack of comprehensive consumer information. These issues are being tackled successfully particularly via the introduction of fuel-flexible vehicles, for example in Brazil and Sweden.
Key challengesAlthough deployment has been growing rapidly, and good progress has been made in reducing costs, the challenges of keeping growth rates on track should not be underestimated. Current growth has been concentrated in certain technologies, particularly hydro power, wind and biofuels. The potential of the other technologies is not being exploited as rapidly, even though they are often technically proven. The range of countries where RE technologies are growing rapidly is also still limited. Keeping on track to deliver ambitious levels of RE will require that the full range of technologies is exploited, and that the geographic base is broadened.
Specific challenges in each sector will need to be tackled if growth is to continue to accelerate. These challenges include:
Electricity
• maintaining investor confidence in market stability while managing the overall costs of policies;
• tackling the technical and policy challenges of integrating larger amounts of renewable electricity into the market;
• providing the necessary push to bring less mature technologies such as offshore wind and concentrating solar power into the market as long as these technologies demonstrate sufficient learning effects; and
• bringing emerging technologies, such as ocean energy up to the deployment inception phase.
Heat
• dealing with the specific non-economic organisational barriers to renewable heat deployment, such as split-incentive barriers and the fragmented nature of the market; and
• developing innovative policy measures that reconcile a large impact with cost-effectiveness.
Transport
• addressing concerns about the sustainability of current biofuels technologies; and
• tackling the barriers to the introduction of the advanced biofuels technologies.
161-184 Chap 6 et annexe AIE RENEWABLES.indd 167161-184 Chap 6 et annexe AIE RENEWABLES.indd 167 09/11/11 10:4609/11/11 10:46
© O
EC
D/IE
A, 2
011
168
Deploying Renewables: Conclusions and Recommendations
An additional challenge across all RE sectors is broadening the base of countries that is deploying RE technologies in an ambitious way. Up to now deployment of the newer RE technologies has been focused in countries who have been fossil fuel importers, and who have felt the need to diversify their energy resources, but who have also been able to afford to develop and deploy the technologies while the costs have been high.
Now that the RE technology portfolio is more mature and costs have declined, a growing number of countries with good renewable resources can profit from these technologies to meet their energy policy objectives. They should be able to use the body of policy experience to do this as quickly and cost-effectively as possible.
Progress in this direction is already underway. Compared to 2005, many more countries are taking policy measures aimed at stimulating renewable deployment, and the regional diversity is growing. No fewer than 45 of the 56 focus countries, for example, now have renewable electricity targets in place, including 20 non-OECD members, whereas in 2005, such targets were largely confined to OECD and BRICS regions. In 2011, 53 of the 56 focus countries have electricity support policies in place, compared to 35 in 2005. These new countries are only just starting on their deployment journeys, however, and will be able to make much better progress if they, too, take advantage of the technology and policy lessons now available.
RecommendationsThe IEA makes the following recommendations on priority actions for the key stakeholder groups, based on the challenges of maintaining momentum and drawing on the policy analysis and priorities identified above.
Governments already taking steps to deploy renewables should:• Recognise renewables as an increasingly competitive key component of a secure, low-
carbon and sustainable energy system, along with other low-carbon energy sources and improvements to energy efficiency.
• Sustain and accelerate the momentum of deployment in all three sectors, maintaining progress in the power sector, prioritising the development of markets for renewable heat by addressing sector-specific barriers, and developing consistent sustainability frameworks for bioenergy, in particular biofuels.
• Review policy portfolios against the best-practice principles and adjust policies where necessary.
• Closely monitor deployment trends and adjust policy measures dynamically in response to national and international developments, and give particular attention to removing non-economic barriers as a main priority.
• Address the system integration of renewables at an early stage and incentivise the deployment of enabling technologies such as grid expansion, storage and adaptation of the vehicle fleet.
161-184 Chap 6 et annexe AIE RENEWABLES.indd 168161-184 Chap 6 et annexe AIE RENEWABLES.indd 168 09/11/11 10:4609/11/11 10:46
© O
EC
D/IE
A, 2
011
Chapter 6: Conclusions and Recommendations
169
• Tackle the overall market design issues needed to ensure investment in the technology portfolio required to deliver secure and low carbon energy.
• Continue the support for targeted R&D, particularly demonstration projects necessary to enable the next generation of RE technologies to reach the deployment stage.
Governments not yet committed to large-scale RE deployment should:• Re-evaluate, in light of dramatic recent cost reductions, the opportunity of RE technologies
to provide affordable, safe and clean energy, particularly the potential of to help meet rising energy demand.
• Increase the penetration of renewables by stimulating deployment as part of a strategy to develop a sustainable low-carbon energy policy, taking advantage of the technology progress and policy experience now available.
Governments and international organisations should:• Use existing international mechanisms, such as those provided by the Clean Energy
Ministerial and G20 for concerted efforts to develop a broad range of renewable energy technologies and to cooperate to bring the next-generation technologies into and through the market inception phases.
• Cooperate to allow tracking and monitoring of rates of deployment and share policy experience to allow refinement and dissemination of best practice in policy development.
• Reap the benefits of cooperating internationally between countries that are very rich in resources and those that can provide funds to develop resources (making sure that sustainable growth is stimulated in host countries, rather than perpetuating dependency).
• Provide support for capacity building and transfer of best practice in policy development to countries starting to develop their RE resources.
• Assist in the mobilisation of the finance necessary for deploying the technologies, particularly in emerging and developing countries by giving priority to the sector in the plans of multilateral and development banks.
Next stepsThe IEA work on monitoring trends within the RE market is evolving, given the fast moving and dynamic nature of the sector, the growing regional and technological diversity, and the continuing evolution of policy hot-spots as more and more countries progress along the policy journey.
The rates of deployment of the RE technologies globally and regionally will continue to be tracked in comparison to the IEA future energy scenarios. The policy database will continue to evolve. It will continue to be available on line, but will be upgraded to include a search function, making it more user-friendly for policy makers and researchers seeking to take advantage of the growing body of policy experience. The quality of the database for non-
161-184 Chap 6 et annexe AIE RENEWABLES.indd 169161-184 Chap 6 et annexe AIE RENEWABLES.indd 169 09/11/11 10:4609/11/11 10:46
© O
EC
D/IE
A, 2
011

170
Deploying Renewables: Conclusions and Recommendations
OECD countries will be upgraded via cooperation with the International Renewable Energy Agency (IRENA).
The IEA will continue to monitor RE policy trends so as to identify important emerging trends and issues, and to provide topical commentary, observation, in-depth analysis and recommendations. This work will be coupled with further refinement of the indicators developed in this book, and their extension to the other electricity-generating technologies and to the heat and transport sectors.
Policy analysis will be enhanced through increased dialogue and feedback from industry, gained by direct industry contact. The IEA also intends to give priority to work across the Agency to consider the important market design issues that will need to be addressed to provide secure and low-carbon sustainable energy supplies globally.
In summer 2012, the IEA will launch a Medium-Term Renewables Market Report, which will track recent market and policy trends and look at shorter-term market prospects.
161-184 Chap 6 et annexe AIE RENEWABLES.indd 170161-184 Chap 6 et annexe AIE RENEWABLES.indd 170 09/11/11 10:4609/11/11 10:46
© O
EC
D/IE
A, 2
011
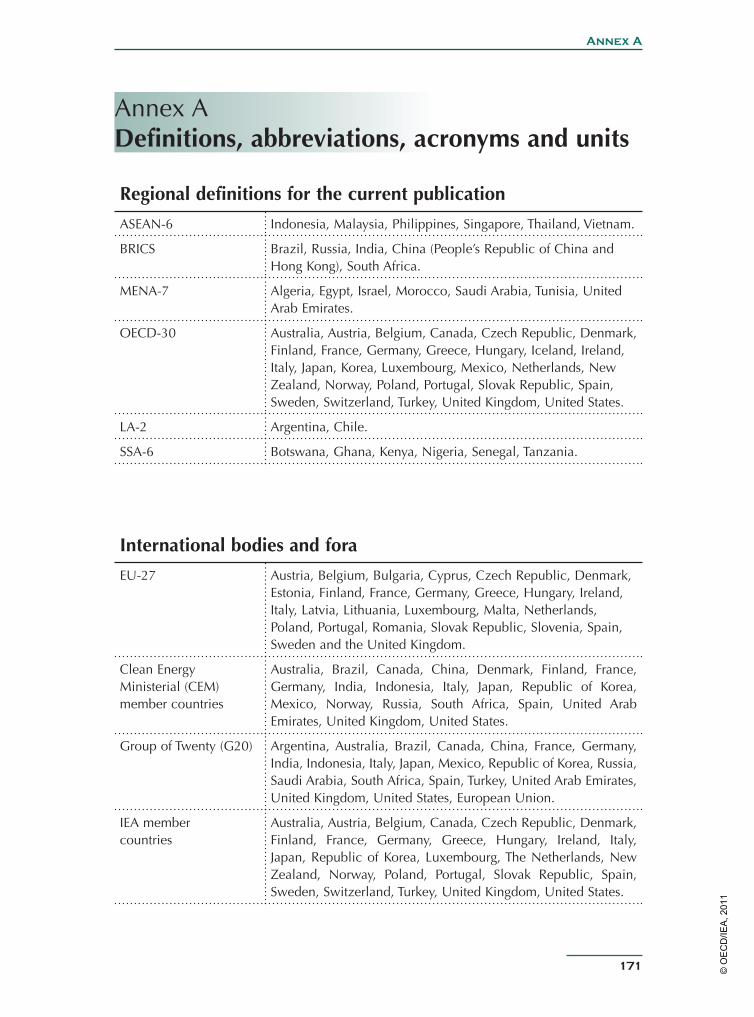
Annex A
171
Annex ADefinitions, abbreviations, acronyms and units
Regional definitions for the current publication
ASEAN-6 Indonesia, Malaysia, Philippines, Singapore, Thailand, Vietnam.
BRICS Brazil, Russia, India, China (People’s Republic of China and Hong Kong), South Africa.
MENA-7 Algeria, Egypt, Israel, Morocco, Saudi Arabia, Tunisia, United Arab Emirates.
OECD-30 Australia, Austria, Belgium, Canada, Czech Republic, Denmark, Finland, France, Germany, Greece, Hungary, Iceland, Ireland, Italy, Japan, Korea, Luxembourg, Mexico, Netherlands, New Zealand, Norway, Poland, Portugal, Slovak Republic, Spain, Sweden, Switzerland, Turkey, United Kingdom, United States.
LA-2 Argentina, Chile.
SSA-6 Botswana, Ghana, Kenya, Nigeria, Senegal, Tanzania.
International bodies and fora
EU-27 Austria, Belgium, Bulgaria, Cyprus, Czech Republic, Denmark, Estonia, Finland, France, Germany, Greece, Hungary, Ireland, Italy, Latvia, Lithuania, Luxembourg, Malta, Netherlands, Poland, Portugal, Romania, Slovak Republic, Slovenia, Spain, Sweden and the United Kingdom.
Clean Energy Ministerial (CEM) member countries
Australia, Brazil, Canada, China, Denmark, Finland, France, Germany, India, Indonesia, Italy, Japan, Republic of Korea, Mexico, Norway, Russia, South Africa, Spain, United Arab Emirates, United Kingdom, United States.
Group of Twenty (G20) Argentina, Australia, Brazil, Canada, China, France, Germany, India, Indonesia, Italy, Japan, Mexico, Republic of Korea, Russia, Saudi Arabia, South Africa, Spain, Turkey, United Arab Emirates, United Kingdom, United States, European Union.
IEA member countries
Australia, Austria, Belgium, Canada, Czech Republic, Denmark, Finland, France, Germany, Greece, Hungary, Ireland, Italy, Japan, Republic of Korea, Luxembourg, The Netherlands, New Zealand, Norway, Poland, Portugal, Slovak Republic, Spain, Sweden, Switzerland, Turkey, United Kingdom, United States.
161-184 Chap 6 et annexe AIE RENEWABLES.indd 171161-184 Chap 6 et annexe AIE RENEWABLES.indd 171 09/11/11 10:4609/11/11 10:46
© O
EC
D/IE
A, 2
011
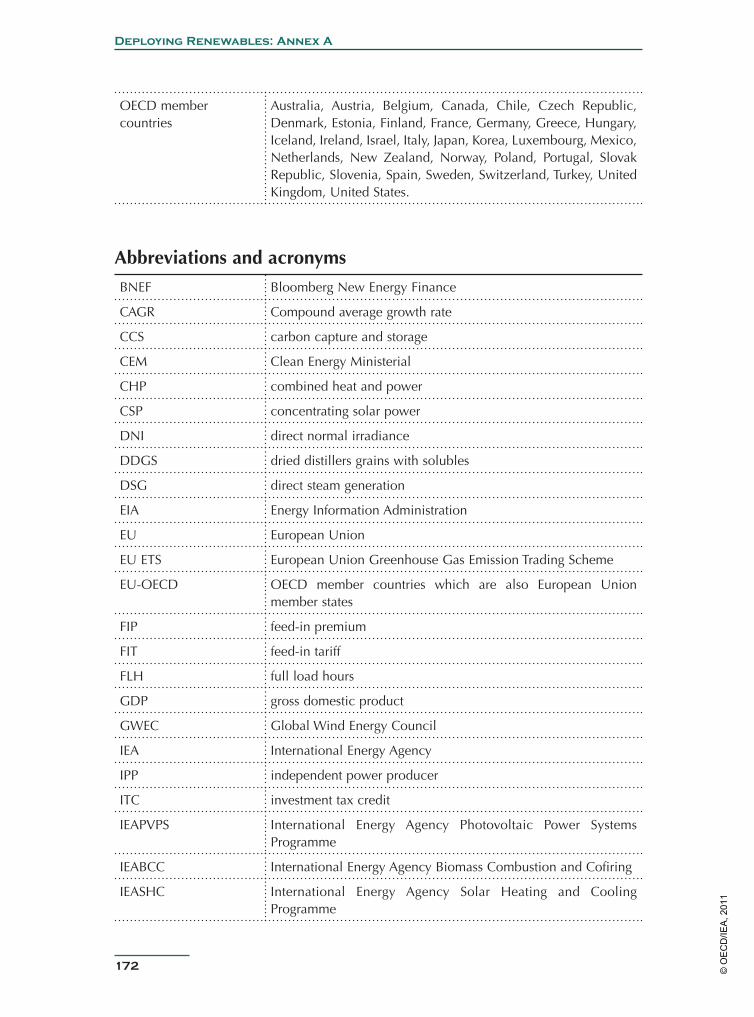
172
Deploying Renewables: Annex A
Abbreviations and acronyms
BNEF Bloomberg New Energy Finance
CAGR Compound average growth rate
CCS carbon capture and storage
CEM Clean Energy Ministerial
CHP combined heat and power
CSP concentrating solar power
DNI direct normal irradiance
DDGS dried distillers grains with solubles
DSG direct steam generation
EIA Energy Information Administration
EU European Union
EU ETS European Union Greenhouse Gas Emission Trading Scheme
EU-OECD OECD member countries which are also European Union member states
FIP feed-in premium
FIT feed-in tariff
FLH full load hours
GDP gross domestic product
GWEC Global Wind Energy Council
IEA International Energy Agency
IPP independent power producer
ITC investment tax credit
IEAPVPS International Energy Agency Photovoltaic Power Systems Programme
IEABCC International Energy Agency Biomass Combustion and Cofiring
IEASHC International Energy Agency Solar Heating and Cooling Programme
OECD member countries
Australia, Austria, Belgium, Canada, Chile, Czech Republic, Denmark, Estonia, Finland, France, Germany, Greece, Hungary, Iceland, Ireland, Israel, Italy, Japan, Korea, Luxembourg, Mexico, Netherlands, New Zealand, Norway, Poland, Portugal, Slovak Republic, Slovenia, Spain, Sweden, Switzerland, Turkey, United Kingdom, United States.
161-184 Chap 6 et annexe AIE RENEWABLES.indd 172161-184 Chap 6 et annexe AIE RENEWABLES.indd 172 09/11/11 10:4609/11/11 10:46
© O
EC
D/IE
A, 2
011
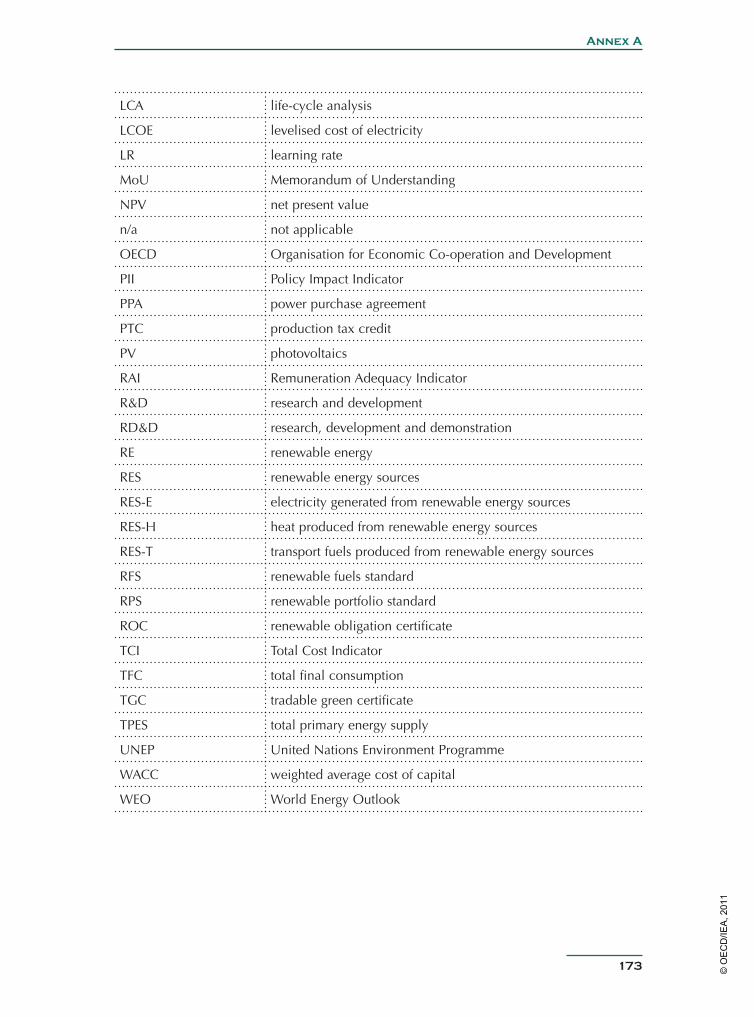
Annex A
173
LCA life-cycle analysis
LCOE levelised cost of electricity
LR learning rate
MoU Memorandum of Understanding
NPV net present value
n/a not applicable
OECD Organisation for Economic Co-operation and Development
PII Policy Impact Indicator
PPA power purchase agreement
PTC production tax credit
PV photovoltaics
RAI Remuneration Adequacy Indicator
R&D research and development
RD&D research, development and demonstration
RE renewable energy
RES renewable energy sources
RES-E electricity generated from renewable energy sources
RES-H heat produced from renewable energy sources
RES-T transport fuels produced from renewable energy sources
RFS renewable fuels standard
RPS renewable portfolio standard
ROC renewable obligation certificate
TCI Total Cost Indicator
TFC total final consumption
TGC tradable green certificate
TPES total primary energy supply
UNEP United Nations Environment Programme
WACC weighted average cost of capital
WEO World Energy Outlook
161-184 Chap 6 et annexe AIE RENEWABLES.indd 173161-184 Chap 6 et annexe AIE RENEWABLES.indd 173 09/11/11 10:4609/11/11 10:46
© O
EC
D/IE
A, 2
011

174
Deploying Renewables: Annex A
Country two-letter ISO codesAT Austria
AU Australia
BR Brazil
BU Bulgaria
CA Canada
CH Switzerland
CHI China
CL Chile
CZ Czech Republic
DE Germany
DK Denmark
FI Finland
FR France
GR Greece
HU Hungary
IC Iceland
IN India
IR Ireland
IS Israel
IT Italy
JP Japan
KO Korea
LU Luxembourg
MA Malta
MO Morocco
NL Netherland
NO Norway
NZ New Zeland
PL Poland
PO Portugal
SA South Africa
SI Singapor
SK Slovakia
SL Slovenia
SP Spain
SW Sweden
161-184 Chap 6 et annexe AIE RENEWABLES.indd 174161-184 Chap 6 et annexe AIE RENEWABLES.indd 174 09/11/11 10:4609/11/11 10:46
© O
EC
D/IE
A, 2
011

Annex A
175
TH Thailand
TU Tunisia
UG Uganda
UK United Kingdom
US United States
Country three-letter ISO codesAUS Australia
AUT Austria
BEL Belgium
BRA Brazil
CAN Canada
CHE Switzerland
CHN China (People’s Republic of, and Hong Kong)
CZE Czech Republic
DEU Germany
DNK Denmark
ESP Spain
FIN Finland
FRA France
GBR United Kingdom
GRC Greece
HUN Hungary
IND India
ISL Iceland
IRL Ireland
ITA Italy
JPN Japan
KOR Korea
LUX Luxembourg
MEX Mexico
NLD The Netherlands
NOR Norway
NZL New Zealand
POL Poland
PRT Portugal
RUS Russia
161-184 Chap 6 et annexe AIE RENEWABLES.indd 175161-184 Chap 6 et annexe AIE RENEWABLES.indd 175 09/11/11 10:4609/11/11 10:46
© O
EC
D/IE
A, 2
011

176
Deploying Renewables: Annex A
SVK Slovak Republic
SWE Sweden
TUR Turkey
USA United States
ZAF South Africa
Currency codesAUD Australian dollar
CNY Yuan renminbi
EUR Euro
INR Indian rupee
RUB new Russian ruble
USD United States dollar
ZAR South African rand
UnitsGWh gigawatt-hour, 1 kilowatt-hour equals 109 watt-hours
ha hectare
Gt Giga tonnes
J joule
kb kilobarrel
kWh kilowatt-hour, 1 kilowatt-hour equals 103 watt-hours
kWp kilowatt peak
kWth kilowatt thermal
l litre
Lge Litre gasoline equivalent
m³ cubic metre
Ml million litres
Mtoe million tonnes of oil equivalent
MWh megawatt hour, 1 megawatt-hour equals 106 watt-hours
PJ petajoule, 1 petajoule equals 1015 joules
Ppm parts per million
TJ terajoule, 1 terajoule equals 1012 joules
toe tonne of oil equivalent
TWh terawatt-hour, 1 terawatt-hour equals 1012 watt-hours
161-184 Chap 6 et annexe AIE RENEWABLES.indd 176161-184 Chap 6 et annexe AIE RENEWABLES.indd 176 09/11/11 10:4609/11/11 10:46
© O
EC
D/IE
A, 2
011

Annex B
177
Annex BReference
Awerbuch, S. and R. Sauter (2006), "Exploiting the Oil–GDP Effect to Support Renewables Deployment", Energy Policy, Vol. 34, Elsevier, Amsterdam, pp. 2805–2819.
Bazilian, M. and F. Roques (eds.) (2008), Analytical Methods for Energy Diversity and Security, Elsevier, Amsterdam.
BMU (Bundesuministerium fur Umwelt, Naturschutz und Reaktorsicherheit) (2011), "Erneuerbare Energien in Zahlen" (Renewable Energy in Numbers), www.erneuerbare-energien.de/files/pdfs/allgemein/application/pdf/broschuere_ee_zahlen_bf.pdf.
BNA (Bundesnetzagentur) (2011), "Neue PV-Zahlen und EEG-Statistikbericht 2009" (New Solar PV Numbers and Renewable Energy Law Statistics Report 2009), www.bundesnetzagentur.de/cln_1931/SharedDocs/Pressemitteilungen/DE/2011/110321PVZahlenEEGStatistikbericht2009.html?nn=65116.
BNEF (Bloomberg New Energy Finance) (2010a), "Offshore Wind Market Outlook”, Wind Insight - Research Note, BNEF, London.
BNEF (2010b), "Wind Tender Analysis in Brazil: Winner's Curse?", Research Note, BNEF, London.
BNEF (2011a), "Germany Down, Rest Up - PV Demand Update", Solar - Analyst Reaction, BNEF, London.
BNEF (2011b), "Chinese Manufacturers Dominate the 2010 PV Market", Research Note, BNEF, London.
BNEF (2011c), Wind Market Outlook Q1 2011, BNEF, London.
BNEF (2011d), "Solar Grade Polysilicon Prices", Solar Insight Service, BNEF, London.
BP (2011), Statistical Review of World Energy 2011, BP, www.bp.com/statisticalreview.
Breyer, C. and A. Gerlach (2010), "Global Overview on Grid-Parity Event Dynamics", paper for the 25th EU PVSEC/WPEC-5, Valencia, 6-10 September.
Brown, A., S.G. Müller and Z. Dobrotková (2011a), "Renewable Energy: Markets and Prospects by Technology", IEA Information Paper, OECD/IEA, Paris.
Barnett, P. and P. Quinlivan (2009), “Assessment of Current Costs of Geothermal Power Generation in New Zealand”, report by SKM for New Zealand Geothermal Association, www.nzgeothermal.org.nz\industry_papers.html.
BSW (BundesverbandSolarwirtschaft) (2011), "PreisindexPhotovoltaik" (Price Index Photovoltaics), www.solarwirtschaft.de/preisindex.
Bürger, V., et al. (2008), "Policies to Support Renewable Energies in the Heat Market", Energy Policy, Vol. 36, Elsevier, Amsterdam, pp. 3150-3159.
161-184 Chap 6 et annexe AIE RENEWABLES.indd 177161-184 Chap 6 et annexe AIE RENEWABLES.indd 177 09/11/11 10:4609/11/11 10:46
© O
EC
D/IE
A, 2
011
178
Deploying Renewables: Annex B
Carbon Trust (2007), "Biomass Heating – National Implementation in the UK", presentation at the IEA Bioenergy Workshop on Innovation in the Field of Bioenergy Business Development, Munich, 29 October, www.ieabioenergy.com/DocSet.aspx?id=5668.
Cherubini, F., et al. (2009), “Energy- and greenhouse gas-based LCA of biofuel and bioenergy systems: Key issues, ranges and recommendations”, Resources, Conservation and Recycling, Vol. 53, Elsevier, Amsterdam, pp. 434–447.
Cheung, K. (2011), "Integration of Renewables - Status and Challenges in China", IEA Information Paper, IEA/OECD, Paris.
Coenraads, R., M. Voogt and A. Morotz (2006), "Analysis of Barriers for the Development of Electricity Generation from Renewable Energy Sources in the EU-25", Report of the project OPTRES (Assessment and Optimisation of Renewable Energy Support Measures in the European Electricity Market) as conducted by a consortium led by Fraunhofer ISI for the European Commission, DGTREN, Intelligent Energy for Europe - Programme (Contract No. EIE/04/073/S07.38567), ECOFYS, Utrecht.
Connor, P., et al. (2009), "Overview of RES-H/RES-C Support Options", D4 of WP2 report of the EU project RES-H Policy, www.res-h-policy.eu/downloads/RES-H_Policy-Options_(D4)_final.pdf.
DECC (Department of Energy and Climate Change) (2010), National Renewable Energy Action Plan for the United Kingdom, DECC, London.
DECC (2011), "Renewable Heat Incentive (RHI) Scheme", www.decc.gov.uk/en/content/cms/what_we_do/uk_supply/energy_mix/renewable/policy/renewable_heat/incentive/incentive.aspx.
DSIRE (Database of State Incentives for Renewables and Efficiency) (2011), "Renewable Electricity Production Tax Credit (PTC)", www.dsireusa.org/incentives/incentive.cfm?Incentive_Code=US13F&re=1&ee=1.
Ecorys (2008), "Assessment of Non-Cost Barriers to Renewable Energy Growth in EU Member States", AEON DG TREN No. TREN/D1/48 – 2008 Final report, Ecorys, Rotterdam.
Edge, G. (2006), “A Harsh Environment: The Non-Fossil Fuel Obligation and the UK Renewables Industry”, in K. Mallon (ed.), Renewable Energy Policy and Politics – A Handbook for Decision-Making, Earthscan, London.
EIA (Energy Information Agency) (2010), Annual Energy Review 2010, EIA, Washington, D.C.
EPIA (European Photovoltaic Industry Association) (2011), Solar Generation 6, EPIA, Brussels.
ErDF (Électricité Réseau Distribution France) (2011), "EDF - Site Solaire" (EDF Solar Site), www.edf-oasolaire.fr.
ESTIF (European Solar Thermal Industry Federation) (2007), "Best Practice Regulations for Solar Thermal", www.estif.org/fileadmin/estif/content/policies/STAP/Best_practice_solar_regulations.pdf.
161-184 Chap 6 et annexe AIE RENEWABLES.indd 178161-184 Chap 6 et annexe AIE RENEWABLES.indd 178 09/11/11 10:4609/11/11 10:46
© O
EC
D/IE
A, 2
011

Annex B
179
EU (European Union) (2009), Directive 2009/28/EC of the European Parliament and of the Council of 23 April 2009 on the Promotion of the Use of Energy from Renewable Sources and Amending and Subsequently Repealing Directives 2001/77/EC and 2003/30/EC, EC, Brussels.
EU (2010), Directive 2010/31/EC of the European Parliament and of the Council of 19 May 2010 on the Energy Performance of Buildings (Recast), EC, Brussels.
GSE (Gestore dei Servizi Elettrici) (2011), “Data on Italian PV installations”, www.gse.it.
GWEC (Global Wind Energy Council) (2011), Global Wind Report: Annual Market Update, GWEC, Brussels.
Held, A., et al. (2010), "RE-Shaping: Shaping an Effective and Efficient European Renewable Energy Market", D5 & D6 Report (Indicators assessing the performance of renewable energy support policies in 27 Member States) of the project conducted by a consortium coordinated by Fraunhofer Institute Systems and Innovation Research for the European Commission, DGTREN, Intelligent Energy for Europe - Programme (Contract No. EIE/08/517/SI2.529243), Fraunhofer Institute Systems and Innovation Research, Karlsruhe.
IEA (International Energy Agency) (2008), Deploying Renewables: Principles for Effective Policies, OECD/IEA, Paris.
IEA (2010a), World Energy Outlook 2010, OECD/IEA, Paris.
IEA (2010b), Energy Technology Perspectives 2010, OECD/IEA, Paris.
IEA (2010c), Renewable Energy Essentials: Hydropower, OECD/IEA, Paris.
IEA (2010d), Technology Roadmap: Concentrating Solar Power, OECD/IEA, Paris.
IEA (2010e), Cities, Towns and Renewable Energy: Yes in My Front Yard, OECD/IEA, Paris.
IEA (2011a), "Global Renewable Energy Policies and Measures Database", www.iea.org/textbase/pm/?mode=re.
IEA (2011b), Harnessing Variable Renewables, OECD/IEA, Paris.
IEA (2011c), Technology Roadmap: Biofuels for Transport, OECD/IEA, Paris.
IEA (2011d), Technology Roadmap: Geothermal Heat and Power, OECD/IEA, Paris.
IEA (2011e), Medium-Term Oil and Gas Markets 2011, OECD/IEA, Paris.
IEABCC (International Energy Agency Biomass Combustion and Cofiring) (2011), "Database of Biomass Cofiring initiatives", www.ieabcc.nl/database/cofiring.html.
IEAPVPS (International Energy Agency Photovoltaic Power Systems Programme) (2011), "Annual Report 2010", www.iea-pvps.org/index.php?id=6.
IEASHC (International Energy Agency Solar Heating and Cooling Programme) (2011), "Annual Report 2010", www.iea-shc.org/about/annualreports.aspx.
161-184 Chap 6 et annexe AIE RENEWABLES.indd 179161-184 Chap 6 et annexe AIE RENEWABLES.indd 179 09/11/11 10:4609/11/11 10:46
© O
EC
D/IE
A, 2
011

180
Deploying Renewables: Annex B
IEE (Institute for Economy and the Environment) (2010), "The Price of Renewable Energy Policy Risk: An Empirical Analysis Based on Choice Experiments with International Wind and Solar Energy Investors", Confidential report prepared for the IEA, IEE, University of St. Gallen, St. Gallen.
IPCC (International Panel on Climate Change) (2011), Special Report on Renewable Energy Sources and Climate Change Mitigation, Cambridge University Press, Cambridge and New York.
Jager, D. de and M. Rathmann (2008), "Policy Instrument Design to Reduce Financing Costs in Renewable Energy Technology Projects", Report prepared for the IEA Implementing Agreement on Renewable Energy Technology Deployment (RETD), Ecofys International BV, Utrecht.
Jochem, E., et al. (2008), "Investitionen Für Ein KlimafreundlichesDeutschland"(Investments for a Climate-Friendly Germany), Synthesis report of study commissioned by the German Federal Ministry for the Environment, Nature Protection and Nuclear Safety (BMU), authored by: Potsdam Institute for Climate Impact Research (PIK), European Climate Forum (ECF), Fraunhofer Institute for Systems and Innovation Research (Fh-ISI), BSR-Sustainability, Öko-Zentrum NRW, Potsdam.
Lamers, P. (2009), "Assessment of Non-Economic Barriers to the Development of Renewable Electricity: Global Recommendations", Confidential report prepared for the IEA, Ecofys Germany GmbH, Berlin.
Mizuno, E. (2010), "Renewable Energy Technology Innovation and Commercialisation Analysis", Report prepared for the IEA Renewable Energy Division, Cambridge Centre for Energy Studies (CCES), Judge Business School, University of Cambridge, Cambridge.
Müller, S.G., A. Brown and S. Ölz (2011), "Renewable Energy: Policy Considerations for Deploying Renewables", IEA Information Paper, OECD/IEA, Paris.
Müller, S.G., A. Marmion and M. Beerepoot (2011b), "Renewable Energy: Markets and Prospects by Region", IEA Information Paper, OECD/IEA, Paris.
National People‘s Congress (2010), “The Renewable Energy Law of the People’s Republic of China (Amended)“, http://www.npc.gov.cn/huiyi/cwh/1112/2009-12/26/content_1533216.htm.
NDRC (National Development and Reform Commission) (2011), The Twelfth Five-Year Plan for National Economic and Social Development of The People's Republic of China, Beijing.
NEEDS (New Energy Externalities Developments for Sustainability Project) (2009), "Final Outcomes", www.needs-project.org.
OECD (Organisation for Economic Co-operation and Development) (2011), Towards Green Growth, OECD, Paris, www.oecd.org/dataoecd/37/34/48224539.pdf.
Panuly, J.P. (2001), “Barriers to Renewable Energy Penetration; a Framework for Analysis”, Renewable Energy, Vol. 24, Elsevier, Amsterdam, pp. 73-89.
161-184 Chap 6 et annexe AIE RENEWABLES.indd 180161-184 Chap 6 et annexe AIE RENEWABLES.indd 180 09/11/11 10:4609/11/11 10:46
© O
EC
D/IE
A, 2
011
Annex B
181
Philibert, C. (2011), "Interactions of Policies for Renewable Energy and Climate", IEA Working Paper, OECD/IEA, Paris.
POST (Parliamentary Office of Science and Technology) (2006), "Carbon Footprint of Electricity Generation", Postnote N. 268, www.parliament.uk/documents/post/postpn268.pdf.
PV Legal (2010), "First PV Legal Status Report", www.pvlegal.eu/results/status-reports.html.
PV Legal (2011), "Database of Administrative Processes", www.pvlegal.eu/nc/database.html
pvXchange (2011), "PVX Spot Market Price Index Solar PV Modules", www.solarserver.com/service/pvx-spot-market-price-index-solar-pv-modules.html.
Ragwitz, M., et al. (2007), "OPTRES -Assessment and Optimisation of Renewable Energy Support Measures in the European Electricity Market", Final Report of the project as conducted by a consortium led by Fraunhofer Institute Systems and Innovation Research for the European Commission, DGTREN, Intelligent Energy for Europe - Programme (Contract No. EIE/04/073/S07.38567), Fraunhofer Institute Systems and Innovation Research, Karlsruhe.
Ragwitz, M. and A. Held (2007), "Policy Effectiveness and Support Level Efficiency of Market Deployment Policies for RET – Methodological introduction", Report to the International Energy Agency, Fraunhofer Institute Systems and Innovation Research, Karlsruhe.
Reid, G., et al. (2010), "A Global Renewables Investment Plan: Scaling Up Investments in Renewable Energy Technologies", Report by Jeffereis, Potsdam Institute for Climate Impact Research (PIK); International Institute for Applied Systems Analysis (IIASA); PricewaterhouseCoopers Ltd (PwC); University of Exeter; Smart Energy for Europe Platform (SEFEP), supported and edited by the Indo-German Energy-Forum; the Government of India, Ministry of New and Renewable Energy (NMRE); Government of Germany, Federal Ministry for the Environment, Nature Conservation and Nuclear Safety (BMU); Deutsche Gesellschaft für Technische Zusammenarbeit (GTZ) GmbH; Permanent Office of the Indo-German Energy Forum, New Delhi.
REN21 (Renewable Energy Policy Network for the 21st Century) (2011), Renewables 2011 Global Status Report 2011, REN21 Secretariat, Paris.
Sawin, J.L. (2006), “National Policy Instruments: Policy Lessons for the Advancement and Diffusion of Renewable Energy Technologies Around the World”, in Aßmann, D. and U. Laumanns (eds.), Renewable Energy: A Global Review of Technologies, Policies and Markets, Earthscan, London.
Shamseddine, R. (2010), “Saudi Arabia Hopes for ‘Renewables’ Regulations in 2011”,www.arabianbusiness.com/588629-saudi-arabia-hopes-for-renewables-regulations-in-2011, accessed 19 May 2010.
Swissolar (2011), "Facts and Figures", www.swissolar.ch/en/medien/fakten-und-zahlen.
UNEP (United Nations Environment Programme) (2008), Green Jobs: Towards Decent Work in a Sustainable, Low-Carbon World, UNEP, Nairobi.
161-184 Chap 6 et annexe AIE RENEWABLES.indd 181161-184 Chap 6 et annexe AIE RENEWABLES.indd 181 09/11/11 10:4609/11/11 10:46
© O
EC
D/IE
A, 2
011

182
Deploying Renewables: Annex B
UNEP/BNEF (United Nations Environment Programme/Bloomberg New Energy Finance) (2011), "Global Trends in Renewable Energy Investment 2011", UNEP and BNEF, www.fs-unep-centre.org.
Usha Rao K. and V.V.N. Kishore (2009), "A Review of Technology Diffusion Models with Special Reference to Renewable Energy Technologies", Renewable and Sustainable Energy Reviews, Vol. 14, Elsevier, Amsterdam, pp. 1070–1078.
Walz, R., N. Helfrich, and A. Enzmann (2009), "A System Dynamics Approach for Modelling a Lead-Market-Based Export Potential", Fraunhofer Institute for Systems and Innovation Research (Fh-ISI) Working Paper Sustainability and Innovation, No. S 3/2009, Karlsruhe, http://isi.fraunhofer.de/isi-de/e/publikationen/workingpapers_sustainability_innovation.php.
Wind Barriers (2011), "Description of the Project", www.windbarriers.eu.
161-184 Chap 6 et annexe AIE RENEWABLES.indd 182161-184 Chap 6 et annexe AIE RENEWABLES.indd 182 09/11/11 10:4609/11/11 10:46
© O
EC
D/IE
A, 2
011

161-184 Chap 6 et annexe AIE RENEWABLES.indd 183161-184 Chap 6 et annexe AIE RENEWABLES.indd 183 09/11/11 10:4609/11/11 10:46
© O
EC
D/IE
A, 2
011

IEA Publications, 9, rue de la Fédération, 75739 Paris Cedex 15
Lay-out made by Easy Catalogue, France
Printed in France by Corlet, November 2011 • (61 12011 27 1P1) ISBN: 978-92-64-12490-5
161-184 Chap 6 et annexe AIE RENEWABLES.indd 184161-184 Chap 6 et annexe AIE RENEWABLES.indd 184 09/11/11 10:4609/11/11 10:46
© O
EC
D/IE
A, 2
011