dependence of predicted dewatering on size of hydraulic … · mine water solutions 2018 vancouver,...
TRANSCRIPT
Proceedings of Mine Water Solutions 2018 June 12–15, 2018, Vancouver, Canada
Published by the University of British Columbia, 2018
31
Dependence of Predicted Dewatering on Size of Hydraulic Stress Used for
Groundwater Model Calibration
Vladimir Ugorets, SRK Consulting (US), Inc., USA
Cristian Pereira, SRK Consulting (US), Inc., USA
Abstract
Accurate predictions of long-term dewatering requirements by groundwater models depend on the quality
of calibrated hydraulic parameters and boundary conditions. The latter is very important for large-scale
dewatering projects when drawdown propagates a significant distance away from the mine area and
predicted mine inflow/dewatering rates predominantly depend on the hydrogeological behaviour of the
model boundaries. This paper presents the results of a multiyear data collection and groundwater
modeling study to define large-scale dewatering requirements for a mine project in a complex
hydrogeological setting characterized by large bedrock transmissivity and groundwater storage, high
recharge from precipitation, and the presence of leaky lateral and vertical boundaries. Over a period of 5
years, dewatering requirements were evaluated for scoping, pre-feasibility, and feasibility studies using a
groundwater model calibrated to various hydraulic stresses, including short-term hydrogeological testing
in geotechnical boreholes, 2 to 3 day airlift tests, 5 to 14 day pumping tests in prototype dewatering wells,
one year of highly variable flow and water level data obtained during exploration decline (initial mine)
dewatering, and observations of groundwater recovery once dewatering ceased.
Based on the size and length of the hydraulic stress applied to the groundwater system and observed
responses, a series of conceptual and numerical models were developed for the project. When new data
were obtained, an iterative approach was used to evaluate the robustness of the model calibration, assess
the validity of the conceptual model, and revise to the predicted dewatering requirements. In total, the
groundwater model was recalibrated five times to account for new data. The process required revising the
conceptual model with regards to transmissivity, vertical hydraulic conductivity, groundwater storage,
recharge from precipitation, and boundary conditions. Dewatering predictions were completed for two
mining methods (block cave and open pit) and the high variation in predicted dewatering requirements
highlights the importance of understanding vertical recharge to the groundwater system and the
hydrogeological role of lateral model boundaries. In complex hydrogeological systems, these two factors

MINE WATER SOLUTIONS 2018 ● VANCOUVER, CANADA
32
cannot be precisely evaluated based on short- to intermediate-term hydraulic testing; model calibration to
long-term testing provided superior input to the conceptual models and resulted in more defensible mine
dewatering predictions. Predictability of the final version of the model was verified by reproducing
groundwater recovery observed during flooding of the exploration decline.
Introduction
Usually, the hydrogeological data collection effort is constrained to the areas near the ore body or mine
footprint; however, in the case of large-scale and long-term dewatering projects, the hydrogeological
boundaries play a decisive role in the conceptual model, and therefore in the dewatering predictions.
Boundaries can be located several miles away from the mine area where hydrogeological data are sparse,
yet boundaries are often the critical factor in the prediction of dewatering requirements for mine projects.
The size of the conceptual model and the distribution of field data must be balanced against the scale
of the hydraulic stress (diameter and time) on the hydrogeological system to ultimately answer the
question illustrated in Figure 1: “What amount of hydraulic stress (i.e., pumping rate and duration) is
sufficient to calibrate a model in order to reliably predict long-term mine dewatering requirements in a
highly permeable groundwater system with unknown lateral boundaries?”
Figure 1: Problem description
This paper presents the results of a multiyear data collection and groundwater modeling study to
define large scale dewatering requirements for a mine project in a complex hydrogeological setting. Over
MINE WATER SOLUTIONS 2018 ● VANCOUVER, CANADA
33
a period of six years, dewatering requirements were evaluated for scoping, pre-feasibility, and feasibility
studies using different conceptual and numerical models based on a long-term data collection effort.
Hydrogeological Studies
The confidential origin of the projects does not allow the presentation of a detailed description of the site;
therefore, the data collection campaigns and hydrogeological studies are described in general terms.
The specific hydrogeological studies were developed over six years and included field campaigns
and dewatering prediction for different proposed mine extraction methods. The authors as part of a larger
team participated in the hydrogeological studies as follows:
• 2010 to 2011 – Scoping study for two block cave operations;
• 2013 to 2014 – Pre-feasibility study for one block cave; and
• 2014 to 2015 – Feasibility studies for an open pit.
The field data collected during this time is summarized below:
• Over 70 monitoring wells (27 shallow, 11 intermediate, and 36 deep) were constructed at the
project area to a maximum depth of 621 m. The majority of monitoring wells were located within
1.5 km of the site.
• Short-term testing included 11 pumping or injection packer tests, and 95 falling/rising head tests.
• Additionally, 3 pumping tests were conducted in the proximity of the ore body in large diameter
wells; the test duration was from 5 to 14 days with pumping rates spanning 5 to 60 L/s. These
pumping tests were conducted during excavation of the exploration decline.
• The exploration decline started before hydrogeological studies began, and significant groundwater
inflow was intercepted by the decline. Flow rates and water level data were collected for one year
during the excavation of the exploration decline, and for one year after they ceased.
Location of pumping wells, monitoring wells, the exploration decline, and proposed mines are
shown schematically in Figure 2.
Description of Hydrogeological Study Area
The hydrogeological study area (HSA) is comprised of shallow and deep groundwater systems with
limited vertical hydraulic connection between the two systems. The shallow sequence is formed by about
50 to 100 m thick hill slope colluvium (HSC) with a large covering of andesitic and interflow sediments
with thicknesses up to 300 m, getting significant recharge from precipitation. The deep system is formed
by a basalt basement with altered and mineralized zones. A mudstone aquitard located between the
shallow and deep systems acts as a barrier to vertical groundwater flow (Figure 2).

MINE WATER SOLUTIONS 2018 ● VANCOUVER, CANADA
34
Notes: 1: Q represents regional groundwater flow
2: Water levels and direction of groundwater flow are shown for pre-mining conditions
Figure 2: Conceptual hydrogeological model
The HSA is characterized by high precipitation; approximately 5 m of rain falls on the project area
annually. The heaviest precipitation generally occurs from November to March (from 500 to 850
mm/month), but an actual dry season is rarely seen – the rainfall during the remaining months varies from
130 to 300 mm/month. Meteoric recharge results in relatively high water levels in the HSC, with limited
seasonal variation.
The data are interpreted as two separate water tables: a shallow system within HSC and
andesite/interflow sediments below, and a deep system in the basement rocks.
The initial stages of the field campaign identified a low K cover sequence (except the first 50 to 100
m of HSC), a high hydraulic conductivity (K) fractured basement rock (K=0.3 to 1.5 m/d), and an
MINE WATER SOLUTIONS 2018 ● VANCOUVER, CANADA
35
intermediate to high K ore body (K=0.1 to 1.5 m/d). The hydraulic role of lateral boundaries was
unknown.
Long-Term Stress to Groundwater System Used for Model Calibration and Dewatering Predictions
The preliminary test results indicated the need for large-scale active dewatering due to high water table
elevation (significantly exceeding the bottom elevation of the proposed mine) and the presence of high K
Basalt Basement and ore body. Various hydrogeological conceptual models have been developed since
2010, the complexity and accuracy of each driven by field data available at each phase of the
hydrogeological study. Consequently, several numerical groundwater flow models were developed to
evaluate the dewatering requirements using predictive simulations.
The hydrogeological phases used in each numerical model are summarized below:
• Phase 1: Short-term testing prior to installation of an exploration decline within Basalt Basement
• Phase 2: Three pumping tests and 10 days of active decline dewatering (maximum dewatering rate
up to 100 L/s)
• Phase 3: 120 days of active decline dewatering (maximum dewatering rate up to 220 L/s)
• Phase 4: 200 days of active decline dewatering (maximum dewatering rate up to 350 L/s)
• Phase 5: 365 days of active decline dewatering (maximum dewatering rate up to 125 L/s)
Figure 3 shows the applied stress to the groundwater system during Phases 2 through 5.
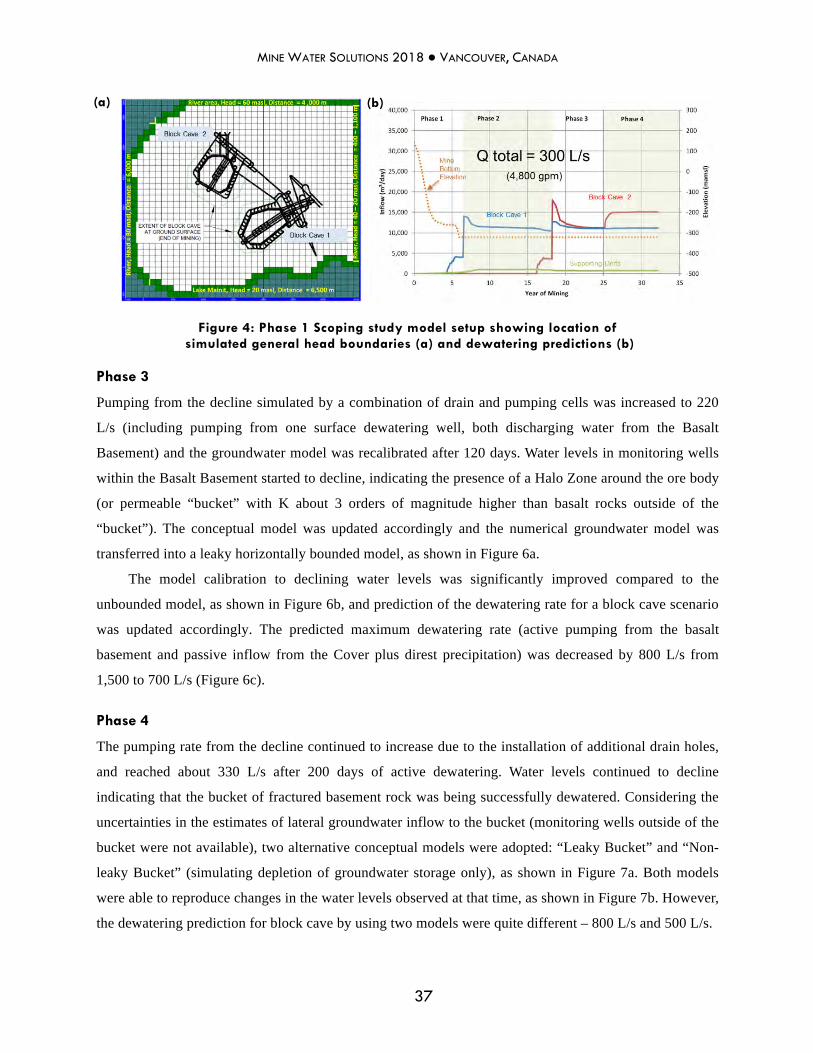
Phase 1
During the very early exploration stage, a limited set of hydrogeological field tests was performed
consisting of only a few packer tests completed in two deep geotechnical boreholes near the ore body. A
preliminary hydrogeological model was built assuming a very permeable cover unit and a basement with
minimum groundwater flow. A numerical model was developed as an initial tool for estimating the
groundwater inflow into the two proposed block cave mines. A steady-state model was calibrated to the
water levels measured in the shallow piezometers screened within HSC representing the pre-mining
conditions. The predicted dewatering requirements for two block caves were about 300 L/s (4,800 gpm).
Figure 4 shows the extent of the groundwater numerical model used for Phase 1. The model had limited
lateral extent with general head boundaries assigning at the model boundaries. Dewatering predictions
were made under a passive inflow scenario to the two block caves and their results vs. ultimate mine
bottom elevation and their results are shown in Figure 4. Inflow was simulated by drains at the draw point
level and a block cave was modeled by the increase of K in space and time.

MINE WATER SOLUTIONS 2018 ● VANCOUVER, CANADA
36
Figure 3: Stress applied to groundwater system during Phases 2 through 5
Phase 2
During the initial stage of decline installation, it was recognized that basement fractured rock around the
ore bodies was permeable, because significant groundwater inflows were measured as soon as the decline
advanced below the water table. The model was calibrated to measured water levels and the results of
three pumping tests. Conceptual and numerical models were assumed to be unbounded (with no physical
boundaries nearby so distant GHBs were used to represent the heads in the regional groundwater system),
as shown in Figure 5a.
The numerical model was calibrated to changes in water levels (as shown in Figure 5b) and
dewatering predictions were made for two block caves considered at that time. The maximum dewatering
rate from the perimeter ring of the dewatering wells screened within Basalt Basement was estimated to be
1,500 L/s (Figure 5c) or 1,200 L/s larger than the Phase 1 prediction.
MINE WATER SOLUTIONS 2018 ● VANCOUVER, CANADA
37
Figure 4: Phase 1 Scoping study model setup showing location of simulated general head boundaries (a) and dewatering predictions (b)
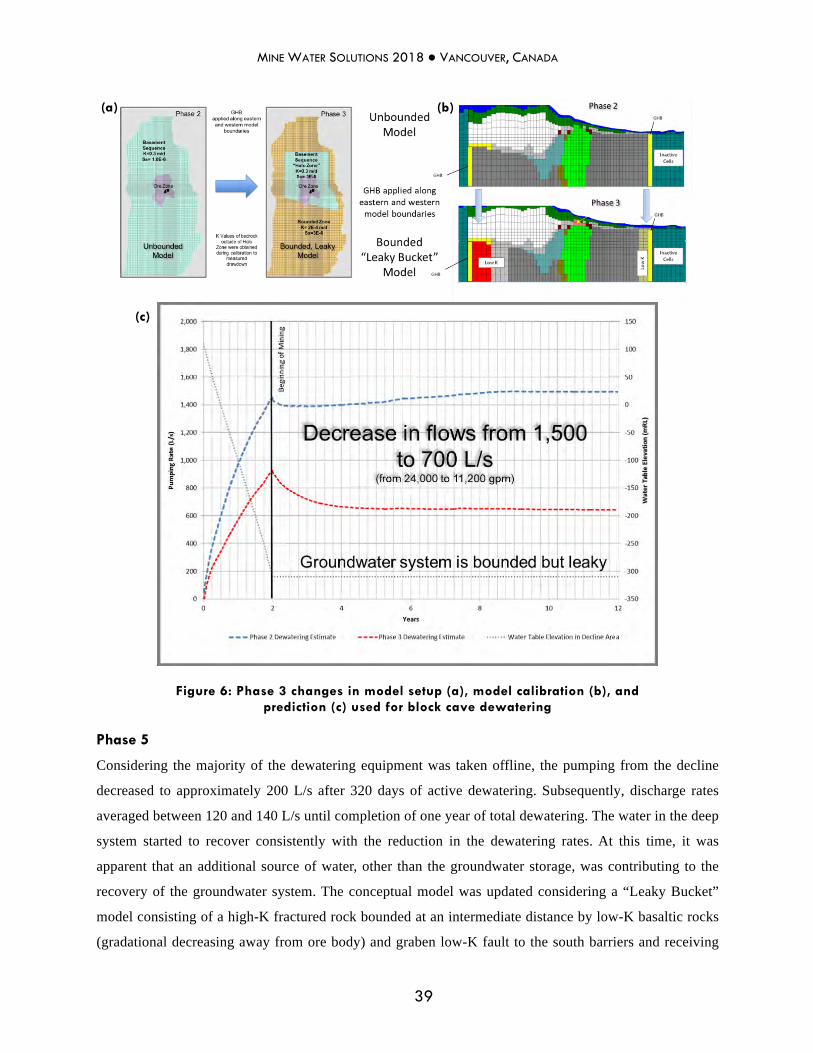
Phase 3
Pumping from the decline simulated by a combination of drain and pumping cells was increased to 220
L/s (including pumping from one surface dewatering well, both discharging water from the Basalt
Basement) and the groundwater model was recalibrated after 120 days. Water levels in monitoring wells
within the Basalt Basement started to decline, indicating the presence of a Halo Zone around the ore body
(or permeable “bucket” with K about 3 orders of magnitude higher than basalt rocks outside of the
“bucket”). The conceptual model was updated accordingly and the numerical groundwater model was
transferred into a leaky horizontally bounded model, as shown in Figure 6a.
The model calibration to declining water levels was significantly improved compared to the
unbounded model, as shown in Figure 6b, and prediction of the dewatering rate for a block cave scenario
was updated accordingly. The predicted maximum dewatering rate (active pumping from the basalt
basement and passive inflow from the Cover plus direst precipitation) was decreased by 800 L/s from
1,500 to 700 L/s (Figure 6c).
Phase 4
The pumping rate from the decline continued to increase due to the installation of additional drain holes,
and reached about 330 L/s after 200 days of active dewatering. Water levels continued to decline
indicating that the bucket of fractured basement rock was being successfully dewatered. Considering the
uncertainties in the estimates of lateral groundwater inflow to the bucket (monitoring wells outside of the
bucket were not available), two alternative conceptual models were adopted: “Leaky Bucket” and “Non-
leaky Bucket” (simulating depletion of groundwater storage only), as shown in Figure 7a. Both models
were able to reproduce changes in the water levels observed at that time, as shown in Figure 7b. However,
the dewatering prediction for block cave by using two models were quite different – 800 L/s and 500 L/s.
(a) (b)

MINE WATER SOLUTIONS 2018 ● VANCOUVER, CANADA
38
Figure 5: Phase 2 model setup (a), calibration (b), and prediction (c) used for block cave pre-feasibility study
(a)
(b)
(c)
MINE WATER SOLUTIONS 2018 ● VANCOUVER, CANADA
39
Figure 6: Phase 3 changes in model setup (a), model calibration (b), and prediction (c) used for block cave dewatering
Phase 5
Considering the majority of the dewatering equipment was taken offline, the pumping from the decline
decreased to approximately 200 L/s after 320 days of active dewatering. Subsequently, discharge rates
averaged between 120 and 140 L/s until completion of one year of total dewatering. The water in the deep
system started to recover consistently with the reduction in the dewatering rates. At this time, it was
apparent that an additional source of water, other than the groundwater storage, was contributing to the
recovery of the groundwater system. The conceptual model was updated considering a “Leaky Bucket”
model consisting of a high-K fractured rock bounded at an intermediate distance by low-K basaltic rocks
(gradational decreasing away from ore body) and graben low-K fault to the south barriers and receiving
(a) (b)
(c)

MINE WATER SOLUTIONS 2018 ● VANCOUVER, CANADA
40
limited vertical recharge from the overlying andesite aquifer (Figure 8a).
The new transient calibration (Figure 8b) indicated that the model:
• Reproduces decreasing water levels in the basement to elevations of 50 to 70 mamsl and
reasonably matches the slopes of the measured drawdown.
• Simulates observed recovery in groundwater levels when the decline dewatering rates significantly
dropped from 250 L/s to 125 L/s – 135 L/s.
• Simulates no changes in water table within the cover groundwater system, which is consistent with
measured data.
• Simulates 40 m and 50 m of drawdown reaching the western and eastern model boundaries,
respectively, and no drawdown at the northern and the southern model boundaries simulated as no-
flow at the end of transient calibration.
The predicted simulation shows an increment in the total dewatering rate from the proposed open pit
up to 940 L/s (Figure 8c). Dewatering for Phase 5 was simulated by using 15 pumping wells installed
both within Cover (11 wells) and Basalt Basement (4 wells). Active dewatering from Basalt Basement
and passive inflow from the Cover were considered during Phases 3 and 4 for the block cave scenario
described above.
Model Verification (Phase 6)
Once the pumping equipment was shut down after one year of operations, the water levels started to
recover and their changes were recorded for about 250 days. The last conceptual and numerical
groundwater models (used for Phase 5 and representing the “Leaky Bucket”) were verified using the
recovery data. The model could simulate the measured recovery trend in the deep groundwater system, as
shown in Figure 9.
Conclusions
During five phases of data collection and model calibration, the predicted dewatering rates ranged from
300 to 1,500 L/s (as shown in Figure 10 and Table 1). Only after applying a large stress to the
groundwater system and observing water level changes during the process of groundwater recovery could
reliable conceptual and numerical models (Phase 5) be revised to arrive at the most defendable predicted
dewatering rates (up to 940 L/s).

MINE WATER SOLUTIONS 2018 ● VANCOUVER, CANADA
41
Figure 7: Phase 4 model setup (a), calibration (b), and prediction (c) used for block cave dewatering
(a)
(b)
(c)

MINE WATER SOLUTIONS 2018 ● VANCOUVER, CANADA
42
Figure 8: Phase 5 model setup (a), calibration (b), and prediction (c) used for open pit feasibility study
(a)
(b)
(c)

MINE WATER SOLUTIONS 2018 ● VANCOUVER, CANADA
43
Figure 9: Phase 6 model verification to groundwater recovery
The results of the completed study allowed the authors to draw conclusions as follows:
• Dewatering predictions significantly depend on the hydrogeological role of lateral boundaries of
the deep groundwater system and vertical recharge from the shallow groundwater system.
• These two factors cannot be precisely evaluated during short to intermediate-term hydraulic testing
in the case of a highly permeable “bucket” groundwater system and horizontal “leaky" conditions.
• Long-term test data provides superior evidence to support conceptual models and defensible mine
dewatering predictions.
• Groundwater level recovery data enables researchers to improve/confirm model predictability in
the case of “horizontally leaky bucket” groundwater system.
• Water level monitoring data outside of a highly permeable “bucket” can significantly help in
defining horizontal “leaky/non-leaky” conditions, but are not usually available during the initial
stage of the mining project.

MINE WATER SOLUTIONS 2018 ● VANCOUVER, CANADA
44
Figure 10: Predicted dewatering rates vs. phase of study
Table 1: Summary of conceptual models and predicted dewatering rates
Phase of Study Days Since Active Mine Dewatering
Began
Predicted Dewatering Rate
(L/s)
Conceptual Model Type of Dewatering
1 0 300 Unbounded, Low K Passive inflow to two block caves
2 10 1,500 Unbounded, High K Active dewatering of block cave
3 120 700 “Leaky Bucket” Active dewatering of block cave
4 200 500 to 800 “Leaky Bucket”/Bounded
Active dewatering of block cave
5 365 940 “Leaky Bucket” Active dewatering of open pit
6 730 940