departmentofmechanicalengineering, divakar … dynamics/1f-4.pdfdivakar rajamohan...
TRANSCRIPT

Downloa
Divakar RajamohanDepartment of Mechanical Engineering,
University of Cincinnati,Cincinnati, OH 45221
Rupak K. Banerjee1
Department of Mechanical Engineering,and Department of Biomedical Engineering,
University of Cincinnati,688 Rhodes Hall, PO Box 210072,
Cincinnati, OH 45221e-mail: [email protected]
Lloyd H. BackJet Propulsion Laboratory,
California Institute of Technology,Pasadena, CA 91109
Ashraf A. Ibrahim
Milind A. Jog
Department of Mechanical Engineering,University of Cincinnati,
Cincinnati, OH 45221
Developing Pulsatile Flowin a Deployed Coronary StentA major consequence of stent implantation is restenosis that occurs due to neointimalformation. This patho-physiologic process of tissue growth may not be completely elimi-nated. Recent evidence suggests that there are several factors such as geometry and sizeof vessel, and stent design that alter hemodynamic parameters, including local wall shearstress distributions, all of which influence the restenosis process. The present three-dimensional analysis of developing pulsatile flow in a deployed coronary stent quantifieshemodynamic parameters and illustrates the changes in local wall shear stress distribu-tions and their impact on restenosis. The present model evaluates the effect of entranceflow, where the stent is placed at the entrance region of a branched coronary artery. Stentgeometry showed a complex three-dimensional variation of wall shear stress distributionswithin the stented region. Higher order of magnitude of wall shear stress of 530 dyn/cm2
is observed on the surface of cross-link intersections at the entrance of the stent. A lowpositive wall shear stress of 10 dyn/cm2 and a negative wall shear stress of−10 dyn/cm2 are seen at the immediate upstream and downstream regions of strut inter-sections, respectively. Modified oscillatory shear index is calculated which showed per-sistent recirculation at the downstream region of each strut intersection. The portions ofthe vessel where there is low and negative wall shear stress may represent locations ofthrombus formation and platelet accumulation. The present results indicate that the im-mediate downstream regions of strut intersections are areas highly susceptible to rest-enosis, whereas a high shear stress at the strut intersection may cause platelet activationand free emboli formation. �DOI: 10.1115/1.2194067�
1 IntroductionInterventional techniques like balloon angioplasty with and
without stent placement are used to treat arterial stenosis. Ameri-can Heart Association statistics �1� show serious complications in1–2% of cases following Percutaneous Transluminal CoronaryAngioplasty. In contrast, after 6 months following the procedure,30–40% of patients develop restenosis. Thus there is statisticalsignificance between contrasting scenarios of mortality and rest-enosis. Stent implantation improves the arterial blood flow byredistributing the plaque. Specifically, drug eluting stents are usedwhich help in reducing restenosis to 8–10% �1�. Though stents areused to increase the arterial lumen diameter and restore bloodflow, restenosis is not completely eliminated.
There are several factors affecting restenosis like geometry andsize of vessel, and stent design. These factors impact areas of flowrecirculation and flow separation, and wall shear stress �2–4,8,9�.Kastrati et al. �2� have performed a detailed analysis of the rela-tion between clinical, lesion, and procedural factors and restenosisafter intracoronary stenting of eight different stent designs in aseries of patients. Among these factors, vessel size was observedto be the most predominant factor affecting restenosis, followedby stent design, smaller vessel size, complex lesions, and longerlesions. Kastrati et al. �3� have studied the effect of strut thicknessof coronary stents on restenosis where thin strut stent of strutthickness 50 �m and thick strut stent of thickness 140 �m wereused for the study. They observed a significant reduction of 42%angiographic restenosis and 38% clinical restenosis in stents con-structed with thin metal struts compared to stents with thick metalstruts.
The geometric design factors for a deployed stent that affect
1Corresponding author.Contributed by the Bioengineering Division of ASME for publication in the JOUR-
NAL OF BIOMECHANICAL ENGINEERING. Manuscript received August 6, 2004; final
manuscript received November 9, 2005. Review conducted by James Moore.Journal of Biomechanical Engineering Copyright © 20
ded 27 Sep 2010 to 129.137.198.196. Redistribution subject to ASM
restenosis are areas of flow recirculation and flow separation�4–6�. Berry et al. �4� have shown that stent geometry has a sig-nificant effect on local hemodynamics by performing dye injec-tion flow visualization and computational fluid dynamics studies.It was seen that more dye accumulated between the stent wireswhen the wire spacing was the smallest �3 wire diameters� and thestagnation zones were continuous from one wire to the next. How-ever, in large wire spacing two separate stagnation zones wereobserved and flow reattachment occurred between the wires. Theyconcluded that the optimum wire spacing is 6 wire diameters.Moore and Berry �5� and Frank et al. �6� have shown the depen-dence of flow recirculation and flow reattachment on strut spac-ing. They observed minimum platelet deposition and continualflow stagnation at low strut spacing, maximum platelet depositionand partial flow reattachment at intermediate strut spacing, andhigh platelet deposition and complete flow reattachment at higherstrut spacing.
Another important factor affecting restenosis is the wall shearstress �WSS� gradient �7–9�. Henry �7�, by carrying out simula-tions of flow through model stented arteries, concluded that theoccurrence of flow separation over a short distance on either sideof the strut led to large WSS gradients in the immediate vicinity ofthe flow separation and reattachment points, and this might havean impact on the rate of endothelial repair following injury in-duced by stent placement. Wentzel et al. �8� have investigated therelationship between local variations in shear stress and neointi-mal thickness and reported that at 6 month followup after coro-nary wall stent implantation, low shear stress regions showedmaximal neointimal formation and high shear stress showed mini-mal neointimal formation. Wentzel et al. �9� have evaluated theregional changes in three-dimensional geometry and shear stressdistribution after coronary wall stent placement in curved coro-nary arteries of swine. After stent implantation, the curvature ofartery was observed to increase at the entrance and the exit of the
stent which increased the maximal shear stress and decreased theJUNE 2006, Vol. 128 / 34706 by ASME
E license or copyright; see http://www.asme.org/terms/Terms_Use.cfm

Downloa
minimal shear stress near the stent edges. This has led to theconclusion that shear stress plays an essential role in plaque andthrombus formation and is sensitive to variations in regional ves-sel geometry.
Berry et al. �10� have studied the compliance mismatch existingbetween stent ends and the artery wall which affects the localWSS distribution. They have performed in vitro and in vivo analy-sis comparing a compliance matching stent and Palmaz stent in aswine model where the compliance matching stent showed re-duced circumferential stress in the arterial wall and minimalneointimal accumulation.
Rogers and Edelman �11� and Edelman and Rogers �12� havecorrelated the local hemodynamics with the formation of plaquelayers, particularly at the site of low wall shear stresses. Theirstudies showed a vital role for tissue damage in neointimal hyper-plasia due to the stent design. However, fluid flow is also respon-sible for the neointimal hyperplasia that occurs during in-stentrestenosis.
LaDisa et al. �13� have studied the localized alterations in coro-nary WSS produced by stent implantation by performing a three-dimensional computational fluid dynamics analysis with the as-sumptions of blood to be a Newtonian fluid and flow to be steady.They observed that the regions of low WSS and the stagnationzones occurred around the stent struts where the minimum WSSdecreased by 77% in stented vessel compared to unstented vessel.
Although there have been several studies of coronary flow andphysiological consequences of restenosis after stent placement,the effect of stent implantation on local WSS distribution as wellas other fluid dynamic parameters and its influence on restenosisare not well quantified. The present work focuses on a detailedstudy of WSS distribution and other hemodynamic parameterslike recirculation length and height for a coronary stent with he-lical strut matrix that is deployed at the origin of a branchedcoronary artery causing the flow to be developing in nature �Suoet al. �14��. This study improves upon previously published litera-tures as a three-dimensional analysis has been conducted to quan-tify the stent induced changes in the flow patterns for a pulsatileflow having non-Newtonian viscosity of blood.
2 Methodology
2.1 Geometry. A pulsatile flow analysis is performed for afreshly deployed coronary stent with helical strut matrix, in ahuman coronary artery having a three-dimensional geometry withan axial length of 10 mm and diameter of 3 mm as shown in Fig.1�A�. The diameter of the strut is 0.4 mm and the strut spacing,i.e., the axial distance between two consecutive struts, is 2.5 mm.The geometry of the stent struts is shown in Fig. 1�B�. Followingthe deployment of the stent, it is assumed that half of the stent isexposed to the blood flow, whereas the other half of the stent isembedded in the arterial wall. The design and the geometry of thestent strut used in the present study is based on the model used inthe past studies �Berry et al. �4�, Moore and Berry �5��.
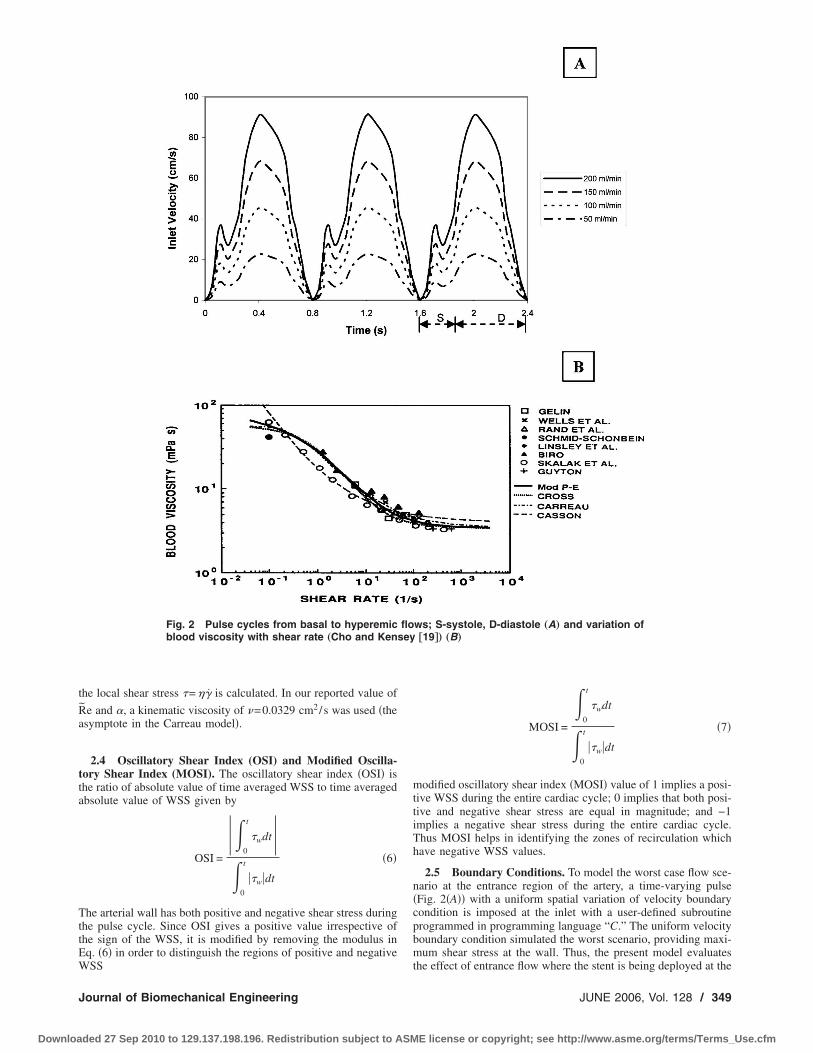
2.2 Flow Pulse. The coronary flow wave form �Fig. 2�A��used in the flow simulations was obtained from in vitro calibration�Cho et al. �15�� and smoothing the fluctuating Doppler signal.The spatially averaged velocity across the flow needed for flowsimulations is similar to that from Doppler catheter measurementsin the left anterior descending and left circumflex coronary arter-ies of patients undergoing percutaneous transluminal coronary an-gioplasty �Sibley et al. �16� and Banerjee et al. �17��. The systoleand diastole period are shown in Fig. 2�A�. The ratio of peaksystolic to peak diastolic velocity is 0.4 and the ratio of mean topeak velocity is 0.537.
2.3 Governing Equations. The flow simulations were carriedout by numerically solving the following continuity and Navier-
Stokes momentum equations for pulsatile blood flow �Banerjee et348 / Vol. 128, JUNE 2006
ded 27 Sep 2010 to 129.137.198.196. Redistribution subject to ASM
al. �18�� using a finite volume method.Mass conservation equation
�� · �v� = 0 �1�
where � is the density of blood and v is the velocity vector.Momentum conservation equation
��
�t�v� + �� · �vv� = − �p + � · ���� �2�
where p is the static pressure and �� is the stress tensor. The stresstensor �� is given by
�� = ���� · v + � · vT�� �3�
where � is the molecular or laminar viscosity of the fluid definedby the ratio of shear stress to shear rate.
Figure 2�B� shows the variation of blood viscosity with shearrate �Cho and Kensey �19��. Experimentally measured blood vis-cosity data, shown with symbols by several earlier studies, arecurve fitted with different non-Newtonian viscosity models, whichare represented by solid and dashed lines. It can be seen that theCarreau model is the better fit for the non-Newtonian blood vis-cosity at the low shear rate region. As blood is a non-Newtonianfluid, for the present study the Carreau model is used for shear-rate-dependent non-Newtonian viscosity of blood with local shearrate calculated from the velocity gradient through the second in-variant of the rate of strain tensor. The corresponding equationsfor local shear rate �̇ and blood viscosity � are given by
�̇ =�1
2��i�
j
�̇ij�̇ ji� �4�
where �̇ij is the rate of strain tensor and i , j=1,2 ,3 for three-dimensional flows
� = �� + ��0 − ����1 + ���̇�2��n−1�/2 �5�
where time constant �=3.313 s, power law index n=0.3568, zeroshear viscosity �0=0.56 poise and infinite shear viscosity �� �0.0345 poise. The model constants were obtained by curve-fittingblood viscosity data in the literature �Cho and Kensey �19��. The
3
Fig. 1 Mesh plot of coronary artery with deployed coronarystent „A… and geometry of the stent struts „B…
density of blood is taken to be 1.05 g/cm . From these relations,
Transactions of the ASME
E license or copyright; see http://www.asme.org/terms/Terms_Use.cfm
Downloa
the local shear stress �=��̇ is calculated. In our reported value of
R̃e and , a kinematic viscosity of =0.0329 cm2/s was used �theasymptote in the Carreau model�.
2.4 Oscillatory Shear Index (OSI) and Modified Oscilla-tory Shear Index (MOSI). The oscillatory shear index �OSI� isthe ratio of absolute value of time averaged WSS to time averagedabsolute value of WSS given by
OSI =
0
t
�wdt
0
t
��w�dt
�6�
The arterial wall has both positive and negative shear stress duringthe pulse cycle. Since OSI gives a positive value irrespective ofthe sign of the WSS, it is modified by removing the modulus inEq. �6� in order to distinguish the regions of positive and negative
Fig. 2 Pulse cycles from basal to hyperemicblood viscosity with shear rate „Cho and Kens
WSS
Journal of Biomechanical Engineering
ded 27 Sep 2010 to 129.137.198.196. Redistribution subject to ASM
MOSI =
0
t
�wdt
0
t
��w�dt
�7�
modified oscillatory shear index �MOSI� value of 1 implies a posi-tive WSS during the entire cardiac cycle; 0 implies that both posi-tive and negative shear stress are equal in magnitude; and −1implies a negative shear stress during the entire cardiac cycle.Thus MOSI helps in identifying the zones of recirculation whichhave negative WSS values.
2.5 Boundary Conditions. To model the worst case flow sce-nario at the entrance region of the artery, a time-varying pulse�Fig. 2�A�� with a uniform spatial variation of velocity boundarycondition is imposed at the inlet with a user-defined subroutineprogrammed in programming language “C.” The uniform velocityboundary condition simulated the worst scenario, providing maxi-mum shear stress at the wall. Thus, the present model evaluates
ws; S-systole, D-diastole „A… and variation of†19‡… „B…
floey
the effect of entrance flow where the stent is being deployed at the
JUNE 2006, Vol. 128 / 349
E license or copyright; see http://www.asme.org/terms/Terms_Use.cfm

Downloa
origin of a branched coronary artery. No-slip boundary conditionis specified on the wall which makes all flow velocity componentsequal to zero. Considering the diseased condition of the coronaryartery, the wall is specified to be rigid �Nicholas and O’Rourke�20��. At the outlet, zero gauge pressure boundary condition isapplied.
2.6 Finite Volume Method. The finite volume mesh �Fig.3�A�� was generated in Gambit 2.1.0 using the Cooper schemewith �650,000 cells of hexahedral elements. In order to mesh thedeployed stent, the flow domain was subdivided into two indepen-dent regions with non-conformal interfaces between them. Thetwo independent regions are the core lumen zone and the outerring zone containing the stent cross-links. The two regions weremerged at the common interface through advanced mesh interpo-lation scheme. Equations �1�–�5� were solved using finite volumemethod �21�. Three-dimensional double precision, segregated andlaminar solver was used with second-order time implicit schemeemployed to discretize the governing equations. Yongchareon andYoung �22� have given the value of critical Reynolds number,Recritical=2384� �rm /re�2, for the initiation of turbulence in mod-els of arterial stenoses which was consistent with the data of
Fig. 3 Finite volume mesh of stented arte
Azuma and Fukushima �23�. Using this equation, the local ap-
350 / Vol. 128, JUNE 2006
ded 27 Sep 2010 to 129.137.198.196. Redistribution subject to ASM
proximation of Recritical number is 1791 for the present study,where rm=re−rh, lumen radius, re=1.5 mm and exposed height ofstrut, rh=0.2 mm. Based on these experimental observations andRecritical value, laminar flow solver was believed to be adequate todescribe the pulsatile blood flow field during hyperemic flow con-ditions for which Repeak=800. Under-relaxation factors of 0.3 forpressure, 1 for density, and 0.7 for momentum were used. Secondorder discretization was followed for pressure with a simple algo-rithm chosen for pressure-velocity coupling. A second order up-wind scheme was adapted for discretization of momentum. Con-vergence criterion for continuity and velocity residuals was kept at10−4, an order of magnitude lower than a recommended value.Adaptive time stepping methodology was used for the iterations.Depending upon the velocity pulse shape, the time steps variedbetween 10−3 and 10−4 s.
Mesh independency was checked by increasing the number ofelements by 20% over the previous mesh and both the resultswere compared. The mesh with increased number of elementsshowed less than 1% difference in velocity and WSS values.Computations were conducted on a RED HAT LINUX �Version 7.3�workstation with dual Intel �Xeon IV� 2.4 GHz processors with
„A… and validation of wall shear stress „B…
ry1.0 GB random access memory and 80 GB hard disk. Simulations
Transactions of the ASME
E license or copyright; see http://www.asme.org/terms/Terms_Use.cfm
Downloa
were run for four different time averaged �mean� flow rates, Q̃=50 �basal flow rate�, 100, 150 and 200 mL/min �hyperemic flow
rate�. The mean flow Reynolds number range was, R̃e=108−430 and frequency parameter, =2.32. Typical computationalrun time for a single simulation to complete was five days.
The numerical computation was conducted for three consecu-tive pulse cycles with a pulse time period �T� of 0.8 s. With thedifference in velocity, wall shear stress and pressure values be-tween second and third cycle being less than 3%, the computationfor the third cycle was considered to be accurate. The results arereported for the third cycle �1.6–2.4 s�. The velocity profiles areshown at specific time points: 1.86 s, the early acceleration phase�uin=0.5uinmax
�; 2.00 s, the peak flow �uin=uinmax�; 2.16 s, the
early deceleration phase of the cycle �uin=0.75uinmax� and 2.30 s,
the late deceleration phase of the cycle �uin=0.25uinmax�.
2.7 Validation. WSS data of the present study �coronarystent: d=0.3 cm, upeak=22.8 cm/s, Repeak=208� is validated withthe recent study by LaDisa et al. �13� �coronary stent: d=0.274 cm, uavg=22.5 cm/s, Reavg=177�. Figure 3�B� shows thecomparison of WSS at the four strut intersections of the stent.Also, WSS for a developing flow in an unstented artery �smoothwall� of diameter, d=0.3 cm, upeak=22.8 cm/s and Repeak=208 issuperimposed to evaluate the difference in WSS with a stentedartery. Due to the developing nature of the flow at the entranceregion of the artery and deployed stent, the WSS at strut intersec-tion 1 is 108 dyn/cm2, which is about twice that of the developedflow �LaDisa et al. �13��. As the flow develops, the WSS valuedecreases rapidly and the percentage variation in the stress valuesbetween the present study and the work of LaDisa et al. �13� is12% at strut intersection 2, 2.2% at strut intersection 3, and 0.1%at strut intersection 4. Thus, this study validates the recently pub-lished work by LaDisa et al. �13� within 0.1% for the developedflow. This shows the accuracy of the present results. For the
2
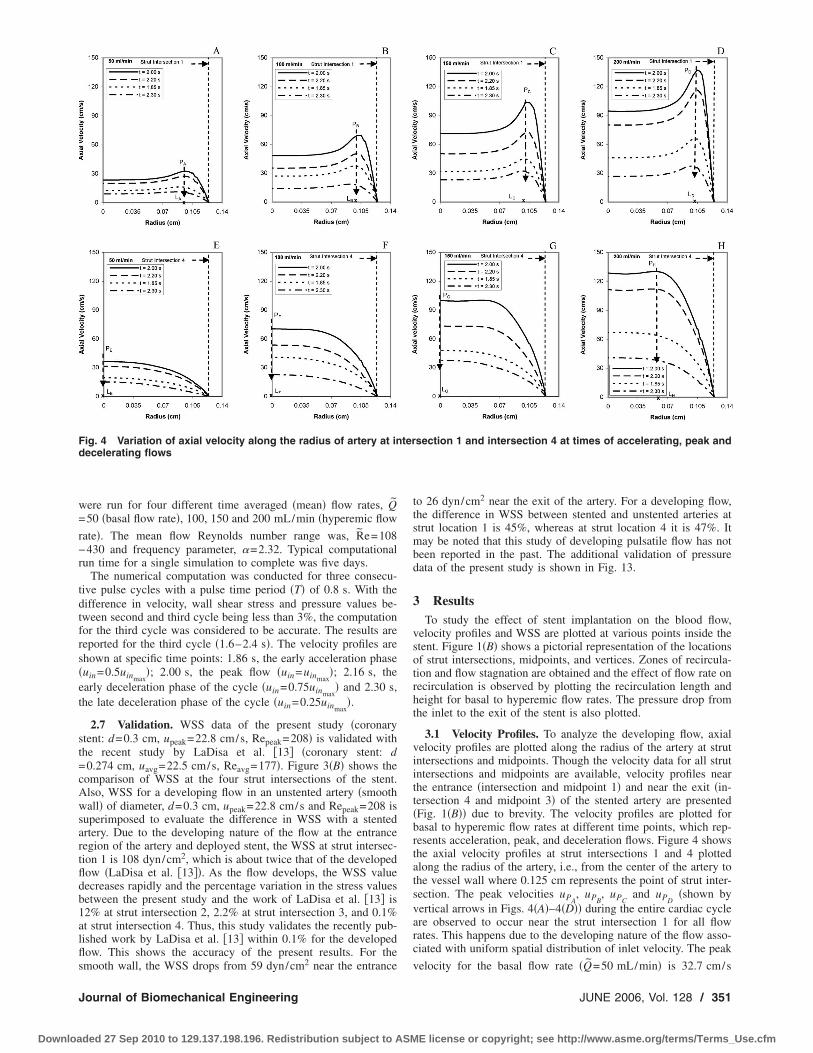
Fig. 4 Variation of axial velocity along the radius of artery at indecelerating flows
smooth wall, the WSS drops from 59 dyn/cm near the entrance
Journal of Biomechanical Engineering
ded 27 Sep 2010 to 129.137.198.196. Redistribution subject to ASM
to 26 dyn/cm2 near the exit of the artery. For a developing flow,the difference in WSS between stented and unstented arteries atstrut location 1 is 45%, whereas at strut location 4 it is 47%. Itmay be noted that this study of developing pulsatile flow has notbeen reported in the past. The additional validation of pressuredata of the present study is shown in Fig. 13.
3 ResultsTo study the effect of stent implantation on the blood flow,
velocity profiles and WSS are plotted at various points inside thestent. Figure 1�B� shows a pictorial representation of the locationsof strut intersections, midpoints, and vertices. Zones of recircula-tion and flow stagnation are obtained and the effect of flow rate onrecirculation is observed by plotting the recirculation length andheight for basal to hyperemic flow rates. The pressure drop fromthe inlet to the exit of the stent is also plotted.
3.1 Velocity Profiles. To analyze the developing flow, axialvelocity profiles are plotted along the radius of the artery at strutintersections and midpoints. Though the velocity data for all strutintersections and midpoints are available, velocity profiles nearthe entrance �intersection and midpoint 1� and near the exit �in-tersection 4 and midpoint 3� of the stented artery are presented�Fig. 1�B�� due to brevity. The velocity profiles are plotted forbasal to hyperemic flow rates at different time points, which rep-resents acceleration, peak, and deceleration flows. Figure 4 showsthe axial velocity profiles at strut intersections 1 and 4 plottedalong the radius of the artery, i.e., from the center of the artery tothe vessel wall where 0.125 cm represents the point of strut inter-section. The peak velocities uPA
, uPB, uPC
and uPD�shown by
vertical arrows in Figs. 4�A�–4�D�� during the entire cardiac cycleare observed to occur near the strut intersection 1 for all flowrates. This happens due to the developing nature of the flow asso-ciated with uniform spatial distribution of inlet velocity. The peak
˜
section 1 and intersection 4 at times of accelerating, peak and
tervelocity for the basal flow rate �Q=50 mL/min� is 32.7 cm/s
JUNE 2006, Vol. 128 / 351
E license or copyright; see http://www.asme.org/terms/Terms_Use.cfm
Downloa
which is observed near the strut intersection at t=2.00 s �Fig.
4�A��. As expected for hyperemic flow rate �Q̃=200 mL/min�, thepeak velocity is four times that of basal flow rate �uPD
=4uPA�.
Also, the mean velocity of 99.9 cm/s for hyperemic flow rate isfound to be four times the mean velocity of 24.8 cm/s for basalflow rate. The location of peak velocity, measured from the cen-terline of the artery lumen for basal flow rate, is at 0.096 cm �LArepresented by “x” symbol in Fig. 4�A��. As the flow rate in-creases, the location of peak velocity shifts towards the wall �LA
�LB�LC�LD� showing a sharper velocity gradient near the strutintersection, which creates a higher WSS as flow rate increased.
As the flow develops from strut intersection 1 to strut intersec-tion 2 �not shown here�, there is an average decrease of 5% inpeak velocity. The peak velocity during the entire cardiac cycleoccurs near the strut intersection except for basal flow rate wherethe peak velocity occurs at the center �X axis� of the artery. Thevelocity profile almost becomes parabolic for basal flow, showingthat the flow gets developed from strut intersection 1 to 2. Similarto strut intersection 1, increase in peak velocity and shift in loca-tion of peak velocity towards the wall from basal to hyperemicflow rates is observed at strut intersection 2. The location of peakvelocity shifts towards the center as the flow proceeds from strutintersection 1 to 2 showing an average decrease of 50% in thevelocity gradient, which leads to the reduction of WSS from strutintersection 1 to 2.
As the flow further develops to the strut intersection 3 �notshown here�, the velocity profile becomes parabolic for 100 and50 mL/min flow rates where the peak velocity occurs at the centerof the artery. For lower flow rates, the flow gets developed earlieralong the axial distance as the inlet velocities are low for basalflow as compared to hyperemic flow. The flow at strut intersection3 is not completely developed for 150 and 200 mL/min flow rateswhere the peak velocity still occurs near the strut intersection.There is an average increase of 4% in peak velocity showing thatthe flow is developing from strut intersection 2 to 3. The location
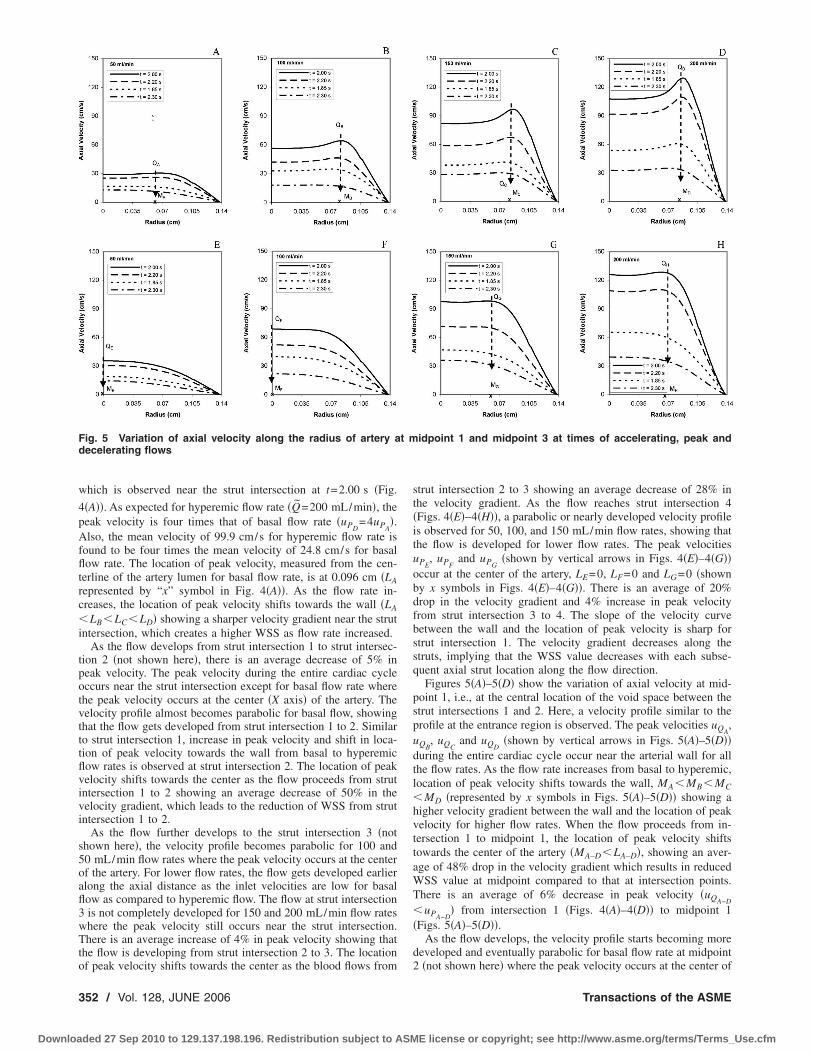
Fig. 5 Variation of axial velocity along the radius of artery adecelerating flows
of peak velocity shifts towards the center as the blood flows from
352 / Vol. 128, JUNE 2006
ded 27 Sep 2010 to 129.137.198.196. Redistribution subject to ASM
strut intersection 2 to 3 showing an average decrease of 28% inthe velocity gradient. As the flow reaches strut intersection 4�Figs. 4�E�–4�H��, a parabolic or nearly developed velocity profileis observed for 50, 100, and 150 mL/min flow rates, showing thatthe flow is developed for lower flow rates. The peak velocitiesuPE
, uPFand uPG
�shown by vertical arrows in Figs. 4�E�–4�G��occur at the center of the artery, LE=0, LF=0 and LG=0 �shownby x symbols in Figs. 4�E�–4�G��. There is an average of 20%drop in the velocity gradient and 4% increase in peak velocityfrom strut intersection 3 to 4. The slope of the velocity curvebetween the wall and the location of peak velocity is sharp forstrut intersection 1. The velocity gradient decreases along thestruts, implying that the WSS value decreases with each subse-quent axial strut location along the flow direction.
Figures 5�A�–5�D� show the variation of axial velocity at mid-point 1, i.e., at the central location of the void space between thestrut intersections 1 and 2. Here, a velocity profile similar to theprofile at the entrance region is observed. The peak velocities uQA
,uQB
, uQCand uQD
�shown by vertical arrows in Figs. 5�A�–5�D��during the entire cardiac cycle occur near the arterial wall for allthe flow rates. As the flow rate increases from basal to hyperemic,location of peak velocity shifts towards the wall, MA�MB�MC�MD �represented by x symbols in Figs. 5�A�–5�D�� showing ahigher velocity gradient between the wall and the location of peakvelocity for higher flow rates. When the flow proceeds from in-tersection 1 to midpoint 1, the location of peak velocity shiftstowards the center of the artery �MA–D�LA–D�, showing an aver-age of 48% drop in the velocity gradient which results in reducedWSS value at midpoint compared to that at intersection points.There is an average of 6% decrease in peak velocity �uQA−D
�uPA−D� from intersection 1 �Figs. 4�A�–4�D�� to midpoint 1
�Figs. 5�A�–5�D��.As the flow develops, the velocity profile starts becoming more
developed and eventually parabolic for basal flow rate at midpoint
idpoint 1 and midpoint 3 at times of accelerating, peak and
t m2 �not shown here� where the peak velocity occurs at the center of
Transactions of the ASME
E license or copyright; see http://www.asme.org/terms/Terms_Use.cfm
Downloa
the artery. For all other flow rates, the peak velocity occurs nearthe arterial wall. The location of peak velocity shifts towards thecenter of the artery from midpoint 1 to 2 showing an average of28% drop in the velocity gradient. There is an average increase of4% in peak velocity from midpoints 1 to 2. As the flow reachesthe midpoint 3, a smoother parabolic velocity profile is seen for 50and 100 mL/min flow rates at midpoint 3 �Figs. 5�E� and 5�F��showing that the flow is developed and near parabolic where thepeak velocities uQE
and uQF�shown by vertical arrows� at the
center, ME=0 and MF=0 �shown by x symbols in Figs. 5�E� and5�F��. The location of peak velocity shifts towards the center ofthe artery as the flow proceeds from midpoint 2 to 3 showing anaverage of 23% drop in the velocity gradient. There is an averageincrease of 3.7% in peak velocity from midpoints 2 to 3. Thedeveloping flow profile is clearly seen from the entrance region ofthe stented artery where the maximum peak velocity occurs nearthe strut intersection, whereas at the strut intersection 4, the ve-locity profile is more developed and near parabolic.
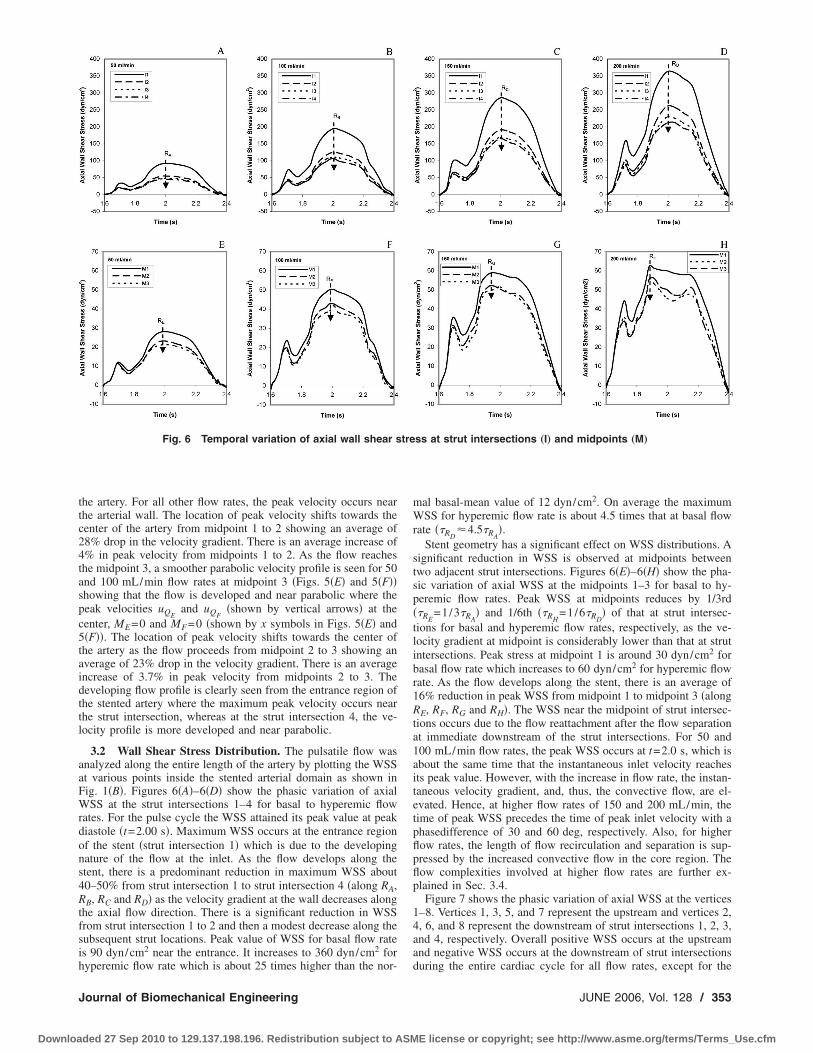
3.2 Wall Shear Stress Distribution. The pulsatile flow wasanalyzed along the entire length of the artery by plotting the WSSat various points inside the stented arterial domain as shown inFig. 1�B�. Figures 6�A�–6�D� show the phasic variation of axialWSS at the strut intersections 1–4 for basal to hyperemic flowrates. For the pulse cycle the WSS attained its peak value at peakdiastole �t=2.00 s�. Maximum WSS occurs at the entrance regionof the stent �strut intersection 1� which is due to the developingnature of the flow at the inlet. As the flow develops along thestent, there is a predominant reduction in maximum WSS about40–50% from strut intersection 1 to strut intersection 4 �along RA,RB, RC and RD� as the velocity gradient at the wall decreases alongthe axial flow direction. There is a significant reduction in WSSfrom strut intersection 1 to 2 and then a modest decrease along thesubsequent strut locations. Peak value of WSS for basal flow rateis 90 dyn/cm2 near the entrance. It increases to 360 dyn/cm2 for
Fig. 6 Temporal variation of axial wall shear s
hyperemic flow rate which is about 25 times higher than the nor-
Journal of Biomechanical Engineering
ded 27 Sep 2010 to 129.137.198.196. Redistribution subject to ASM
mal basal-mean value of 12 dyn/cm2. On average the maximumWSS for hyperemic flow rate is about 4.5 times that at basal flowrate ��RD
4.5�RA�.
Stent geometry has a significant effect on WSS distributions. Asignificant reduction in WSS is observed at midpoints betweentwo adjacent strut intersections. Figures 6�E�–6�H� show the pha-sic variation of axial WSS at the midpoints 1–3 for basal to hy-peremic flow rates. Peak WSS at midpoints reduces by 1/3rd��RE
=1/3�RA� and 1/6th ��RH
=1/6�RD� of that at strut intersec-
tions for basal and hyperemic flow rates, respectively, as the ve-locity gradient at midpoint is considerably lower than that at strutintersections. Peak stress at midpoint 1 is around 30 dyn/cm2 forbasal flow rate which increases to 60 dyn/cm2 for hyperemic flowrate. As the flow develops along the stent, there is an average of16% reduction in peak WSS from midpoint 1 to midpoint 3 �alongRE, RF, RG and RH�. The WSS near the midpoint of strut intersec-tions occurs due to the flow reattachment after the flow separationat immediate downstream of the strut intersections. For 50 and100 mL/min flow rates, the peak WSS occurs at t=2.0 s, which isabout the same time that the instantaneous inlet velocity reachesits peak value. However, with the increase in flow rate, the instan-taneous velocity gradient, and, thus, the convective flow, are el-evated. Hence, at higher flow rates of 150 and 200 mL/min, thetime of peak WSS precedes the time of peak inlet velocity with aphasedifference of 30 and 60 deg, respectively. Also, for higherflow rates, the length of flow recirculation and separation is sup-pressed by the increased convective flow in the core region. Theflow complexities involved at higher flow rates are further ex-plained in Sec. 3.4.
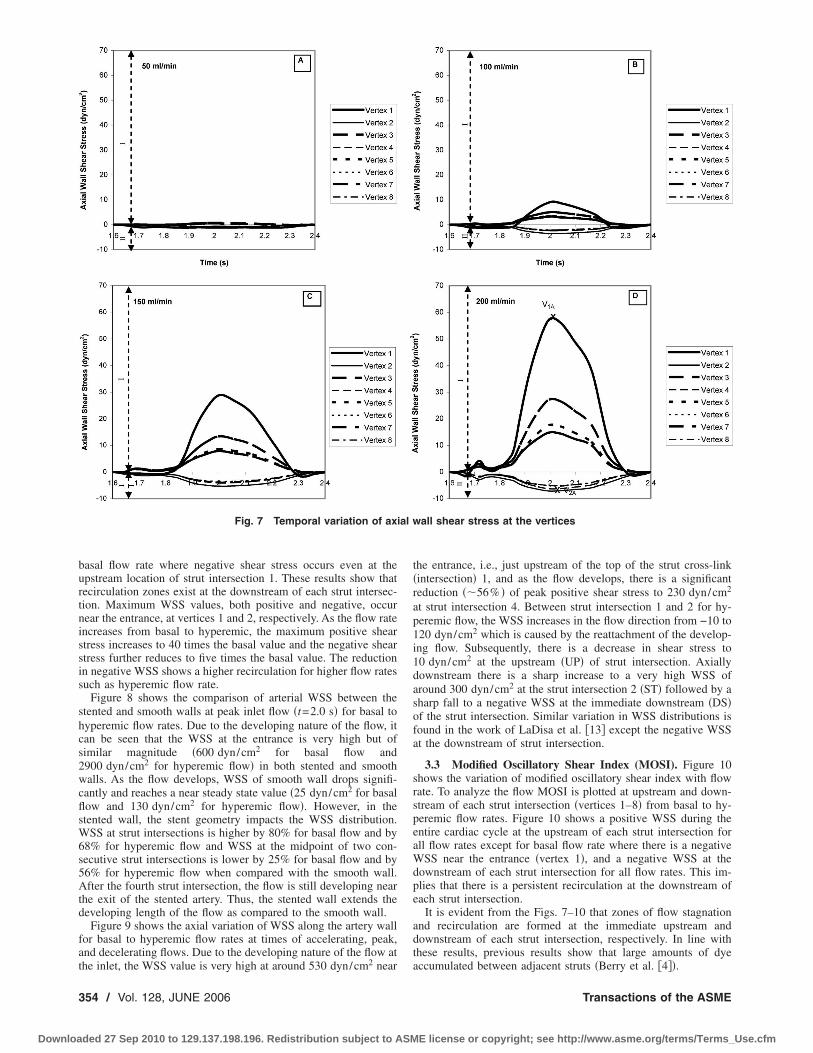
Figure 7 shows the phasic variation of axial WSS at the vertices1–8. Vertices 1, 3, 5, and 7 represent the upstream and vertices 2,4, 6, and 8 represent the downstream of strut intersections 1, 2, 3,and 4, respectively. Overall positive WSS occurs at the upstreamand negative WSS occurs at the downstream of strut intersections
ss at strut intersections „I… and midpoints „M…
treduring the entire cardiac cycle for all flow rates, except for the
JUNE 2006, Vol. 128 / 353
E license or copyright; see http://www.asme.org/terms/Terms_Use.cfm
Downloa
basal flow rate where negative shear stress occurs even at theupstream location of strut intersection 1. These results show thatrecirculation zones exist at the downstream of each strut intersec-tion. Maximum WSS values, both positive and negative, occurnear the entrance, at vertices 1 and 2, respectively. As the flow rateincreases from basal to hyperemic, the maximum positive shearstress increases to 40 times the basal value and the negative shearstress further reduces to five times the basal value. The reductionin negative WSS shows a higher recirculation for higher flow ratessuch as hyperemic flow rate.
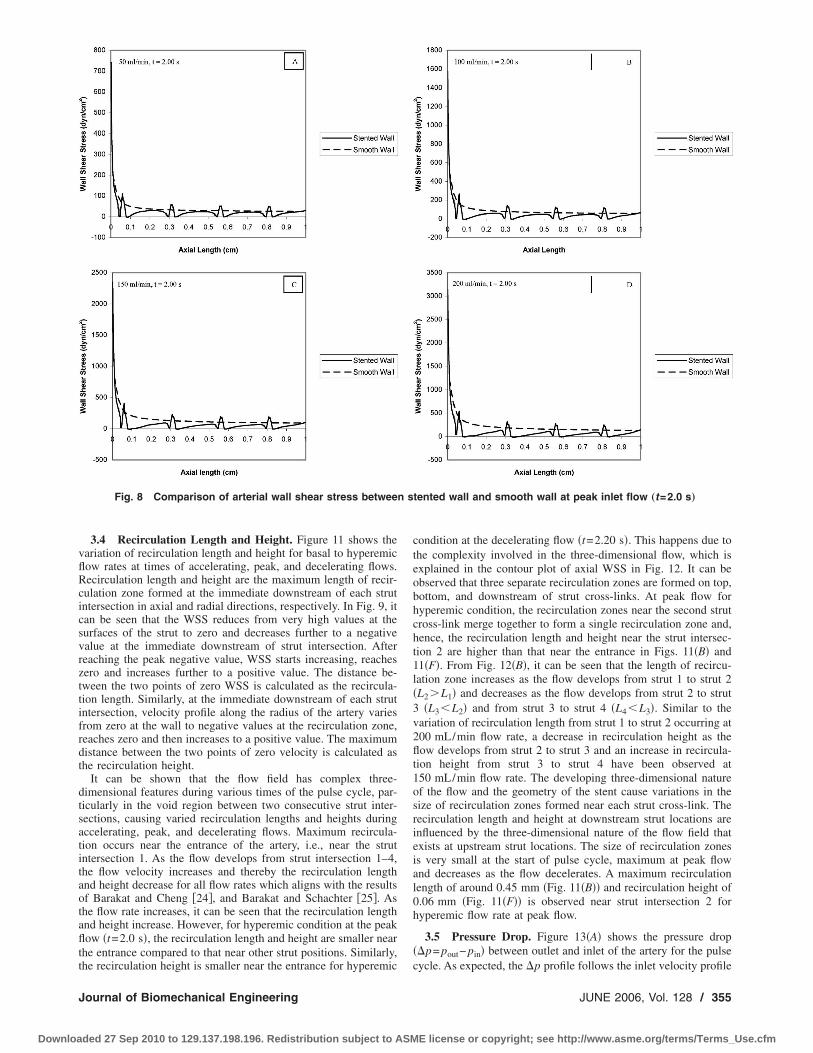
Figure 8 shows the comparison of arterial WSS between thestented and smooth walls at peak inlet flow �t=2.0 s� for basal tohyperemic flow rates. Due to the developing nature of the flow, itcan be seen that the WSS at the entrance is very high but ofsimilar magnitude �600 dyn/cm2 for basal flow and2900 dyn/cm2 for hyperemic flow� in both stented and smoothwalls. As the flow develops, WSS of smooth wall drops signifi-cantly and reaches a near steady state value �25 dyn/cm2 for basalflow and 130 dyn/cm2 for hyperemic flow�. However, in thestented wall, the stent geometry impacts the WSS distribution.WSS at strut intersections is higher by 80% for basal flow and by68% for hyperemic flow and WSS at the midpoint of two con-secutive strut intersections is lower by 25% for basal flow and by56% for hyperemic flow when compared with the smooth wall.After the fourth strut intersection, the flow is still developing nearthe exit of the stented artery. Thus, the stented wall extends thedeveloping length of the flow as compared to the smooth wall.
Figure 9 shows the axial variation of WSS along the artery wallfor basal to hyperemic flow rates at times of accelerating, peak,and decelerating flows. Due to the developing nature of the flow at
2
Fig. 7 Temporal variation of axi
the inlet, the WSS value is very high at around 530 dyn/cm near
354 / Vol. 128, JUNE 2006
ded 27 Sep 2010 to 129.137.198.196. Redistribution subject to ASM
the entrance, i.e., just upstream of the top of the strut cross-link�intersection� 1, and as the flow develops, there is a significantreduction ��56% � of peak positive shear stress to 230 dyn/cm2
at strut intersection 4. Between strut intersection 1 and 2 for hy-peremic flow, the WSS increases in the flow direction from −10 to120 dyn/cm2 which is caused by the reattachment of the develop-ing flow. Subsequently, there is a decrease in shear stress to10 dyn/cm2 at the upstream �UP� of strut intersection. Axiallydownstream there is a sharp increase to a very high WSS ofaround 300 dyn/cm2 at the strut intersection 2 �ST� followed by asharp fall to a negative WSS at the immediate downstream �DS�of the strut intersection. Similar variation in WSS distributions isfound in the work of LaDisa et al. �13� except the negative WSSat the downstream of strut intersection.
3.3 Modified Oscillatory Shear Index (MOSI). Figure 10shows the variation of modified oscillatory shear index with flowrate. To analyze the flow MOSI is plotted at upstream and down-stream of each strut intersection �vertices 1–8� from basal to hy-peremic flow rates. Figure 10 shows a positive WSS during theentire cardiac cycle at the upstream of each strut intersection forall flow rates except for basal flow rate where there is a negativeWSS near the entrance �vertex 1�, and a negative WSS at thedownstream of each strut intersection for all flow rates. This im-plies that there is a persistent recirculation at the downstream ofeach strut intersection.
It is evident from the Figs. 7–10 that zones of flow stagnationand recirculation are formed at the immediate upstream anddownstream of each strut intersection, respectively. In line withthese results, previous results show that large amounts of dye
wall shear stress at the vertices
alaccumulated between adjacent struts �Berry et al. �4��.
Transactions of the ASME
E license or copyright; see http://www.asme.org/terms/Terms_Use.cfm
Downloa
3.4 Recirculation Length and Height. Figure 11 shows thevariation of recirculation length and height for basal to hyperemicflow rates at times of accelerating, peak, and decelerating flows.Recirculation length and height are the maximum length of recir-culation zone formed at the immediate downstream of each strutintersection in axial and radial directions, respectively. In Fig. 9, itcan be seen that the WSS reduces from very high values at thesurfaces of the strut to zero and decreases further to a negativevalue at the immediate downstream of strut intersection. Afterreaching the peak negative value, WSS starts increasing, reacheszero and increases further to a positive value. The distance be-tween the two points of zero WSS is calculated as the recircula-tion length. Similarly, at the immediate downstream of each strutintersection, velocity profile along the radius of the artery variesfrom zero at the wall to negative values at the recirculation zone,reaches zero and then increases to a positive value. The maximumdistance between the two points of zero velocity is calculated asthe recirculation height.
It can be shown that the flow field has complex three-dimensional features during various times of the pulse cycle, par-ticularly in the void region between two consecutive strut inter-sections, causing varied recirculation lengths and heights duringaccelerating, peak, and decelerating flows. Maximum recircula-tion occurs near the entrance of the artery, i.e., near the strutintersection 1. As the flow develops from strut intersection 1–4,the flow velocity increases and thereby the recirculation lengthand height decrease for all flow rates which aligns with the resultsof Barakat and Cheng �24�, and Barakat and Schachter �25�. Asthe flow rate increases, it can be seen that the recirculation lengthand height increase. However, for hyperemic condition at the peakflow �t=2.0 s�, the recirculation length and height are smaller nearthe entrance compared to that near other strut positions. Similarly,
Fig. 8 Comparison of arterial wall shear stress between
the recirculation height is smaller near the entrance for hyperemic
Journal of Biomechanical Engineering
ded 27 Sep 2010 to 129.137.198.196. Redistribution subject to ASM
condition at the decelerating flow �t=2.20 s�. This happens due tothe complexity involved in the three-dimensional flow, which isexplained in the contour plot of axial WSS in Fig. 12. It can beobserved that three separate recirculation zones are formed on top,bottom, and downstream of strut cross-links. At peak flow forhyperemic condition, the recirculation zones near the second strutcross-link merge together to form a single recirculation zone and,hence, the recirculation length and height near the strut intersec-tion 2 are higher than that near the entrance in Figs. 11�B� and11�F�. From Fig. 12�B�, it can be seen that the length of recircu-lation zone increases as the flow develops from strut 1 to strut 2�L2 L1� and decreases as the flow develops from strut 2 to strut3 �L3�L2� and from strut 3 to strut 4 �L4�L3�. Similar to thevariation of recirculation length from strut 1 to strut 2 occurring at200 mL/min flow rate, a decrease in recirculation height as theflow develops from strut 2 to strut 3 and an increase in recircula-tion height from strut 3 to strut 4 have been observed at150 mL/min flow rate. The developing three-dimensional natureof the flow and the geometry of the stent cause variations in thesize of recirculation zones formed near each strut cross-link. Therecirculation length and height at downstream strut locations areinfluenced by the three-dimensional nature of the flow field thatexists at upstream strut locations. The size of recirculation zonesis very small at the start of pulse cycle, maximum at peak flowand decreases as the flow decelerates. A maximum recirculationlength of around 0.45 mm �Fig. 11�B�� and recirculation height of0.06 mm �Fig. 11�F�� is observed near strut intersection 2 forhyperemic flow rate at peak flow.
3.5 Pressure Drop. Figure 13�A� shows the pressure drop��p= pout− pin� between outlet and inlet of the artery for the pulse
tented wall and smooth wall at peak inlet flow „t=2.0 s…
scycle. As expected, the �p profile follows the inlet velocity profile
JUNE 2006, Vol. 128 / 355
E license or copyright; see http://www.asme.org/terms/Terms_Use.cfm

Downloa
with a maximum phase shift of 14 deg at peak systole and 20 degat peak diastole. The existence of the stent causes the minimumpressure drop to be −0.55 mm Hg for basal flow rate and around−4 mm Hg for hyperemic flow rate at peak flow �t=2.0 s�. Thereis a positive �p occurring at the end �time=2.4 s� of the pulsecycle because of the flow reversal occurring near the arterial andstent wall regions. Integration of �p�t� over the pulse cycle pro-vides the time averaged �mean� pressure drop which is shown bythe horizontal lines. Each horizontal line shows the �p̃ for eachflow rate. The mean pressure drop-flow rate relation is shown in
Fig. 9 Axial variation of wall shear stress along the arter
Fig. 10 Variation of modified oscillatory shear index „MOSI…
with flow rate at vertices356 / Vol. 128, JUNE 2006
ded 27 Sep 2010 to 129.137.198.196. Redistribution subject to ASM
Fig. 13�B�. The �p̃ for the basal flow rate is 0.28 mm Hg and thevalue increases up to 1.79 mm Hg for hyperemic flow rate �afactor of 6.4 higher�. Stent wall roughness values ��p̃� are about60% higher than ��ps� for the entrance region for steady flowthrough a smooth wall segment �diameter: 3 mm and length:10 mm� over the flow rate range as shown in Fig. 13�B�. The �p̃values for developing pulsatile flow through smooth wall areabout 10% higher than that of steady flow through smooth wall.
4 DiscussionThe current study presents a new and improved set of data for a
three-dimensional hemodynamic analysis of pulsatile blood flowin a deployed coronary stent. The present investigation is differentfrom the previous investigations as it is conducted by applying auniform spatial inlet velocity boundary condition using a user-defined subroutine to provide a limiting condition for calculatedflow parameters. Thus, the effect of developing flow where thestent being placed at the entrance region of a branched coronaryartery is evaluated. The present results illustrate the changes inWSS distribution which lead to the formation of three-dimensional complex recirculation zones that may lead to resteno-sis. Very high values of WSS are observed over the surfaces ofstent struts. Past studies report that the WSS reaching a value of20 dyn/cm2 over a short span depict a rapid increase in the plate-lets level of activation and lead to free emboli formation�Bluestein et al. �26��. The present results show very high WSSvalue of 530 dyn/cm2 at the entrance of the stent which mighthave a profound impact on the arterial wall such as high level ofplatelet aggregation and free emboli formation.
WSS decreased with each subsequent strut and low WSS of2
all at times of accelerating, peak and decelerating flows
y w10 dyn/cm is observed at the upstream of each strut intersection
Transactions of the ASME
E license or copyright; see http://www.asme.org/terms/Terms_Use.cfm

Downloa
which may represent zones of flow stagnation. Negative WSS ofaround 10 dyn/cm2 is observed near the strut cross-links. Theseportions of the vessel where there are low and negative WSS mayrepresent locations of blood stagnation, which are susceptible tothrombus formation, platelet accumulation, smooth muscle cellproliferation and restenosis. These indicate that the immediatedownstream of each strut intersection may be prone to restenosis.Considering a complex three-dimensional flow structure withinthe cross-links of the struts, the left and the right side of each
Fig. 11 Variation of recirculation length and height along th
Fig. 12 Contour plot of axial wall shear stres
condition „200 mL/min… at times of accelerating,Journal of Biomechanical Engineering
ded 27 Sep 2010 to 129.137.198.196. Redistribution subject to ASM
cross-link also shows a persistent recirculation region. These find-ings have not been reported by other researchers in the past.
The presence of stent struts not only increases the WSS to avery high peak value but also leads to the formation of a recircu-lation zone at the immediate downstream of strut intersection. Paststudies suggest that alterations in local WSS distributions insidethe vessel may affect the endothelial cell response, an importantcomponent of intimal hyperplasia �Edelman and Rogers �12��. In-timal hyperplasia had been noted at the proximal and distal ends
struts at times of accelerating, peak and decelerating flows
howing the recirculation zones for hyperemic
e
s s
peak and decelerating flowsJUNE 2006, Vol. 128 / 357
E license or copyright; see http://www.asme.org/terms/Terms_Use.cfm

Downloa
of implanted stents which leads to a qualitative conclusion thataltered distributions of WSS may be a contributing factor to res-tenosis. Barakat and Cheng �24�, and Barakat and Schachter �25�have shown that the zones of flow separation and flow recircula-tion have low wall shear stress values and the flow recirculationlength increases with flow Reynolds number and stent wire thick-ness. Caro et al. �27� and Nerem and Levesque �28� have shownthat recirculation zones of low shear stresses are susceptible to thedeposition of macromolecules and other lipid derivatives. The re-sults from the present study support the contention that stent ge-ometry following deployment alters the WSS distributions, whichin turn, may represent one of the contributing factors to restenosis.
The limitation of the present study is that it is carried out for a
Fig. 13 Pressure drop along the stent for adeveloping time-averaged mean pressure drsteady state developing flow in an unstented
straight rigid artery. However, the coronary arteries are curved
358 / Vol. 128, JUNE 2006
ded 27 Sep 2010 to 129.137.198.196. Redistribution subject to ASM
and, hence, there might be alterations in WSS distributions due tocentrifugal acceleration. As reported in several previous studies,diseased coronary arteries behave as rigid tubes and, thus, theimpact of either compliant arterial wall or compliance mismatchhas been ignored. To delineate the effects of compliance and com-pliance mismatch, further investigations are needed. There couldbe shear instabilities and vortical cells occurring inside the arterydue to the presence of struts which need to be investigated indepth. Also, stent implantation resulting in residual stenosis re-quires investigation. Currently, clinicians use stents of improveddesigns than that used in the present study. As stent design is astrong risk factor of restenosis, flow through the improved stents
lse cycle „A… and a comparison between afor a deployed stent and smooth wall andonary artery of same size „B…
puopcor
needs to be evaluated.
Transactions of the ASME
E license or copyright; see http://www.asme.org/terms/Terms_Use.cfm
Downloa
Nomenclatured � vessel diameter, cmp � static pressure, mm Hg
�p � pressure drop, �pout− pin�, mm Hg
Q̃ � mean flow rate, mL/minr � radial distance from the vessel axis, cm
R̃e � mean-flow Reynolds number, �4Q̃ /�d�t � time, su � axial velocity, cm/sv � velocity vector, cm/sZ � axial distance, cm � frequency parameter, �d /2��� /�0.5
�̇ � shear rate, s−1
�̇ij � rate of strain tensor, s−1
� � molecular viscosity, poise� � blood viscosity, poise � kinematic viscosity, � /�, cm2/s� � density, g /cm3
� � wall shear stress �WSS�, dyn/cm2
�� � stress tensor, dyn/cm2
T � period of cardiac cycle, s� � circular frequency, 2� /T, s−1
Subscriptsavg � spatial average
in � inlet of arteryout � outlet of artery
peak � peak of cardiac cyclew � wall condition
Superscript� � time average �mean over cardiac cycle�
References�1� Heart and Stroke Statistical Update, 2001, American Heart Association, pp.
1–33.�2� Kastrati, A., and Mehilli, J., et al., 2001, “Restenosis After Coronary Place-
ment of Various Stent Types,” Am. J. Cardiol., 87, pp. 34–39.�3� Kastrati, A., and Mehilli, J., et al., 2001, “Intracoronary Stenting and Angio-
graphic Results: Strut Thickness Effect on Restenosis Outcome �ISAR-STEREO� Trial,” Circulation, 103�23�, pp. 2816–2821.
�4� Berry, J. L., Santamarina, A., Moore, J. E., Roychowdhury, S., and Routh, W.D., 2000, “Experimental and Computational Flow Evaluation of CoronaryStents,” Ann. Biomed. Eng., 28, pp. 386–398.
�5� Moore, J. E., and Berry, J. L., 2002, “Fluid and Solid Mechanical Implicationsof Vascular Stenting,” Ann. Biomed. Eng., 30, pp. 498–508.
�6� Frank, A. O., Walsh, P. W., and Moore, J. E., 2002, “Computational FluidDynamics and Stent Design,” Artif. Organs, 26�7�, pp. 614–621.
�7� Henry, F. S., 2001, “Simulation of Flow Through Model Stented Arteries,”Proceedings of the Summer Bioengineering Conference, June 27–July 1,Snowbird, Utah, BED-50, pp. 329–330.
�8� Wentzel, J. J., Krams, R., Schuurbiers, J. C. H., Oomen, J. A., Kloet, J., vander Giesen, W. J., Serruys, P. W., and Slager, C. J., 2001, “Relationship Be-
tween Neointimal Thickness and Shear Stress After Wallstent Implantation inJournal of Biomechanical Engineering
ded 27 Sep 2010 to 129.137.198.196. Redistribution subject to ASM
Human Coronary Arteries,” Circulation, 103�13�, pp. 1740–1745.�9� Wentzel, J. J., Deirdre, M. W., Van der Giesen, W. J., van Beusekom, H. M.
M., Andhyiswara, I., Serruys, P. W., Slager, C. J., and Krams, R., 2000, “Coro-nary Stent Implantation Changes 3-D Vessel Geometry and 3-D Shear StressDistribution,” J. Biomech., 33, pp. 1287–1295.
�10� Berry, J. L., Moore, J. E., Manoach, E., and Rolland, P. H., 2002, “Hemody-namics and Wall Mechanics of a Compliance Matching Stent: In Vitro and InVivo Analysis,” J. Vasc. Interv Radiol., 13, pp. 97–105.
�11� Rogers, C., and Edelman, E. R., 1995, “Endovascular Stent Design DictatesExperimental Restenosis and Thrombosis,” Circulation, 91, pp. 2995–3001.
�12� Edelman, E. R., and Rogers, C., 1998. “Pathobiologic Responses to Stenting,”Am. J. Cardiol., 81�7A�, pp. 4E–6E.
�13� LaDisa, J. F., Guler, I., Olson, L. E., Hettrick, D. A., Kersten, J. R., Warltier,D. C., and Pagel, P. S., 2003, “Three-Dimensional Computational Fluid Dy-namics Modeling of Alterations in Coronary Wall Shear Stress Produced byStent Implantation,” Ann. Biomed. Eng., 31, pp. 972–980.
�14� Suo, J., Oshinski, J., and Giddens, D., 2003, “Entrance Flow Patterns in theCoronary Arteries,” Proceedings of the Summer Bioengineering Conference,June 25–29, Sonesta Beach Resort, Key Biscayne, Florida, BED-50, pp. 513–514.
�15� Cho, Y. I., Back, L. H., Crawford, D. W., and Cuffel, R. F., 1983, “Experi-mental Study of Pulsatile and Steady Flow Through a Smooth Tube and anAtherosclerotic Coronary Artery Casting of Man,” J. Biomech., 16, pp. 933–946.
�16� Sibley, D. H., Millar, H. D., Hartley, C. J., and Whitlow, P. L., 1986, “Subse-lective Measurement of Coronary Blood Flow Velocity Using a Steerable Dop-pler Catheter,” J. Am. Coll. Cardiol., 8, pp. 1332–1340.
�17� Banerjee, R. K., Back, L. H., Back, M. R., and Cho, Y. I., 2000, “PhysiologicalFlow Simulation in Residual Human Stenoses After Coronary Angioplasty,”ASME J. Biomech. Eng., 122�4�, pp. 310–320.
�18� Banerjee, R. K., Back, L. H., and Cho, Y. I., 2001, “Computational FluidDynamics Modeling Techniques, Using Finite Element Methods to PredictArterial Blood Flow,” Biomechanical Systems Techniques & Applications:Biofluid Methods in Vascular and Pulmonary Systems, CRC, Boca Raton, FL,4, Chap. 8.
�19� Cho, Y. I., and Kensey, K. R., 1991, “Effects of the Non-Newtonian Viscosityof Blood on Flows in a Diseased Arterial Vessel: Part I, Steady Flows,”Biorheology, 28, pp. 241–262.
�20� Nicholas, W. W., and O’Rourke, M. F., 1998, McDonald’s Blood Flow inArteries: Theoretical, Experimental and Clinical Principles, Oxford UniversityPress, New York, pp. 396–401.
�21� Fluent User Manual, ver. 6.1.18, 2003, Fluent Inc., Lebanon, NH.�22� Yongchareon, W., and Young, D. F., 1979, “Initiation of Turbulence in Models
of Arterial Stenosis,” J. Biomech., 12, pp. 185–196.�23� Azuma, T., and Fukushima, T., 1976, “Flow Patterns in Stenotic Blood Vessel
Models,” Biorheology, 13, pp. 337–355.�24� Barakat, A. I., and Cheng, E. T., 2000, “Numerical Simulation of Fluid Me-
chanical Disturbance Induced by Intravascular Stents,” Proceedings of the 11thInternational Conference on Mechanics in Medicine and Biology, Maui, Ha-waii, April 2–5.
�25� Barakat, A. I., and Schachter, L. G., 2001, “Computational Study of ArterialFlow Disturbance Induced by Intravascular Stents,” Proceedings of the Sum-mer Bioengineering Conference, June 27–July 1, Snowbird, Utah, BED-50, pp.877–878.
�26� Bluestein, D., Li, Y. M., and Krukenkamp, I. B., 2002, “Free Emboli Forma-tion in the Wake of Bi-leaflet Mechanical Heart Valves and the Effects ofImplantation Techniques,” J. Biomech., 35, pp. 1553–1540.
�27� Caro, C. G., Fitzgerald, J. M., and Schroter, R. C., 1969, “Arterial Wall Shearand Distribution of Early Atheroma in Man,” Nature �London�, 223, pp. 1159–1161.
�28� Nerem, R. M., and Levesque, M. J., 1987, “Fluid Mechanics in Atherosclero-sis,” Handbook of Bioengineering, R. Skalak and S. Chein, eds., Chap. 21,21.1–21.22.
JUNE 2006, Vol. 128 / 359
E license or copyright; see http://www.asme.org/terms/Terms_Use.cfm