department of transportation research - index … · included in this report are detailed...
TRANSCRIPT

Report No. COOT-DTD-R-2000-8
Guidelines for Selection of Rehabilitation Strategies for Asphalt Pavement
Bud A. Brakey, P.E
DEPARTMENT OF TRANSPORTATION
RESEARCH
August 2000

The contents of this report reflect the views of the authors who are responsible for
the facts and accuracy of the data presented herein. The contents do not necessarily
reflect the official views of the Colorado Department of Transportation or the
Federal Highway Administration. This report does not constitute a standard,
specification, or regulation.

Technical Report Documentation Page
1. Report No. 2. Government Accession No. 3. Recipient's Catalog No. CDOT-DTD-R-2000-8
4. Title and Subtitle 5. Report Date Guidelines for Selection of Rehabilitation Strategies August 2000 for Asphalt Pavement
6, Performing Organization Code
7. Author(s) 8. Performing Organization Report No. Bud A. Brakey, P.E. CDOT-DTD-R-2000-8
9. Performing Organization Name and _\ddress 10. Work Unit No. (TRAIS) Bud A. Brakey, P.E. Geotechnical Engineering 2540 E. Floyed Ave. 11. Contract or Grant No.
En"lewood CO 80110 12. Sponsoring Agency Name and Address 13. Type of Report and Period Covered
Colorado Department of Transportation 4201 E. Arkansas Ave. Denver, Colorado 80222 14. Sponsoring Agency Code
15. Supplementary Notes
Prepared in Cooperation with the U.S. Department of Transportation, Federal Highway Administration
16. Abstract
Included in this report are detailed guidelines and decision tables for selecting rehabilitation strategies for asphalt pavements. The author proposes that following the guidelines will reasonably assure the functional lives of rehabilitated asphalt pavements will at least equit their design lives. Recommended rehabilitation strategies are based on degree and type of existing distress and the traffic level. The most pervasive distress, and the most difficnlt to correct, was found to be transverse cracking. Appendix A summarizes the original research study plan findings. Appendix B reports on a satellite study by the author where 21 flexible pavement projects were analyzed using CDOT Pavement Management System condition data. PMS pavement distress categories and indexes, were compared, before and after rehabilitation. The PMS study results significantly contributed to the development of the decision tables.
17. Key Words 18. Distribution Statement Pavement distress, rehabilitation strategy, design life, No restrictions. This document is available to the public
functional life, PMS, Pavement condition index, transverse through: National Technical Information Service. cracking, cracking index. 5825 Port Royal Road
Springfield, Virginia 22161
19. Security Classif. (of this report) 20. Security ClassiC. (of this page) 21. No. of Pages 22. Price
65

Guidelines for Selection of Rehabilitation Strategies for
Asphalt Pavement
by
Bud A. Brakey, P.E.
Report No. CDOT-DTD-R-2000-8
Prepared for Colorado Department of Transportation
Research Branch
August 2000
Colorado Department of Transportation Research Branch
4201 E. Arkansas Ave. Denver, CO 80222
(303) 757-9506
ii

EXECUTIVE SUMMARY
The research report is presented in three sections. The first section is the Guidelines for Selection of
Rehabilitation Strategies for Asphalt Pavements. The second is Appendix A that explains the reasons for
this study and reports the results of the original research Study Plan. The third is Appendix B that reports
on a satellite study added during the progress of the Study.
The Guide
Because a percentage of asphalt pavement overlays in Colorado have not reached their design life,
better guidelines for selecting rehabilitation strategies are needed to reasonably assure the functional lives
of rehabilitated pavements are equal to their design lives. The main purpose of this Guide is to provide
such information to the designers and decision makers.
Design life is defined as the service life of a pavement without the loss of load-carrying capability
from fatigue damage. Functional life is defmed as the service life without the development of excessive
distress that adversely affects the highway user. Examples of the types of distress that affect each of the
two service lives are given.
Seven categories of distress are tabulated as the ones most likely requiring selection of a
rehabilitation strategy from among several options. The rehabilitation strategies are divided into two
major classes, wearing surfaces and subsidiary treatments.
The selected wearing surfaces are hot bituminous pavement overlays (major, medium, or thin
thickness), stone matrix asphalt overlays, micro-surfacing and grind/micro-mill. The selected subsidiary
treatments are divided into major, moderate, minor and basic (all related to level of effort and cost). A
detailed outline of conditions for use, advantages and constraints is provided for each category of wearing
surface and subsidiary treatment.
The documentation used to development the two decision tables, FL- I and FL-2 (pg. 21 and 22) are
provided along with examples for using the tables. Table FL-l, for high traffic, shows that the typical
functional lives for medium to thin overlays are 7 and 5 years respectively.
The tables allow the user to select a wearing surface and subsidiary treatment combination related to
traffic and distress that will provide the desired functional life (usually 10 years) for an overlay. It also
allows the users to estimate the functional life of overlays designed only to meet design life criteria. The
functional lives and estimated first costs of the strategies being considered can be used to perfonn life
cycle cost analyses to aid in selecting the best strategy for the project.
Appendix A
This section presents an abbreviated outline of the research study for this Guide, which included (I)
formal literature review of 21 references, (2) potential rehabilitation strategies to be included, (3)
identifying distresses to be included in tile decision tables, (4) selecting interviewees, (5) developing
questiomlaires and interviewing 23 people relative to specific and general rehabilitation strategies and (6)
compiling the infonnation gathered and using it to develop the Guidelines. Detailed tables are included
that summarize the literature reviews and the personal interviews.
III

Significantly, none of the rehabilitation strategies investigated are new to COOT. All have been tried
to one degree or another. From the literature and by consensus of the interviewees, the most pervasive
distress, and the most difficult to correct, was found to be transverse cracking.
AppendixB
At a Panel meeting during progress of the study, it was decided that an independent method of
estimating functional life was needed. In order to relate the performance of the various rehabilitation
strategies to existing distress, it was decided to use the COOT network PMS pavement condition data in a
satellite study.
The PMS data from 1991 through 1999 for two series of projects was used to plot RSL curves in
order to estimate the functional lives of various strategies specific to category and degree of distress.
Aschenbrener of COOT reported the first series for nine overlay projects on 1-25 done in 1994. The
second series was from the projects reported on by the interviewees as tabulated in Appendix A.
The analysis of the plotted post and pre-construction PMS data (for tables and figures, see pages B-8
to B-13) showed cracking for both series to be the most pervasive of the three distresses being measured for
condition indexes, e.g., ride, ruts and cracking. opr is calculated from the three values. To determine
cracking condition index, five cracking distresses are measured: alligator, block, longitudinal, transverse
and load-associated longitudinal. Of these, transverse was by far the most extensive and severe. The
plotted data furnished information used to develop Tables FL- r and FL-2.
IV

ACKNOWLEDGEMENTS
The author gives special thanks to the Research Study Panel members for their work in providing a
valuable, comprehensive study plan. The Panel gave a sound basis for initiating the research for this
project. Later, the members provided assistance in redirecting the effort as work progressed. And, finally,
they are thanked for their advice on presenting the research results in a usable format. Members of the
Panel were: Tim Aschenbrener (COOT Staff Materials), Greg Lowery (COOT Staff Materials), Dave
Gonser (COOT Region 2), Bernie Kuta (FHWA), Tom Peterson (CAPA), Scott Shuler (LaFarge Co),
Richard Zamora (COOT Staff Materials) and Donna Harmelink (COOT Research, as Study Manager).
Additionally, the author acknowledges the assistance and data provided by the many asphalt pavement
technologists who were interviewed for this study.
v

GUIDELINES FOR SELECTION OF REHABILITATION STRA TEGlES for ASPHALT PAVEMENT
Contents Introduction and Background ................... ....................................... ................. ......... .. ....... ........ .
Concept of Evaluating Functional and Design Lives Separately ...... ....... ....... ................... ............ . I
Purpose of Guide .................... ........ ...... ..... ..... .... ..... ... .. ... ... ............. .... . ........... ... .... .... .. ... .......... . 2
Pavement Distresses and Selection of Treatment Strategies... ............................. ............... .... ......... 2
Overview of the Rehabilitation Strategy Selection Process ................................. .. .. ... .... ... .... ...... .. . 4
Candidate Rehabilitation Strategies: Conditions for Use, Advantages, and Constraints .. ... .... ......... 5
Wearing Surfaces Conditions for Use .. .......... ............. ..... ... .. .............. ............ .... .... ..... ... ... ...... ..... 5
Subsidiary Treatments Conditions for Use ................... ...... . ... .. ..... ....... ... .. ....... .... ... .. .......... ...... .. .. 8
Development and Use of Functional Life Tables (FL-I and FL-2) ....... ..... ... ..... ............. .......... ..... . 15
Examples for Using the Tables ................................... ........... ....... .... ...... .. .................................. .
List of References for Guide and Appendixes, Numbered and Un-numbered ................................ .
List of Tables
18
20
Table I Predominant Flexible Pavement Distresses Addressed in this Guide ... ...... .... ........... ........ 3
Table FL I NHS (High Traffic) Years Functional Life (YFL) ...... ..................... ............ ... .... .. ..... 21
Table FL 2 Non-NHS (Low to Medium Traffic) Years Functional Life. ............. .. ... .. .. .................. 22
List of Figures
Figure 1 Rehabilitation Strategy Selection Procedure ............... ....... ... ..... ....... ............... ............... . 4
Abbreviations Used in This Report AASHTO ....... American Association LCCA .......... . Life Cycle Cost Analysis
of State Highway and LTPP ............. Long-Term Performance Transportation Officials Projects
CAPA Colorado Asphalt Pavement NHS .... .......... National Highway System Association Non-NHS ....... Non-National Highway System
CDOT Colorado Department of OPI . ............... Overall Pavement Index Highways PMS ..... ....... .. Pavement Management System
CIPR ..... ...... Cold-in-Place Recycling PR ...... ........... Principal Researcher DL .... ...... ....... Design Life RSL .... .... . .. .. .. Remaining Service Life, at ESAL ..... ...... Equivalent Single Axle Load Condition Index Threshold = 50 FL . .. ........... ... Functional Life SMA .. ........ .... Stone Matrix Asphalt HBP ........... .. . Hot Bituminous Pavement SP ... . ..... ......... SuperPave HIPR .... .. .. .. Hot-in-Place Recycling YFL .. .. ........... Years Functional Life LALC ........... Load Associated Longitudinal
Cracking
VI

GUIDELINES FOR SELECTION OF REHABILITATION STRATEGIES for ASPHALT PAVEMENT
Bud A. Brakey
INTRODUCTION AND BACKGROUND A sporadic but a persisteot problem in Colorado bas been that a percentage of asphalt overlays have not reached their design life. Better guidelines need to be available for the pavement designers and decision makers for the selection of rehabilitation strategies that produce functional lives equal to design lives. When the rehabilitation strategy efforts are properly related to the type and degree of distress, the functional lives of asphalt overlays will have a higher likelihood of reaching their design lives.
One example of the above stated problem is a major asphalt overlay project on 1-25 in the Denver area that was completed in July of 1997. The mix and thickness designs fully met state-of-the-art procedures. But, by March of 1998, load associated longitudinal cracks appeared in the wheel tracks. The cracks were low to medium severities, and in some instances, were high severities. This was totally unexpected and helped initiate the study for development of this Rehabilitation Strategies Guide.
CONCEPT OF EVALUATING DESIGN AND FUNCTIONAL LIVES SEPARATELY Design Life, Definition and Deficiency Examples Design Life is the expected years of selvice a pavement will provide without a significant loss of load carrying capabilities caused by fatigue damage. During the DL, usually 10 years for rehabilitated pavements, the surface is expected to adequately accommodate the estimated total equivalent single axle load applications (ESALs) for the period. Examples of structural inadequacies from traffic loading are fatigue cracking, distortion, and disintegration caused by inadequate pavement thickness (e.g., the designed serviceability loss is reached before the end of the design period). Distresses initially related to materials, climate, or construction can be intensified by traffic to the point where they adversely affect load-carrying capacity. The COOT structural design of a flexible pavement overlay is based on component analysis or nondestructive testing (by deflection measurement), or a combination of both. The required thickness of overlays and subsidiary treatments for a project are determined from a series offormulas with a number of variables. Complete details on thickness design for a given "life" can be found in COOT's Pavement Design Manual(l). During design, the overlay thickness and treatment strategies selected are those expected to reduce traffic loading damage caused by future ESALs over the design life.
The COOT Traffic Analysis Unit will fumish future design ESALs for a proposed project upon request. The design ESALs are used with the AASHTO flexible pavement design equation, as characterized in the DARWin computer program, supplemented by COOT adopted criteria, to determine the required design structural number (SN). By referenced formulas, overlay thicknesses and subsidiary treatments are selected that satisfy the SN. There is no confirmed, rational method of accurately estimating the structural number of the existing pavement layers (except by backcalculating from deflection measurements). Mostly, designers rely on tables, charts and experience.
Functional Life, Definition and Deficiency Examples Functional Life is defined as the years of service a pavement will provide without the development of excessive distresses that adversely affects the highway user. Exanlples of functional deficiencies are poor surface friction, rutting, and excessive surface distortion. Currently, in Colorado, rutting and poor friction are not major problems. Excessive surface distortion (e.g., poor ride) by the most recent Network PMS data is primarily related to cracking, transverse being the most pervasive of the categories. Where fatigue cracking is not dominant, such distress is considered to be functional.

The CDOT overlay design procedure does not directly consider future overlay damage that will result from existing cracking distresses, except for load associated (alligator) cracking. The true functional or structural contributions of most subsidiary treatments can only be estimated from experience and empirical relationships. Indirectly, if other types of cracking bave weakened the existing structure, nondestructive testing may pick this up, thus showing a greater thickness of overlay is required. Unfortunately, just putting on a thicker overlay is not usually the most costeffective way of correcting distresses caused by transverse and reflective cracking.
Reports by others which were evaluated by the author', as well as studies done by the author in connection with the development of this Guide, clearly show that the most pervasive flexible pavement distress is transverse cracking. For medium to low traffic situations (characterized by the non-National Highway System), the functional life of an overlay may frequently equal or exceed its design life. For heavier traffic roads, (such as the National Highway System) the functional life is sometimes considerably less than the design life. This Guide offers guidelines for selecting strategies that will allow the functional life of a rehabilitated pavement to be at least equal to the design life. Further along in this Guide, Tables FL-I and FL-2 are presented, along with examples for their use. For pavements designed to increase their functional life in accordance with these procedures, there may be a reduced life cycle cost, which could compensate for the greater first cost.
PURPOSE OF GUIDE The Guide is to be used to provide guidance to pavement designers and decision makers on the importance of selecting better rehabilitation strategies and to properly address existing distresses prior to overlay. The Guide provides a reasonable estimate of the functional life (FL) of the selected rehabilitation strategy combinations to be used with life cycle cost analyses to better compare options. For example, if the level of funding is low or inadequate, a short functional life and a higher life cycle cost will result. If the level of funding is sufficient, a longer functional life and a lower life cycle cost will result. With this information provided by the pavement designer, the decision makers will be better informed about their decisions regarding rehabilitation strategies.
Another benefit will be the education of new engineers performing pavement design duties. Additionally, experiences tabulated in Appendix A will be shared around the state. Where strategies have been successful in some Regions, other Regions will benefit by the cited experiences.
PAVEMENT DISTRESSES AND SELECTION OF TREATMENT STRATEGIES
Pavement Distress Categories Used in FL Tables The study detailed in Appendix B uses before and after PMS data and as-built information to study the relationship of rehabilitation effort to subsequent performance. The study indicates the most critical pavement distress is transverse cracking. In Appendix A, the answers to the Interview Questions, Part II, have been summarized. Questions 3 and 4 are related to the most frequent distresses in the respondent's area and the most difficult distresses to deal with. The answers clearly show that severe cracking, especially transverse cracking, is the defect of greatest concern. From the PMS study and the interview answers, Category I in Table I, below, has been established. It addresses severe general cracking as well as transverse cracking.
See Development and Use of Functional Life Tables preceding Tables FL-l and FL-2, and Appendixes A and B.
2

The other six categories in Table I are composite categories from Appendix B, Table B-1 of the Design Manual. Listed in the Design Manual are 17 distresses, with Appendix B page references which describe the distresses and their severity levels.
The seven categories in Table I below are listed in approximately the frequency of occurrence. Only one category should be selected as the predominant distress for each linear representation. It should be used for selecting the rehabilitation strategy combination (level of effort) from the FL Tables. Probably 95%, or more, of the distresses requiring correction at the project level are included in Table I and the FL Tables. Often there are several distresses present to one degree or another. However, the design is usually based on the one selected as predominant. The final treatment strategy needs to be evaluated to assure the less dominant distresses are also satisfactorily corrected.
The consolidation of distress categories for the FL Tables is a matter of practical application. Cracking categories No.2 and 3 are each a combination of two distresses (as shown) and are listed separately in the Design Manual, but combined here because the causes and treatments are similar. For each category, load associated cracking is treated as a single defect in the Design Manual, while the Network PMS uses the two categories shown below for No.4. Of the many pavement distresses, the seven categories in the Table I are most applicable to life cycle cost analysis (LCCA) when comparing one rehabilitation strategy to another. That is, for each of the categories, more than a single strategy could be considered for corrective action. When one of them is the predominant project distress, the region pavement designer will use the Functional Life Tables (FL 1 or 2) to aid in strategy selections. Of course, these are not the only pavement distresses that might need correction. They are, however, the primary ones involved in comparing and analyzing rehabilitation strategies.
Table 1 PREDOMINANT FLEXIBLE PAVEMENT DISTRESSES ADDRESSED IN TIDS GUIDE
No. DISTRESSES LISTED in Tables FL-I Line I, by PMS, 2-7 by PRIMARY CAUSE OF and FL-2 (Medium & High Severity) Project and/or Network DISTRESS: TrafficlLoad or
PMS Evaluation ClimatelMateriais
I Lesser RSL Value of Cracking Only from Network PMS ClimateiMaterials Condition or Transverse Crack Index Condition Survey
Ifboth of the two above distress RSLs are >3.0, DESCRIPTION: Pg No. In then use the predominant of the below list. Design Manual Appendix B
2 Transverse & Reflective Cracking B-9, BI2 ClimateiMateria\s
3 Block Cracking & Joint Separation B-6, B-11 ClimateiMaterialsiConstruction
4 Load Associated Cracking (Alligator & B-4 TrafficILoad Load Associated Longitudinal [LAC])
5 Rutting (Non-Plastic) B-17 TrafficlLoad
6 Raveling & Weathering B-16 ClimatelMateriais
7 Bleeding B-5 ClimateiMaterials
Other distresses discussed in Appendix B of the Design Manual and not listed above are: corrugation, depressions, lane/shoulder drop-off, patch deterioration, polished aggregate, potholes,
3

plastic rutting (part of B-17), slippage cracking and stripping. Additional distresses occurring occasionally that need correction are roughness, frost heaves, swelling soil heaves and those caused by poor drainage. Nearly all of these additional distresses occur only rarely, and do not lend themselves to typical LCCA. In these cases, nonnally there is only one acceptable correction strategy for each distress. The selected treatment will be based on experience, judgement, and infonnation found in other CDOT manuals and directives. Headquarters and region specialists will also help solve these uncommon problems.
1. 3. 4. 5. Conduct pavement Select preliminary Conduct LIFE Re-evaluate evaluation and strategies that repair CYCLE COST No alternates for determine causes and prevent or ANALYSES ~ all important 01 pavement rt:: reduce luture decision distresses & plot distresses during Is one strategy factors. PMS RSL curves lor Cracking Indexes.
2. Consider primary factors: Distress Category, Traffic, Soils, Climate, Traffic Control, Construction Constraints, Other Constraints, Available Dollars, & Functionallile.
9. Select final rehabilitation strategy and complete design and speCifications.
.... ..... Yes
functional life and clearly superior? make preliminary design.
l~ l~ Yes
3A. Go to Rehabilitation Strategy Selection Guide. Compare
.... design lile (DL) to I< ..... J-+No - functionallile (FL) in
FL Tables.
No
8. Is detailed design reasonably close to typical design desired?
Is FL at least equal to DL?
...... ..... 7. Perform detailed rehabilitation design.
Yes
6. K""}--! Select
- preliminary rehabilitation strategy.
Figure 1 Rehabilitation Strategy Selection Procedure
OVERVIEW OF THE REHABILITATION STRATEGY SELECTION PROCESS It is important that an evaluation of the existing pavement be conducted at the project level to identifY functional and structural deficiencies, and to select the most appropriate rehabilitation strategies for correction of those deficiencies. Figure I is a flow chart of the selection and design process. The Design Manual sets forth the procedures to be used in designing structural overlays and subsidiary treatments for rehabilitation projects. This guide is intended to supplement the process and not supersede it.
4

CANDIDATE REHABILITATION STRATEGIES: CONDITIONS FOR USE, ADVANTAGES, AND CONSTRAINTS.
Much, but not all, of the information in the following section can be found various locations in the Design Manual. The order and detail presented here complement the rehabilitation treatment selection procedure. For evaluation purposes, the various rehabilitation strategies have been divided into two major classes: wearing surfaces and subsidiary treatments.
WEARING SURFACES, GENERAL.
In the FL tables, Wearing Surfaces heads the first column in each. Listed are three thicknesses of overlays for HBP, SMA and micro-surfacing. Though not technically a new wearing surface, grinding/micro-milling is listed as an acceptable restoration technique for the existing surface.
The most common wearing surfaces are overlays. When done as stand-alone techniques (only basic subsidiary treatments), they tend to be the lowest first cost method of rehabilitation. When functional life and increased maintenance are considered in life cycle cost analyses, this will probably not be true. Conditions under which HBP or SMA overlays would not be feasible without subsidiary treatment, beyond basi;: patchinglleveling and crack sealing include the following:
• High to medium severity transverse cracking is extensive which will cause reflection cracking in the overlay and shorten its functional life; in this case subsidiary treatments from minor to major should be considered relative to the degree and extent of distress. High load associated cracking is extensive such that subsidiary treatments from moderate to major should be considered.
• Where there is limited allowance for raising the pavement surface elevation, e.g., overhead clearance, matching gutters, no room for shoulder slope steepening, etc.
• Where excessive surface rutting (usually plastic) indicates the existing materials are so unstable that severe rutting is likely to be repeated without removal and replacement of the weak material.
• Stripping in the existing asphaltic concrete surface dictates that it should be removed and replaced. • An existing stabilized base shows signs of serious deterioration and would require an inordinate
amount of repair to provide uniform support for the overlay. • An existing granular base is contaminated, or otherwise unsatisfactory, requiring the entire
pavement structure to be rebuilt.
In the FL tables, overlays have been subdivided by thickness as major, medium or thin. Major overlays are defined as greater than 4 inches and less than 6 inches. Medium overlays are greater than 2 inches and:S 4 inches. Thin overlays are defined as 2 inches. These definitions are similar to the Department PMS definitions. The thin definition is consistent with the Pavement Design Manual (which limits the minimum thickness of an overlay to 2 inches). Thinner than two-inch overlays are not addressed in this guide, although the network PMS defmes thin as less than 2 inches. The PMS defines medium as greater than 2, up to 4 inches, and thick as 4 to 6 inches. Greater than 6 inches is categorized as reconstruction. The PMS is designed to provide information for federal aid contracts, state contracts and preventive maintenance. Such maintenance may be by contract or by state forces .
HOP Overlays (2 to 6 inches); and Stone Matrix Asphalt Overlays (1.5 to 2 inches) with Compatible Subsidiary Strategies
• Descriptions: • HBP (hot mix) asphalt pavement overlays will normally consist of Grading S in the lower
5

layers. Surface layers can be either Grading S or Grading SX. Grading SX, which has a one-half inch maximum size aggregate, can be used where layers are very thin or where the pavement must taper into an existing pavement. The lift thicknesses for all gradings should be a minimum of twice the maximum aggregate size. The bitumen mayor may not be polymer-modified, depending on the climate, traffic and importance of the layer or project.
• Stone matrix asphalt (SMA) is a gap-graded, highly stable, hot-mixed material containing more filler and bitumen than HBP. The aggregates require special characteristics and the bitumen is usually polymer-modified. Nominal maximum size aggregates range from 3/8 inch to 3/4 inch. SMA has shown high levels of rut resistance and durability. It also delays the reflection of low to medium severity cracks up to two years, compared with HBP surfaces using non-modified asphalts . SMA is recommended as a wearing course for high traffic pavements and in other critical circumstances. SMA has been successfully placed in layers as thin as one inch, however, thicknesses of 1.5 to 2.5 inches are recommended.
• Compatible Subsidiary Strategies: • Cold mill • Cold-in-place recycling (minimum 2-inches OL required) • Hot-in-place recycling • Fabric interlayer (minimum 2-inches OL required) • Basic preparation (patch/level & seal cracks)
• Distresses Applicable for Treating: • All distresses, with or without subsidiary treatments as indicated in Tables FL 1 or FL 2
(except those calling for micro-surfacing or grind/micro-mill)
• Constructability Advantages: • Can be done one lane at a time • Overlay phase can be in cool to hot weather • Overnight lane closure not required
• Constraints and Disadvantages: • Stand -alone overlays probably won't prevent, or substantially reduce, reflection cracking • Vertical clearance, without milling may be of concern
• Performance: • Usually the lowest first cost method of significantly increasing structural capacity • SuperPave mixtures made with 98% reliability PG asphalts have high probability of
slowing onset of most distresses • SMA overlays will slow rate of reflection cracking and most other deterioration • When considering conservation of materials and protection of the environment, overlays in
combination with certain subsidiary strategies, are usually better than rebuilding
• Climate Constraints • When CDOT standard specifications are followed, not sensitive to climate variables
6

Micro-Surfacing • Description:
• Micro-surfacing is a cold-mixed paving material composed of a polymer modified asphalt emulsion, 100% crushed aggregate, mineral filler, water, and field control additives. It is applied as a slurry at a thickness of 0.4 to 0.5 inches. This thin surface treatment improves friction and durability of a pavement surface. The functional condition is improved, but not the structural condition (load carrying capacity) of a roadway.
• Compatible Subsidiary Strategies: • Basic preparation (patch!level & seal cracks) • Hot-in-place recycle (heater scarify) • Ruts pre-filled with micro-surfacing
• Distresses Applicable for Treating: • Low to medium severity NP ruts (if over 0.5 inches, should be pre-filled) • Raveling or dry surfaces (assure that existing surface is moisture resistant) • Low severity cracking of all types (some spotty, medium severity areas may be included) • Low to medium bleeding
• Constructability Advantages: • Can be done rapidly, and generally opened to traffic within one hour • Time requiring traffic control is minimal • Does not significantly raise pavement surface elevation • Manholes and other surface utilities are not significantly affected • Can be feathered out without edge raveling
• Constraints and Disadvantages: • Must be done in warm weather • High quality aggregates, sometimes not locally available, required • Number of contractors with capabilities are limited which reduces competitive bidding
• Performance: • Economical method of sealing and restoring friction to the surface where structural
capacity increase is not of concern • Additional micro-surfacing layers, or structural layers can be placed later • It is particularly suitable as a functional treatment for high volume & urban roads
• Climate Constraints: • Very cool (high mountains), not recommended due to potential curing and rain problems • Cool (lower mountains and foothills), use with caution • Moderate (plains and west) and hot (SE and west), use with normal precautions
Grind/Micro-mill • Compatible Subsidiary Strategies:
• None, except that any patching and crack sealing required (for cracked surfaces) should be done while pavement surface is being restored.
• Distresses Applicable for Treating (where analysis shows structural capacity is adequate for expected life):
7

• Medium ruts, plastic or from consolidation • Roughness caused from all types cracking
• Constructability Advantages: • Can be done rapidly witb minimal traffic control
• Constraints and Disadvantages: • Can only be done where surface utilities and appurtenances are not in conflict • Reduces structural capacity of pavement (not critical for asphalt over PCCP) • Lateral drainage needs to be provided for
• Performance: • Economical metbod of removing ruts and/or restoring ride characteristics • For full flexible structures, structural analysis needs to be made in order to estimate
functional life after grind/milling.
• Climate Constraints: • All climates, use witb normal precautions
SUBSIDIARY TREATMENTS CONDITIONS FOR USE, GENERAL
Subsidiary treatments are defined as tbose intended to be covered by a wearing surface. In tbe FL Tables, the treatments are broken into four categories: Major, Moderate, Minor and Basic. The grouping is mostly in accordance with the level of resistance to future reflective cracking. The grouping also indicates tbe level of construction effort and is generally related to first cost. The four categories appear in tbe second column in the FL Tables, and are repeated for each overlay and SMA block. Micro-surfacing and micro-mill have two choices and one choice respectively.
The four subsidiary categories (tbe first three include any applicable Basic treatments) are defined as follows: • Major: (1) Cold-in-place recycle, 4 inches or greater or (2) Cold mill & replace lost SN, >3
inches. (The SN replacement thickness Is to be added to the original wearing surface thickness for all depths of cold mill and replace).
• Moderate: (I) Cold mill & replace lost SN, > 1.5 inches to 3 inches, (2) hot-in-place recycling > 1.5 inches, or (3) fill non-plastic ruts (>0.5 inches to 1.5 inches) with micro surfacing.
• Minor: (I) Cold mill & replace lost SN, 0.75 inches to 1.5 inches, (2) hot-in-place recycle >0.75 inches to 1.5 inches, (3) fabric interlayer (4) or fill non-plastic ruts «0.5 inches) witb micro surfacing.
• Basic: Includes, but is not limited to, patching isolated weak areas, leveling up to 0.75 inches average by milling or HBP, and crack filling, as appropriate for the subsidiary treatment selected.
Following are descriptions and conditions for use of the specific subsidiary treatments in tbe order of their first appearance in the above four categories:
Cold Mill (basic to major)
• Description:
8

• Cold milling means removing the top portion of the existing pavement by use of a rotary drum milling head, either by "down cutting" or "up cutting", removing the millings (usually they become the property of the contractor) and thoroughly cleaning the milled surface. Major milling (>3 inches) may be done to remove very unsatisfactory material and to accomplish major grade control. Moderate milling (> 1.5 to 3.0 inches) may be done to remove moderately unsatisfactory material and/or to accomplish moderate grade control. Minor milling (>0.75 to 1.5 inches) is done usually to uniform the surface and/or to match appurtenances as well as to remove thin layers of unsatisfactory materials. Basic milling (up to 0.75 inches average) is often done to uniform the surface and/or to match appurtenances. Normally, no structural consideration is given to milling for leveling purposes.
• Compatible Wearing Surfaces: • All thicknesses of HBP and SMA (provided that structural and functional requirements are
met) • Micro-surfacing can be used as a short term (3 to 6 years) surface over smoothly cut, thin
milled surfaces where structural characteristics are not critical • Distresses Applicable for Treating:
• All of the distresses shown in the FL Tables at all degrees of severity and all extents can be corrected by milling, up to total removal and replacement (which then becomes reconstruction). This does not mean that major distresses corrected by deep milling will always be the most cost effective. Other rehabilitation subsidiary strategies should be compared, as well as reconstruction.
• Constructability Advantages: • Milling leaves a roughened surface that provides an excellent bond with the overlay. • Milling machines with automatic grade control restore both longitudinal grade and
transverse grade, thus improving the smoothness of the final overlay • Milling eliminates the need for leveling courses and therefore the problems associated with
compacting material of varying width and thickness is eliminated • Oxidized, weathered material is removed from the top portion, thereby increasing the
exchange ratio (e.g., the entire existing pavement might have a SC of 0.25 assigned, but the portion to be milled is deemed to have a SC of 0.15) with the new replacement materials. If this condition is uniform and the designer considers it important in the cost analysis, it may be taken into account when conducting comparative cost analyses with other strategies. Be careful and investigate thoroughly; the existing pavement at the bottom may be worse than at the surface.
• By thinning the existing pavement and thickening the overlay, increased protection from crack reflection is accomplished
• Constraints and Disadvantages: • Part of the existing structural number is removed. Additional structural overlay thickness
must be included to account for the removed material • Milling depth must uniformly leave a thick enough asphalt pavement layer to support
construction and public traffic or other steps must be taken to protect any weakened sections from weather and construction traffic loadings
• Millings must be used or disposed of
9

• Performance: • With the wearing surface, restores friction, ride, and cross slope. (Restoring ride & cross
slope by milling requires less new hot mix material than by using HBP) • Removes old distressed pavement and replaces it with new material; this is a functional
benefit (yielding increased life), but a structural number loss, requiring increased OL thickness (meaning greater first cost). All this is in relation to milling depth. Analyze carefully. Thin milling will require crack maintenance early in life.
• Climate Constraints. • Not in itself sensitive to environmental conditions
Cold-in-Place Recycling (CIPR) (nominal4-inch depth)
• Description: • This is a technique in which the existing pavement is reused by crushing and mixing it in
place without the use of heat. Normally, only the aspbalt-bound materials are treated, to a minimum depth of 4 inches. Although where the existing bound pavement thickness is less than 4 inches, with special considerations, precautions and proper design, some untreated base aggregates could be added. The steps in CIPR are (1) prepare existing surface (remove and replace defective materials), (2) cold mill to design depth, (3) add recycling agents (usually asphalt emulsion and rarely, lime or additional aggregates), (4) mixing (depending on the complexity of the contractor's methods, milling, sizing, adding materials and mixing may be all in one operation by use ofa recycling train), (5) aeration of excess liquids (the need for this should be avoided by planning and scheduling, as it reduces cost effectiveness; however if there are excess liquids present which are not removed, poor performance is almost guaranteed), (6) laydown and (7) compaction.
• Compatible Wearing Surfuces (2" minimum thickness required): • Thin to thick overlays (HBP) • SMA alone or in combination with HBP intermediate layers
• Distresses Applicable for Treating: • Medium to high severity cracking of all types (treating low severity cracking is usually not
cost-effective) • Infrequent settlements • Infrequent overlay patches • Raveling (must be high to justify unless medium to high cracking is present) • Low severity bleeding • Rutting from consolidation (not recommended to correct medium to high plastic rutting
without special study and design)
• Constructability Advantages: • Can be done one lane at a time • Overnight lane closures not required • No leveling required
• Constraints & Disadvantages: • Manholes, surface and sub-surface utilities need to be addressed
10
• Must be done full widtb or a trench (a batb tub) effect could cause moisture to become entrapped leading to low support strengtb and early failure
• Adequate substrata support is required to carry the heavy recycling train • Cannot be done satisfactorily in cooVand or wet weatber • Cold-in-place recycled material must cure thoroughly before overlaying (use of quick lime
in tbe mix may expedite curing/strengtbening oftbe constructed layer in marginal situations, but tbis is costly)
• For traffic control, should not use where tbere is >5000 ADTllane • Must mill off excessive crack sealing and/or patching • Previously placed fabric interlayer may cause problems • Not recommended for lO-yr ESALs >3,000,000 witbout overlays;:::4 inches
• Performance (witb adequate structurally designed wearing surface): • Restores ride, friction and cross slope • Recycled layer adds structural capacity (where existing surface SC is less tban 0.25) • Eliminates reflection cracking • Eliminates all existing pavement distress to deptb treated • Early maintenance may be required (especially if not thoroughly cured and compacted)
• Climate Constraints: • Very cool (high mountains), do not use due to potential curing and rain problems • Cool (lower mountains and foothills), use prudently, tben deduct 1 to 2 yrs from FL table • Moderate (plains and west) and hot (SE and west), use witb normal precautions
Hot-in-Place Recycling (HIPR) • Description:
• The method consists of heating and softening tbe existing asphalt surface, tben scarifying or milling to tbe specified deptb. Described below are tbe three subcategories (all may have recycling agents added to improve tbe surface)
• Heater repave (scarify 0.75 to l.OO-inch plus, witb simultaneous l.OO-inch plus hot overlay), if total thickness is;:::1.5 up to 3 inches, consider as moderate subsidiary
• Heater remix (heat & scarify, pick up and mix in a pugmill witb hot aggregate and/or hot asphalt mix) if total thickness is;:::1.5 up to 3 inches, consider as moderate subsidiary
• Heater scarify (typically a tbin wearing surface is done separately), consider as minor subsidiary
Note that heater scarifying is tbe most common option. Witb this method, it is preferable to place hot wearing surfaces while tbe scarified and rolled surface is still warm to hot.
• Compatible Wearing Surfaces: • Thin to thick Overlays (HBP) • SMAs alone or witb HBP intermediate layers • Micro-surfacing (likely surface for heater scarified only)
• Distresses Applicable for Treating: • Low to medium severity cracking (all types) • Infrequent high severity cracking (all types, high fatigue cracking should be corrected first) • Infrequent or no overlay patching • Low to medium severity raveling (if high severity, may use heater remix)
11
• Low severity non-plastic rutting • Low severity bleeding
• Constructability Advantages: • Can be done one lane at a time. • Overnight lane closures not required • No leveling required
• Constraints and Disadvantages: • Manholes and other surface utilities need to be accounted for • Smoke emissions may prohibit use in some areas • Traffic control may be a problem in some urban areas • Careful calendar scheduling required, should be done in warm or hot weather (to achieve
economics and acceptable results, method is more critical than simply overlaying) • Pavements with non-uniform characteristics may yield unpredictable results
• Performance: • Restores ride, friction and cross slope (mostly from overlay) • Recycled layer adds structural capacity • Destroys upper surface cracking pattern • Retards initiation of reflection cracking from one to two years (depending upon treatment
thickness and degree and type of existing cracking) • Maintenance may be required early in life
o Climate Constraints: • Very cool (high mountains), use with caution, then deduct I from FL tables • Cool to Hot climates, use with normal precautions
Micro-Surfacing for Ruts • Description:
• See micro-surfacing under wearing surfaces. The same material is used for rut filling. Ruts can be filled in reasonably stable pavements. When surfaced with micro-surfacing, it is a two-step process. First, a scratch course is applied with the screed set to make contact with the high points of the surface, followed by the application of a final surface. For ruts deeper than 0.5 inches, a special V-shaped rut box is used over each rut for the scratch lift.
• Compatible Wearing Surfaces: • Micro-surfacing, for expected YFLs up to 6. • HBP or SMA. (Consider use over pre-filled ruts on an experimental basis). Object would
be to have a more cost -effective and better performing strategy than filling ruts with a hot mixed leveling course
• Distresses Applicable for Treating: • Low to high severity non-plastic ruts (up to 3" deep if placed in maximum 3/4" lifts) • Low severity, low plasticity ruts if overlaid with HBP or SMA
• Constructability Advantages: • Can be done rapidly, generally opened to traffic within one hour
12
• Time requiring traffic control is minimal • Depending on quantity, project scheduling, availability, etc., may be more cost-effective
and give better performance than using hot leveling courses
• Constraints and Disadvantages: • Must be done in warm weather • High quality aggregates required, sometimes not locally available • Number of contractors with capabilities are limited which reduces competitive bidding
• Performance: • Will be more dense and stable than a thinly applied hot mix scratch course, providing
better performance of the hot mix overlays • With a micro surface top layer, is particularly suitable as a functional treatment for high
volume & urban roads
• Climate Constraints: • Very cool (high mountains), not recommended due to potential curing and rain problems. • Cool (lower mountains and foothills), use prudently, then deduct 1 from FL table values • Moderate and hot climates, use with normal precautions
Fabric [nterlayer (Paving Geotextile) • Description :
• CDOT specifications refer to this material as a paving geotextile. Industry commonly refers to the system as a fabric interlayer. The fabric is a non-woven geotextile, conforming to (section 712), and applied per (section 420) of CDOT specifications. It is installed over a hot sprayed asphalt cement binder layer on the old pavement. Pretreatment of the old surface may include leveling course, heatcr scarifying or cold milling. Purposes are to reduce reflection of low to medium cracking and perhaps impart moisture resistance to the existing pavement.
• Compatible Wearing Surfaces (minimum thickness of2" required): • Thin to thick Overlays (HBP) • SMAs alone or with HBP intermediate layers
• Distresses Applicable for Treating • Low to medium severity cracking (all types except transverse, both reflection and
temperature) • Low severity transverse cracking (as above)
• Constructability Advantages: • Can be applied rapidly in cool to hot weather a few hundred feet ahead of paving operation • For smaller, narrower cracks, crack pre-sealing is not required
• COllStraints and Disadvantages: • Traffic (except for overlay mixture haulers) must be kept off fabric. • Thickness and temperature of overlay at time of compaction must be adequate to assure
bonding • Active transverse and reflection cracks are not prevented from recurring in the overlay
13
• Wide cracks (+ 0.25 ") must have pretreatment • All structurally weak (severely distressed) areas must be corrected (true for other systems,
also) • Structural strength of the system is not significantly enhanced (only indirectly over long
time by possibly reducing moisture intrusion into the subgrade)
• Performance: • Retards reflection cracking by 1 to 2 years of all but transverse and other very wide cracks • Provides moisture protection to lower pavement layers (investigate carefully, some
researchers report pavement distress in moisture susceptible layers due to "trapped" moisture. This is not widely reported in the literature, however, nor at all by Colorado personnel)
• Long range, may provide more uniform (stable) moisture in subgrade layers, reducing early spring damage
• Climate Constraints: • Very cool (high mountains), apply only in warm weather • Cool to hot climates, use with normal precautions
Basic Preparation • Description:
• The most common subsidiary treatment is "basic preparation" which in this guide may include patching all severely distressed areas, sealing cracks and (if required) leveling by thin cold milling or a hot mix leveling course. How much distress should be repaired before a wearing surface is placed? The amount of pre-surfacing repair needed is a cost versus perfonnance function. If patclting required is too extensive, then deeper cold mill and fill, CIPR or reconstruction may be required. It may be more cost and performance effective if the patching can be done by maintenance forces ahead of the contract. Crack sealing should be only to top of cracks (no Band-Aid type sealing).
GI Compatible Wearing Surfaces: • Thin to tltick Overlays (HBP) • SMAs alone or with HBP intermediate layers • Micro-surfacing (only over low severity cracking, see FL tables for other distresses)
• Distresses Applicable for Treating • All low severity cracking categories with occasional medium severity areas • Non plastic rutting of all severities (with leveling as required) • Low to medium severity raveled surfaces • Low bleeding with some medium if not extensive (spot mill & fill may be required)
• Constructability Advantages: • Where hot mix asphalt is available ahead of paving, it is economical to patch on contract • Weather (cool temperatures and rainfall) not a problem • No over night lane closures required • Can be done one lane at a time • Common techniques used make competitive bidding attractive
14

• Constraints and Disadvantages of Overlays with Basic Only: • Overhead clearance may be of concern • Increased shoulder elevation may require steepening slopes or lengthening cross structures • Extra work required at bridge approaches • Patching, leveling & rut filling costs could possibly be better spent to mill or in-place
recycle • Existing cracking patterns remain to reflect through new surface
• Performance of Combinations with Basic: • Restores ride, friction and cross slope (mostly from overlay and leveling) • Overlay adds structural capacity without loss of existing structure • Crack maintenance required early in life
• Climate Constraints. • All climates, use normal precautions.
DEVELOPMENT AND USE OF FUNCTIONAL LIFE TABLES (FL-l and FL-2) The Functional Life Tables are the most important part of this guide. The development and use are described below.
Development, Substantiation and Sources of Data
Year 2000 Report on 32 Projects by Goldbaum For life cycle cost analysis purposes, pavement lives were defined in a study reported by Goldbaum(2) in 2000 on 32 Colorado asphalt projects. The projects were reconstructed mostly in the early to mid-1980s. Seventeen projects on the National Highway System (NHS) received their first rehabilitation at 8.6 years average age. Their average PMS Overall Pavement Index (Opr) at rehabilitation was 72. Fifteen non-NHS projects had their first rehabilitation at an average age of 11 .1 years (average opr was 78). There was a considerable scatter in the plotted data. All projects were 20-year designs. During the period of construction for most of these projects, COOT was experiencing many problems with pavement performance (some rutting and then brittleness as asphalt content was reduced). The problems were related to design, specifications, construction, and rapid growth in traffic, among other things. Goldbaum(2) reported the average age of the new or reconstructed pavements, and not of the overlays (apparently, none of the overlays had reached the end of their life).
The average overlay thickness for all 32 projects was 1.30 inches. The thickest seven overlays were 2.0-inch. All the rest were 1.5 inches or less, with 16 being 1.0 inches; such thicknesses are considered preventive maintenance, or functional overlays. Goldbaum(2) shows OPI perfonnance curves for the first 4 to 7 years of the overlay lives. One for the average indexes for NHS overlays and one for the average indexes for non-NHS overlays. Again, there is a lot of scatter in Goldbaum's plotted data, indicating a probable range in life from about five to 15 or more years . By extending Goldbaum's two average curves to their intersection with the threshold index value of 50, the opr projected functional lives are 7.5 and 8.5 years. These values closely agree with the YFLs by OPI curves as shown in Tables FL-I and FI-2 for thin overlays with basic or minor subsidiary treatments.
Only one of the NHS original pavements and three of the non-NHS pavements were constructed after 1989. Beginning in the late 1980s, a number of positive changes occurred in pavement design and
15

construction procedures in Colorado (and nationally). COOT continued a series of progressive improvements in mix design and construction techniques, especially in the early nineties. By the middle nineties, the present SuperPave (SP) hot-mix asphalt design procedure had been fully phased in. Also, quality controVquality acceptance specifications (QC/QA) had been fully implemented for field construction. Because of these and other positive changes, it is expected that new and reconstructed pavements built using SP and QC/QA criteria will have longer service lives than those cited by Goldbaum(2) However, not enough infonnation is currently available to verifY such expectations.
Overlay History on Sections ofI-25 in the Denver Metro Area An unpublished tabulation by Region Six of past overlay projects on 1-25 in the region was made for two sections. The data from C 470 to Colorado Blvd. shows the average 1.5-inch overlay lasted between five and 7 years. One project overlaid with three inches lasted 14 years. The data from West Sixth Avenue to 1-70, shows that pre-1980 overlays, 1.5 to 2 inches thick, lasted about 10 years before rehabilitation. Since that time, severa/lengths with 2 to 3-inch overlays have lasted an average of seven years (5-9). All overlay sections received basic or minor subsidiary treatments. Except for the one l4-year life, these lives are within a year or two of those given in Table FL-l for similar treatment and tlle assumed, predominant existing distresses.
Network PMS Data as Related to Pavement Distress and Rehabilitation Techniques Appendix B contains infonnation from the COOT PMS condition sununary on flexible pavements as related to pavement distress categories and severity, before and after receiving rehabilitation. One set of data is from nine rehabilitation projects constructed on 1-25 in 1994. One set is for data gathered on nine projects evaluated in 2000 for this guide. Greater detail than given below is available in Appendix B.
Performance of Nine 1-25 Projects Rehabilitated in 1994 The details of design, materials and construction on nine 1-25 projects rehabilitated in 1994 were reported by Aschenbrener(3) in 1995. The locations ranged from MP 0.0 at the New Mexico border to MP 235 north of Denver. He noted the purpose of his report was to provide data for future long-term pavement performance studies. The performance of the projects was evaluated for this Guide, then sununarized in Tables B-1 and B-2. The evaluation procedures are discussed in Appendix B.
Performance of Nine Projects from the Rehabilitation Study Table A-2, Appendix A, summarizes the interviews done with engineers and managers relative to 27 projects chosen to represent a variety of rehabilitation examples. A careful review of the projects revealed there were nine COOT projects that had been constructed long enough to provide one or more years of rehabilitation performance history. These nine projects were evaluated and summarized in Appendix B in Tables B-3 and B-4.
Table B-5 contains a summary of the post-construction (performance) data for both the above sets of projects. The table shows a distinct trend which is: the greater the combined thickness (level of effort) of overlay and subsidiary treatment, the longer will be the pavement's functional life, as might be presumed. Keep in mind, though, that all the projects tabulated were 10 year designs, except for two noted in the table. So theoretically, they all should have lO-year lives, regardless of the level of rehabilitative effort. But, obviously, they will not. Also, there is an indication that SP modified asphalt pavements are performing better than pavements with unmodified asphalts. The projected
16

YFLs from the 21 projects, both by OPI and by Cracking Indexes, were heavily relied on in developing Tables FL-I and FL-2.
Network PMS Task Force and Survey of CDOT Managers Finally, the FL Tables are constructed such that they are in general agreement (± I year) with the survey conducted by a PMS task group in late 1999 to obtain data for the Network PMS. Several levels of discipline in COOT's field and front offices were polled as to how long specific levels and types of rehabilitation could be expected to last, or the YFL (RSL at time done).
There was a consensus as to YFL for the wearing surfaces as follows: Thick overlay, 10; medium overlay, 7; thin overlay, 5; SMA, 8; IDP recycle/minimum 2-inch OL, 8; CIP recycle/minimum 2-inch OL, 8; and Micro surface, 4. These values were focal points for developing the FL Tables. The consensus YFL values were assumed to be for existing pavements typically having medium to severe transverse cracking (RSL <0). Only Basic or Minor was assumed as the subsidiary treatment.
Details of Tables The numbers within the individual cells of Tables FL-I and FL-2 are estimates of the YFL at the intersection of rows, beginning at the chosen rehabilitation strategy combination, and the column under the predominant category and degree of distress in the existing pavement. The first two distress columns are for the most severe categories, the lower RSL of either Cracking Index or Transverse Cracking as plotted from the Network PMS data for the project (or representative sections). Regardless of any other predominant distress, if either of the two cracking categories RSLs are 3.0 to 0.0, use the first column. If either is less than 0.0, use the second column.
Ifboth cracking category RSLs are above 3.0, then select the most appropriate under the next six major column headings. Low distress is not included as it is unlikely that a rehabilitation project would be established when the predominant distress is oflow severity.
Table FL-I for NHS roads was constructed initially, and the first two YFL columns filled by considering the information listed above, using rational spreads and steps. The second two columns were then filled using a rational spreads and steps related the previous column values. Finally all of the cells in Table FL-I were filled using a similar approach. The term NA indicates "not applicable or "not recommended".
Next Table FL-2, for non-NHS roads, was filled with YFL values. Goldbaum's(2) study showed 2.6 years average difference in the lives of new pavements between non-NHS and NHS projects. Based on this, for the most part, the YFL values in the first two columns (under the two RSL cracking categories) were set at 2.0 YFLs higher than in Table FL-!. The exception was for micro-surfacing and grind/micro-mill, which were set just one YFL higher. The other YFL values in the remaining columns were set at 3.0 YFL higher than the NHS values. In many cells this gave unreasonably high numbers for a lO-year design. Consequently any numbers higher than 13 were removed and a sub-note added as to why. Essentially the same set of notes appears under each FL Table. They have been repeated for easier table use.
17

EXAMPLES FOR USING THE TABLES
Example for NHS, Given: (I) Interstate Project IXX-l in an Urban setting, the existing asphalt surface will receive a IO-year rehabilitation pavement design. (2) A plot of the most recent existing pavement Network PMS condition data for the proposed project shows the RSL by Cracking Index is 0.0, by Transverse it is -2.5. (3) The project distress evaluation indicates the predominant distress is low to medium transverse cracking with low, load-associated cracking. (4) lO-yr ESALs are 5.8 million (5) Conventional design by the Region calls for a 3-inch overlay using SP Grading S (98% reliability PG asphalt cement). (6) Subsidiary treatment is to be Basic with average 0.5-inch cold milling for leveling.
• To check for treatment required for YFL = 10, enter into Table FL-I, the column under RSL<O.
• Option I: Across from Medium Overlay, read that Subsidiary treatment for 10 YFL should be Major, even if allowing for use of modified AC. (Note: Since cold recycling is not an option due to urban setting & high traffic, cold milling 3 inches or greater is the only reasonable rehabilitation option for Medium overlay. Due to loss of ±0.66 SN by milling 3 inches, result would likely be a total of ±4.5 inches ofHBP on the milled surface.)
• Option 2: Across from Major Overlay, read that minimum Subsidiary treatment for 10 YFL should be Minor for modified AC (add one year to table YFL). Choices are cold mill 0.75 to 1.5 inches and replace lost SN, or hot-in-place recycle 0.75 to 1.5 inches. (Due to loss of ±0.22 SN by milling of say, 1.0 inches, result would likely be a total of±5.5 inches ofHBP on the milled surface.)
• To check the YFL for the proposed conventional design, read on down under RSL <0 across from Medium Overlay, Basic treatment, and find the value of 5. Add one year for use of modified asphalt cement. The predicted YFL is 6.
Example for non-NHS, Given: (I) Rural Secondary Project SXX-2. The existing asphalt surface will receive a 10-year rehabilitation pavement design. (2) A plot of the most recent existing pavement Network PMS condition data for the proposed project shows the RSL by Cracking Index to be -0.4, by Transverse it is -8.0. (3) The project distress evaluation indicates the predominant distress is medium to high alligator cracking with medium to high transverse cracking closely following in extent. (4) 10-yr ESALs are 520,000 (5) Conventional design by the Region calls for a 2-inch unmodified asphalt overlay. (6) Subsidiary treatment is to be minor, 1.25 total thickness of Heater Repave (O.5-inch heater scarify, with 0.75-inch SX overlay, in one operation).
• To check for treatment required for YFL = 10, enter into Table FL-2, the column under RSL<O.
• Option I: Across from Thin Overlay, read that minimum Subsidiary treatment for 10 YFL should be Major. Choices are cold mill ~3 inches and replace lost SN or cold-in-place recycle minimum 4 inches. (If milling is selected, due to loss of ±O.66 SN, result would likely be a total of ±3.5 inches ofHBP on the milled surface.)
18

• Option 2: Select Medium Overlay, read that minimum Subsidiary treatment for 10 YFL should be Moderate. Choices are cold mill 1.5 to 3.0 inches or hot-in-place recycling> 1.5 inches. (If milling, say 1.5 inches, is selected, due to loss of ±0.33 SN, the result would likely be a total of±3.75 inches ofHBP on the milled surface.)
• To check the YFL for the proposed conventional design, read on down under RSL <0 across from Thin Overlay and Minor treatment and find a predicted value of 7,
ENGINEERING JUDGEMENT REQUIRED
In Tables FL-l and FL-2, the thicknesses of wearing surfaces and subsidiary treatments, in many cases are presented in ranges, rather than specific values. This demands that engineering judgement be used in selecting the combination of rehabilitation treatments to be used. The object in using this Guide should be to select the best practical combination of thicknesses and treatment categories that will reasonably assure the construction of rehabilitated pavements with 10-year minimum functional lives. It is possible to subvert the intent by selecting the thinnest (or cheapest) of treatment categories and combinations that strictly meet the minimum values given. Such an approach may not fully accomplish the desired result of increasing pavement functional lives to better equal their design lives.
Where this Guide is followed for design, and the intent is to continue to do so, it is suggested when making LCCA for NHS highways that tile rehabilitation cycle be set at 10 years rather than the 8 years as recommended by Goldbaum (2) The increased first cost will tend to be offset by expected longer life of each cycle.
Goldbaum (2) already reconU11ends using a lO-year cycle for non-NHS. In the few cases where increased first cost will occur by following this Guide, the improved 10-year design reliability will tend to offset this.
19
LIST of REFERENCES
Numbered References
(I) Pavement Design Manual, State of Colorado, Department of Transportation. October 1999.
(2) Report No. CDOT-RI-R-00-3, Life Cycle Cost Analysis, State -of-the-Practice, Colorado Department
of Transportation, March 2000, by Jay Goldbaum.
(3) Report No. CDOT-DTD-R-95-14, A Documentation of Hot Mix Overlays on 1-25 in 1994, Colorado
Department of Transportation, June 1995, by Tim Aschenbrener.
Un-numbered References
See Table A-I, Appendix A., this report, for a specific list of publications formally reviewed for this study.
Listed below are additional pertinent publications reviewed or consulted while developing this report:
• Synthesis and Literature Review of Nonwoven Paving Fabrics Performance in Overlays,
Transportation Research Record 1687, Paper No. 99-1380, by R.F. Carmichael III and Mark L.
Marienfeld. 1999.
• Report No. 3042, The Design of a Long Life HMA Pavement for the Southeast Corridor Project,
Denver, Colorado. Prepared for Colorado Asphalt Pavement Assoc. by Harold Von Quintas and
Brian Killingsworth, Fubro-BRE, Inc., 8240 Mopac, Ste #220, Austin, Texas, 78759. Apr. 2000.
20

............ "" ... &J ... ........... u , .......... ~ •• .... _ ........ , ____ ................... "' ... . _ ...... _ ......... - --REHABILITATION STRATEGIES 1 0-YR DESIGN YFL (I) WHEN EXISTING DISTRESSES BELOW ARE TREATED BY THE
INDICATED REHABILITATION STRATEGIES
WEARING SUBSIDIARY YFL b~ Cracldng Index )if existing
YFL expected by OPI plot for !be identified predominate existing distress." ) End parentheses arc Design Manual pgs.
SURFACE TREA TMENTS ~) The two degrees of severity include the subjective extent. Low level not includod as it is unlikely to be treated. Transvene or
HBP overlay YFLs are for May be used with selected Crack Index has TrlUlSV (Tempi Refl) neat uphaIts, 5O'A. wearing surface. Basic is on: Cracking (89, 12)
reliability. included in Major-Minor.
RSL 3-0 RSL <0 Med High MAJOR OVERLAY MaiO(" U i U 14
I >4 to 6". 5" used. If top layer ModenI.e 11 ,
111 13 is made from (98,*"liability) -.
/ ./ modified AC, add 1 yr. Minor 10 12 Basic Onlv • 8 11
Maior 10 , to 12 MEDlUMOVERLAY Modente 9 j 8 11 >2 to 4", 3" used. If top layer
Minor ~ 1/ 7/ 10 is made from (98%reJiability) modified AC add 1 yr. Basic Onlv 7
, 6 9
THIN OVERLAY Maior 8 I ii 10 (2" HBP) If top l. yer is made Modente 7 J 6 9 from (981JVcJiability) )/ :/ modified AC, add 1 yr. Minor <; 8
Basic Onlv 5. 4 7
SMA(1.5 - 2") Maior 10 , to 12
If over CIPR, must be~2" Modeme 9 8 11
Minor 8 ok' ~ 10 Basic Onlv .~ , 6 9
MICRO SURFACING BasicIMinor 4 i J _ VlI" I ... ; , , ,
IGRINDIMICRO-MILL Basic (annlicable'l 1 1 5
Table Notes: ( Columns are alternately shaded for easier reading) Hatched cells represent 1999 PMS survey consensus values, +1- I year.
1. Years Functional Life (YFL) is defined as the life predicted by the CDOT Network PMS at time of construction, at this time it is synonymous with RSL. 2. Defined as any applicable trcatment (see Conditions for Use) to the existing pavement prior to placing new HBP or other wearing surfaces. The four categories (the first three include Basic) are defmed as follows: • Major: (1 ) Cold-in-place recycle, 4" or greater or (2) Cold mill >3 "(and replace 10.1 SN). (In thi. table, the SN replacement thickness i, to be added to original Wearing Surface thicknes.) • Moderate: (1 ) Cold mill >1.5"to 3" (& replace lost SN), (2) hot-in-place recycling> 1.5", or (3) fill non-plastic ruts (>0.5" to 1.5") with micro surfacing. • Minor: (I ) Cold mill >0.75" - 1.5" (& replace lost SN), (2) hot-in-place recycle 0.75" - 1.5", (3) fabric interlayer (4) or fill non-plastic mts «0.5") with micro surf.
14 12 11
10 12 10 9
8
10 8
7 6
12 10
9
8
4
5
21
Long. Ql' Block Load ABsoc (Alig or NP Rutting (817) Raveling or Bioedinl Craoking (86, 11) Long) Craoking (84 If plastic, sec note 5 Weathering (BI6) (85)
Med High Med High Med Hi!!h Med Hi!!h NoDegre
14 l-.1L 14 14 14 ' 14 14 14 ~~-+- - -14 ' , 1I 14 13 U l~. 14 13 R' n L12 13 12 U ' H 13 12 . JU._. 12 I U 12 11 l.ll-- 10 NA NA ~A
12 r 12 12 12 12 _+-~ 12 12 12 NA 1.2 ! H 12 11 11 : -in 12 11 -~<\ .
II I
10 11 10 10 1 9 11 10 _ N<\ .. , l~ I 9 10 9 9 I ' 8 10 NA N.~
jn io 10 10 lq 10 10 10 N\ HI 9 10 9 • ~- 10 9 "'-"-9 , __ +-$ 9 8 $ '/ 9 NA 8 8 7 8 7 7 6 NA NA l.,\
12 12 12 12 ...!1...+~ _ 12 12 _~L !2 1 U 12 11 l~-1!L_ 12 11 N<\
II I lO 11 10 1.LJ . ,. 11 10 10
In 9 10 9 9 I
8 NA NA N>I.
5 4 5 4 S 1 4 6 5 NA _. , .. , A • " . m ., .,
NA N\ lOA NA 5 I , '14 NA N.'
• Ba,ic: Includes, but is not limited to, patching isolated weak areas, levelmg up to 0.75" average by milling or HBP, or crack filling, as appropriate for the subsidilll)' treatment selected. 3. The YFL by Cracking index is listed first as it is critical to perfonnance and affects Ride and OPr. If by the PMS condition plot, either the Transverse or Cracking RSL at time of design are as indicated, YFL by Cracking Index is as shown. Use these YFLs for Cracking regardless of whether Transverse cracking is predominate, or not. 4. The degrees of distress in the five categories below are to be arrived at subjectively by PMS data and/or project evaluation and include extent. The YFLs shown are these predicted from OPI by PMS. 5. For medium to severe plastic rutting, it is presumed that little cracking and no raveling is present. For these conditions, repair by milling and replacing in accordance with CDOT guidelines shall be done. The pavement is then presumed to be restored to its original design life.

~ ....... &_.& ...... ~ .... "" ...... ~ "" ..... '" ......... __ ._--- -- .. _ ..... - - &_--~ .... -' ..... _ ........ ... .-- --REHABILITATION STRATEGIES IO-YR DESIGN YFL (1) WHEN EXISTING DISTRESSES BELOW ARE TREATED BY TIffi
INDICATED REHABILITATION STRATEGIES
WEARING SUBSIDIARY YFL ~ Cracking Index )if existing
YFL by OPI plot forth. identified predominate existing WsIress'·'. End parentheses "" Design Manual PI:'-
SURFACE TREATMENTS (2) The two degrees of severity include the subjective extent. Low level not included as it is wilikely to be treated.
Transverse or HBP overlay YFLs are for May be used with selected Crack Index has Transv (Tempi Refl)
neat asphalls, 50% wearing surface. Basic is lUI: Cracking (B9, 12)
reliability. included in Major-Minor.
RSL3-0 RSL<O Med High MAJOR OVERLAY Majo.- # # # # >4 to 6". S" used. [flop layer Moderate 13 12 # # is made from (980/...tiahility)
Minor i2 . H # # modified AC, add I )T. Ullo-Basic Only # 13
Major 12 . 12 # # MEDIUM OVERLAY Modentte l1-r- ,O # 13 >2 to 4", 3" used. Iflop layer is made from (98%£eliabiHty) Minor 10 9 13 12
modilled AC add I yr. Basic Only , 8 12 II
THIN OVERLAY Major io 10 # # (2" HBP) !flop layer is made Moderate ~ ---to 8
13 12 from (98~liabilny) modilled AC, add I )T. Minor 8 7 11 10
Basic Only 7 I 6 10 9
SMA(U -2") Major U U # # If over CrPR., must be2.2" Modaato 11 I 10 # 13
Minor 10 I 9 13 12
Basic Only 9 I 8 12 11
MICRO SURFACING Basic/Minor j; , 4 6 5 1M; ••• ri';. fi""" nt. • I • • ,
I GRlNDIMICRO-MILL Minor 2 2 6 6
# YFLs for these cells were 14. or higher, removed as unJ..ibly combinations for lO-yr design.
Table Notes: ( Columns are a1ternalely shaded for easier reading) 1. Years Functional Life (YFL) is defined as the life predicted by the COOT Network PMS al time of construclion, al this lime il is synonymous with RSL. 2. Defined as any applicable treatmenl (see Conditions for Use) 10 the existing ]l6vetnenl prior to placing new HBP or other wearing surfaces. The four calegories (the fu:st three include Ba.ic) are defined as follows: • Major: (1) Cold-in-place recycle, 4" or greater or (2) Cold mill >3"(and replace losl SN). (In thl. table, the SN replacement thiclme.s is 10 be added to original Wearing Surface thickness) • Moderate: (I) Cold mill >1.5"10 3" (& replace losl SN), (2) hOI-in-place recycling> 1.S". or (3) fill non-plastic ruts (>0.5" to 1.5") with micro surfacing. • Minor: (1) Cold mill >0.75" - IS' (& replace lost SN), (2) hot-in-place recycle 0.75" - 1.5", (3) fabric interlayer (4) or fill non-plastic ruts «0.5" ) with micro surf
22
Long. or Bbck Load Assoc (A1ig or NP Rutting (B17) Raveling or Blooding Cracking~, II) Leng) Cnddng (B4 1f plastic. see note 5 Weathering (B 16) (B5)
Med High Med High Med High Med High No Dqve<
- # # # # # -4--# # # _NA _
• if # # • # # # t.:\
-:!- r - j # # " +J # # ~L , .:: # # ~~. . j 1:3 NA NA NA
• I' # # ~ ',---!! # # "IA ~ ~ # # S 1'1 # # '<A , • I n # 13 _lL 12 # 13 NA
n 12 13 12 U 11 13 NA l<".l. # " # # • it # # NA II 1L # 13 I~- __ 12 # 13 N~ _ _ --I'!. 11 13 12 12 11 13 12 $
II ro 12 11 11 10 12 NA NA
- , .' # # .~ . :~. # # _l:<L • I ji: # # • 13 # # NA , , n # 13 n 1~ # 13 10 n I 12 13 12 12 11 13 NA NA
6 i
5 6 5 6 , 5 7 6 N~~ .. . ' • , < , "'. "'. "' ..
R\ , . "'A NA NA 6 ' . 6 NA NA NA
• Basic: Includes, but is not limited to, ]l6lching isolaled weak areas, levelmg up 100.75" average by milling or HBP, or CIllCk mHng, as appropriale for the subsidiary treatment selected. 3. The YFL by Cracking index is listed firsl as it is crilical 10 perfonnance and affects Ride and OP!. If by the PMS condition plot, either the Transverse or Cracking RSL at time of design are as indicaled, YFL by Cracking Index is .s shown. Use '!hese YFLs for Cnocking regardless of whether Transverse crncking is predominate, or not. 4. The degrees of distress in the five categories below are to be arrived al subjectively by PMS data and/or project evaluation and include extent. The YFLs shown are those predicted from OPI by PMS. 5. For medium 10 severe plastic rutting, il is presumed thaI little cracking and no mveling is present. For these conditions, repair by milling and replacing in accordance with CDOT guidelines shall be done. The pavement is then presumed to be restored to its original design life.

GUIDELINES FOR SELECTION OF REHABILITATION STRATEGIES for ASPHALT PAVEMENT
APPENDIX A
Contents
Research Study Plan .......................... ........... ... ......... ................... .......... ........ ................ ............. A-2
Work Plan .................. .................................. ............................................................................... A-2
Study Plan Summary .. ................... ........... ................ ............ ............... ..... ....... .................. .......... A-4
Summary of Questionnaire, Part II General ..... ......... ....... ... ................... ... .... .... ........... ....... .......... A-l7
List of Tables
Table A-l Summary of LiteraturelPubIications Reviewed ........................................................... A-5
Table A-2 Summary of Questiommire, Part I: Interviews ............................................................ A-l2
A-l

GUIDELINES FOR SELECTION OF REHABILITATION STRATEGIES for ASPHAL T PAVEMENT
APPENDIX A RESEARCH STUDY PLAN An abbreviated outline of the Research Study Plan for developing the Guidelines for Selection of Rehabilitation Strategies for Asphalt Pavement is presented below.
Research Study Panel The Research Study Panel, convened in the spring of 1999, consisted of the following:
Tim Aschenbrener, CDOT Staff Materials Greg Lowery, CDOT Staff Materials Dave Gonser, CDOT Region 2 Bernie Kuta, FHW A Tom Peterson, CAPA Scott Shuler, LaFarge Co. Richard Zamora, CDOT Staff Materials and Donna Harmelink, CDOT Research, as Study Manager
Work Plan (1) Literature Review: The Study Panel compiled 14 references for publications and literature from several States and various other sources for the principal researcher (PR) to review. The PR located several additional literature references which were added to the list, making a total of 21 references that were formally reviewed. Table A-I lists the references and summarizes the reviews. Each report is listed in order of its importance, or contribution to the study. Several other publications were consulted by the PR; they appear in a separate reference list.
Had the panel had a clearer idea of the direction this research would take, perhaps more references would have been located preliminarily having a closer relationship to the study. By the time the true direction was known, allotted funding and time did not permit additional forma1literature searches and reviews. The direction taken was to estimate field performance of rehabilitated pavements as characterized by network PMS condition indexes over several years. This data was then compared with the category and degree of distress in the existiog surface and the rehabilitation strategy used. Appendix B described the limited but valuable work done along this line.
Only the first two publications listed, the Department's new Pavement Design Manual, October 1999, and the Distress Identification Manual for the Long-Term Pavement Performance Project, SHRP-P-338, 1993, were of much value to the study. The next 10 were of some value. The main contribution of the literature was the development of a clear understanding of the current flexible pavement design procedures in Colorado and how flexible pavement distresses in many agencies are categorized and tabulated. From the literature, it is obvious that transverse (and reflected transverse) cracking is one of the most pervasive and difficult problems to correct. The only sure methods of correcting this distress are removal (deep cold milling) or reconstruction. Other treatments, depending on the amount of effort and cost, can delay onset of reflected transverse cracking by one to perhaps three years.
Publication #6, L TPP Rehabilitation Performance Trends, summarizes the Performance Trends for SPS-5, Rehabilitation of Asphalt Concrete Pavements. One significant finding, based on project observations in the several participating states, was that with overlay thicknesses of two and five inches, non-load-associated cracking was appearing after only three years in both thicknesses.
A-2

Ruts and load-associated cracks have a low redevelopment rate in both thicknesses. This finding agrees substantially with the CDOT Pavement Management condition index Study reported in AppendixB.
(2) Rehabilitation Strategies: The Panel had identified eight rehabilitation strategies to be considered. The PR was to confirm these and investigate to detennine if others should be added. Tables FL-l and FL-2 in the Guide list the strategies chosen, six wearing surfaces (including three HBP thickness categories) and five subsidiary strategies (cold milling, hot-in-place recycling and rut filling each have more than one level of effort). It should be noted that none of the finaI strategies are new to CnOT. All have been used to one degree or another. Some are frequently used. The literature search revealed no methods of rehabiltation that CDOT was not aware of. Each strategy, and its conditions for use, is described in detail in the Guide.
(3) Pavement Distresses: The Panel had identified nine flexible pavement distresses to be considered. Five of these are used at the project evaluation level and at the Network PMS level. The other four are used only at the project level. The PR was to confirm these and investigate to determine if others should be added or if any should be dropped. The only one listed by the panel not included in the decision tables was stripping (it being a specific distress with only one reasonable treatment). It is addressed in the Guide text, however. Tables FL-l and FL-2 list the distresses and levels of severity chosen. In the first two columns of each table, the two combined cracking distresses and severity levels come only from the PMS ratings. These columns are used unless the distresses are less severe than the threshold values noted. If not that severe, selection is then made from six other distresses or combinations (each with two severities) as tabulated. One category and one severity are selected as predominant for each representation on the project. Low severity was not included as it is unlikely that rehabilitation will be scheduled for this level as the predominant distress. See the Guide for more details.
(4) Selection of Interviewees: The Panel included a list of experts (mostly CDOT) and their areas of expertise (rehabilitation strategies, usually on specific projects) for the PR to interview, using a question format as discussed under No 5, below. The PR was free to change the list with Panel approval. Essentially, the list was followed as offered.
(5) Interviews (and development of question list): Direction was given by the panel as to the questions to be included when interviewing. Approval was required before use. Using the Panel suggestions as a base, a two-part questionnaire was developed by the PRo
The Questionnaire, Part I was project specific; the questions are summarized as follows: Project identity, Location, & Climate? Condition of existing pavement (OPI)? Existing distress type & severity? Existing strnctural section? Rehabilitation strategy used (including materials & layer details)? Why was this strategy chosen? Was reconstrnction an option? Was underground or suiface drainage improvement done? Design life and ESALS? Expected failure mode? Was LCCA done? What were traffic disruptions? Was the project rural or urban? What constraints affected the strategy selection? Did local maintenance personnel contribute to rehabilitation decision? Problems during construction? Any materials or work not in substantial compliance? Time frame of critical construction? Negative effects of weather? At present, is the pavement perfonning as expected? (See comments below on the four italicized questions). A copy of the detailed questionnaire is available on request.
A-3

The interview results have been summarized in Table A-2. Interviews involved 23 people relative to 17 specific rehabilitation projects. Four people were asked general questions about specific strategies. Nine of the 17 specific projects were chosen for PMS condition evaluations, before and after construction, as related to preconstructing distress, strategy and predicted YFL. The description blocks for the nine projects are outlined in bold in Table A-2. See Appendix B for the details of the PMS study.
Four questions were not summarized in Table A-2. (I) Question was asked ifsurface or groundwater drainage was improved. For these projects, all answers were "NO." (2) Question was asked as to expected failure mode. Answer: In most cases, respondents expected failure from non load associated cracking, predominantly from transverse; exception was for CIP recycling where the expected failure mode was by fatigue cracking. (3) Question was asked if life-cycle-cost analyses (LCCA) had been done to compare multiple strategies on these specific projects. Answer: According to respondents, LCCA studies had been done only in Region 5, then to justify cold recycling with 20-year overlays. (4) Question asked about local maintenance forces' contribution to the rehabilitation decision. Answer: Generally, maintenance forces were not involved in the selection of specific rehabilitation strategies; however, maintenance forces were frequently involved in various phases of planning and field reviews for most projects
Questionnaire, Part II, General. The questions and summarized answers follow Table A-2. Note the answers to Question 3, regarding the most common distresses, and Question 4 regarding distresses most difficult to correct. Transverse cracks, thermal cracks, and cracking in general were most frequently mentioned. Based on these answers, and (2) in the above paragraph, selecting rehabilitation strategies that stop or significantly slow the onset of reflected transverse cracks should be of the highest CDOT priority.
(6) Compile Information from the Literature Review and from the Study Research, Then Submit a Final Report (Guide): The Guide, in the first part of this publication, fills the requirements as outlined above and in the Study Plan.
STUDY PLAN SUMMARY There was much in the literature about thickness design and prioritizing maintenance and rehabilitation. Several reports and lnanuals contained details on how to do the various treatments. These details were not the main focus of the investigation, so they were of little benefit. In the literature, it was generally accepted that transverse cracking is an extremely difficult distress to correct and that breaking up the existing crack pattern is the only reasonably sure treatment. If the crack pattern is not substantially disrupted, it is sure to repeat. It is only a matter of time. The literature was helpful toward writing the Guide section, "Candidate Rehabilitation Strategies: Conditions for Use, Advantages, and Constraints."
The interviews, conducted mostly with CDOT field personnel at the management level, were very valuable in establishing and verifying the general direction of this report. The people were knowledgeable and helpful.
Appendix B reports on a relatively small satellite study for the Guide that was not originally included in the Study Plan. The summary and conclusions from that study are included in the report and are referred to in the Guide.
A-4

Table A-I
SUMMARY OF LITERATUREIPUBLICATIONS REVIEWED
NAMES of PUBLICATION SUMMARY REFERENCES and !l. of Ij Parts Used or That
SUMMARY OF CONTENTS j RELEVANT PARTS or CHAPTERS Influenced This Guide
Colo. Department of Tran'portation (CDOl). 101 in It is very relevant, particularly the parts relative to flexible pavement Very Section 5.3.1. Pavement Design Manual. October 1999. the rehabilitation. It modifies the 1993 AASHTO guide by removing data much ... Rehabilitation Alternatives;
text, den'vations and parts inapplicable to COOT's working practice. it ;3 particularly valuable, as Presented are COOT's methods and guidelines/or pius Incorporated are the many COOT policies and procedures that are based #1 is all of 5.6 related to asphalt designing and rehabilitating pavements, including 64 on upen'ence and current practice in Colorado. The result is a suifaces and pertinent parts asphalt (flexible) pavements. rigid (pcCP app- comprehensive document that, although complex, is much easier to read of the three appendices were pavements), and composite structure.!. ended and follow than the AASHTO guide. [t addresses COOT's needs and was referenced.
referenced e:xteruively for this Guide.
Distress Identification Manual for the Long- 147 As a "distress dictionary, .. the manual will improve inter- and intra- Much This Guide has been Term Pavement Performance Project (LTPP). agency communication and lead to more uniform evaluations of developed with the intent that Strategic Highway Research Program, SHRP-P-338, pavement distress and peiformance. Most relevant to this Guide is this LTPP manual wU/ be the National Research Council . 1993. Section 1, Di3tresses with Asphalt Concrete Suifaces. It is important that #2 3taruk"yJfor measuring
detailed, project-level, distress surveys be made using an established, similarly identified di3tresses This manual 'WaS developed e3pecially for the LITP common measuring procedure. For uniformity, it is particularly at the Project level. For each program. It provides a common language for necessary when using this Guide as a tool to aid in selecting the distress, there is a measuring describing cracks, potholes, rutting. spalling and rehabilitation strategy. There are 15 distre.J.ses listed for asphalt surfaced diagram. Three levels of other pavement distresses. pavements, while COOT has chosen to use seven for inclusion in the severity are identified with
decision chart in this Guide. (See Tables FL-1 & 2 for correlation). color photos examples.
Techniques for Pavement Rehabilitation. Each Block 2 emphasizes the need for, and how to make a thorough project- 8<Jme This NHI course served as a National Highway institute COUI1ie # 13108, rev. mod- level evalwali"" of the existing pavement. A good reference. bwt COOT's review and reference while August 1998. u1eha new Design Manual is adequate for most applications. Block 3, Module this Guide was being
its 3-11, identifyingfeasibleflexible pavement rehabilitation alternatives, #3 developed. No direct The manual, in j Blocks, each with several own was valuable a reference for this Guide. Block 5 is about selection of information was found which modules, is priman'ly for training and includes pg#s, preferred alternatives. Its emphasis is life cycle cost analyses. COOT's WOIlld indicate how long updated rehabilitation technology for both flexible total Design manual adequately covers this. The effects ofloeal traffic. climate pavements really last that and rigid pavements. Included are project pgs and estimated life of each treatment strategy is not directly addressed. have been structurally evaluation, construction procedures and selection =100s This remains an Agency problem, e.g., the reason for development of this designed by AASHTO of the most appropriate treatments at the project GaMe. (COOl) procedures. level. The final block is on evalwting alternate strategies.
A-5

Table A-I
SUMMARY OF LITERA TUREIPUBLICA TIONS REVIEWED
NAMES of PUBLICATION SUMMARY REFERENCES and !l- of J~ Parts Used or That
SUMMARY OF CONTENTS ~ RELEVANT PARTS or CHAPTERS Influenced This Guide
Colo. Department of Transportation (CDOl). 16 The manualis relevant, but outdated. Part 1II oJthe 1986 (and the 1993) Some It served as a valuable Guidelines for Rehabilitation with Ove,lays. July AASHTO is the Pavement Design Procedures Jor Rehabilitation of reference when initiating this 1992. Exi3ting Pavemen13. The COOT condensation se",ed Cl3 a reference for project. No direct references
this Guide. It presents methods and guidelines for designing and #4 have been made to the J 992 An abbreviated version of some pertinent parts of rehabilitating pavements, including asphalt concrete, portland cement Guidelines which have been I
Chapter 5, Part III (without the Tables and concrete. and composite structures with overlays, incorporated into the new Figures), oJthel986 AASHTO GUIDE for De3ign Manual DESIGN of PAVEMENT STRUCTURES. The 1993 version is descdbed below.
Pavement RehabilitatioD MaDual, Vol II: 163 This manual is well organized with strategies for specific distresses and Some New York has the policy of Treatment Selection, Materials Bureau, NY State plus 3 constraints listed for the conditions indicated at lefl. The Section on selecting treatment strategy & Dept of Transportation, Rev. 1993. appe- lflexible pavements lists three corrective maintenance strategies for a OL thickness to provide a
ndices. vanable list of five distre~. This is follav.>eJ by seven rehabilitation constant service IJle for all It is used in conjunction with Vol. I, (#19, below) strategies for a variable list of five distresses. For both, corrective #5 projects. COOT van'es to select pavement treatment alternatives and maintenance and rehabilitation, constructabiUty advantages and treatment strotegies and, develop life cycle costs for the collected distresses. disadvantages, peifonnance characteristics, expected failure modes, and thicknesses, including OL, for Included are treatment strategies for preventive expected .service lives are listed. The expected service lives are a combinations that give each maintenance, corrective maintenance, constant & Yrsfor each maintenance treatment and a constant 1S Yrsfor project a unique service life. rehabilitation, and reconstruction for rigid, flexible each rehabilitation strategy. For a project, treatment strategy and CDOT has more than 30 and composite pavements. thickness is selected based on degree of distres3 from a visual survey. OL strategy combinations,
thicknesses are not detennined by nondestnJctive deflection testing. compared to 7 Jor NY.
Rehabilitation Performance Trends: EfJJ'ly 51 Chap. 3. Performance Comparilonl. Some Table 8. Summary oj ObserwJ/iofts From Long-Term Pavement text, Pufo,,"lIIIu Treltds for SI'S-S, Rehab. oj Asphalt CotJC PIIW1IImD apparent effects of various Perfo,lIJ(Jltce (LTPp) Specific PtlVellletrJ Studies total = (Aq, parameters on performance oj (SPS). Jan.1998. 245 Overlay (OL) thicknesses were 2 & 5". Non load-associated cracking is #6 SPS-5 projects.
appearing after only three years in both 2 & 5"OL. Ruts and load- Table 9. Summary oj This report documents the early observations from associated cracks have a law redevelopment rate in both 2 & 5". apparent effects 0/ various tire LTPP SPS conducted as part oj the LTPP Per/o'lIJ(Jltce T,ends fo, SPS-6, Rehab. of Jointed Concrete parameters on perfonnance oJ Program Data Insight conducted to identify initial Pavements (JCP) SPS-6 projects. lindings from the test sections established Jor this For JCP overlaid with 4" AC, reflection cracks developed at j oints in And various text conciU3ions. program. 1-2 yrs. However. ride quality is much better compared to that prior to See GuMe text lor references.
overlay. - - ----
A-6
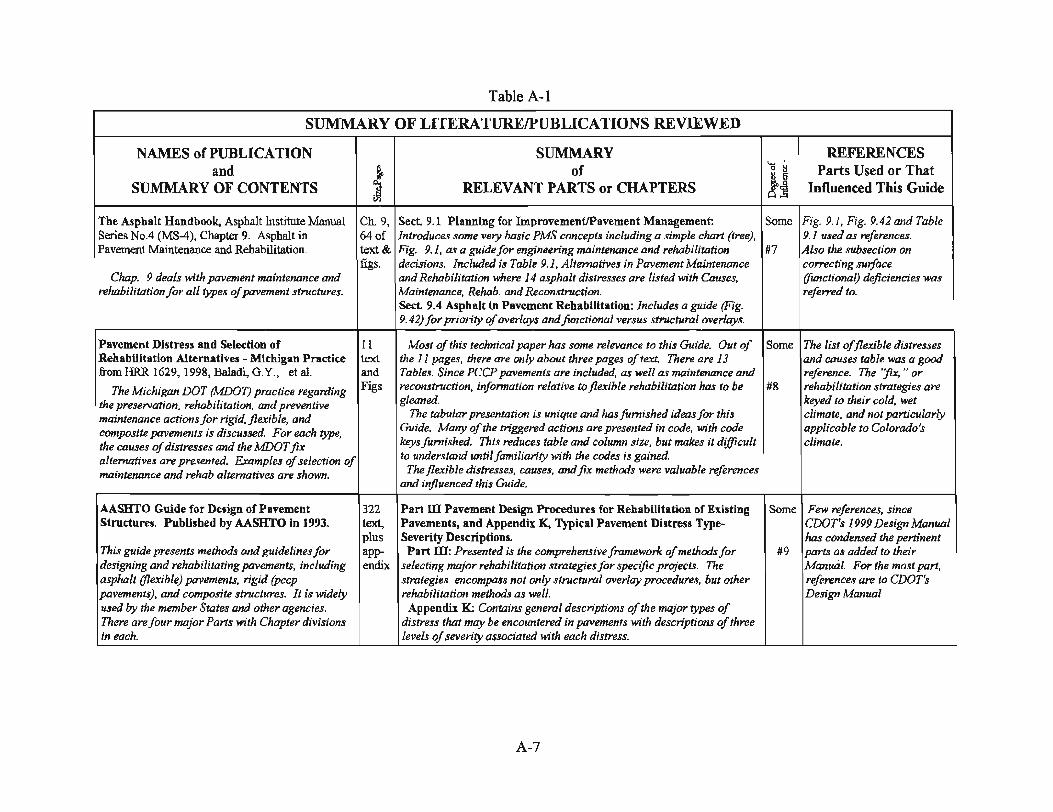
Table A-I
SUMMARY OF LlTERATUID:/PUBLlCATlONS REVIEWED
NAMES of PUBLICATION SUMMARY REFERENCES and E- of Jj Parts Used or That
SUMMARY OF CONTENTS l RELEVANT PARTS or CHAPTERS Influenced This Guide
The A.phalt Handbook, Asphalt Institute Manual Ch.9, Sect. 9.1 Planning for ImprovementIPavement Management: Some Fig. 9.1, Fig. 9.42 and Table Series No.4 (MS-4), Chapter 9. Asphalt in 64 of Introduces some very basic PMS concepts including a simple chart (tree), 9.1 used as references. Pavement Maintenance and Rehabilitation. text & Fig. 9.1. as a guide for engineering maintenance and rehabilitation #7 Also (he subsection on
figs. decisions. Included;s Table 9.1. Alternatives in Pavement Maintenance correcting surface Chap. 9 deals with pavement maintenance and and Rehabilitation where 14 asphalt distresses are listed with COWles. (functional) deficiencies was
rehabilitation for all types a/pavement structures. Maintenance, Rehab. and Reconstruction. referred to. Se<l 9.4 A.phalt In Pavement Rehabllitatioa: Includes a guide (Fig. 9. 42) for priority of overlays andfunctional versus structural overlays.
Pavement Distress and Selection of 11 Most of this technical paper has some relevance to this Guide. Out of Some The list of flexible distresses ,
Rebabilltation Alternatives - Michigan Practice text the 11 pages, there are only about three pages of text. There are 13 and causes table was a good from IlRR 1629, 1998, B.ladi, G.Y., et aJ. and Tables. Since PCCP pavements are included, as well as maintenance and reference. The ''fix, " or
The Michigan DOT (MDOT) proch·ce regarding Figs reconstnlction, infonnation relative to flexible rehabilitation has to be #8 rehabilitation strategies are
the preservah'on, rehabilitation, and preventive gleaned. keyed to their cold, wet
maintenance actions for rigid. flexible. and The tabular presentatioo is unique and has furnished ideas for this climate, and not particularly
composite pavements is discussed. For each type, Guide. Many of the tn'ggered actions are presented in code. with code applicable to Colorado's
the CQll3es of distresses and the MDOT fix keys furnished. This reduces table and column size, but makes it difficult climate.
alternatives are presented. Examples of selection of to understand untilfamiliaritywith the codes is gained.
maintenance and rehab alternatives are shawn. The flexible distresses, causes, and fix methods were valuable references and influenced this Guide.
AASHTO Guide for Design of Pavement 322 Part m Pavement Design Procedure. for Rehabilitation of Exi.tlng Some Few references, since Structure •. Published by AASHTO In 1993. text, Pavements, and Appendix K, Typical Pavement Distress Type- CDOT's 1999 DeSign Manual
plus Severity Descriptions. has condensed the pertinent This guide presents methods and guidelines/or app- Part m: Presented is the comprehensive framework of methods for #9 part3 as added to their designing and rehabiUtating pavements. including endix selecting major rehabilitation strategies/or specific projects. The Manual. For the most part, asphalt (flexible) pavements, rigid (peep strategies encompass not only structural overlay procedure3, but other references are to CDOT's pavements), and composite structure3. It is widely rehabilitation methods as well. DeSign Manual UJed by the member States and other agencies. Appendix K: Contains general descriptions of the major types of There are four major Pans with Chapter divisions distress that may be encountered in pavements with descriptions of three ~each. levels of seven'ty a~sociated with each !!istress.
- .- -_. - --- --_.---
A-7

Table A-I
SUMMARY 0]<' LITERATURE/PUBLICATIONS REVIEWED
NAMES of PUBLICATION SUMMARY REFERENCES and i- of Jj Parts Used or That
SUMMARY OF CONTENTS l RELEVANT PARTS or CHAPTERS Influenced This Guide
Calif. Depart. of Transportation (CaIDot). 9 A series of hand.drawn flaw diagrams. one diagram for each of seven Some All seven trees were Proposed Preventative Maintenance Strategies, asphalt pavement distresses are shawn. Four climates, 3 traffic levels, considered, but not used Internal letter by R.N. Doty to J.R. Cropper, 1986. and 3 autfoce conditions are shown with codes for 1--8 .different alternale directly.
strategies listed under each of the 36 branches. Although never used by #10 Attachments are related to preventive paintenance CalDot. the trees served as a an idea model in developing this Guide. shOWing several maintenance strategy trees (never used) that could serve as models for CDOT Rehab. Strategies.
Federal Funding for Preventive Maintenance - 11 It is an excellent paper explaining the FHWA regulations regarding Some None of the information in Implication. to State & Local Highway Agencies. plus federal aidfundingfor preventive by SHAs on the federal aid system. this paper has been included Purdue Vniv. Term Paper by Tom Petersou. 1994. ref. Traditionally. PREVENTIVE maintenance has not been eligible for in this Guide, however, it is
And l/edera/ aid. Under this program, if an SHA has a pavement management #11 included here for reference as This paper explains the complex Regulations and attch. sysfem which shaws treatments are cost-effective and have an expected having some relevance. legislation involved in the federal funding of the service life o/five years, they can become eligible/or Federal aid. 3R I4R program. Graphs, charts and tables serve to Though not directly applicable to selection of rehabilitation strategies, it enhance understanding a/the topic. is very relevant to researchers and practitioners working with
rehabilitation of pavements.
Pavement Recycling Guidelines for State and Appro Covered are all aspects of asphalt pavement recycling. including hot & Some The follOWing Chapters had Local Governments FHWA-SA-98-42. By Prithvi x cold, as well as in-place & central plant strategies, Economics. some influence on this Guide: S. Kandhal and Rajib B. Mallick. 100 environmental i.J.!Ues, energy conservation. mix design, structural design. Chap 3 on Strategies; 9, 10 &
.Jpecijications and results of surveys (from states and agencies) are #12 11 on Hot-in-Place Included in this report is information regarding included. For this Guide, the primary interest is in cold and hot in-place techniques; 13. J 4 & 15 on hot-in-place and cold-in-place recycling, It is a recycling strategies; however the entire report is valuable and should be Cold Recycling; and "participant's" reference bookfor a series of 2.day a readily available reference for decision makers sen'ously considering Appendix B (NM specification workshops. either of the two strategies. Comprehensive reference lists are found at lr~r cold-in-place recycling.
the end of each chapter.
Colo. Department of Transportation (CDOl). 18 Tire focus of this manual is pn'marily preventive maintenance. However; A Probably the most valuable GuUJelinesfo,Sur/ace T,eiltmenL July 1994. Chapter 3. Asphalt Overlays. provides a good description of s tructural little portion are the five condih'ons
andfunctional overlays and the condition.! where each might be where an asphalt overlay These guidelines address crack filling, joint considered. #13 would not be feasible (of any resealing, seal coats and thin asphalt overlays, thickness) . essenh'olly preventive maintenance,
A-8

Table A-I
SUMMARY m' LITERATUREfPUBLICATIONS REVIEWED
NAMES of PUBLICATION SUMMARY REFERENCES and ~ of IJ Parts Used or That
SUMMARY OF CONTENTS ~ RELEVANT PARTS or CHAPTERS Influenced This Guide
Calif. Depart. of Tran.portation (CalDot). 22 According to 611.2. PavemenrManagement System (described only A Some of the guidelines and Highway Design Manua/, Topic 611, PavemenJ of text bn'efly), most ofCalDOT's procedures for selection of rehabilitation little constraints in 611.9 provided Structu,al Section RehabiliLaJion. July 1995. strategies are included in their PMS. This includes analyzing the extent some assistance in developing
and severity of pavement distress. identifying potential repair strategie3 this Guide. Topic 611 briefly describes thei, PMS. details and alternatives. PMS develops a statewide list based on triggering #14 asphalt pavemelJt failure types and describes lractors and a decision tree. In 611.6, the list a/asphalt pavement/ailure rehabilitation strategies (most of which is types is comprehensive and differs little/rom other literature. In 611.9 maintenance or reconstruction). Overlays, hot and overlays and hot and cold recycling are addressed bn·ejly. Also, a few cold "'cycling are briefly disCU33ed. general guidelines/or pavement rehabilitation strategies and possible
constraints are presented.
Michigan DepL Of Tnln'portation (MDOT). 21 It includes seven asphalt pavement treatment strategies, three o/which Very See the column second at left. Highway Preventive Maintenance Progra~ are described in this Guide. Approximately 1-112 poges of text describes little
Guidelines, presumed as 1998. each, its purpose, limitations, expected life, cost, etc. The three flexible pavement strategies are: Non-structural HBP overlay (1-1/2"), Suiface #15
This guide is a Simplistic. easy to understand milling and 1-1/2" of overlay. and micro-suifacing. The descn'bed document, limited to prevenn'lIe maintenance as details oj each o/the three were compared to similar ones in this Guide, defined by MDOT. and influenced it in minor ways, In addition to the asphalt treatment Very little of the detail desired by COOT is strategies, seven are listed for rigid pavements, included.
Michigan DepL Of Tnln'portation (MOOT). 5 The report had no direct influence on this Guide. 11 does, however, Very See the column second at left. Savings From Preventive Maintenance (no date, confinn similar findings to those of others, e,g" one dollar spent on little estimated as 1997). preventive maintenance (early in the pavement life cycle) will return as
much as 11 dollars spent/or rehabilitation and reconstruction where the #16 This is a 5-poge report by L. Galehouse. MDOT. pavement ;s nean'ng the end of its service life, or a cosl advantage of that documents the significant savings experienced eleven to one, over a 5-yeor period by largely following the outlined policies.
A-9

Table A-I
SUMMARY 01<' LITERATUREIPUBLICATIONS REVIEWED
NAMES of PUBLICA nON SUMMARY REFERENCES and !l- of Jj Parts Used or That
SUMMARY OF CONTENTS ~ RELEVANT PARTS or CHAPTERS Influenced This Guide
Benefits of Pavement Maintenance· An Update. 28 The paper addresses techniques which can be used to better manage the Very See the column secand at left. By Hicks, Jackson and Moulthrop. Presented at the investment in the current highway system. According to the authors, it little Western Pavement Maintenance Forwn, Jan. 1998 was designed specifically for fiscal decision nrakers; hence the content
was non technical. (Note: It was a meeting hand-out that accompanied #17 This paper describes causes of pavement an oral presentation with visual aides. Although interesting. it has little deterioration. preservation techniques, and the practical value to this project. CDOT already i" in the process of importance of timely maintenance on reducing casu adopting sim;[ar policies) to agencies and users.
How to Select Pavement Rehab Strategies. By D. 2 The article addresses concepts discussed in detail in the 1999 COOT Very See the column second at lefl. Morian and G. Cumberledge. Better Roads, J\U1e Pavement Design Manual. It has a feel~good tone, and there is nothing little 98. included that would be in conflict with COOT policies. However, no
guidelines are included for selecn'ng the right rehabilitation strategies #18 Tlris article is a very abbreviated, non~technical lior any given distress, or as to haw life spans of the various strategies statement about properly evaluating existing compare. distressed pavements and selecting the correct rehabi/iwn'on strategies.
Pavement Rehabilitation Manual, Vol I: 70. Part 1. of the NY two-volume set, it presents information/or identifying, Very See the column second at left. Pavement Evaluation Manual. Materials Bureau, inc/. collecting and reporting pavement distresses. Its function is similar to little NY State Dept ofTransportation, Rev. 1992. Appe- that oJthe LTPP Distress Identification Manual (deSCribed above). Ifwe
ndices didn't have the latter, il would be particuwrly valuable kJ COOT. This Volume contains uniform procedures for However, the LTPP manual is more recent. the photos are in color and it #19 determining the condition of pavement and being nationally recognized, is more appropriate for COOT use. This is shoulders. It includes standard forms and examples especially so, since we did not directly adopt Vol. II. but instead used its ,for collecting the data. This manual is concepts to a.ulat in developing this Guide. Some of the forms and complimented by Vol. II described abave. reportingJormats cauld be valuable ,..JerencosJor COOT person""l at
the Region level.
A-IO
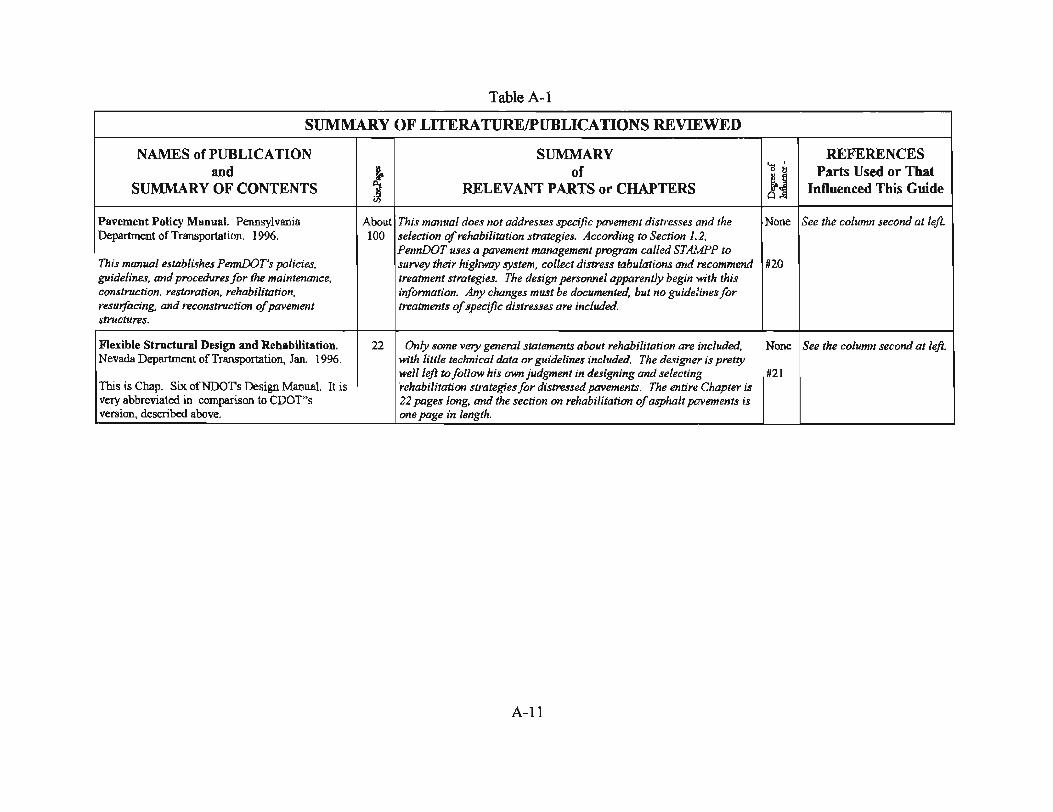
Table A-I
SUMMARY OF LITERATUREIPUBLICATIONS REVIEWED
NAMES of PUBLICATION SUMMARY REFERENCES and i- of Jj Parts Used or That
SUMMARY OF CONTENTS ~ RELEVANT PARTS or CHAPTERS Influenced This Guide
Pavement Policy MaDual. Pennsylvania About This manual does not addresses specific pavement distresses and the None See the column second at left. ' Department of Transportation. 1996. 100 selection a/rehabilitation strategies. According to Section 1.2,
PennDOT U3es a pavement management program called ST Al.JPP to This manual establishes PennOOT',s policies, survey their highway system, collect distress tabulations and recommend #20 guidelines, and procedures for the maintenance, treatment strategies. The design persowlel apparently begin with this construction, restoration. rehabilitation, information. Any changes must be documented, but no guidelines for resuifacing, and reconstruction of pavement treatments of specific distresses are included. structures.
Flexible Structural De'lgn and Rehabilitation. 22 Only some very general statements about rehabilitation are included. None See the column second at left. Nevada Department of Transportation, Jan. 1996. with little technical data or guidelines included. The designer is pretty
well left to follow his own judgment in de.Jigning and selecting #21 This is Chap. Six ofNDOTs Design Manual. It is rehabilitation strategies for distressed pavements. The entire Chapter is very abbreviated in comparison to CooT"s 22 pages long, and the section on rehabilitation of asphalt pavements is version, described above. one page in length.
A-II

Table A-2 SUMMARY OF QUESTIONNAIRE PART I: INTERVIEWS
Rehabilitation Strategy Brief Description of Rehab. Subsidiary Design Yrs (Est) OPI & Predominant Rural Constraints, Problems, Performance
(The projects reported here are not Strategy, Year Constructed Treatment and Condition Distress or Precautions, Warnings , To-Date
necessarily representative for (Note: Bold outline indicates or Wearing- ESALs Description When Treated Urban Comments
CDOT) projects used in PMS study, Surl'ace 'xffi
Wearing Surfaces with Subsidiary Stratein' as Indicated (See Appn. B for PMS study on projects outlined in BOLD)
Thick Overlay (>4 to 6'? (2.ln Region 6. ' Grade I Normal 10 yrs, Est. at 65, I Rutted from I Urban Existmg soil support & I Very good, ·C· over 8" peep, leveling + pre- 2104 fair. wear, faulted moisture needed for all some
Two CDOT project s two 2" courses. Done in treatment million PCCP overlay strategies. reflection
Two people interviewed 1988. ESAL, Should locate & use cracks, not a as-built soil profile maintenance
problem
(2) In Reg. 6, 2.5 mil. Milled 0.7", 10 yrs, OPI = SO, Low toMed Rural No problems on Good in uphill overlay of 4.26" with HBP placed 1.34 million good to fair severity non- construction. The lanes, 5)'1"8
Grad. C on portions of US paving ESALs. condition. load cracking, Grading C desiened by RSL. Fair in 285, E & WofC340. fabric. low ruttiDe. Texas Gyratory is not down hill
1~~~15~&over 11"base. I :.,~,:~~g as w.~ ::: "p I ~~;s, 2yrs
Medium Overlay (>2 to 4,,)? (1) 3" SuperPave Grading S Cold milled 10 yrs. opr 57, 1.5 Per Reg, Low Urban Well designed SP mix, In '99, 10 yrs
One CDOT project on existing 12" AC. Prev. OL aver of 0 .5" ESALs= yrs RSL. LALC,70% treatment and/or OL RSL for ride,
One person interviewed 11 & 13 yrs old. Located on in driving 7.8 million Crack Index extentJ SC = thickness not adequate only 3 yrs RSI
(Many medium overlays are 125 in Reg 6, 120th Ave - SH lane, 54 .. ByPMS. 0.30. With to provent severe byLALC!
routinely done in all Regions, 7. done in 1997. LALCIndx= Crk lndxof reflective Cl'acks . OL Poor
77, Trnsv =0 54,maybe needed was maybe 6" Performance! this project was selective.) 0.20? with S" mill?
Thin Overlay ~2'? HBP Grade "ex", over AC, MinllnaI 4--6 yrs, Est@50-SO, Fatigue with Rural Today, project would be Per Region ,
One CDOT project 1.0 to 1.5 .. overlay on 35- pJ'e- 200 to 400 fair to poor. misc. classed as machine equal or
One person interviewed miles of 2-lane, in 1992 on treatment thousand cracking. patching or a better than US 666 NW of Cortez. maintenance overlay I Dredieted.
A·12

Table A-2 SUMMARY OF QUESTIONNAIRE, PART I: INTERVIEWS
Rehabilitation Strategy Brief Description of Rehab. Subsidiary Design Yrs (Est) OPl & Predominant Rural Constraints, Problems, Performance (The projects roported here are not Strategy. Ye8l' Constructed Treatment and Condition Distress or Precautions, Warnings, To-Date
neoossarily representative for (Note: Bold outline indicates or Wearing ESA!'; Description When Treated Urban Conunents CDOT) projects used in PMS study, SUl'face
" R)
Stone Matrix Asphalt (SMA) (I) Reg 4 Demo Proj , 2" SMA Minims.! 10 yrs, Est.@60, 60% load Mostly At first , difficult to In '98 no (3 different mix designs) preparation 607,000 fair to poor. associated rural achieve compaction; significant
Two CDOT projects used on several sections over prior to ESALs Est 2 yrs cracking; with mix adjustments rutting any
Three people interviewed 2-2.5 • Grade "CO HBP on SH lower lift remaining some transv. and roller pattern sections, low 119. Longmont - Boulder, in p}aooment. life. cracking. changes it was OK, cracking; 1994; 11,000 tonnes placed. minor drain-down of good
bitumen. performance
(J) In Reg 3, Gypsum-Eagle Only prep 10 yrs, 1995 OPl Weax ruts in Rural Some oompaction WBlanes on 125, 8 mi of 4-1ane. Exist was the 4 million was 55, 1 yr PMSC.Med problems (see ahove expected to sect 2 ft SB, 4" ABC, 5" AC oold milling ESA!.; RSL, fair to to high block notes). WB lanes Lean meet design & 0.75" PMSC. Top I" milled to remove poor cracking, on asphalt with higher life, EB lanes off and 1.5' of SMA placed. It Plant Mix condition cracking voids, EB lanes better. expected to was 3/8" nom size, 3% Seal and index = 37. Surface very smooth. exceed deign limestone filler with PC 76- level the No structural SMA surf may be more life. 28. Done in 1996. surface. distress. cost effective than SP.
Micro--Surfacing (1) Reg 1 placed treatment Minims.! Est.@5-1O OPI was 76. Low Rural Genera.lly no problems. Performing as on driving lanes only (+ ) ft pre- yrs. ESA!.; Est 3 yrs longitudinal. One day emulsion expected.
Two people interviewed onto shoulder) in 1998 on I treatment not used for RSL. & transverse setting was faulty. 70 in Eastern Colo. Selected design. Est. crackinr· Applied material because reconstruction 10-yr@5 removed & replaced. scheduled within 5 years million± Treat medium & severe
cracks before applying micro- surfacing.
GrindIMicro~Mill (1) In 1996, micro-milled 1.5" NA E.tRSL OPl66 Rutting, 0.75 Rural OL age now 16 yrs old. Milled section
Two CDOT projects to remove ruts in 12 yr oLd W8S0yrS. Rut Inde. = to 1.0 inches N of SH 119 .3-mi performing as
Two people interviewed 5.5" overlay of 5-mile section Est lO-yr 49. in depth. section is fair. South, expected ofPeCp on J 25, S ofSH 119 ESA!.; , Condition new ruts are 0.5". Can in Reg 4. 8 million. poor be milled again.
(2) Reg I Micro-milled to No No design OPJ80+/- Shoving of Rural Only 1-yr old. Done to Performing as remove a 3/4" PMSC in 1990 subsidiary yrs, PMSC, some prevent futher expected.
treatment preventive stripping in stripping of the maint. AC underlying AC.
(3) Reg I Diamond Ground No Est5-10yr OPl = 70+/- Mod. to severe Rurasl No problems Performing project in 1989 to remove subsidiary life. EASLs faulting. encountered better than faulting on PCCP. treatment not used, a expected.
maint. proj .
A-I3

Rehabilitation Strategy (The projects reported here are Dot
necessarily representative for COOT)
1
-Cold Mill (Aver_ 1" rural, usually more in Urban areas with grade control constraints)
One general One person interviewed
"'.'-1- A-2 SUMMARY OF QUESTIONNAIRE, PART I: INTERVIEWS
Brief Description of Rehab. Strategy, Year Con.structed (Note: Bold outline indicates projects used in PMS study,
oendix ID
Subsidiary Treatment or Wearing
Surfaoe
Design Yrs and
E8AL.
(Est) OP! & Condition
Description
Predominant I Rural Distress or
When Treated Urban
Constraints, Problems, Precautions, Warnings,
Conunents
Subsidiary Strategies with Wearing Surface as Indicated
(1) Reg 6 uses strategy (milliliU) frequently. Typical, mill 1.5" & fill 2.0"_ Mill & fill depths depend on existing soil modulus and effective SN by FWD.
Super-Pave Grading 8 or SMA
\l'h
Usually 10-yr design . E8AL8
Ivaryuom 500,000 to several million
OPlis typically 50-65, in fair to poor condition.
Non-load & load associated cracking, & rutting.
I Urban, Used where surface no elevation must be C & G maintained and there is
severe rustr Judgement supplements structural design by formula.
Performance To-Date
I Past
ihas been ... _ predieted_ SP use is slowing OP! reduction.
JHot-in-Place Recycle (1) Reg 6, Denver Metro, on Existing lO-yr OPI = SO. Cracking Urban Reconstzucti.oD not Mter 3 yrs, by (Heater Scarify) W. St.l!. Ave, from Approx. was 6-8" design,2.5 RSL =1.6 index was 38, considered because of PMS, OPl is
Four CDOT projects Union. To Colfax. Heater HBP ovor million rut index 30; lack of funds. No 90 and
N te o 3 & 4 b - d bOd Scarified 1" followed by 16-20" ESALs Fair to poor ruts 0.5" . constrains duo to grade projected RSL o . com me 1 . I S cti· ABC di - I· 15 Th I' . dover ay. orne se ODS were. con tIon. rontro , gutter IS +. rea peop e InteI"VleWe milled to below rut bottoms Overlay on matching, or otherwise. Trnsv Crack
and overlaid without heater HS was 2* Reg 6 was unfamiliar Index = 56 (This strategy has been used scarifying. Done in 1996. ofHBP with process, it went on many projects in most of the Moderate climate. Grading C. well, however.
IRegions, interviews were selective) (3) Reg I, 1 70, EI Rancho
Morrison Exit. Existing was 8" HBP on 4" ABC. Heater Scarified 1" followed by overlay. Done in 1999. Cool dry climate.
(4) R<>g I, US6, 170 to Golden. Existing was 3.5" HBP on 4" ABC. Heater Scarified 1" followed by overlay. Done in 1999. Cool dry climate.
Overlay 2" SuperPave Gr.dine 8/ AC-20R
Overlay 2" SuperPave Gr.dine 8/ AC-20R
lO-yr design , 5.5 million ESALs
lO-yr design, 2.2 million ESALs
A-14
OPI was 73, RSL2yrs , fair condition.
OPlwRS66, R8LO yrs,
I fair
Mod to hieb long. cracks in WP, ruts in center ln, low
Medium longitudinal, block, & transverse cracks, mad. raveling & some allig.
Rural
Rural
I Heater scarify chosen to help seal cracks. 2" overlaid as design minimum. Section only s lightly structurally deficient. A few minor construction problems, no constraints ..
Performing as expected, too early to plot trends. To perform well, new cracks must be sealed reeu1arly.
Heater scarify chosen Performing as to help seal cracks. 2" expected. To overlaid as design perform well,
. Section only new cracks
I slightly structurally must be deficient. A few minor sealed construction problems, regularly. no constraints ..

Table A-2 SUMMARY OF QUESTIONNAIRE PART I: INTERVIEWS
Rehabilitation Strategy Brief Description of Rehab. Subsidiary Design Yrs (Est) OP! & Predominant Rural Constraints, Problems, Performance (The projects reported here are Dot Strategy, Year Constructed Treatment and Condition Distress or Precautions, Wamini'S. To-Date
necessarily representative for (Note: Bold outline indicates or Wearing ESALs Description When Treated Urban Comments eDOn projects used in PMS study, Surface
. , '" Hot.-in-Placc Recycle (1) In Reg 2, US 60 W of Me Two 2" OL 20-yrs. OPJ= 74. SO· 100% Med Rural, Selected to eliminate Performing as (Heater Re-Mix) Culloch. Hot climate. WB lifts with 2.S million Condition severe non- prin reflective cracking. expected
Two CnOT projects lane only. 9.4 mi. Exist SitAe Grading 'S' ESALS. fair. load assoc. artery Two people interviewed over 8" ABC. Top 2" Heater- SP (64·22). cracking, low
Remixed 150 Ibl SY of Grad'g alligator crks. 'S' SP (5S·2S), 1999.
(2) In Reg 5, Del Norte· Existini lO-yrs. Est.OP!= Mod to hirh Rural Selected to eliminate Performing Center Jet. Heater Re-Mixed pave. 2-3" ESALS are 60. transverse reflective cracking. better than 2", including addition of 5- HBPover 445,000 Condition cracks, med. Maintenance forces expected. By 10% Gradine CX and small S"ABC. Re- fair to poor. allieator & corrected several base all PMS % ofrejuvinating agent. mix topped block failures in advance. indexes, YFL Done in 1996. with 2"HBP cracking Judged best strategy ::15+.
Gr.din. ex {or available funds.
Hot-in-Plaoe Recycle (1) On SH 119 in Reg 4. Overlaid 10-yrs, est. OPJ=30 Alliiator Urban Traffic handling was Performing as I (Heater Re-Pave) Approx. 1" heater- scarified with ESALS of RSL = ·1.6. cracking, high considered potential expected. YFL
Two COOT projects then overlaid with 0.5-0.75" Grading C 800,000 Trnsv Crack severity. problem. didn't affect by OP! = 16+. Two poople interviewed of Grading EX in one per column index:: -5.0. decision. No problems
operation followed later with at left. Poer or constraints. Very YFLbyTrnsv a 1.75-2.25" overlay of condition smooth, won award. Cr.ck=9.S Grading C. Done in 1995.
(2) On SH 45, I 25 to Ark. Surface is 10 yrs, OP! =74. Alligator Very Traffic a problem, but New . expected River in Reg 2. Exist 4" AC Super Pave ESALs of Condition cracks, 100% Urban, doing work in ODe pass to have more (over 8" ABC) was heater- e&G 519,000 fair to poor. M·H severity prin. caused less traffic than design scarified I '" and overlaid section, other cracks arteryl delay. Reconstruction life with with 1.5" SP (64·22) in sinile milled at 60%, MtoH e&G not considered. programed
-pas.s in summer of 1999. gutter.
---~intenanee.
-- - - - - -- - - -- - - - - -- -- --
A·15

Table A-2 SUMMARY OF ( UESTIONNAIRE PART I: INTERVIEWS
Rehahilitation Strategy Brief Description of Rehab. Subsidiary Design Yrs (Est) OP! & Predominant Rural Constraints. Problems, Performance (The projects reported bere arc not Strategy, Year 'Constructed Treatment and Condition Distress or Precautions, Warnings, To-Date
necessarily represeo,tativ9 for (Note: Bold outline indicat.es or WeRJ'ing ERAT.. D08Cl'iption When Treat.ed Urban Commeuts
CDO'!') projects used in PMS study, Surface " Hi.
Cold-in-Place Recycle (I)In Reg 2, ! 25, Ludlow - Overlaid 20 yrs. OP! = 76 Alligator Rural. Surface drainage Not as
Three CDOT and on. North, 12.6 mi of N-Bound with 4" of 5 million Condition cracking in Cold Unproved, reconstruc- e xpected.
NM project. only. Existing was 8" AC Grading S ESALs. fair the driving recyc. tiOD not considered, Long. cracks over 12" agg. Top 4" was cold (AC-20R) lanes,slight Easier budget restrictions. developing in r ecycled_ Finished in 1999. rutting on Previous adjacent WP, with
rural projects successful. Had slight ruttin". project difficulty curing & Base needed
compacting recycle. Mr of 100,000
This strategy has been used on (2) InRe~ 1, onSH 71 N & S Overlay,2" 10-yr, OP!=69, High severity Rural Selected to prevent Performing as
many projects in all Retions, except of Limon in 1999. Existing: GradinK S 500,000 OyrsRSL, cracking, load reflective cracking. expected.
6; not practical for highJy urbanized 5" Gradinr Faver 6" Cl 7 (58-22) & ESALs Condition & non·load + Reconstruction not
locations. ABC. Top 4" cold recycled topped with was poor rourhness. considered. No traffic usin~ HFMS-2PS. 2" Grading control problems. No
Interviews were selective, not Dry, cold climate. S (64-28) significant construction
necessarily representative of the problems, done in warm
state-of·the-art in CDOT weather.
(3) On I 25, South NM, cold Overlay: 10-yr OP! of60±. Extens, med. Rural Selected because it was Performing milled 2" to remove 2.5" SP (64- design. Condition severity non- most cost-effective. NM well. Based on extensive crack sealant; cold 20); then ESALs are fair to poor, load cracks, has extensive exper- past recycled 4"using HFE-l50P 1.5" SMA 3.3 million. 10" existing med severity ienco. See sub-note (5) experience, and hot-lime slurry in 1997. (70-22). asphpave. rutting. for oonstraints and expected to = Climate dry, DO freeze. comments. design life.
(4) Cold recycling has been With 3-4" Designed Est.OP! Predominant Mostly Biggest constraints Performing used on several projects in HBP for 20 yrs, usually close distresses are rural curing moisture from well with no Region 5, including two overlays., ESALs Elle to 50 with crackinr, mix & rain. Don't use in reflective south of Cortez. moving to med to low. surface poor (l)fatigue & mountains. LCCAs cracks
SPbitumen condition. (2) non-load. shows it is cost-effective
Fabric Interlayer (1) In 1981, an experimental First a Design was OP! not used Mediuro to Urban, Several of the fabrics Four fabrics placement of 6 different leveling 20-yr. at time; from high block, noC& used are no lonier slowed crack
One project. one general fabrics was done on a project course. ESALsnot descriptions. longitudinal G available. Currently reflection
Two people interviewed in Reg 6, SH 83, lliffto Miss. then fabric, available, is estimated & transverse available fabrics easily. compared to Ave. The existing pavement then a 2' est. at 1.6 at 76. Fair cracking placed. Not ~od for control. Cost was widened, the cracked lift ofHBP million±. condition. wide. active tr8Jlsverse could be old surface bad various Gradin~ E. cracks or where there is recovered by fabrics placed, then overlaid. extreme braking or 1-2 yrs added Evaluated for 4 years. acceleration. YFL.
(2) Reg. 6 sometimes places OverIayper Usually la- OPf is Load Urban Must make final Experience fabric interlayer over severe structure yr design, normally associated evaluation after millini shows this load-associated cracks after analysis, fabric con- low, 50-60 cracking. and cleaning e:risting application milling. Not used to control HBPor tributes 2-3 where fabric pavement can be cost block or transverse cracks . SMA. I yrs life . is used . effective.
A-16

SUMMARY of QUESTIONNAIRE, PART II GENERAL
1. Listed below are the current distresses collected by the CnOT Pavement Management System for asphalt pavement:
a. Longitudinal cracking
h. Alligator (Fatigue)
d. Transverse cracking g. Raveling
e. Rutting h. % Patching
c. Block cracking f. Bleeding i. % Edge cracking
1A Are there any additional distresses (such as longitudinal cracking in the wheel paths, reflection cracking at joints or roughness) that you collect, or believe ought to be collected, or used at the project level for design purposes? __ If yes, please list them.
Twelve people answered this question. Essentially, only load associated longitudinal cracking is believed necessary in addition to the PMS list above. (Note that LALC is now collected).
lB. Are there any of the above list you believe that are unnecessary at the project level? ___ If yes, please list them.
Thirteen people answered this question. Six thought no change is needed. Two thought patching is unnecessary (one noted that patching itselr is not a pavement distress). Three thought edge cracks did not need tabulating, and one each thought that raveling and bleeding did not need tabulating.
Distresses Needed at Proj. Level
None (42.00%)
LALC (50.00%)
Distresses Not Needed at Project Level
None (46.00%)
(S.OO%) Raveling
~ (8.00%)8'_
t .• . ."." .. ; (15.00%)
. ' : PItChing .- . (23.00%)
% Edge Crks
2. In your opinion, regardless of the predominant distress, are there certain rehabilitation strategies that are impractical to use because of environment (weather), traffic or other constraints. ___ If yes, please list them and the constraints.
Impractical strategies listed were: Chip seals in urban areas, cold milling into a fabric layer, micro-surfacing to fill plastic ruts, cold recycling (long list of constraints submitted by Regions 1, 5 & NM, but they all frequently use it; this points out need to thoroughly pre-evaluate its use), Regions 2 & 5 pointed out problems with hot-in-place recycling. A Roadway Design engineer suggested more investigation into HIPR is needed before accepting it as standard procedure, and that HIPR and CIPR should not be used on high volume roads. (See section. "Candidate Rehabilitation Strategies: Conditions for Use, Advantages, and Constraints." in this Guide which incorporates most constraints cited).
A-17
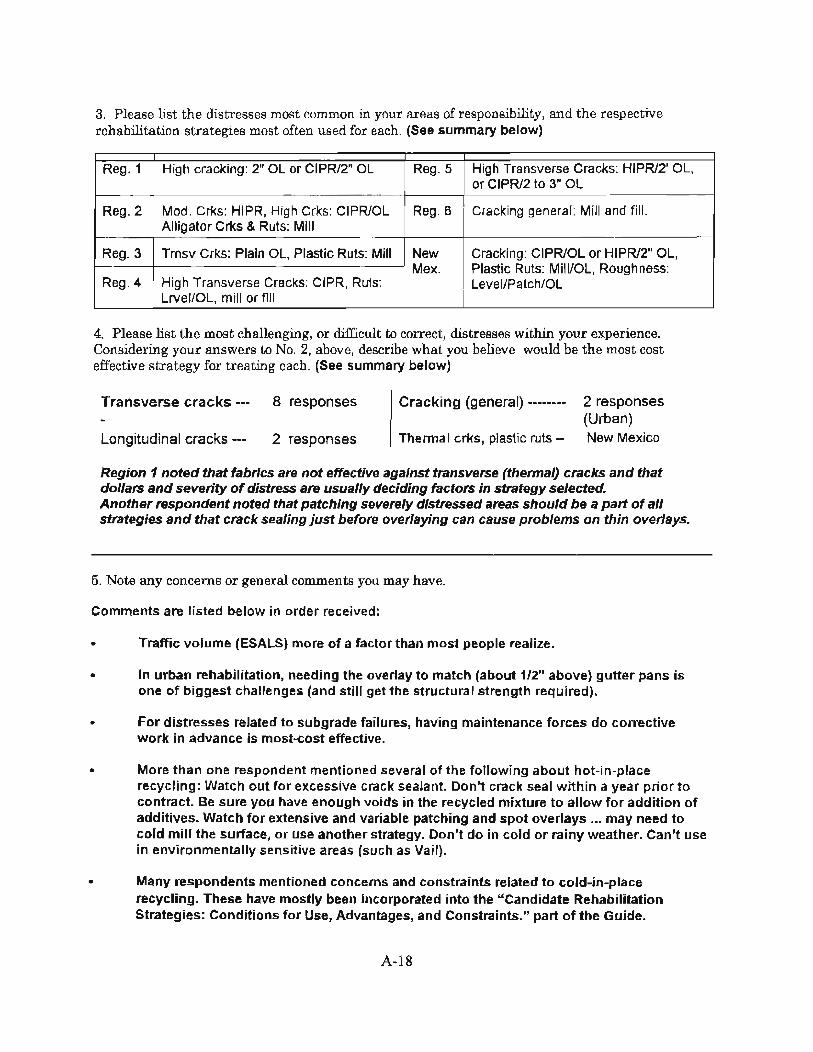
3. Please list the distresses most common in your areas of responsibility, and the respective rehabilitation strategies most often used for each. (See summary below)
Reg. 1 High cracking: 2" OL or CIPRl2" OL Reg.S High Transverse Cracks: HIPRl2' OL, or CIPRl2 to 3" OL
Reg. 2 Mod. Crks: HIPR, High Crks: CIPRIOL Reg. 6 Cracking general: Mill and fill. Alligator Crks & Ruts: Mill
Reg. 3 Trnsv Crks: Plain OL, Plastic Ruts: Mill New Cracking: CIPRIOL or HIPRl2" OL, Mex. Plastic Ruts: MilVOL, Roughness:
Reg. 4 High Transverse Cracks: CIPR, Ruts: LeveVPatch/OL Lrvel/OL, mill or fill
4. Please list the most challenging, or difficult to correct, distresses within your experience. Considering your answers to No.2, above, describe what you believe would be the most cost effective strategy for treating each. (See summary below)
Transverse cracks --- 8 responses
Longitudinal cracks - 2 responses
Cracking (general) -------- 2 responses (Urban)
Thermal crks, plastic ruts - New Mexico
Region 1 noted that fabrics are not effect/ve against transverse (therma/) cracks and that dollars and severity of distress are usually deciding factors in strategy selected. Another respondent noted that patching severely distressed areas should be a part of all strategies and that crack sealing just before overlaying can cause problems on thin overlays.
5. Note any concerns or general comments you may have.
Comments are listed below in order received:
• Traffic volume (ESALS) more of a factor than most people realize.
• In urban rehabilitation, needing the overlay to match (about 1/2" above) gulter pans is one of biggest challenges (and stili get the structural strength required).
• For distresses related to subgrade failures, having maintenance forces do corrective work in advance is most-cost effective.
• More than one respondent mentioned several of the following about hot-in-place recycling: Watch out for excessive crack sealant. Don't crack seal within a year prior to contract. Be sure you have enough voids in the recycled mixture to allow for addition of additives. Watch for extensive and variable patching and spot overlays ... may need to cold mill the surface, or use another strategy. Don't do in cold or rainy weather. Can't use in environmentally sensitive areas (such as Vail).
• Many respondents mentioned concerns and constraints related to cold-in-place recycling . These have mostly been Incorporated into the "Candidate Rehabilitation Strategies: Conditions for Use, Advantages, and Constraints." part of the Guide.
A-IS
GUIDELINES FOR SELECTION OF REHABILITATION STRATEGIES for ASPHALT PAVEMENT
APPENDIXB Study: Years Functional Life for Rehabilitated Asphalt Pavement, Based on Pavement Management
System Condition Data as Related to Existing Distress and Treatment Strategy
Contents
Background ................................................................................................................................ B-2
Nine 1-25 Projects........... ............................................................................................................. B-2
Nine Projects from Original Rehabilitation Study...... ........... ........... ................ ..... ........................ B-4
Summary and Comments ............ ........... ......... ....... ....... .............. ................... ................... ........... B-6
Tables
Table B-1 Pre- & Post-Construction Condition Indexes . .. on 1-25 Projects .............................. B-8
Table B-2 Pre- & Post-Construction Cracking Indexes . on 1-25 Projects ............................... B-9
Tables B-3 and B-4 Pre- & Post-Construction Condition & Cracking Indexes, Rehab. Projects .... B-1O
Table B-5 Summary ... Pre-Construction & Post-Construction YFLs for All Study Projects ...... B-11
Figures
Figures B-1 to B-4 Pre- & Post-Construction Condition & Cracking Indexes (deterioration curves)
for Series E of the 1-25 Projects ............................................................................... ......... B-12
Figures B-5 to B-8 Pre- & Post-Construction Condition & Cracking Indexes (deterioration curves)
fur Series 1 of the Rehabilitation Study Projects ............................................................. B-13
Figures B-9 and B-1O Network PMS Avg RSL & YFL by Condition & Cracking Indexes ......... B-14
B-1

GUIDELINES FOR SELECTION OF REHABILITATION STRATEGIES for ASPHALT PA VEMENT
APPENDIXB Years of Functional Life for Rehabilitated Asphalt Pavement, Based on Pavement Management System Condition Data as Related to Existing Distress and Treatment Strategy (PMS Functional Life Study)
Background In the faIl of 1999, a study for CDOT, "Guidelines for Selection of Strategies for Rehabilitation of Asphalt Pavements" was initiated. The principal researcher (PR) contracted to develop a guide manual. At a meeting of the Study Panel in February 2000, the PR presented and discussed a partially completed, preliminary draft of the Guide.
The PR presented decision tables for estimating years of life for various rehabilitation strategies. They were developed by extending the CDOT flexible pavement design procedures . TItis premise was not what the panel had in mind. They wanted an entirely independent method of estimating the functional lives of the various rehabilitation strategies when applied to pavements, specific to the existing distress categories, degree and extent. TItis required additional research.
PMS FtTNCTIONAL LIFE STUDY In order to develop some data on which to base such a decision table, CDOT made available to the PR their network PMS condition data for the years, 1991-1999. This included a computer program that calculates average condition indexes for any selected mile-length on the State Highway System for any given year. Each direction, of a milage representation for a given year, is calculated separately.
The study being reported herein is a satellite study to the primary study as described in the Guide and Appendix A. Two sources of rehabilitated pavement data were used to accumulate the rehabilitation part of the data. They are (I), from nine Interstate projects overlaid in 1994 and (2), from nine of the interview projects listed in Table A-2.
NINE 1-25 PROJECTS The first source is from a report by Tim AschenbrenePl on nine contracts for overlaying sections of 1-25 in 1994. The report purpose was to provide HMA and rehabilitation information on the projects for correlation to long-term performance five to 15 years in the future. The location ranged from MP 0.0 at the New Mexico border to MP 235 north of Denver. The PR broke these into 12 sections and the PMS condition data were calculated for the years prior to and after construction. Two sections were 20-year designs; the rest were lO-year designs. The 12 sections are represented by Tables I and 2 which summarize data from 48 graphs. Figures B-1 through B-4, for Series E of this group, are typical for the graphs, although not all plot this precisely. The graphs for all series are on file at the CDOT Research offices, as are the Excel computer files for all the data and graphs.
The preconstruction 1991-1993 PMS indexes, and post construction 1995-1999 indexes for the sections were calculated using the CDOT 1991-1999 Condition Data and their Index Calculator computer program. From the calculated indexes for the 12 sections, graphs were plotted to determine remaining service lives (RSL) and average condition indexes as of 1993 and years functional life YFL and average indexes as of 1999. The average indexes are from the plotted trend lines, and not the calculated averages.
B-2

Table B-1 summarizes the pre- and post-construction condition indexes from plotted data. Mean slope values for each project are tabulated for Crack Index and OPI, then averaged as shown. Mean Slope is the mean deterioration slope, e.g., reduction in index points per year at, or near the time the trend line crosses the 50 threshold value. Based on typical deterioration curves (for this study) of preconstruction distresses, we can be sure that any nearly flat curves for post -construction distresses will not continue to be so. Sooner, or later they will tum downward and probably cross the 50 threshold line with slopes similar to the mean deterioration slopes.
Table B-2 summarizes the pre- and post-construction cracking distress indexes. Series A and D, designed for 20-year ESALs are not averaged with the other 10, but are tabulated and averaged separately. Note that an RSL of 10 was used as the maximum value for pre-construction where deterioration curves were nearly flat. A YFL of 15 was the maximum value used for postconstruction. These values were used to calculate averages.
Preconstruction Evaluation The preconstruction averages for projects with 20-year designs are not especially different from those with IO-year designs; the averages for all are used in the following discussion. For Condition Indexes, in every series, the Crack Index was equal to or lower than either Ride or Rut. The average IndexIRSL of the three distresses are in this order, lowest to highest: Crack 30/-1.2, Ride 58/1 and Rut 76/6.6, with the OPI at 6112.0. Figure B-9 depicts the relative RSLs. OPI is a calculated index representing a composite of the other three. Typically, CDOT projects seem to be rehabilitated when they have RSLs of between 1.0 and 4.0 by OPI and less than 0.0 by Cracking Index.
Because cracking was the predominant distress from the Condition Indexes, the individual cracking categories were analyzed to detennine which types of cracking were the most frequent and severe. To find the predominant preconstruction cracking distress, go to Table B-2. Transverse cracking was predominant, except in two series where block cracking just barely predominant. In every section, Transverse RSL was less than zero. The average cracking category IndexIRSLs are in this order, lowest index to highest: Transverse 7/-2.2, Longitudinal 62/5.1, Block 66/4.9, LALC 7114.6 and Alligator 78/5.3. Figure B-I0 shows the relative RSLs. By far, transverse cracking was the predominant cracking distress, with an average RSL of -2.2. Each of the other four distresses are close to their average RSL of5.0.
Post-construction Evaluation, 10-Year Design For post-construction Condition Indexes, in every section, the Crack Index was equal to or lower than either Ride or Rut. The average Index/YFLs are in this order, lowest to highest: Crack 70/8.0, Ride 84/14.2 and Rut 93/15.0, with the OPI at 85/14.3. See Figure B-9 for YFL plots. For all values, except Crack, the average numbers are not especially significant because of the maximum value of 15 used for nearly flat trend curves.
Again, since cracking was the only critical index, the individual cracking categories were analyzed to determine which types of cracking were the most frequent and severe. To find the predominant postconstruction cracking distress, go to Table B-2. In all but two sections transverse cracking was predominant. In those two, Longitudinal cracking was predominant, but not by much. The average cracking category IndexlYFLs are in this order, lowest index to highest: Transverse 60/6.2, Longitudinal 75/9.7, LALC 78/10.5, Alligator 97/15.0, and Block 100/15.0. See Figure B-IO for
B-3

YFL plots. The order of cracking distresses are essentially the same as for preconstruction, except that block cracking has moved into last place.
At the one-half design life point, the predicted average YFL by OPI for the 10 sections is 14.3 (greater, actually, because YFLs were cut off at 15). Only two sections are less than 15 YFL (12.0 and 11.0). It appears that all will easily meet the 10-year design criteria if OPI is the measuring tool. However, the predicted average YFL by the Cracking Index is 8.0 and by Transverse cracking it is 6.2. Sections B and K have low LALC indexesNFLs, averaging 56/5.8. At this time, it is predicted that due to severe cracking distress, four or more of the 10-year D L series will need some type of rehabilitation before they reach age 10.
Pre- and Post-construction Evaluation, 20-Year Design The average preconstruction condition and cracking indexes for the two 20-year designs are not significantly different from those for the IO-year designs. See the discussion above for 10-year designs.
The two post-construction 20-year designs deserve to be looked at separately. Series A had a minimum of2 inches of milling plus an overlay thickness ranging in thickness from 4.0 to 6.5 inches. Presumably, severely distressed areas received special attention in order to bring the entire project up to 20-year design standards. All three condition indexes show YFLs of 20+, so of course, the YFL by OPI is 20+. Transverse cracking is the only significant post-construction cracking distress. It has a YFL of 12.5. Based on PMS data, this project should easily exceed the 8.6 average reported by Goldbaum (2) and maybe make 12 to 15 years before it needs more than routine maintenance.
Series D consisted of 4-inches CIP recycling with a 2-inch modified AC overlay. The Ride and Rut Indexes show 20+ YFL. The Crack IndexIYFL is 76/9.0. This is not bad iffor 10-year, but maybe low for expected 20-year performance. Table B-2 shows that the predominant cracking distresses are Longitudinal, Transverse and LALC, with RSLs of7.2, 8.7 and 6.0, respectively. The support value (strength) of the CIP recycled material may not be adequate. Although the project appears to be performing well by 1999 PMS data, the projected LALC deterioration curve indicates that early major maintenance may be required .
. NINE PROJECTS FROM ORIGINAL REHABILITATION STUDY The second source of data is from the original Guide Study Plan. Appendix A, Table A-2 is a summary of 2 7 projects which are characterized from interviews with involved engineers, mostly from COOT. The summary provides detailed information on their design and rehabilitation strategy, their construction, and subjective performance. An evaluation showed that nine of these were relevant and had been constructed long enough to have one or more years of post-construction PMS data available. Under the project description column the selected project blocks are outlined in bold. These nine were used to develop data similar to that from the 1-25 projects built in 1994. The nine projects are represented by Tables 3 and 4 which summarize data from 36 graphs. Figures B-5 through B-8 for Series I of this group are typical for the graphs, although not all plot this precisely. The graphs for all series are on file at the CDOT Research offices, as are the Excel computer files for all the data and graphs.
The preconstruction PMS indexes, using 1991 to the last year for which data was available before
B-4

construction, were calculated using the COOT 1991-1999 Condition Data and the Index Calculator. The post-construction indexes were calculated using all available years' post-construction PMS data for the projects. From the calculated indexes for the 9 projects, graphs were plotted to estimate RSL and average indices at time of rehabilitation. The post-construction graphs were used to estimate YFL. The average Indexes are from the plotted trend curves, and not from calculated averages.
Table B-3 summarizes the pre- and post-construction plotted Condition Index data. Table B-4 summarizes the pre- and post-construction Cracking Distress Indexes. Series 5 and 6, which were micro-surfaced and micro-milled, respectively , were not averaged with the other seven postconstruction projects. Note that an RSL of 10 was used as the maximum value for pre-construction where deterioration curves were nearly flat. A YFL of 15 was the maximum value used for postconstruction. These values were used to calculate averages.
Pre-construction Evaluation For pre-construction Condition Indexes, on five of the projects, the Crack Index was the predominant distress. For the other four, Rut was predominant. The average IndexIRSL are in this order, lowest to highest: Crack 46/-0.2, Rut 53/0.3 and Ride 62/1.3, with the OPI at 58/1.3. See Figure B-9 for RSL plot. As noted for tbe 1-25 projects, typically, COOT projects seem to be rehabilitated wben they have RSLs of between 1.0 and 4.0 by OPI and less than 0.0 by Cracking Index. One significant difference between these averages and the 1-25 averages is that the average 1-25 Rut RSL was 6.6 compared to 0.3.
As for the 1-25 projects, the individual cracking categories were analyzed to determine whicb types of cracking were the most frequent and severe. To fmd the predominant preconstruction cracking distress, go to Table B-4. In every section transverse cracking was predominant and all Transverse RSL values were less than zero. The average cracking category IndexIRSLs are in this order, lowest index to highest: Transverse 191-3.5, Lonl:itudinal 72/5.5, Block 77/6.5, LALC 8017.3 and Alligator 8417.9. See Figure B-10 for RSL plots. By far, transverse cracking was the predominant cracking distress and a little lower than on the 1-25 projects. The other four distresses were a little less severe than they were on the 1-25 projects. Of interest is that the order of severity is exactly the same as for 1-25.
Post-construction Evaluation, Seven 10-Year Designs
For post-construction Condition Indexes, the Crack Index was equal to or lower than either Ride or Rut for five projects. Rut was the lowest on Series I, while Series 8 had essentially flat trend lines for all distresses. The average IndexIYFLs are in this order, lowest to highest: Crack 82/10.7, Rut 88/13.8, and Ride 87/14.1 with the OPI at 85114.4. See Figure B-9 for YFL plots. These categories are in the same order of severity as the 1-25 distresses, and about the same order of magnitude, except that Cracking YSL is 2.7 higher than the 1-25 value.
The individual cracking categories were analyzed to determine which types of cracking were the most frequent and severe. To find the predominant post-construction cracking distress, go to Table B-4. In all but two sections transverse cracking was predominant. In those two, 10ngitudina1 cracking was predominant for one and LALC for the other, but not by mucb in either case. The average cracking category IndexlYFLs are in this order, lowest index to highest: Transverse 74/6.9, LALC 91110.2, Longitudinal 90/11.3, Block 99/14.7, and Alligator 99/15.0. See Figure B-IO for YFL plots.
B-5

Again, transverse is the lowest of the group. The order of the next three distresses is different from pre-construction, but alligator cracking is stilI the least severe.
The predicted average YFL by OPI for the seven sections is 14.4 (more, actually, because YFLs were cut off at 15). Only one project shows less than 15 YFL (10.5). It appears that all will easily meet the 10-year design criteria if OPI is the measuring tool. However, the predicted average YFL by the Cracking Index is 8.7 and by Transverse Cracking it is 6.9. Series 2 has a low LALC indexIYFL on.o. At this time, it is predicted that due to cracking distress, at least three of the seven projects will need some type of rehabilitation before they reach age 10.
SUMMARY AND COMMENTS Table 5 is a summary of the information obtained by evaluating the 21 sets of data found in Tables I through 4. The YFL years shown in Tables FL I and FL 2, Years Functional Life for National Highway System and Non-National Highway System State Highways were highly influenced by the data from these 21 Jrojects.
For several series the Index Calculator program was unable to calculate indexes for the year 1995. There was some sort of incompatibility with the computer, the program or raw data. This may have affected the slopes or shapes of some of the post -construction deterioration curves.
The following comments, not necessarily in order of importance, summarize the study:
I. Except for the 1-25 sections north and south of the EL Paso County line, the primary and secondary direction data for each condition index were averaged. In the case of the EI Paso Co. line north and south series, where substantially different structural sections existed and different treatments were done, the two directions were analyzed separately. For all series, the two directions could have been averaged and analyzed separately, but that would have required more than the time allotted for this study. If they had been analyzed separately, it is not believed the trends of the deterioration curves, and the general conclusions, would have been substantially different.
2. The calculated indexes were highly variable from year to year and in many cases, appeared to be illogical. For example, take Series 7, Post-construction Condition Indexes. The 1999 indexes were all in the 90s, while three of indexes for the previous two years showed distinct downward trends (84, 80, and 63), and the other, Ride, showed a somewhat downward trend of 90. It is estimated that all four would have had YFLs between 10 and 3 if the 1999 points were not included, instead of 15+ as shown. Because of this variability, only general trends can be detennined, some of these are probably incorrect.
3. With the tools (PMS computer programs) and limited nUlllber of projects, the 21 series analyzed barely scratched the surface. Not enough projects were studied to make these conclusions statistically representative of the entire State Highway System. It is recommended that a study similar to this be conducted on a much broader scale, with stratified random selections of highways and projects representing many conditions and rehabilitation treatment strategies.
4. On the 1-25 projects, the preconstruction Cracking Condition Index was the lowest (least RSL) of the three distress indexes for every individual section, followed closely by ride. On the average,
B-6
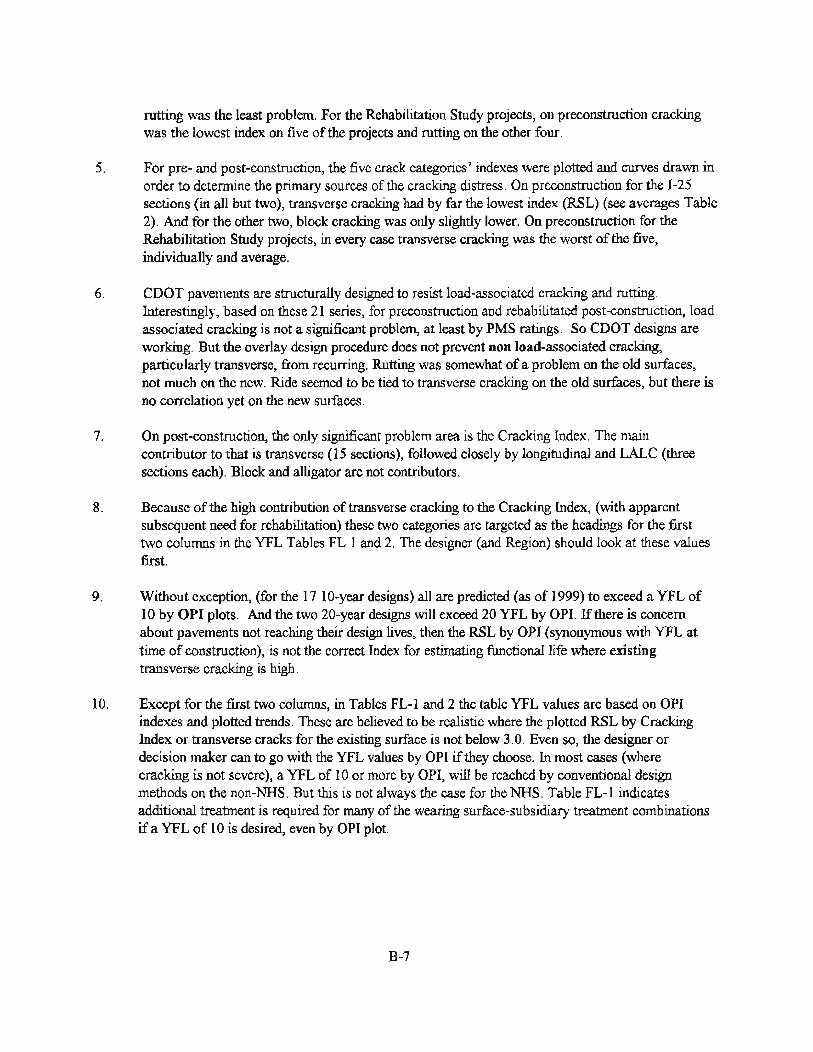
rutting was the least problem. For the Rehabilitation Study projects, on preconstruction cracking was the lowest index on five of the projects and rutting on the other four.
5. For pre- and post-{:()nstruction, the five crack categories' indexes were plotted and curves drawn in order to determine the primary sources of the cracking distress. On preconstruction for the 1-25 sections (in all but two), transverse cracking had by far the lowest index (RSL) (see averages Table 2). And for the other two, block cracking was only slightly lower. On preconstruction for the Rehabilitation Study projects, in every case transverse cracking was the worst of the five, individually and average.
6. CDOT pavements are structurally designed to resist load-associated cracking and rutting. Interestingly, based on these 21 series, for preconstruction and rehabilitated post-{:()nstruction, load associated cracking is not a significant problem, at least by PMS ratings. So CDOT designs are working. But the overlay design procedure does not prevent non load-associated cracking, particularly transverse, from recurring. Rutting was somewhat of a problem on the old surfaces, not much on the new. Ride seemed to be tied to transverse cracking on the old surfaces, but there is no correlation yet on the new surfaces.
7. On post-{:()nstruction, the only significant problem area is the Cracking Index. The main contributor to that is transverse (15 sections), followed closely by longitudinal and LALC (three sections each). Block and alligator are not contributors.
8. Because of the high contribution of transverse cracking to the Cracking Index, (with apparent subsequent need for rehabilitation) these two categories are targeted as tbe headings for the first two columns in the YFL Tables FL I and 2. The designer (and Region) should look at these values first.
9. Without exception, (for the 17 10-year designs) all are predicted (as of 1999) to exceed a YFL of 10 by OPI plots. And the two 20-year designs will exceed 20 YFL by OPI. If there is concern about pavements not reaching their design lives, then the RSL by OPI (synonymous with YFL at time of construction), is not the correct Index for estimating functional life where existing transverse cracking is high.
10. Except for the first two columns, in Tables FL-l and 2 the table YFL values are based on OPI indexes and plotted trends. These are believed to be realistic where the plotted RSL by Cracking Index or transverse cracks for the existing surface is not below 3.0. Even so, the designer or decision maker can to go with the YFL values by OPI if they cboose. In most cases (where cracking is not severe), a YFL of 10 or more by OPI, will be reached by conventional design methods on the non-NHS. But this is not always the case for the NHS. Table FL-I indicates additional treatment is required for many of the wearing surface-subsidiary treatment combinations if a YFL of 10 is desired, even by OPI plot.
B-7

Table B-1 PRE- & POST-CONSTRUCTION CONDITION INDEXES
Note: Where the value 10 appears for RSL in the pre-construction summary, It Indicates the deterioration slope is so flat that an accurate estimate of the RSL is not practical, It is at least 10. This value used to calculate averages.~ In the post-construction summary, for very flat trend lines, the value 15 has been used for 10-yr designs and 20 for 20 yr designs.
Mean Slope is mean deler1oration slope, e.g., reduction In Index points/yeeJ$
or near the time the plot line crosses the 50 threshold value.
Note: Shaded columns represent predominant PMS dlslress (lowestRSUFL).
B-8

Table B-2 PRE· & POST -CONSTRUCTION CRACKING INDEXES
Note: Shaded columns represent predominant PMS distress (lowest RSUFL).
B·9

Table B-3 PRE- & POST .cONSTRUCTION CONDITION INDEXES
• Mean S~ is mean deteriofation slope, e.g ., reduction Table s.4 PRE- & POST .cONSTRUCTION CRACKING INDEXES In Index points/years at, or near the time the ~ line PMS Data From 1991- 99 on 9 Paving P ects 12 Sections) Construc:ted on I 25 in1994
cro .... the 50 threshold valu.. PRE.cONSTRUCTION POST .cONSTRUC1._ .. Sarles Est Cracldng IndextYrs Functional Life Constr. '99 Est Crack Index/Yrs Funct=---' I :I'-.
Note: Shaded cells in both tables indicate predominate distress Oowest RSUYFL).
Note: Where the value 10 appears for RSL in the pre-construction summary. it Ww:lk:ates the deterioration siope is so ftat that an accurate estimate of the RSL is not practical, it is at least 10. This value used to calculate averages. In the post-construction summary, for very nat trend lines, the value 15 has
n' .... v , .................. .,. .. r- v ___ AI ,..... ..., ........ , " ............ ".
baenUSed(forthe10-yrdeslgnS)and10forserieS5&6 1 I Iv,ul Iv,vl '"",VI _ -- -~-.~1 Iv,vl I 11.1'''''1 Iv,vl o,ur .f"~:1 "~I (which were not designed). c. 4nn n OD n 0'" n ~ D7 4QI'la "Inn "Inn >4n .ti':\. ao
Averages Averages
8-10
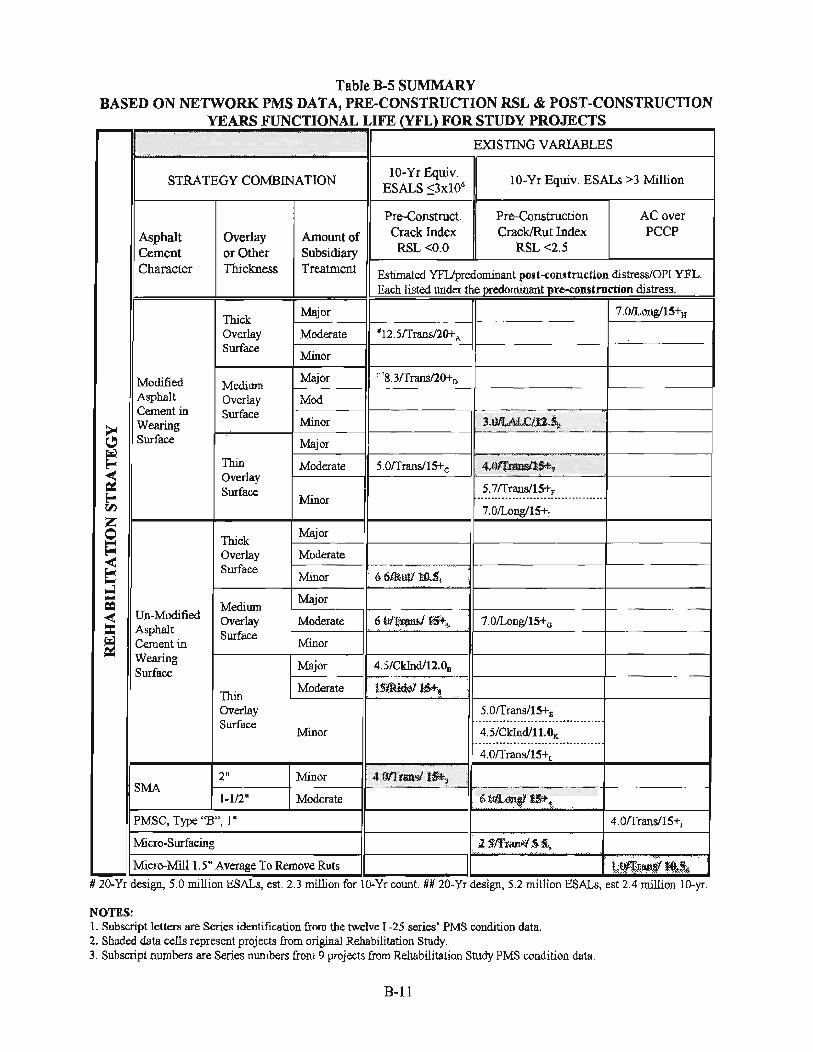
Table B-S SUMMARY BASED ON NETWORK PMS DATA, PRE-CONSTRUCfION RSL & POST-CONSTRUCTION
YEARS FUNCTIONAL LIFE (YFL) FOR STUDY PROJECTS
EDUSTtNGVARlABLES
STRATEGY COMBINATION IO-Yr Equiv.
lO-Yr Equiv. ESALs >3 Million ESALS ::;3x1O'
Pre-Construct. Pre-Construction ACover
Asphalt Overlay Amount of Crack Index CracklRut Index PCCP
Cement or Other Subsidiary RSL<O.O RSL<2.5
Character Thickness Treatment Estimated YF1Jpredominanl "",t-construction distress/OP) YFL. Each listed under the predominant pre-conslruction distress.
Thick Major 7.01Long/15+.
Overlay Moderate ' 12.5fTnmsllO+. Surface
Minor
Modified Medium Major ·" 8.3fTrnnsl2O+o
AsphBlt Overlay Mod Cement in Surface
~ Wearing Minor 3.\lII.ALCiJa5., --- -- ... ~ . - .. Surface Major
f;I;l Thin Eo< Moderate 5.0fTransll5+e 4.1I~$+,
~ Overlay
5.7fTnmsl15+F Surfuee Minor ........... ............... - .........
rIl 7.0ILongllS+, Z
~ Thick Major
Overlay Moderate ;S Surface
Minor 6 6tR-lW' 10.$, ... i:l Major
~ Medium
Un-Modified Overlay Moderate 6,Of1'tl;WJ l~> 7.0ILongll5+o Asphalt
~ Cement in Surfuce
Minor Wearing
Major 4.5ICkIndlll.o. Surface
Thin Moderate u:&lcl¢ 1$+,
Overlay 5.0fTransll5+, Surface .... -.- ..... .................. ......
Minor 4.5ICkIndlll.OK ... --_ ...... ...... -.----_ ........... 4.0fTnmsllS+L
2' Minor " Ill! tan'" l~, SMA "-- '--'
1-112" Moderate ('~15+.
PMSC, Type ''a'', I' 4.0fTransllS+,
Micro-Surfacing '. 2 SfTrili>!i.( U.,
Micro-Mill 1.5" Average To Remove Ruts Vttm'poit# 11M •. # 20-Yrdestgn, 5,0 nulhon ESALs, est, 2,3 million for IO-Yr count. ## 20-Yr desIgn, 5.2 nulhon ESALs, est 2.4 nulhon IO-yr,
NOTES: 1, Subscript letters are Series identification from the twelve I -25 series' PMS coudition data. 2, Shaded data cells represent projects from original Rehabilitation Study. 3. Subscript numbers are Series numbers from 9 projects from Rehabilitation Study PMS condition data.
B-II

THIN (2") HBP OVERLAY & THIN MILL (1") OVER FUNCTIONAL DISTRESS (High Transverse Cracks & Poor Ride) Series !dent E, 1-25, Woodman Road -South, MP MILE 139.6 -148.0
Pre-Construction Condition Indexes
100 In 1994 II [;stlmated RSL
90 +---- + - --+ - - --+-- -IRlde .... 1.0 Rut ....... 2.0
80 Crack ... -1.6 ~ OPL. ..... 2.5
7O~ 1 'I 'I
-. 1
L.::::-~I-~ 199 1 1995 1997 1999 200'
r=: ---~RiI& -o-Rlf: -b--CIidi -e--CPI
- - "'01"",) --"",. (1M) - - u.a-I"""'J - l .... IOPI)
Figure B-1
Post-Constructlon Condition Indexes
110 " 1999 I ;itimated Fb Ride .... 15 Rut .....•. 15
100
90
• .g 80 .E
"'~ . ~
Crack ..•. 6.2
I 1\ f> OPI. .. .. . . Hi
(1 ~
l ----~ I ;
70
GO
, I ~)
1994
b J-,,± ~{~=t= .. 7" _~
1993 1ges >000 2002 2004·
);'~'Ir
r --O-Rila -O--Rli ---6--CracIt -e--0Pt
- - ...... I"""'J - - """'IOPI) • - - ..... 1""') --"""I"'J Figure B..J
812
Pre-Construction Cracking Indexes
."'- In 1994 6-- . Estimated RSL
~h~ ~ AlII ••.•.... 7.0 I
'iJ!r' -1- Block ..... 1.6 ,.... Long ..... 6.0 -
100
90
80
70
60
50
40
30
20
10
.!}. -'" ..... -. r:-- Tranav ... -2.0 LAlC ..... 10 "-r.\ , "-
\\ " +~+--'--t--~\ I- 1.... _----+ ___ . -_.+ .:_,.+----t--~ .
- .. ~- - ! - ~.-
1991 1993 1995 1997 1999 2001
--o--~ --o-Bb:t - :.....- Long -e--TI'II'ISY
___w__ IJrI..C - 1i&r(M;j) - - liIaar(Btlckl - - lfta' (laIg)
- - I..hlarrrral~ - - - IiI&I"(LALC)
Figure B-2
Post-Construction Cracking Indexes 110
100
90
j 80
70
80
50 ~994
~~~ .~ " .\'"'~
~ ;i:;
" I'\. ; 996 i £:98
Year
In 1999 Estimated RSL Alig ...... 15 Block .. ... . 15 long ..•.. 15 - Tranav .... 5.0 LAlC ..... 12
• • • • • • .
2000 ?On~
.
;mf./4
~ _. - -1 ---Q---.. Aig ~Ba:x --A--Long --e--Tranrw
-X-lJlC -"""~ • """_ _. """IT""'; - - ..... (\.0<0) - - - u-(1J<.C)
Figure 8-4

4.25" Grade "C" OVERLAY + FABRIC OVER MOSTLY FUNCTIONAL DISTRESS (Med RidelMed Ruts & HlghTransverselMed LALC Cracks) r-________________________ S_e_rie_S_I_d8_nl __ N_o_. _l,_U_S_2_8_5_,w_e_s_t_o~fDenve~on ;E=ithe~r=S=ld=e=o=f=c=3=40=,=M=P-24--8-.3-~=5=0_.2 ________________________ ~
Pre.construction Condition Indexes
100 lin 1994 Ii
•
9O)~ 80~
j 701\ ~
IlQ
5<) 1 "t '>' ' . 1 .01 : ~ '( i. j
1991 1993 1995 1997
Year
Estimated RSL Ride. 2.4 Rut ... O.S Crack .. . -1 .0 OPI ...... . 0.8
1999 2001
F ~~1 ---O---R'de -4--Rut --lr-Crac:t ---4--0PI
- - - ""'I~ ----"'>1"'1 - - Pdt.I"") ,,"wi""'*!
110
100
90
= 80 ... .E
70
60
50 i994
FigureA-5
Post.construction Condition Indexes
. .
1996 1998 2000
Year
In 1999 Estimated FL Ride .... 115 Rut ....... e.e ,Clack .... 8.8 OPI ....... 11 .0
...
2002 2:004
I--O--RiIe -+-Rut --lr-Cnd ---e--CFI
.. - .. 1ilacr(Rile) _ .. lIIea' (Crd;J - - Ln. (CPI) ----"""1"'1 RgureA-7
8-13
100
90
80
i 70
.= 80
50
-4C
30
Pre.construction Cracking Indexes
~1'" Estlmated RSL ~ _1 Aig ..... ... a,o Block .... 10 ---= . - . long ..... 2.6
iIt\\ L Tnlnsv ... -1 .B ~ iLALC ..... 0.7
" ...J. -~ ~ , ....
1 -1 ~-
' ..... , !~ •
~r~:~=:j ,
}~- -~~ . -~ ---- - _ •• ~ I
1991 1993 1005 , S9i' 1999 2001
Year ----O--AIG -+-Bbck -b--Long --e--Transv
----tt- LALC - .. Lilear(Bb::k) - - Ika"(I..oIW _ .. I..i1ear(T1'ft\1
- - - "-(lAlC) ---"-1"1)
AgureA-6
Post.constructlon Cracking Indexes ,10
~1'"
100
90 M • 80 ... .E
:F ~~
_ . ~~tim.i"~;L -:-- ~~' ..... .. Block .... 13
+-___ + -" Long •.•.• 15 .. , Transv ... 8,0
.. LALC ..... ".5
.----'~=-''r_t-''' •• -L~ -.t-----... I • j ". I I
"I .-.......;;:1· --- . I •
1994 1996 1998 2000 2uD:! 2004
'fear -O--Mg --O--Btd --I:r-1..oI1I --e--Trnv
___ lALC - - "'>11lkd) - - u..'I .... ) - L>ow(T_
- "-(lAlC1 ---"-(AIo)
AgureA-a

Network PMS Avg RSL and YFL by Condition Indexes
20.0 ..: II c 15.0 0 0 @l
~ 10.0 Z ..J 1.1.
5.0 ~ ';C W ..J 0.0
~ -5.0
1-25 Avg 10-yr ESALs 5.0 Million 81-25 Pre Const RG Avg 10-yr ESALs, 2.9 Million Avg
D 1-25 Post Const Avg
GI R G Pre Constr Avg
I!IR G Post Constr Avg
R G = Rehab. Guide
Ride Rut Crack OPI
ConditIon Index Category
Figure B-9
Network PMS Avg RSL and YFL by Cracking Indexes
81-25 Pre 20.0 T'""-----------__ --______ ~-.., Const Avg
~25 Avg1()'yr ESALs, 5.0 Million
15.0 15.0 @) 15.0
i z ..J ..:10.0 1.1.-
~ 8 : 0 5.0 -H=::j/I W ..J
~ 0.0
ALiG
RG Avg1 ().yr ESALs, 2.9 Millon
15.0 14.7 ------------------------~
BLCK LONG LALC
D 1-25 Post ConstAvg
DR G Pre Constr Avg
-5.0 -'------------------....
I!lR G Post Constr Avg
Cracking Categories
Figure B-10
8-14
R G = Rehab. Guide