department of public safety and corrections book/oct 17/recid.adm.rel.oct.17.pdf · 1st year...
TRANSCRIPT
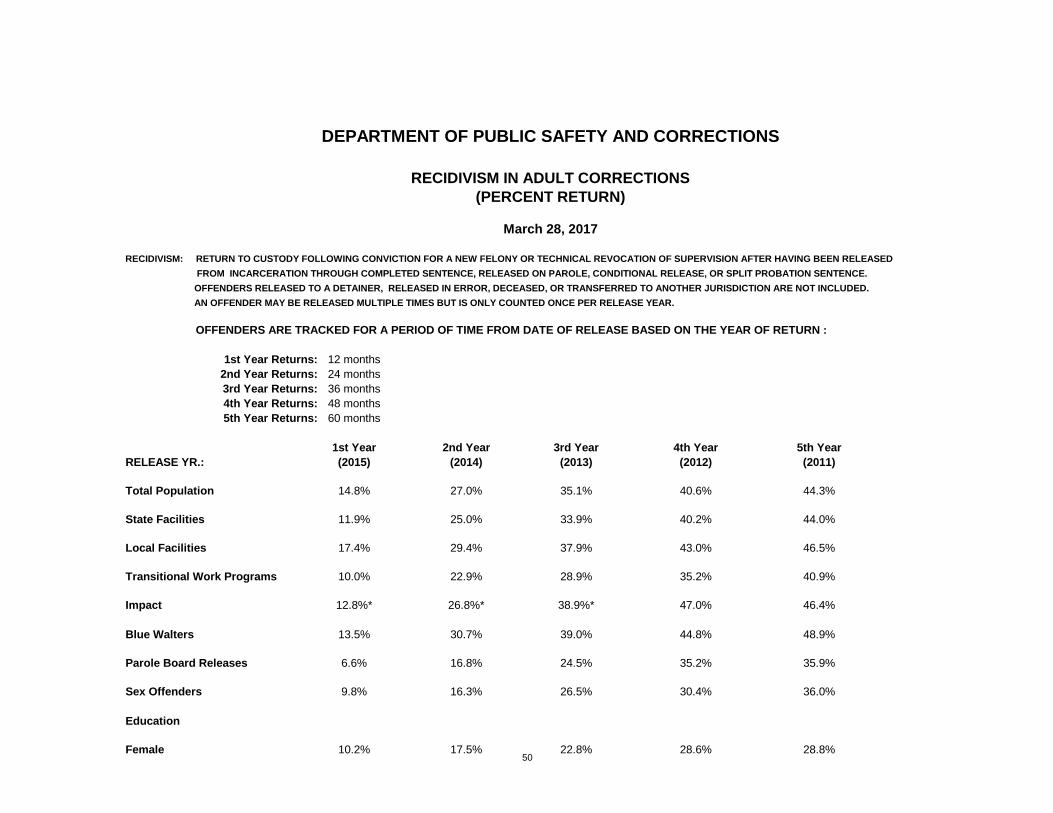
RECIDIVISM: RETURN TO CUSTODY FOLLOWING CONVICTION FOR A NEW FELONY OR TECHNICAL REVOCATION OF SUPERVISION AFTER HAVING BEEN RELEASED
FROM INCARCERATION THROUGH COMPLETED SENTENCE, RELEASED ON PAROLE, CONDITIONAL RELEASE, OR SPLIT PROBATION SENTENCE.
OFFENDERS RELEASED TO A DETAINER, RELEASED IN ERROR, DECEASED, OR TRANSFERRED TO ANOTHER JURISDICTION ARE NOT INCLUDED.
AN OFFENDER MAY BE RELEASED MULTIPLE TIMES BUT IS ONLY COUNTED ONCE PER RELEASE YEAR.
OFFENDERS ARE TRACKED FOR A PERIOD OF TIME FROM DATE OF RELEASE BASED ON THE YEAR OF RETURN :
12 months
24 months
36 months
48 months
60 months
1st Year 2nd Year 3rd Year 4th Year 5th Year
RELEASE YR.: (2015) (2014) (2013) (2012) (2011)
Total Population 14.8% 27.0% 35.1% 40.6% 44.3%
State Facilities 11.9% 25.0% 33.9% 40.2% 44.0%
Local Facilities 17.4% 29.4% 37.9% 43.0% 46.5%
Transitional Work Programs 10.0% 22.9% 28.9% 35.2% 40.9%
Impact 12.8%* 26.8%* 38.9%* 47.0% 46.4%
Blue Walters 13.5% 30.7% 39.0% 44.8% 48.9%
Parole Board Releases 6.6% 16.8% 24.5% 35.2% 35.9%
Sex Offenders 9.8% 16.3% 26.5% 30.4% 36.0%
Education
Female 10.2% 17.5% 22.8% 28.6% 28.8%
DEPARTMENT OF PUBLIC SAFETY AND CORRECTIONS
5th Year Returns:
March 28, 2017
(PERCENT RETURN)
RECIDIVISM IN ADULT CORRECTIONS
1st Year Returns:
2nd Year Returns:
3rd Year Returns:
4th Year Returns:
50

RECIDIVISM: RETURN TO CUSTODY FOLLOWING CONVICTION FOR A NEW FELONY OR TECHNICAL REVOCATION OF SUPERVISION AFTER HAVING BEEN
RELEASED FROM INCARCERATION THROUGH COMPLETED SENTENCE, RELEASED ON PAROLE, CONDITIONAL RELEASE, OR SPLIT PROBATION SENTENCE.
OFFENDERS RELEASED TO A DETAINER, RELEASED IN ERROR, DECEASED, OR TRANSFERRED TO ANOTHER JURISDICTION ARE NOT INCLUDED.
AN OFFENDER MAY BE RELEASED MULTIPLE TIMES BUT IS ONLY COUNTED ONCE PER RELEASE YEAR.
OFFENDERS ARE TRACKED FOR A PERIOD OF TIME FROM DATE OF RELEASE BASED ON THE YEAR OF RETURN :
12 months
24 months
36 months
48 months
60 months
Total
Releases
1st Year
Returns%
2nd Year
Returns%
3rd Year
Returns%
4th Year
Returns%
5th Year
Returns%
2004 13,691 2,736 20.0% 4,374 31.9% 5,295 38.7% 5,892 43.0% 6,328 46.2%
2005 13,550 2,485 18.3% 4,188 30.9% 5,124 37.8% 5,762 42.5% 6,234 46.0%
2006 13,032 2,301 17.7% 3,827 29.4% 4,736 36.3% 5,376 41.3% 5,875 45.1%
2007 12,650 2,235 17.7% 3,732 29.5% 4,646 36.7% 5,265 41.6% 5,731 45.3%
2008 12,846 2,141 16.7% 3,676 28.6% 4,733 36.8% 5,375 41.8% 5,831 45.4%
2009 12,938 2,087 16.1% 3,729 28.8% 4,625 35.7% 5,197 40.2% 5,623 43.5%
2010 14,760 2,265 15.3% 4,229 28.7% 5,231 35.4% 5,895 39.9% 6,354 43.0%
2011 14,215 2,249 15.8% 4,188 29.5% 5,174 36.4% 5,848 41.1% 6,301 44.3%
2012 14,471 2,343 16.2% 4,254 29.4% 5,249 36.3% 5,871 40.6%
2013 15,228 2,453 16.1% 4,393 28.8% 5,344 35.1%
2014 15,006 2,356 15.7% 4,057 27.0%
2015 14,796 2,192 14.8%
STATE OFFENDERS RELEASED FROM ADULT FACILITIES, LOCAL JAIL FACILITIES, AND TRANSITIONAL WORK PROGRAMS.
5th Year Returns:
DEPARTMENT OF PUBLIC SAFETY AND CORRECTIONS
March 28, 2017
(TOTAL POPULATION)
RECIDIVISM IN ADULT CORRECTIONS
1st Year Returns:
2nd Year Returns:
3rd Year Returns:
4th Year Returns:
51

RECIDIVISM: RETURN TO CUSTODY FOLLOWING CONVICTION FOR A NEW FELONY OR TECHNICAL REVOCATION OF SUPERVISION AFTER HAVING BEEN
RELEASED FROM INCARCERATION THROUGH COMPLETED SENTENCE, RELEASED ON PAROLE, CONDITIONAL RELEASE, OR SPLIT PROBATION SENTENCE.
OFFENDERS RELEASED TO A DETAINER, RELEASED IN ERROR, DECEASED, OR TRANSFERRED TO ANOTHER JURISDICTION ARE NOT INCLUDED.
AN OFFENDER MAY BE RELEASED MULTIPLE TIMES BUT IS ONLY COUNTED ONCE PER RELEASE YEAR.
OFFENDERS ARE TRACKED FOR A PERIOD OF TIME FROM DATE OF RELEASE BASED ON THE YEAR OF RETURN :
12 months
24 months
36 months
48 months
60 months
Total
Releases
1st Year
Returns%
2nd Year
Returns%
3rd Year
Returns%
4th Year
Returns%
5th Year
Returns%
2004 2,992 531 17.7% 911 30.4% 1,107 37.0% 1,246 41.6% 1,341 44.8%
2005 3,010 507 16.8% 924 30.7% 1,138 37.8% 1,287 42.8% 1,373 45.6%
2006 3,487 574 16.5% 969 27.8% 1,230 35.3% 1,413 40.5% 1,548 44.4%
2007 3,294 519 15.8% 950 28.8% 1,200 36.4% 1,357 41.2% 1,471 44.7%
2008 3,165 553 17.5% 944 29.8% 1,227 38.8% 1,387 43.8% 1,486 47.0%
2009 3,140 494 15.7% 885 28.2% 1,100 35.0% 1,208 38.5% 1,317 41.9%
2010 3,615 538 14.9% 1,025 28.4% 1,334 36.9% 1,483 41.0% 1,604 44.4%
2011 3,284 468 14.3% 940 28.6% 1,188 36.2% 1,351 41.1% 1,446 44.0%
2012 3,080 441 14.3% 873 28.3% 1,105 35.9% 1,239 40.2%
2013 3,272 444 13.6% 849 25.9% 1,108 33.9%
2014 3,095 407 13.2% 774 25.0%
2015 3,030 360 11.9%
STATE OFFENDERS RELEASED FROM ADULT INSTITUTIONS.
5th Year Returns:
DEPARTMENT OF PUBLIC SAFETY AND CORRECTIONS
March 28, 2017
(STATE FACILITIES)
RECIDIVISM IN ADULT CORRECTIONS
1st Year Returns:
2nd Year Returns:
3rd Year Returns:
4th Year Returns:
52

RECIDIVISM: RETURN TO CUSTODY FOLLOWING CONVICTION FOR A NEW FELONY OR TECHNICAL REVOCATION OF SUPERVISION AFTER HAVING BEEN
RELEASED FROM INCARCERATION THROUGH COMPLETED SENTENCE, RELEASED ON PAROLE, CONDITIONAL RELEASE, OR SPLIT PROBATION SENTENCE.
OFFENDERS RELEASED TO A DETAINER, RELEASED IN ERROR, DECEASED, OR TRANSFERRED TO ANOTHER JURISDICTION ARE NOT INCLUDED.
AN OFFENDER MAY BE RELEASED MULTIPLE TIMES BUT IS ONLY COUNTED ONCE PER RELEASE YEAR.
OFFENDERS ARE TRACKED FOR A PERIOD OF TIME FROM DATE OF RELEASE BASED ON THE YEAR OF RETURN :
12 months
24 months
36 months
48 months
60 months
Total
Releases
1st Year
Returns%
2nd Year
Returns%
3rd Year
Returns%
4th Year
Returns%
5th Year
Returns%
2004 7,536 1,771 23.5% 2,646 35.1% 3,121 41.4% 3,434 45.6% 3,674 48.8%
2005 7,114 1,472 20.7% 2,313 32.5% 2,783 39.1% 3,121 43.9% 3,374 47.4%
2006 5,941 1,257 21.2% 1,943 32.7% 2,357 39.7% 2,647 44.6% 2,868 48.3%
2007 5,776 1,246 21.6% 1,915 33.2% 2,309 40.0% 2,613 45.2% 2,828 49.0%
2008 6,189 1,192 19.3% 1,953 31.6% 2,402 38.8% 2,702 43.7% 2,934 47.4%
2009 6,676 1,190 17.8% 2,015 30.2% 2,533 37.9% 2,858 42.8% 3,067 45.9%
2010 7,764 1,352 17.4% 2,359 30.4% 2,908 37.5% 3,278 42.2% 3,521 45.4%
2011 7,829 1,403 17.9% 2,417 30.9% 3,000 38.3% 3,378 43.1% 3,641 46.5%
2012 8,428 1,546 18.3% 2,618 31.1% 3,246 38.5% 3,625 43.0%
2013 9,034 1,634 18.1% 2,795 30.9% 3,423 37.9%
2014 9,170 1,606 17.5% 2,698 29.4%
2015 9,138 1,594 17.4%
STATE OFFENDERS RELEASED FROM LOCAL FACILITIES .
5th Year Returns:
DEPARTMENT OF PUBLIC SAFETY AND CORRECTIONS
March 28, 2017
(LOCAL FACILITIES)
RECIDIVISM IN ADULT CORRECTIONS
1st Year Returns:
2nd Year Returns:
3rd Year Returns:
4th Year Returns:
53

RECIDIVISM: RETURN TO CUSTODY FOLLOWING CONVICTION FOR A NEW FELONY OR TECHNICAL REVOCATION OF SUPERVISION AFTER HAVING BEEN
RELEASED FROM INCARCERATION THROUGH COMPLETED SENTENCE, RELEASED ON PAROLE, CONDITIONAL RELEASE, OR SPLIT PROBATION SENTENCE.
OFFENDERS RELEASED TO A DETAINER, RELEASED IN ERROR, DECEASED, OR TRANSFERRED TO ANOTHER JURISDICTION ARE NOT INCLUDED.
AN OFFENDER MAY BE RELEASED MULTIPLE TIMES BUT IS ONLY COUNTED ONCE PER RELEASE YEAR.
OFFENDERS ARE TRACKED FOR A PERIOD OF TIME FROM DATE OF RELEASE BASED ON THE YEAR OF RETURN :
12 months
24 months
36 months
48 months
60 months
Total
Releases
1st Year
Returns%
2nd Year
Returns%
3rd Year
Returns%
4th Year
Returns%
5th Year
Returns%
2004 2,440 358 14.7% 659 27.0% 845 34.6% 962 39.4% 1,040 42.6%
2005 2,732 432 15.8% 800 29.3% 1,009 36.9% 1,138 41.7% 1,247 45.6%
2006 3,024 406 13.4% 795 26.3% 997 33.0% 1,138 37.6% 1,266 41.9%
2007 3,193 415 13.0% 760 23.8% 995 31.2% 1,128 35.3% 1,320 41.3%
2008 3,036 399 13.1% 764 25.2% 974 32.1% 1,147 37.8% 1,253 41.3%
2009 2,736 328 12.0% 662 24.2% 877 32.1% 990 36.2% 1,096 40.1%
2010 2,957 315 10.7% 679 23.0% 887 30.0% 1,021 34.5% 1,112 37.6%
2011 2,802 306 10.9% 683 24.4% 927 33.1% 1,052 37.5% 1,147 40.9%
2012 2,739 304 11.1% 635 23.2% 862 31.5% 964 35.2%
2013 2,860 325 11.4% 641 22.4% 826 28.9%
2014 2,847 332 11.7% 653 22.9%
2015 2,741 274 10.0%
STATE OFFENDERS RELEASED FROM TRANSITIONAL WORK PROGRAMS.
DEPARTMENT OF PUBLIC SAFETY AND CORRECTIONS
4th Year Returns:
5th Year Returns:
1st Year Returns:
2nd Year Returns:
3rd Year Returns:
March 28, 2017
(TRANSITIONAL WORK PROGRAMS)
RECIDIVISM IN ADULT CORRECTIONS
54

RECIDIVISM: RETURN TO CUSTODY FOLLOWING CONVICTION FOR A NEW FELONY OR TECHNICAL REVOCATION OF SUPERVISION AFTER HAVING BEEN
RELEASED FROM INCARCERATION THROUGH COMPLETED SENTENCE, RELEASED ON PAROLE, CONDITIONAL RELEASE, OR SPLIT PROBATION SENTENCE.
OFFENDERS RELEASED TO A DETAINER, RELEASED IN ERROR, DECEASED, OR TRANSFERRED TO ANOTHER JURISDICTION ARE NOT INCLUDED.
AN OFFENDER MAY BE RELEASED MULTIPLE TIMES BUT IS ONLY COUNTED ONCE PER RELEASE YEAR.
OFFENDERS ARE TRACKED FOR A PERIOD OF TIME FROM DATE OF RELEASE BASED ON THE YEAR OF RETURN :
12 months
24 months
36 months
48 months
60 months
Total
Releases
1st Year
Returns%
2nd Year
Returns%
3rd Year
Returns%
4th Year
Returns%
5th Year
Returns%
2004 256 24 9.4% 65 25.4% 98 38.3% 121 47.3% 135 52.7%
2005 225 19 8.4% 55 24.4% 77 34.2% 89 39.6% 100 44.4%
2006 175 16 9.1% 44 25.1% 60 34.3% 72 41.1% 82 46.9%
2007 181 23 12.7% 46 25.4% 59 32.6% 73 40.3% 80 44.2%
2008 236 13 5.5% 46 19.5% 72 30.5% 89 37.7% 108 45.8%
2009 245 33 13.5% 67 27.3% 98 40.0% 117 47.8% 127 51.8%
2010 253 19 7.5% 54 21.3% 84 33.2% 102 40.3% 111 43.9%
2011 192 16 8.3% 49 25.5% 71 37.0% 82 42.7% 89 46.4%
2012 149 19 12.8% 40 26.8% 59 39.6% 70 47.0%
NUMBERS INCLUDE STATE OFFENDERS RELEASED THAT COMPLETED THE IMPACT PROGRAM AT EHCC, FWADE, AND LCIW.
IMPACT PROGRAM ENDED MAY 2013.
3rd Year Returns:
4th Year Returns:
5th Year Returns:
DEPARTMENT OF PUBLIC SAFETY AND CORRECTIONS
March 28, 2017
(IMPACT GRADUATES)
RECIDIVISM IN ADULT CORRECTIONS
1st Year Returns:
2nd Year Returns:
55

RECIDIVISM: RETURN TO CUSTODY FOLLOWING CONVICTION FOR A NEW FELONY OR TECHNICAL REVOCATION OF SUPERVISION AFTER HAVING BEEN
RELEASED FROM INCARCERATION THROUGH COMPLETED SENTENCE, RELEASED ON PAROLE, CONDITIONAL RELEASE, OR SPLIT PROBATION SENTENCE.
OFFENDERS RELEASED TO A DETAINER, RELEASED IN ERROR, DECEASED, OR TRANSFERRED TO ANOTHER JURISDICTION ARE NOT INCLUDED.
AN OFFENDER MAY BE RELEASED MULTIPLE TIMES BUT IS ONLY COUNTED ONCE PER RELEASE YEAR.
OFFENDERS ARE TRACKED FOR A PERIOD OF TIME FROM DATE OF RELEASE BASED ON THE YEAR OF RETURN :
12 months
24 months
36 months
48 months
60 months
Total
Releases
1st Year
Returns%
2nd Year
Returns%
3rd Year
Returns%
4th Year
Returns%
5th Year
Returns%
2004 244 52 21.3% 93 38.1% 124 50.8% 130 53.3% 139 57.0%
2005 267 56 21.0% 101 37.8% 124 46.4% 139 52.1% 154 57.7%
2006 241 51 21.2% 83 34.4% 101 41.9% 115 47.7% 122 50.6%
2007 172 31 18.0% 60 34.9% 79 45.9% 88 51.2% 100 58.1%
2008 105 18 17.1% 34 32.4% 41 39.0% 52 49.5% 55 52.4%
2009 106 13 12.3% 29 27.4% 48 45.3% 49 46.2% 57 53.8%
2010 322 44 13.7% 90 28.0% 121 37.6% 134 41.6% 143 44.4%
2011 360 56 15.6% 110 30.6% 146 40.6% 163 45.3% 176 48.9%
2012 431 65 15.1% 123 28.5% 168 39.0% 193 44.8%
2013 551 92 16.7% 178 32.3% 215 39.0%
2014 446 68 15.2% 137 30.7%
2015 539 73 13.5%
INCLUDES OFFENDERS THAT PARTICIPATED IN BLUE WALTERS PRIOR TO RELEASE.
*BLUE WALTERS IS A SUBSTANCE ABUSE TREATMENT CENTER
**AUGUST 2005 ORLEANS/BLUE WALTERS PROGRAM IN NEW ORLEANS CLOSED
***TENSAS/BLUE WALTERS PROGRAM OPEN MAY 2004 TO JULY 2006.
****JULY 2006-JULY 2007 BLUE WALTERS PROGRAM TRANSFERRED TO SOUTH LOUISIANA CORRECTIONAL CENTER
*****JULY 2007 SOUTH LOUISIANA CORRECTIONAL CENTER RENAMED RICHWOOD
(BLUE WALTERS)
RECIDIVISM IN ADULT CORRECTIONS
DEPARTMENT OF PUBLIC SAFETY AND CORRECTIONS
5th Year Returns:
1st Year Returns:
2nd Year Returns:
3rd Year Returns:
4th Year Returns:
March 28, 2017
56

RECIDIVISM: RETURN TO CUSTODY FOLLOWING CONVICTION FOR A NEW FELONY OR TECHNICAL REVOCATION OF SUPERVISION AFTER HAVING BEEN
RELEASED FROM INCARCERATION THROUGH COMPLETED SENTENCE, RELEASED ON PAROLE, CONDITIONAL RELEASE, OR SPLIT PROBATION SENTENCE.
OFFENDERS RELEASED TO A DETAINER, RELEASED IN ERROR, DECEASED, OR TRANSFERRED TO ANOTHER JURISDICTION ARE NOT INCLUDED.
AN OFFENDER MAY BE RELEASED MULTIPLE TIMES BUT IS ONLY COUNTED ONCE PER RELEASE YEAR.
OFFENDERS ARE TRACKED FOR A PERIOD OF TIME FROM DATE OF RELEASE BASED ON THE YEAR OF RETURN :
12 months
24 months
36 months
48 months
60 months
Total
Releases
1st Year
Returns%
2nd Year
Returns%
3rd Year
Returns%
4th Year
Returns%
5th Year
Returns%
2004 1,048 158 15.1% 302 28.8% 383 36.5% 424 40.5% 454 43.3%
2005 1,004 152 15.1% 305 30.4% 382 38.0% 427 42.5% 454 45.2%
2006 1,015 113 11.1% 243 23.9% 309 30.4% 363 35.8% 398 39.2%
2007 1,119 137 12.2% 272 24.3% 364 32.5% 415 37.1% 453 40.5%
2008 825 65 7.9% 187 22.7% 256 31.0% 304 36.8% 344 41.7%
2009 601 63 10.5% 135 22.5% 193 32.1% 234 38.9% 257 42.8%
2010 602 41 6.8% 122 20.3% 179 29.7% 209 34.7% 217 36.0%
2011 555 45 8.1% 122 22.0% 168 30.3% 188 33.9% 199 35.9%
2012 826 73 8.8% 176 21.3% 260 31.5% 291 35.2%
2013 600 50 8.3% 115 19.2% 147 24.5%
2014 513 44 8.6% 86 16.8%
2015 426 28 6.6%
EXCLUDES: IMPACT GRADUATES
(PAROLE BOARD RELEASES)
RECIDIVISM IN ADULT CORRECTIONS
DEPARTMENT OF PUBLIC SAFETY AND CORRECTIONS
5th Year Returns:
1st Year Returns:
2nd Year Returns:
3rd Year Returns:
4th Year Returns:
March 28, 2017
57

RECIDIVISM: RETURN TO CUSTODY FOLLOWING CONVICTION FOR A NEW FELONY OR TECHNICAL REVOCATION OF SUPERVISION AFTER HAVING BEEN
RELEASED FROM INCARCERATION THROUGH COMPLETED SENTENCE, RELEASED ON PAROLE, CONDITIONAL RELEASE, OR SPLIT PROBATION SENTENCE.
OFFENDERS RELEASED TO A DETAINER, RELEASED IN ERROR, DECEASED, OR TRANSFERRED TO ANOTHER JURISDICTION ARE NOT INCLUDED.
AN OFFENDER MAY BE RELEASED MULTIPLE TIMES BUT IS ONLY COUNTED ONCE PER RELEASE YEAR.
OFFENDERS ARE TRACKED FOR A PERIOD OF TIME FROM DATE OF RELEASE BASED ON THE YEAR OF RETURN :
12 months
24 months
36 months
48 months
60 months
Total
Releases
1st Year
Returns%
2nd Year
Returns%
3rd Year
Returns%
4th Year
Returns%
5th Year
Returns%
2004 811 196 24.2% 293 36.1% 348 42.9% 387 47.7% 415 51.2%
2005 769 173 22.5% 252 32.8% 290 37.7% 326 42.4% 349 45.4%
2006 675 133 19.7% 202 29.9% 309 45.8% 363 53.8% 307 45.5%
2007 580 101 17.4% 159 27.4% 194 33.4% 229 39.5% 257 44.3%
2008 620 100 16.1% 155 25.0% 195 31.5% 231 37.3% 258 41.6%
2009 620 93 15.0% 153 24.7% 190 30.6% 205 33.1% 229 36.9%
2010 619 92 14.9% 159 25.7% 206 33.3% 234 37.8% 250 40.4%
2011 652 61 9.4% 133 20.4% 181 27.8% 217 33.3% 235 36.0%
2012 602 56 9.3% 121 20.1% 164 27.2% 183 30.4%
2013 683 74 10.8% 139 20.4% 181 26.5%
2014 618 56 9.1% 101 16.3%
2015 623 61 9.8%
STATE OFFENDERS RELEASED FROM ADULT INSTITUTIONS, LOCAL FACILITIES, AND TRANSITIONAL WORK PROGRAMS.
SEX OFFENSE:A VIOLATION OF ANY PROVISION OF SUBPART C OF PART II, SUBPART B OF PART IV, OR SUBPART A(1)
OR A(4) OF SUBPART V OF CHAPTER 1 OF TITLE 14 OF THE LOUISIANA REVISED STATUTES OF 1950.
RECIDIVISM IN ADULT CORRECTIONS
5th Year Returns:
1st Year Returns:
2nd Year Returns:
3rd Year Returns:
4th Year Returns:
DEPARTMENT OF PUBLIC SAFETY AND CORRECTIONS
March 28, 2017
(SEX OFFENDERS)
58

RECIDIVISM: RETURN TO CUSTODY FOLLOWING CONVICTION FOR A NEW FELONY OR TECHNICAL REVOCATION OF SUPERVISION AFTER HAVING BEEN
RELEASED FROM INCARCERATION THROUGH COMPLETED SENTENCE, RELEASED ON PAROLE, CONDITIONAL RELEASE, OR SPLIT PROBATION SENTENCE.
OFFENDERS RELEASED TO A DETAINER, RELEASED IN ERROR, DECEASED, OR TRANSFERRED TO ANOTHER JURISDICTION ARE NOT INCLUDED.
AN OFFENDER MAY BE RELEASED MULTIPLE TIMES BUT IS ONLY COUNTED ONCE PER RELEASE YEAR.
OFFENDERS ARE TRACKED FOR A PERIOD OF TIME FROM DATE OF RELEASE BASED ON THE YEAR OF RETURN :
12 months
24 months
36 months
48 months
60 months
Total
Releases
1st Year
Returns%
2nd Year
Returns%
3rd Year
Returns%
4th Year
Returns%
5th Year
Returns%
2004 1,042 105 10.1% 252 24.2% 347 33.3% 416 39.9% 455 43.7%
2005 1,151 117 10.2% 264 22.9% 366 31.8% 430 37.4% 470 40.8%
2006 1,231 103 8.4% 243 19.7% 330 26.8% 396 32.2% 444 36.1%
2007 1,242 128 10.3% 261 21.0% 368 29.6% 434 34.9% 486 39.1%
2008 1,450 159 11.0% 333 23.0% 454 31.3% 540 37.2% 593 40.9%
2009 1,477 177 12.0% 351 23.8% 483 32.7% 544 36.8% 598 40.5%
2010 1,798 170 9.5% 383 21.3% 548 30.5% 634 35.3% 705 39.2%
2011 1,573 138 8.8% 366 23.3% 490 31.2% 570 36.2%
2012 1,466 159 10.8% 340 23.2% 483 32.9%
2013 1,444 107 7.4% 254 17.6%
2014 1,268 109 8.6%
STATE OFFENDERS RELEASED FROM ADULT INSTITUTIONS, LOCAL FACILITIES, AND TRANSITIONAL WORK PROGRAMS THAT HAVE COMPLETED
AN EDUCATION CLASS WHILE INCARCERATED IN A STATE FACILITY.
RECIDIVISM IN ADULT CORRECTIONS
5th Year Returns:
1st Year Returns:
2nd Year Returns:
3rd Year Returns:
4th Year Returns:
DEPARTMENT OF PUBLIC SAFETY AND CORRECTIONS
March 18, 2016
(EDUCATION)
59

RECIDIVISM: RETURN TO CUSTODY FOLLOWING CONVICTION FOR A NEW FELONY OR TECHNICAL REVOCATION OF SUPERVISION AFTER HAVING BEEN
RELEASED FROM INCARCERATION THROUGH COMPLETED SENTENCE, RELEASED ON PAROLE, CONDITIONAL RELEASE, OR SPLIT PROBATION SENTENCE.
OFFENDERS RELEASED TO A DETAINER, RELEASED IN ERROR, DECEASED, OR TRANSFERRED TO ANOTHER JURISDICTION ARE NOT INCLUDED.
AN OFFENDER MAY BE RELEASED MULTIPLE TIMES BUT IS ONLY COUNTED ONCE PER RELEASE YEAR.
OFFENDERS ARE TRACKED FOR A PERIOD OF TIME FROM DATE OF RELEASE BASED ON THE YEAR OF RETURN :
12 months
24 months
36 months
48 months
60 months
Total
Releases
1st Year
Returns%
2nd Year
Returns%
3rd Year
Returns%
4th Year
Returns%
5th Year
Returns%
2004 1,562 234 15.0% 354 22.7% 437 28.0% 488 31.2% 528 33.8%
2005 1,493 205 13.7% 337 22.6% 410 27.5% 468 31.3% 507 34.0%
2006 1,445 173 12.0% 298 20.6% 360 24.9% 400 27.7% 434 30.0%
2007 1,423 168 11.8% 281 19.7% 345 24.2% 390 27.4% 440 30.9%
2008 1,437 169 11.8% 292 20.3% 390 27.1% 455 31.7% 501 34.9%
2009 1,435 138 9.6% 248 17.3% 317 22.1% 363 25.3% 402 28.0%
2010 1,739 163 9.4% 315 18.1% 394 22.7% 453 26.0% 499 28.7%
2011 1,627 169 10.4% 299 18.4% 374 23.0% 432 26.6% 469 28.8%
2012 1,550 181 11.7% 308 19.9% 390 25.2% 444 28.6%
2013 1,662 174 10.5% 301 18.1% 379 22.8%
2014 1,661 161 9.7% 291 17.5%
2015 1,617 165 10.2%
FEMALE STATE OFFENDERS RELEASED FROM ADULT INSTITUTIONS, LOCAL FACILITIES, AND TRANSITIONAL WORK PROGRAMS.
5th Year Returns:
1st Year Returns:
2nd Year Returns:
3rd Year Returns:
4th Year Returns:
DEPARTMENT OF PUBLIC SAFETY AND CORRECTIONS
March 28, 2017
(FEMALE RECIDIVISM)
RECIDIVISM IN ADULT CORRECTIONS
60

RECIDIVISM: RETURN TO CUSTODY FOLLOWING CONVICTION FOR A NEW FELONY OR TECHNICAL REVOCATION OF SUPERVISION AFTER HAVING BEEN
RELEASED FROM INCARCERATION THROUGH COMPLETED SENTENCE, RELEASED ON PAROLE, CONDITIONAL RELEASE, OR SPLIT PROBATION SENTENCE.
OFFENDERS RELEASED TO A DETAINER, RELEASED IN ERROR, DECEASED, OR TRANSFERRED TO ANOTHER JURISDICTION ARE NOT INCLUDED.
AN OFFENDER MAY BE RELEASED MULTIPLE TIMES BUT IS ONLY COUNTED ONCE PER RELEASE YEAR.
OFFENDERS ARE TRACKED FOR A PERIOD OF TIME FROM DATE OF RELEASE BASED ON THE YEAR OF RETURN :
12 months
24 months
36 months
48 months
60 months
Total
Releases
1st Year
Returns%
2nd Year
Returns%
3rd Year
Returns%
4th Year
Returns%
5th Year
Returns%
2004 16,717 716 4.3% 1,461 8.7% 2,120 12.7% 2,718 16.3% 3,288 19.7%
2005 17,543 631 3.6% 1,467 8.4% 2,209 12.6% 2,921 16.7% 3,535 20.2%
2006 18,557 679 3.7% 1,667 9.0% 2,540 13.7% 3,295 17.8% 3,890 21.0%
2007 17,185 743 4.3% 1,691 9.8% 2,545 14.8% 3,175 18.5% 3,691 21.5%
2008 17,321 723 4.2% 1,728 10.0% 2,528 14.6% 3,205 18.5% 3,721 21.5%
2009 18,265 791 4.3% 1,777 9.7% 2,689 14.7% 3,347 18.3% 3,841 21.0%
2010 18,764 755 4.0% 1,774 9.5% 2,672 14.2% 3,363 17.9% 3,918 20.9%
2011 19,267 877 4.6% 1,925 10.0% 2,796 14.5% 3,470 18.0% 4,031 20.9%
2012 19,011 866 4.6% 1,880 9.9% 2,688 14.1% 3,375 17.8%
2013 19,537 858 4.4% 1,837 9.4% 2,738 14.0%
2014 18,346 897 4.9% 1,823 9.9%
2015 17,908 812 4.5%
DEPARTMENT OF PUBLIC SAFETY AND CORRECTIONS
RECIDIVISM IN ADULT CORRECTIONS
(ALL PNP COMPLETIONS)
March 28, 2017
5th Year Returns:
2nd Year Returns:
3rd Year Returns:
4th Year Returns:
1st Year Returns:
61

RECIDIVISM: RETURN TO CUSTODY FOLLOWING CONVICTION FOR A NEW FELONY OR TECHNICAL REVOCATION OF SUPERVISION AFTER HAVING BEEN
RELEASED FROM INCARCERATION THROUGH COMPLETED SENTENCE, RELEASED ON PAROLE, CONDITIONAL RELEASE, OR SPLIT PROBATION SENTENCE.
OFFENDERS RELEASED TO A DETAINER, RELEASED IN ERROR, DECEASED, OR TRANSFERRED TO ANOTHER JURISDICTION ARE NOT INCLUDED.
AN OFFENDER MAY BE RELEASED MULTIPLE TIMES BUT IS ONLY COUNTED ONCE PER RELEASE YEAR.
OFFENDERS ARE TRACKED FOR A PERIOD OF TIME FROM DATE OF RELEASE BASED ON THE YEAR OF RETURN :
12 months
24 months
36 months
48 months
60 months
Total
Releases
1st Year
Returns%
2nd Year
Returns%
3rd Year
Returns%
4th Year
Returns%
5th Year
Returns%
2004 13,691 2,736 20.0% 4,374 31.9% 5,295 38.7% 5,892 43.0% 6,328 46.2%
2005 13,550 2,485 18.3% 4,188 30.9% 5,124 37.8% 5,762 42.5% 6,234 46.0%
2006 13,032 2,301 17.7% 3,827 29.4% 4,736 36.3% 5,376 41.3% 5,875 45.1%
2007 12,650 2,235 17.7% 3,732 29.5% 4,646 36.7% 5,265 41.6% 5,731 45.3%
2008 12,846 2,141 16.7% 3,676 28.6% 4,733 36.8% 5,375 41.8% 5,831 45.4%
2009 12,938 2,087 16.1% 3,729 28.8% 4,625 35.7% 5,197 40.2% 5,623 43.5%
2010 14,760 2,265 15.3% 4,229 28.7% 5,231 35.4% 5,895 39.9% 6,354 43.0%
2011 14,215 2,249 15.8% 4,188 29.5% 5,174 36.4% 5,848 41.1% 6,301 44.3%
2012 14,471 2,343 16.2% 4,254 29.4% 5,249 36.3% 5,871 40.6%
2013 15,228 2,453 16.1% 4,393 28.8% 5,344 35.1%
2014 15,006 2,356 15.7% 4,057 27.0%
2015 14,796 2,192 14.8%
1st Year 2nd Year 3rd Year 4th Year 5th Year
(2015) (2014) (2013) (2012) (2011)
VIOLENT CRIMES: 1.2% 2.6% 3.6% 4.3% 4.8%
DRUG CRIMES: 4.9% 9.3% 12.6% 15.0% 17.6%
PROPERTY CRIMES: 6.0% 10.5% 13.1% 14.7% 15.1%
ALL OTHER CRIMES: 2.7% 4.6% 5.9% 6.6% 6.8%
5th Year Returns:
CRIME TYPE IS THE CRIME THE OFFENDER SERVED TIME FOR AND THEN WAS RELEASED FROM INCARCERATION.
STATE OFFENDERS RELEASED FROM ADULT INSTITUTIONS, LOCAL FACILITIES, AND WORK RELEASE CENTERS.
PERCENT RETURNED WITHIN EACH RELEASE CRIME TYPE (Based on Last Full Year's Returns)
March 28, 2017
1st Year Returns:
2nd Year Returns:
3rd Year Returns:
(TOTAL POPULATION - CRIME TYPE)
RECIDIVISM IN ADULT CORRECTIONS
DEPARTMENT OF PUBLIC SAFETY AND CORRECTIONS
4th Year Returns:
62

RECIDIVISM: RETURN TO CUSTODY FOLLOWING CONVICTION FOR A NEW FELONY OR TECHNICAL REVOCATION OF SUPERVISION AFTER HAVING BEEN
RELEASED FROM INCARCERATION THROUGH COMPLETED SENTENCE, RELEASED ON PAROLE, CONDITIONAL RELEASE, OR SPLIT PROBATION SENTENCE.
OFFENDERS RELEASED TO A DETAINER, RELEASED IN ERROR, DECEASED, OR TRANSFERRED TO ANOTHER JURISDICTION ARE NOT INCLUDED.
AN OFFENDER MAY BE RELEASED MULTIPLE TIMES BUT IS ONLY COUNTED ONCE PER RELEASE YEAR.
OFFENDERS ARE TRACKED FOR A PERIOD OF TIME FROM DATE OF RELEASE BASED ON THE YEAR OF RETURN :
12 months
24 months
36 months
48 months
60 months
Total
Releases
1st Year
Returns%
2nd Year
Returns%
3rd Year
Returns%
4th Year
Returns%
5th Year
Returns%
2004 13,691 2,736 20.0% 4,374 31.9% 5,295 38.7% 5,892 43.0% 6,328 46.2%
2005 13,550 2,485 18.3% 4,188 30.9% 5,124 37.8% 5,762 42.5% 6,234 46.0%
2006 13,032 2,301 17.7% 3,827 29.4% 4,736 36.3% 5,376 41.3% 5,875 45.1%
2007 12,650 2,235 17.7% 3,732 29.5% 4,646 36.7% 5,265 41.6% 5,731 45.3%
2008 12,846 2,141 16.7% 3,676 28.6% 4,733 36.8% 5,375 41.8% 5,831 45.4%
2009 12,938 2,087 16.1% 3,729 28.8% 4,625 35.7% 5,197 40.2% 5,623 43.5%
2010 14,760 2,265 15.3% 4,229 28.7% 5,231 35.4% 5,895 39.9% 6,354 43.0%
2011 14,215 2,249 15.8% 4,188 29.5% 5,174 36.4% 5,848 41.1% 6,301 44.3%
2012 14,471 2,343 16.2% 4,254 29.4% 5,249 36.3% 5,871 40.6%
2013 15,228 2,453 16.1% 4,393 28.8% 5,344 35.1%
2014 15,006 2,356 15.7% 4,057 27.0%
2015 14,796 2,192 14.8%
1st Year 2nd Year 3rd Year 4th Year 5th Year
(2015) (2014) (2013) (2012) (2011)
1ST OFFENDER: 11.3% 10.3% 9.4% 8.5% 7.0%
2ND OFFENDER: 25.7% 23.9% 25.8% 23.4% 22.7%
3RD OFFENDER: 26.2% 27.6% 27.4% 29.4% 28.5%
4TH OFFENDER+: 36.7% 38.1% 37.2% 38.5% 41.7%
UNKNOWN: 0.1% 0.1% 0.2% 0.2% 0.1%
STATE OFFENDERS RELEASED FROM ADULT INSTITUTIONS, LOCAL FACILITIES, AND WORK RELEASE CENTERS.
March 28, 2017
(TOTAL POPULATION - OFFENDER CLASS)
1st Year Returns:
2nd Year Returns:
3rd Year Returns:
4th Year Returns:
5th Year Returns:
DEPARTMENT OF PUBLIC SAFETY AND CORRECTIONS
PERCENT RETURNED BY CURRENT OFFENDER CLASS (Based on Last Full Year's Returns)
RECIDIVISM IN ADULT CORRECTIONS
63

RECIDIVISM: RETURN TO CUSTODY FOLLOWING CONVICTION FOR A NEW FELONY OR TECHNICAL REVOCATION OF SUPERVISION AFTER HAVING BEEN
RELEASED FROM INCARCERATION THROUGH COMPLETED SENTENCE, RELEASED ON PAROLE, CONDITIONAL RELEASE, OR SPLIT PROBATION SENTENCE.
OFFENDERS RELEASED TO A DETAINER, RELEASED IN ERROR, DECEASED, OR TRANSFERRED TO ANOTHER JURISDICTION ARE NOT INCLUDED.
AN OFFENDER MAY BE RELEASED MULTIPLE TIMES BUT IS ONLY COUNTED ONCE PER RELEASE YEAR.
OFFENDERS ARE TRACKED FOR A PERIOD OF TIME FROM DATE OF RELEASE BASED ON THE YEAR OF RETURN :
12 months
24 months
36 months
48 months
60 months
Total
Releases
1st Year
Returns%
2nd Year
Returns%
3rd Year
Returns%
4th Year
Returns%
5th Year
Returns%
2004 13,691 2,736 20.0% 4,374 31.9% 5,295 38.7% 5,892 43.0% 6,328 46.2%
2005 13,550 2,485 18.3% 4,188 30.9% 5,124 37.8% 5,762 42.5% 6,234 46.0%
2006 13,032 2,301 17.7% 3,827 29.4% 4,736 36.3% 5,376 41.3% 5,875 45.1%
2007 12,650 2,235 17.7% 3,732 29.5% 4,646 36.7% 5,265 41.6% 5,731 45.3%
2008 12,846 2,141 16.7% 3,676 28.6% 4,733 36.8% 5,375 41.8% 5,831 45.4%
2009 12,938 2,087 16.1% 3,729 28.8% 4,625 35.7% 5,197 40.2% 5,623 43.5%
2010 14,760 2,265 15.3% 4,229 28.7% 5,231 35.4% 5,895 39.9% 6,354 43.0%
2011 14,215 2,249 15.8% 4,188 29.5% 5,174 36.4% 5,848 41.1% 6,301 44.3%
2012 14,471 2,343 16.2% 4,254 29.4% 5,249 36.3% 5,871 40.6%
2013 15,228 2,453 16.1% 4,393 28.8% 5,344 35.1%
2014 15,006 2,356 15.7% 4,057 27.0%
2015 14,796 2,192 14.8%
1st Year 2nd Year 3rd Year 4th Year 5th Year
(2015) (2014) (2013) (2012) (2011)
<=16 0.0% 0.0% 0.0% 0.0% 0.0%
17 0.0% 0.0% 0.0% 0.0% 0.0%
18 0.1% 0.1% 0.2% 0.2% 0.2%
19 - 20 0.5% 0.9% 1.3% 1.7% 1.6%
21 - 24 2.3% 4.4% 6.1% 6.6% 6.7%
25 - 29 3.1% 5.9% 7.4% 9.1% 10.2%
30 - 34 3.0% 5.4% 7.1% 8.4% 8.7%
35 - 39 2.3% 3.8% 4.3% 4.8% 5.5%
40 - 44 1.4% 2.5% 3.1% 3.9% 4.4%
45 - 49 1.1% 1.9% 2.7% 3.0% 3.7%
50 - 54 0.7% 1.3% 1.8% 2.0% 2.2%
55+ 0.5% 0.9% 1.1% 1.0% 1.1%
4th Year Returns:
5th Year Returns:
STATE OFFENDERS RELEASED FROM ADULT INSTITUTIONS, LOCAL FACILITIES, AND WORK RELEASE CENTERS. AGE AT TIME OF RELEASE.
DEPARTMENT OF PUBLIC SAFETY AND CORRECTIONS
PERCENT RETURNED WITHIN EACH RELEASE AGE GROUP (Based on Last Full Year's Returns)
RECIDIVISM IN ADULT CORRECTIONS
March 28, 2017
(TOTAL POPULATION - AGE)
1st Year Returns:
2nd Year Returns:
3rd Year Returns:
64

RECIDIVISM: RETURN TO CUSTODY FOLLOWING CONVICTION FOR A NEW FELONY OR TECHNICAL REVOCATION OF SUPERVISION AFTER HAVING BEEN
RELEASED FROM INCARCERATION THROUGH COMPLETED SENTENCE, RELEASED ON PAROLE, CONDITIONAL RELEASE, OR SPLIT PROBATION SENTENCE.
OFFENDERS RELEASED TO A DETAINER, RELEASED IN ERROR, DECEASED, OR TRANSFERRED TO ANOTHER JURISDICTION ARE NOT INCLUDED.
AN OFFENDER MAY BE RELEASED MULTIPLE TIMES BUT IS ONLY COUNTED ONCE PER RELEASE YEAR.
OFFENDERS ARE TRACKED FOR A PERIOD OF TIME FROM DATE OF RELEASE BASED ON THE YEAR OF RETURN :
12 months
24 months
36 months
48 months
60 months
4th Year Returns:
5th Year Returns:
DEPARTMENT OF PUBLIC SAFETY AND CORRECTIONS
March 28, 2017
RECIDIVISM IN ADULT CORRECTIONS
1st Year Returns:
2nd Year Returns:
3rd Year Returns:
0.0%
10.0%
20.0%
30.0%
40.0%
50.0%
60.0%
(2015) (2014) (2013) (2012) (2011)
1st Year 2nd Year 3rd Year 4th Year 5th Year
Total Population State Facilities Local Facilities Transitional Work Programs Impact Blue Walters
Parole Board Releases Sex Offenders Education Female P&P Completions
65

Department of Public Safety and Corrections
INCARCERATION ONLY : Admissions/Releases Comparison 1994-2015
admits releases net total admits releases net total admits releases net total admits releases net total admits releases net total admits releases net total
Jan 1092 850 242 1041 963 78 1133 956 177 1198 994 204 1256 1058 198 1434 1147 287
Feb 856 781 75 974 885 89 1115 926 189 1115 921 194 1226 1020 206 1139 1142 -3
Mar 1083 919 164 1168 1016 152 1183 1040 143 1362 991 371 1387 1081 306 1468 1181 287
Apr 923 861 62 1095 932 163 1139 997 142 1332 1036 296 1401 1085 316 1316 1194 122
May 1105 903 202 1061 912 149 1278 1088 190 1362 1015 347 1342 1123 219 1357 1152 205
Jun 1027 957 70 1091 1015 76 1000 967 33 1230 1025 205 1318 1054 264 1251 1192 59
Jul 1051 895 156 981 948 33 1070 1026 44 1304 1076 228 1398 1142 256 1197 1284 -87
Aug 938 870 68 1146 957 189 1074 974 100 1245 1063 182 1281 1124 157 1335 1289 46
Sep 1114 891 223 1182 925 257 1135 964 171 1386 1104 282 1290 1147 143 1413 1255 158
Oct 1093 892 201 1053 1059 -6 1280 987 293 1350 1060 290 1231 1143 88 1257 1293 -36
Nov 969 875 94 1003 925 78 1018 963 55 1097 1059 38 1262 1095 167 1185 1082 103
Dec 813 943 -130 833 990 -157 1105 949 156 1075 1151 -76 1236 1176 60 1009 1140 -131
TOTAL 12064 10637 1427 12628 11527 1101 13530 11837 1693 15056 12495 2561 15628 13248 2380 15361 14351 1010
admits releases net total admits releases net total admits releases net total admits releases net total admits releases net total admits releases net total
Jan 1410 1191 219 1419 1220 199 1374 1188 186 1367 1259 108 1454 1210 244 1428 1275 153
Feb 1470 1144 326 1305 1196 109 1237 1220 17 1447 1250 197 1219 1273 -54 1150 1246 -96
Mar 1411 1191 220 1411 1260 151 1360 1220 140 1382 1331 51 1582 1281 301 1500 1310 190
Apr 1178 1198 -20 1307 1234 73 1479 1202 277 1352 1221 131 1446 1266 180 1427 1279 148
May 1437 1252 185 1437 1212 225 1388 1251 137 1370 1211 159 1399 1316 83 1564 1269 295
Jun 1285 1265 20 1166 1203 -37 1146 1201 -55 1345 1308 37 1264 1311 -47 1368 1220 148
Jul 1298 1231 67 1247 1313 -66 1344 1465 -121 1401 1248 153 1265 1313 -48 1217 1298 -81
Aug 1453 1235 218 1395 1298 97 1403 1238 165 1294 1296 -2 1448 1262 186 1501 1279 222
Sep 1426 1161 265 1338 1179 159 1285 1203 82 1477 1245 232 1258 1209 49 815 1427 -612
Oct 1403 1294 109 1359 1276 83 1259 1251 8 1482 1401 81 1362 1342 20 1089 1306 -217
Nov 1222 1221 1 1163 1141 22 1154 1327 -173 1142 1221 -79 1309 1259 50 1081 1266 -185
Dec 1053 1197 -144 1026 1236 -210 1119 1288 -169 1074 1305 -231 1019 1359 -340 866 1190 -324
TOTAL 16046 14580 1466 15573 14768 805 15548 15054 494 16133 15296 837 16025 15401 624 15006 15365 -359
admits releases net total admits releases net total admits releases net total admits releases net total admits releases net total admits releases net total
Jan 1213 1241 -28 1347 1204 143 1468 1276 192 1413 1289 124 1469 1338 131 1593 1456 137
Feb 1171 1185 -14 1320 1184 136 1345 1242 103 1318 1210 108 1273 1249 24 1470 1377 93
Mar 1449 1221 228 1480 1309 171 1420 1246 174 1572 1248 324 1558 1346 212 1497 1440 57
Apr 1125 1280 -155 1353 1214 139 1423 1263 160 1441 1328 113 1422 1494 -72 1443 1423 20
May 1449 1263 186 1520 1232 288 1327 1194 133 1445 1224 221 1510 1565 -55 1495 1415 80
Jun 1303 1241 62 1300 1243 57 1362 1169 193 1386 1257 129 1391 1409 -18 1366 1428 -62
Jul 1120 1267 -147 1286 1150 136 1451 1241 210 1489 1266 223 1308 1438 -130 1349 1398 -49
Aug 1523 1232 291 1522 1283 239 1557 1317 240 1607 1242 365 1571 1367 204 1666 1430 236
Sep 1384 1245 139 1383 1215 168 1135 1231 -96 1597 1241 356 1668 1346 322 1661 1370 291
Oct 1392 1249 143 1548 1301 247 1587 1290 297 1499 1292 207 1510 1832 -322 1510 1492 18
Nov 1276 1202 74 1202 1305 -103 1099 1218 -119 1371 1339 32 1272 1421 -149 1338 1373 -35
Dec 996 1332 -336 1048 1235 -187 1121 1345 -224 1099 1278 -179 1235 1490 -255 1123 1416 -293
TOTAL 15401 14958 443 16309 14875 1434 16295 15032 1263 17237 15214 2023 17187 17295 -108 17511 17018 493
Totals
admits releases net total admits releases net total admits releases net total admits release net total admits release net total admits releases net total
Jan 1574 1423 151 1602 1450 152 1426 1469 -43 1365 1601 -236 1446 1347 99 30076 21090 8986
Feb 1572 1323 249 1337 1418 -81 1426 1421 5 1250 1461 -211 1302 1322 -20 27735 26074 1661
Mar 1672 1464 208 1369 1426 -57 1385 1467 -82 1668 1558 110 1395 1386 9 31367 27546 3821
Apr 1393 1410 -17 1510 1398 112 1456 1485 -29 1479 1550 -71 1314 1407 -93 29440 27350 2090
May 1687 1469 218 1562 1538 24 1467 1460 7 1297 1522 -225 1489 1424 65 30859 27586 3273
Jun 1386 1493 -107 1278 1472 -194 1258 1511 -253 1388 1606 -218 1304 1444 -140 20992 21337 -345
Jul 1317 1413 -96 1366 1572 -206 1459 1510 -51 1359 1439 -80 1337 1435 -98 21276 21562 -286
Aug 1515 1437 78 1560 1538 22 1431 1365 66 1493 1511 -18 1429 1375 54 23939 21330 2609
Sep 1486 1406 80 1511 1504 7 1521 1543 -22 1377 1355 22 1593 1400 193 22322 20880 1442
Oct 1571 1442 129 1586 1555 31 1442 1636 -194 1388 1419 -31 1389 1328 61 22987 22378 609
Nov 1298 1394 -96 1251 1394 -143 1118 1498 -380 1212 1380 -168 1156 1358 -202 19508 20959 -1451
Dec 1081 1448 -367 1121 1425 -304 1154 1607 -453 1155 1448 -293 1097 1314 -217 17290 21599 -4309
TOTAL 17552 17122 430 17053 17690 -637 16543 17972 -1429 16431 17850 -1419 16251 16540 -289 297791 279691 18100
2011
2000
1998 1999
2004
19971994
2005
1996
2002
2007 2008
2012 #
2006 2010
2015
1995
2001
2009
201620142013
2003
66 Date: 9/30/2017

600
700
800
900
1000
1100
1200
1300
1400
1500
19
94
19
95
19
96
19
97
19
98
19
99
20
00
20
01
20
02
20
03
20
04
20
05
20
06
20
07
20
08
20
09
20
10
# IN
MA
TE
S
YEAR
INCARCERATION ONLY: ADMISSIONS/RELEASES COMPARISON (Yearly Average)FOR 1994 - 2010
Actual Data Depicted Through December 31, 2010 Releases
Admissions
Date: 9/30/2017
67 Date:9/30/2017
0
200
400
600
800
1000
1200
1400
1600
1800
Jan 1
1
Jul 11
Jan 1
2
Jul 12
Jan 1
3
Jul 13
Jan 1
4
Jul 14
Jan 1
5
Jul 15
Jan 1
6
Jul 16
# IN
MA
TE
S
YEAR
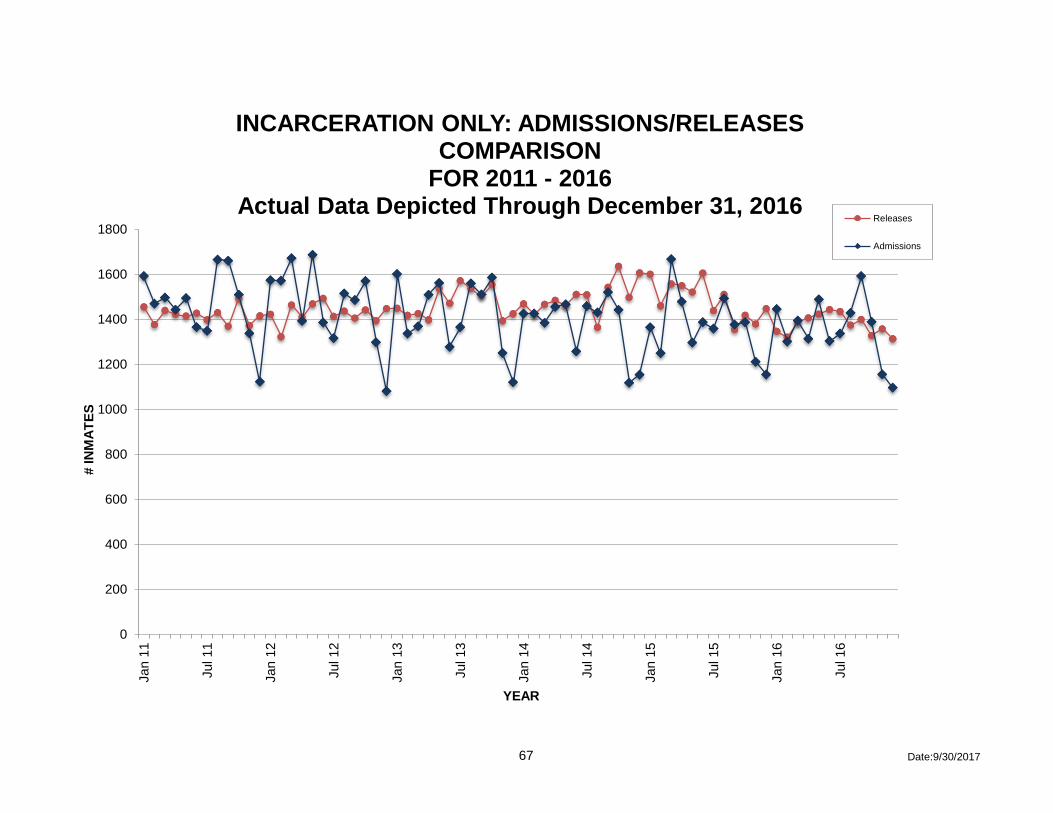
INCARCERATION ONLY: ADMISSIONS/RELEASES COMPARISON
FOR 2011 - 2016Actual Data Depicted Through December 31, 2016
Releases
Admissions

`
1994 1995 1996 1997 1998 1999 2000 2001 2002 2003
Violent 2553 2563 2567 2967 3318 4015 4563 4221 3991 3951
Property 8213 8279 8665 9391 9228 10037 9839 9664 9871 9963
Drug 9390 9289 9577 9848 10932 10520 10670 10329 11137 12208
All Others 2972 3238 3600 3969 3627 2983 2857 2921 2961 3198
Totals 23128 23369 24409 26175 27105 27555 27929 27135 27960 29320
2000
4000
6000
8000
10000
12000
14000
16000
18000
20000
22000
24000
26000
28000
30000
32000
# Offenders
Adult Admissions 1994-2003(Incarceration & Supervision)
Based Upon Most Serious Committment Crime
68 Date: 12/31/14
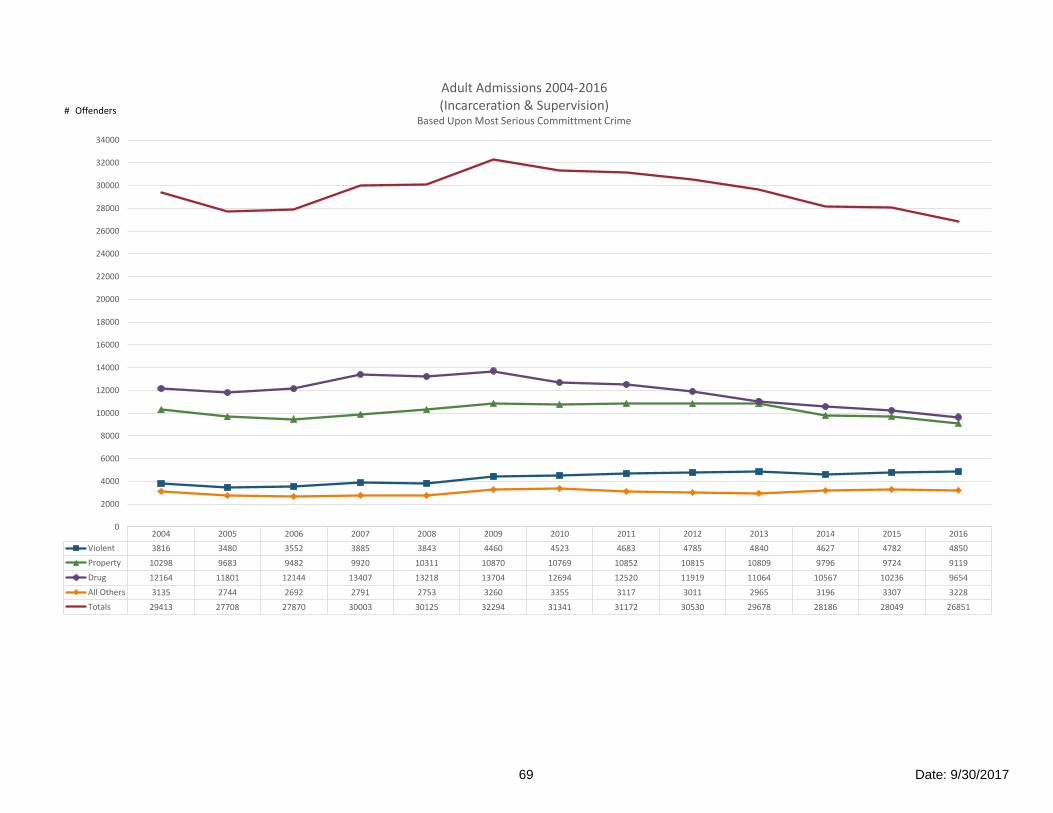
2004 2005 2006 2007 2008 2009 2010 2011 2012 2013 2014 2015 2016
Violent 3816 3480 3552 3885 3843 4460 4523 4683 4785 4840 4627 4782 4850
Property 10298 9683 9482 9920 10311 10870 10769 10852 10815 10809 9796 9724 9119
Drug 12164 11801 12144 13407 13218 13704 12694 12520 11919 11064 10567 10236 9654
All Others 3135 2744 2692 2791 2753 3260 3355 3117 3011 2965 3196 3307 3228
Totals 29413 27708 27870 30003 30125 32294 31341 31172 30530 29678 28186 28049 26851
0
2000
4000
6000
8000
10000
12000
14000
16000
18000
20000
22000
24000
26000
28000
30000
32000
34000
Adult Admissions 2004-2016(Incarceration & Supervision)
Based Upon Most Serious Committment Crime# Offenders
69 Date: 9/30/2017
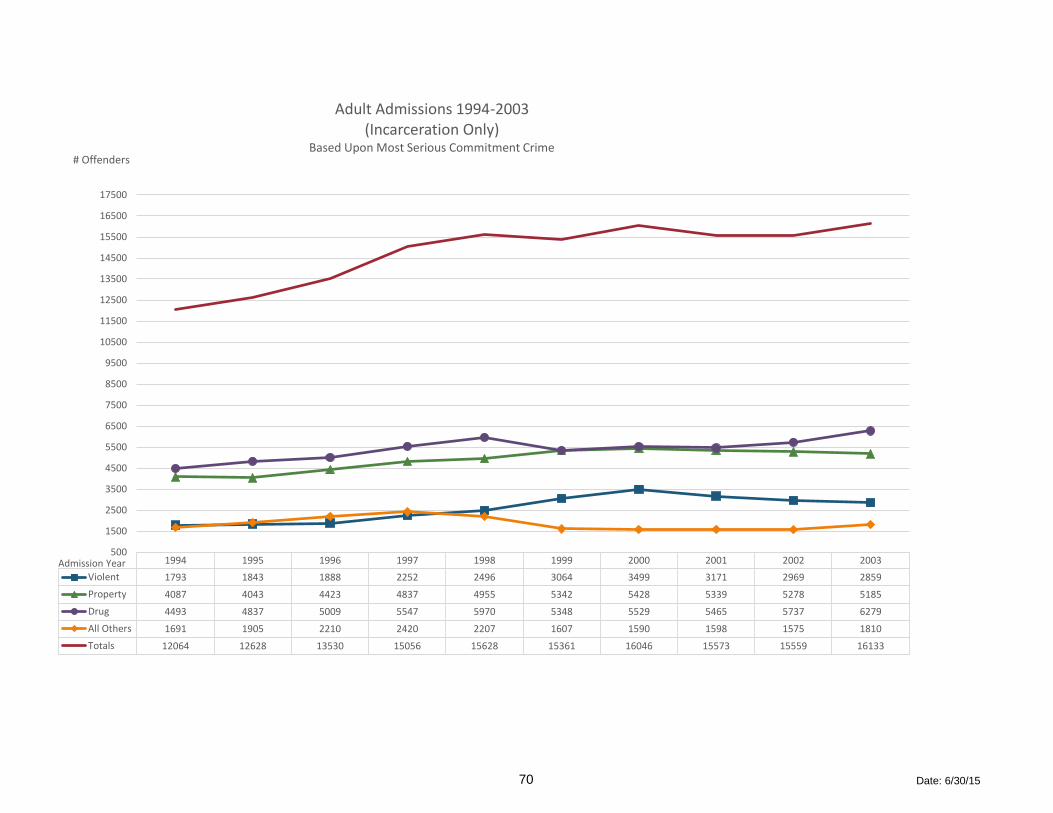
1994 1995 1996 1997 1998 1999 2000 2001 2002 2003
Violent 1793 1843 1888 2252 2496 3064 3499 3171 2969 2859
Property 4087 4043 4423 4837 4955 5342 5428 5339 5278 5185
Drug 4493 4837 5009 5547 5970 5348 5529 5465 5737 6279
All Others 1691 1905 2210 2420 2207 1607 1590 1598 1575 1810
Totals 12064 12628 13530 15056 15628 15361 16046 15573 15559 16133
500
1500
2500
3500
4500
5500
6500
7500
8500
9500
10500
11500
12500
13500
14500
15500
16500
17500
# Offenders
Admission Year
Adult Admissions 1994-2003 (Incarceration Only)
Based Upon Most Serious Commitment Crime
70 Date: 6/30/15

2004 2005 2006 2007 2008 2009 2010 2011 2012 2013 2014 2015 2016
Violent 2749 2385 2518 2799 2735 3080 3311 3339 3490 3468 3362 3447 3494
Property 5396 5176 5263 5469 5600 5761 5960 6306 6359 6329 5802 5829 5723
Drug 6120 5855 5968 6380 6296 6444 6060 5940 5834 5436 5330 5072 4952
All Others 1760 1590 1652 1661 1664 1952 1856 1923 1879 1812 2049 2084 2085
Totals 16025 15006 15401 16309 16295 17237 17187 17508 17562 17045 16543 16432 16254
0
2000
4000
6000
8000
10000
12000
14000
16000
18000
20000
Adult Admissions 2004-2016 (Incarceration Only)
Based Upon Most Serious Commitment Crime
# Offenders
71 Date: 9/30/2017
1994 1995 1996 1997 1998 1999 2000 2001 2002 2003
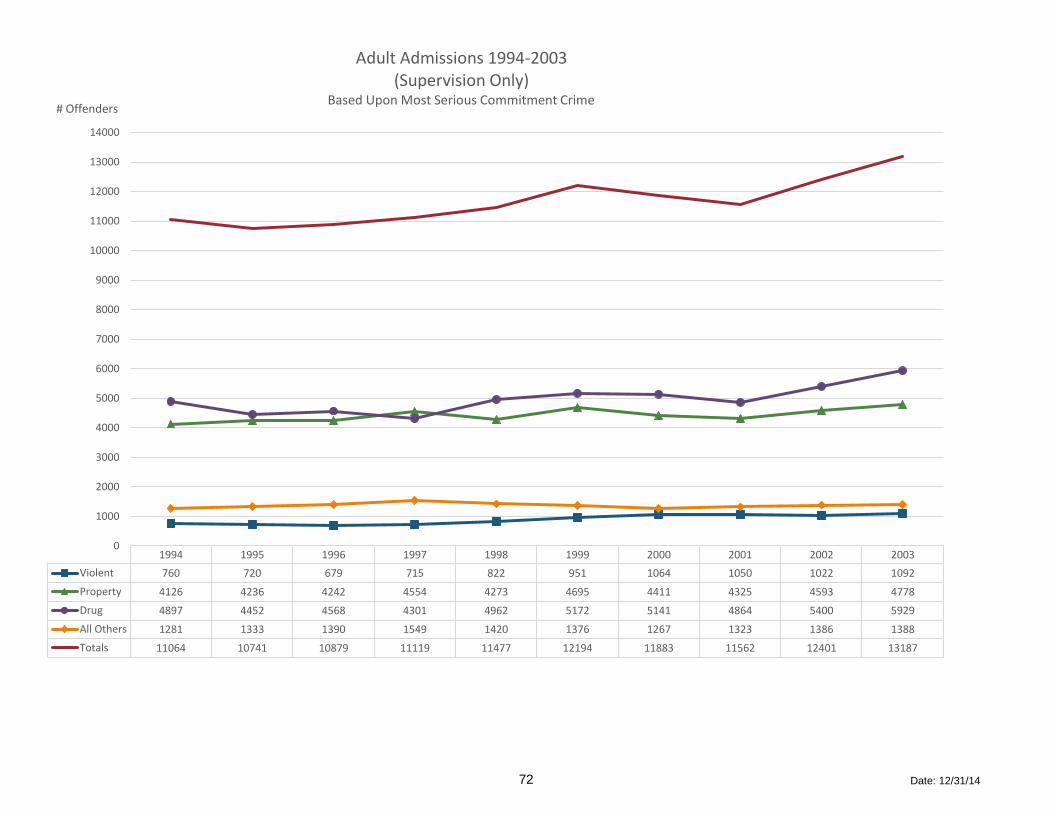
Violent 760 720 679 715 822 951 1064 1050 1022 1092
Property 4126 4236 4242 4554 4273 4695 4411 4325 4593 4778
Drug 4897 4452 4568 4301 4962 5172 5141 4864 5400 5929
All Others 1281 1333 1390 1549 1420 1376 1267 1323 1386 1388
Totals 11064 10741 10879 11119 11477 12194 11883 11562 12401 13187
0
1000
2000
3000
4000
5000
6000
7000
8000
9000
10000
11000
12000
13000
14000
# Offenders
Adult Admissions 1994-2003(Supervision Only)
Based Upon Most Serious Commitment Crime
72 Date: 12/31/14
2004 2005 2006 2007 2008 2009 2010 2011 2012 2013 2014 2015 2016
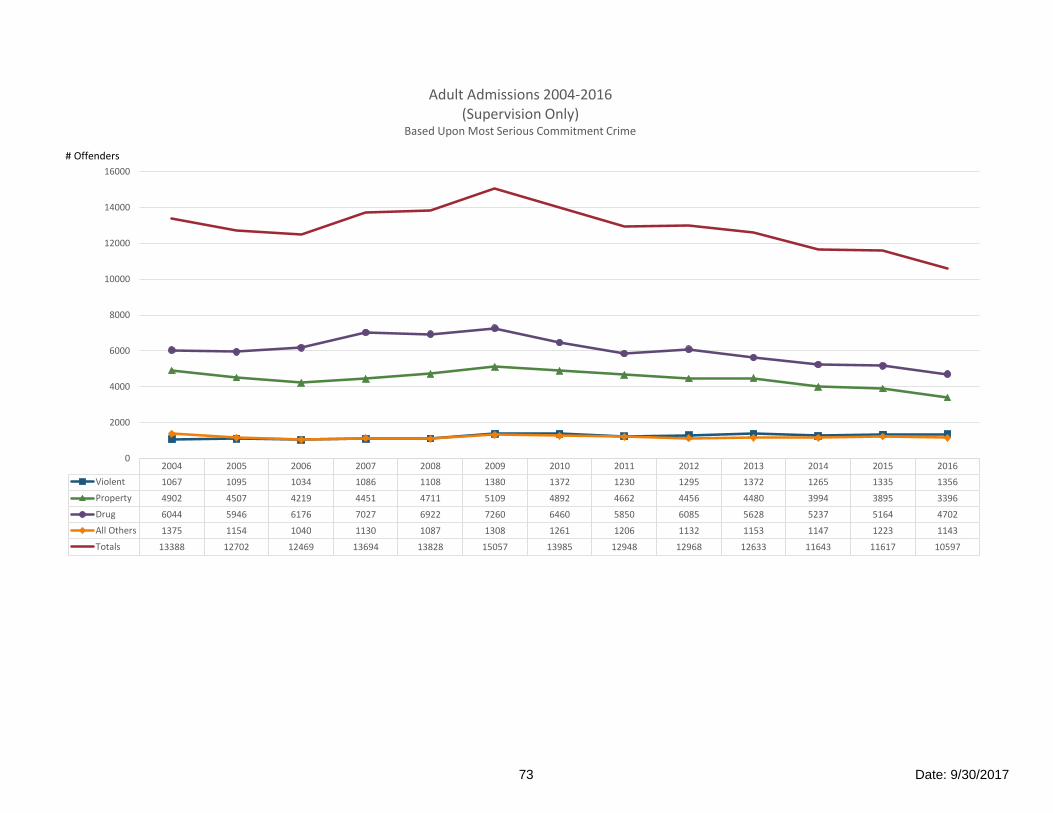
Violent 1067 1095 1034 1086 1108 1380 1372 1230 1295 1372 1265 1335 1356
Property 4902 4507 4219 4451 4711 5109 4892 4662 4456 4480 3994 3895 3396
Drug 6044 5946 6176 7027 6922 7260 6460 5850 6085 5628 5237 5164 4702
All Others 1375 1154 1040 1130 1087 1308 1261 1206 1132 1153 1147 1223 1143
Totals 13388 12702 12469 13694 13828 15057 13985 12948 12968 12633 11643 11617 10597
0
2000
4000
6000
8000
10000
12000
14000
16000
Adult Admissions 2004-2016(Supervision Only)
Based Upon Most Serious Commitment Crime
# Offenders
73 Date: 9/30/2017

1 of 7
1 2 3
Avg. Avg. Avg. Avg. % to Prob.
Total % of Lgth.* Lgth. Lgth. Lgth. % to Prob. New Rev. Rev. Rev. New
Admissions Total Inc Sent Prob Sent Par Sen Dim of Sent Inc. Supv. Fel NF Tech. Waiv Parole GTPS Fel.
Violent Crimes 2553 11% 18.57 4.37 13.67 10.32 70% 30% 1281 81 288 143 47% 82% 760
Property Crimes 8213 36% 4.86 3.35 5.18 4.62 50% 50% 1774 479 1285 549 44% 89% 4126
Drug Crimes 9390 41% 5.37 3.68 5.43 5.19 48% 52% 2094 662 1283 454 59% 90% 4897
All Others 2972 13% 5.59 3.28 4.30 4.25 57% 43% 960 261 308 162 47% 93% 1281
Grand Total 23128 7.19 3.56 7.13 6.07 52% 48% 6109 1483 3164 1308 50% 89% 11064
1 2 3
Avg. Avg. Avg. Avg. % to Prob.
Total % of Lgth.* Lgth. Lgth. Lgth. % to Prob. New Rev. Rev. Rev. New
Admissions Total Inc Sent Prob Sent Par Sen Dim of Sent Inc. Supv. Fel NF Tech. Waiv Parole GTPS Fel.
Violent Crimes 2563 11% 19.12 4.06 14.17 10.09 72% 28% 1256 85 355 147 48% 80% 720
Property Crimes 8279 35% 4.47 3.10 4.72 4.40 49% 51% 1684 445 1374 540 46% 89% 4236
Drug Crimes 9289 40% 5.25 3.44 5.80 5.10 52% 48% 2162 627 1546 502 60% 89% 4452
All Others 3238 14% 5.56 3.17 4.64 4.23 59% 41% 1063 225 398 219 50% 92% 1333
Grand Total 23369 7.07 3.31 7.56 5.89 54% 46% 6165 1382 3673 1408 52% 88% 10741
1 2 3
Avg. Avg. Avg. Avg. % to Prob.
Total % of Lgth.* Lgth. Lgth. Lgth. % to Prob. New Rev. Rev. Rev. New
Admissions Total Inc Sent Prob Sent Par Sen Dim of Sent Inc. Supv. Fel NF Tech. Waiv Parole GTPS Fel.
Violent Crimes 2567 11% 18.98 3.63 13.82 9.07 74% 26% 1232 101 372 183 45% 75% 679
Property Crimes 8665 35% 4.17 2.94 4.36 4.35 51% 49% 1738 427 1414 844 48% 89% 4242
Drug Crimes 9577 39% 5.00 3.24 5.97 5.03 52% 48% 2126 603 1569 711 58% 87% 4568
All Others 3600 15% 5.18 3.02 4.72 4.51 61% 39% 1248 233 398 331 50% 91% 1390
Grand Total 24409 6.71 3.12 6.99 5.59 55% 45% 6344 1364 3753 2069 52% 87% 10879
1 Crime category percentage of total admissions.
2 Percentage of admissions by crime category sentenced to incarceration.
3 Percentage of admissions by crime category sentenced to probation supervision.
* In the case of revocations due to new felony, the admission count may reflect the original commitment crime or the new felony,
depending on the sentence length. The longer sentence length determines which crime is counted.
** Based upon the number of persons sentenced to incarcerations and those sentenced to probation supervision.
DEPARTMENT OF PUBLIC SAFETY AND CORRECTIONS
Summary of Adult Admissions 1994 - 1996(Based upon the Most Serious Commitment Crime)
1996
Eligibilities**
Eligibilities**
1994
Incarceration
Incarceration
Incarceration
1995
Eligibilities**
74 Date: 12/31/2014

2 of 7
1 2 3
Avg. Avg. Avg. Avg. % to Prob.
Total % of Lgth.* Lgth. Lgth. Lgth. % to Prob. New Rev. Rev. Rev. New
Admissions Total Inc Sent Prob Sent Par Sen Dim of Sent Inc. Supv. Fel NF Tech. Waiv Parole GTPS Fel.
Violent Crimes 2967 11% 17.26 3.23 12.08 8.38 76% 24% 1459 99 428 266 36% 63% 715
Property Crimes 9391 36% 4.00 2.74 4.39 4.08 52% 48% 1927 366 1622 922 46% 81% 4554
Drug Crimes 9848 38% 5.12 3.10 5.91 4.91 56% 44% 2092 553 1904 998 48% 74% 4301
All Others 3969 15% 5.01 2.99 4.49 4.27 61% 39% 1288 210 493 429 46% 81% 1549
Grand Total 26175 6.56 2.95 6.55 5.29 58% 42% 6766 1228 4447 2615 45% 76% 11119
1 2 3
Avg. Avg. Avg. Avg. % to Prob.
Total % of Lgth.* Lgth. Lgth. Lgth. % to Prob. New Rev. Rev. Rev. New
Admissions Total Inc Sent Prob Sent Par Sen Dim of Sent Inc. Supv. Fel NF Tech. Waiv Parole GTPS Fel.
Violent Crimes 3318 12% 14.93 3.16 9.86 8.38 75% 25% 1425 142 539 390 32% 58% 822
Property Crimes 9228 34% 3.71 2.80 4.36 3.95 54% 46% 1760 352 1674 1169 42% 73% 4273
Drug Crimes 10932 40% 4.92 3.00 5.47 4.81 55% 45% 2561 474 1768 1167 41% 62% 4962
All Others 3627 13% 5.18 3.35 4.45 4.32 61% 39% 1252 123 448 384 44% 71% 1420
Grand Total 27105 6.17 2.98 5.86 5.20 58% 42% 6998 1091 4429 3110 40% 66% 11477
1 2 3
Avg. Avg. Avg. Avg. % to Prob.
Total % of Lgth.* Lgth. Lgth. Lgth. % to Prob. New Rev. Rev. Rev. New
Admissions Total Inc Sent Prob Sent Par Sen Dim of Sent Inc. Supv. Fel NF Tech. Waiv Parole GTPS Fel.
Violent Crimes 4015 15% 13.86 1.31 9.18 8.27 76% 24% 1474 293 663 634 38% 75% 951
Property Crimes 10037 36% 3.73 2.82 4.18 3.67 53% 47% 1804 421 1735 1382 46% 84% 4695
Drug Crimes 10520 38% 4.76 2.99 5.03 4.50 51% 49% 2261 340 1696 1051 50% 78% 5172
All Others 2983 11% 4.20 3.09 4.39 4.16 54% 46% 1005 41 314 247 56% 85% 1376
Grand Total 27555 6.16 2.96 5.40 4.89 56% 44% 6544 1095 4408 3314 47% 80% 12194
1 Crime category percentage of total admissions.
2 Percentage of admissions by crime category sentenced to incarceration.
3 Percentage of admissions by crime category sentenced to probation supervision.
* In the case of revocations due to new felony, the admission count may reflect the original commitment crime or the new felony,
depending on the sentence length. The longer sentence length determines which crime is counted.
** Based upon the number of persons sentenced to incarceration and those sentenced to probation supervision.
Eligibilities**
Summary of Adult Admissions 1997 - 1999
1997
DEPARTMENT OF PUBLIC SAFETY AND CORRECTIONS
(Based upon the Most Serious Commitment Crime)
Incarceration
Eligibilities**
1999
Incarceration
Incarceration
1998
Eligibilities**
75 Date: 12/31/2014

3 of 7
1 2 3
Avg. Avg. Avg. Avg. % to Prob.
Total % of Lgth.* Lgth. Lgth. Lgth. % to Prob. New Rev. Rev. Rev. New
Admissions Total Inc Sent Prob Sent Par Sen Dim of Sent Inc. Supv. Fel NF Tech. Waiv Parole GTPS Fel.
Violent Crimes 4563 16% 13.10 4.22 8.06 8.41 77% 23% 1677 285 796 741 37% 81% 1064
Property Crimes 9839 35% 4.23 3.10 4.31 3.95 55% 45% 1769 427 1770 1462 37% 90% 4411
Drug Crimes 10670 38% 4.92 3.14 5.07 4.45 52% 48% 2390 388 1652 1091 44% 88% 5149
All Others 2857 10% 3.84 3.22 3.70 3.80 56% 44% 924 58 341 267 51% 85% 1267
Grand Total 27929 6.37 3.23 5.26 5.02 57% 43% 6760 1158 4559 3561 41% 87% 11891
1 2 3
Avg. Avg. Avg. Avg. % to Prob.
Total % of Lgth.* Lgth. Lgth. Lgth. % to Prob. New Rev. Rev. Rev. New
Admissions Total Inc Sent Prob Sent Par Sen Dim of Sent Inc. Supv. Fel NF Tech. Waiv Parole GTPS Fel.
Violent Crimes 4221 16% 12.70 3.47 8.36 8.61 75% 25% 1564 233 740 634 36% 79% 1050
Property Crimes 9664 36% 4.23 3.07 4.26 4.02 55% 45% 1722 415 1689 1513 34% 91% 4325
Drug Crimes 10329 38% 4.75 3.23 5.00 4.49 53% 47% 2372 367 1573 1153 41% 89% 4864
All Others 2921 11% 3.98 3.24 4.21 3.94 55% 45% 858 49 386 305 50% 80% 1323
Grand Total 27135 6.11 3.19 5.31 5.03 57% 43% 6516 1064 4388 3605 38% 87% 11562
1 2 3
2002 Avg. Avg. Avg. Avg. % to Prob.
Total % of Lgth.* Lgth. Lgth. Lgth. % to Prob. New Rev. Rev. Rev. New
Admissions Total Inc Sent Prob Sent Par Sen Dim of Sent Inc. Supv. Fel NF Tech. Waiv Parole GTPS Fel.
Violent Crimes 3991 14% 12.59 3.27 8.25 8.20 74% 26% 1501 199 684 585 36% 79% 1022
Property Crimes 9871 35% 4.06 3.02 4.24 3.91 53% 47% 1814 370 1690 1404 38% 92% 4593
Drug Crimes 11137 38% 4.50 3.11 4.67 4.23 52% 48% 2480 345 1698 1214 42% 90% 5400
All Others 2961 11% 4.25 3.20 4.43 4.09 53% 47% 854 62 405 254 53% 80% 1386
Grand Total 27960 5.87 3.10 5.10 4.79 56% 44% 6649 976 4477 3457 41% 88% 12401
1 Crime category percentage of total admissions.
2 Percentage of admissions by crime category sentenced to incarceration.
3 Percentage of admissions by crime category sentenced to probation supervision.
* In the case of revocations due to new felony, the admission count may reflect the original commitment crime or the new felony,
depending on the sentence length. The longer sentence length determines which crime is counted.
** Based upon the number of persons sentenced to incarceration and those sentenced to probation supervision.
DEPARTMENT OF PUBLIC SAFETY AND CORRECTIONS
2000
Eligibilities**
Incarceration
Eligibilities**
Incarceration
Incarceration
2001
Eligibilities**
Summary of Adult Admissions 2000 - 2002(Based upon the Most Serious Commitment Crime)
76 Date: 12/31/2014
4 of 7
1 2 3
Avg. Avg. Avg. Avg. % to Prob.
Total % of Lgth.* Lgth. Lgth. Lgth. % to Prob. New Rev. Rev. Rev. NewAdmissions Total Inc Sent Prob Sent Par Sen Dim of Sent Inc. Supv. Fel NF Tech. Waiv Parole GTPS Fel.
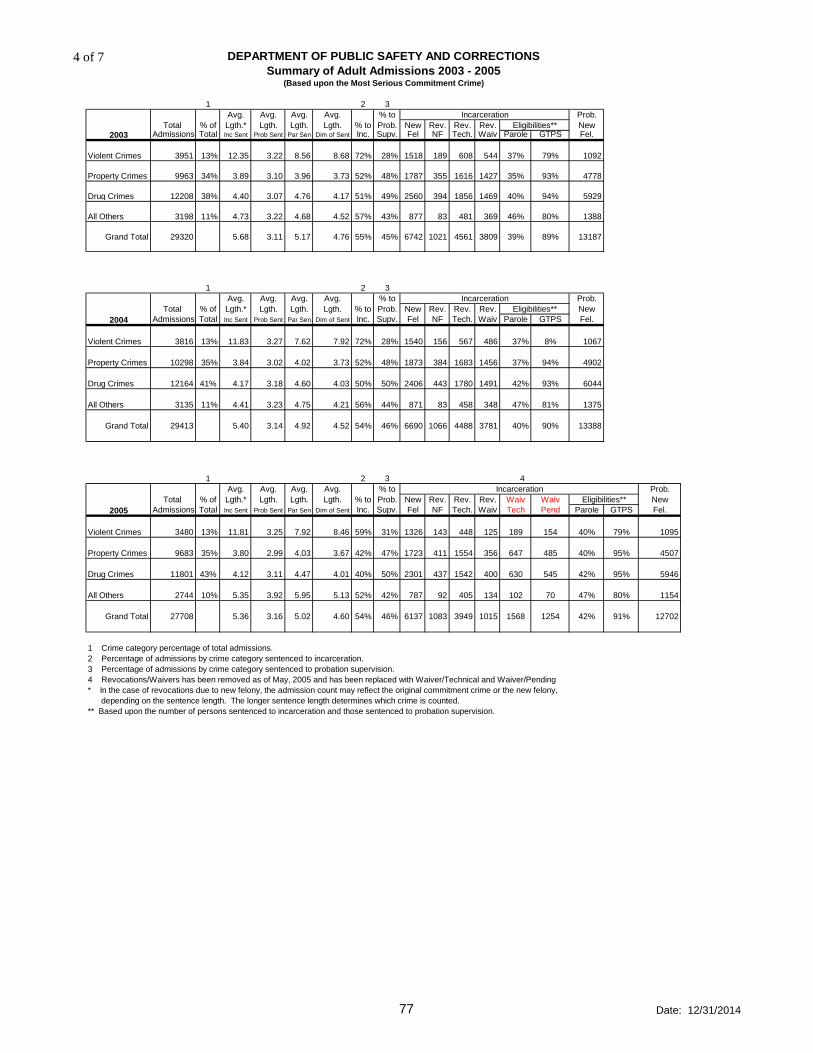
Violent Crimes 3951 13% 12.35 3.22 8.56 8.68 72% 28% 1518 189 608 544 37% 79% 1092
Property Crimes 9963 34% 3.89 3.10 3.96 3.73 52% 48% 1787 355 1616 1427 35% 93% 4778
Drug Crimes 12208 38% 4.40 3.07 4.76 4.17 51% 49% 2560 394 1856 1469 40% 94% 5929
All Others 3198 11% 4.73 3.22 4.68 4.52 57% 43% 877 83 481 369 46% 80% 1388
Grand Total 29320 5.68 3.11 5.17 4.76 55% 45% 6742 1021 4561 3809 39% 89% 13187
1 2 3
Avg. Avg. Avg. Avg. % to Prob.
Total % of Lgth.* Lgth. Lgth. Lgth. % to Prob. New Rev. Rev. Rev. New
Admissions Total Inc Sent Prob Sent Par Sen Dim of Sent Inc. Supv. Fel NF Tech. Waiv Parole GTPS Fel.
Violent Crimes 3816 13% 11.83 3.27 7.62 7.92 72% 28% 1540 156 567 486 37% 8% 1067
Property Crimes 10298 35% 3.84 3.02 4.02 3.73 52% 48% 1873 384 1683 1456 37% 94% 4902
Drug Crimes 12164 4.17 3.18 4.60 4.03 50% 50% 2406 443 1780 1491 42% 93% 6044
All Others 3135 11% 4.41 3.23 4.75 4.21 56% 44% 871 83 458 348 47% 81% 1375
Grand Total 29413 5.40 3.14 4.92 4.52 54% 46% 6690 1066 4488 3781 40% 90% 13388
1 2 3
Avg. Avg. Avg. Avg. % to Prob.
Total % of Lgth.* Lgth. Lgth. Lgth. % to Prob. New Rev. Rev. Rev. Waiv Waiv New
Admissions Total Inc Sent Prob Sent Par Sen Dim of Sent Inc. Supv. Fel NF Tech. Waiv Tech Pend Parole GTPS Fel.
Violent Crimes 3480 13% 11.81 3.25 7.92 8.46 59% 31% 1326 143 448 125 189 154 40% 79% 1095
Property Crimes 9683 35% 3.80 2.99 4.03 3.67 42% 47% 1723 411 1554 356 647 485 40% 95% 4507
Drug Crimes 11801 4.12 3.11 4.47 4.01 40% 50% 2301 437 1542 400 630 545 42% 95% 5946
All Others 2744 10% 5.35 3.92 5.95 5.13 52% 42% 787 92 405 134 102 70 47% 80% 1154
Grand Total 27708 5.36 3.16 5.02 4.60 54% 46% 6137 1083 3949 1015 1568 1254 42% 91% 12702
1 Crime category percentage of total admissions.
2 Percentage of admissions by crime category sentenced to incarceration.
3 Percentage of admissions by crime category sentenced to probation supervision.
4 Revocations/Waivers has been removed as of May, 2005 and has been replaced with Waiver/Technical and Waiver/Pending
* In the case of revocations due to new felony, the admission count may reflect the original commitment crime or the new felony,
depending on the sentence length. The longer sentence length determines which crime is counted.
** Based upon the number of persons sentenced to incarceration and those sentenced to probation supervision.
DEPARTMENT OF PUBLIC SAFETY AND CORRECTIONS
Incarceration
Summary of Adult Admissions 2003 - 2005(Based upon the Most Serious Commitment Crime)
43%
41%
2003
Eligibilities**
2005
Incarceration
Eligibilities**
2004
Eligibilities**
4
Incarceration
77 Date: 12/31/2014

5 of 7
1 2 3
Avg. Avg. Avg. Avg. % to Prob.
Total % of Lgth.* Lgth. Lgth. Lgth. % to Prob. New Rev. Rev. Waiv Waiv Inc. NewAdmissions Total Inc Sent Prob Sent Par Sen Dim of Sent Inc. Supv. Fel NF Tech. Tech Pend Total Parole GTPS Fel.
Violent Crimes 3552 13% 12.35 3.37 8.66 8.53 58% 29% 1382 164 516 174 282 2518 40% 76% 1034
Property Crimes 9482 34% 4.58 3.21 4.38 4.33 39% 44% 1848 416 1461 592 946 5263 33% 92% 4219
Drug Crimes 12144 4.88 3.30 4.87 4.61 37% 51% 2486 480 1547 548 907 5968 37% 94% 6176
All Others 2692 10% 5.31 3.37 5.15 4.87 49% 39% 871 83 376 145 177 1652 43% 79% 1040
Grand Total 27870 6.05 3.28 5.42 5.08 55% 45% 6587 1143 3900 1459 2312 15401 37% 89% 12469
1 2 3
Avg. Avg. Avg. Avg. % to Prob.
Total % of Lgth.* Lgth. Lgth. Lgth. % to Prob. New Rev. Rev. Waiv Waiv Inc. New
Admissions Total Inc Sent Prob Sent Par Sen Dim of Sent Inc. Supv. Fel NF Tech. Tech Pend Total Parole GTPS Fel.
Violent Crimes 3885 13% 11.59 3.35 8.22 8.18 59% 28% 1559 215 537 169 319 2799 38% 76% 1086
Property Crimes 9920 33% 4.50 3.27 4.29 4.29 40% 45% 2102 403 1481 252 1231 5469 36% 92% 4451
Drug Crimes 13407 4.81 3.25 4.70 4.60 37% 52% 2855 496 1582 280 1167 6380 39% 93% 7027
All Others 2791 9% 5.24 3.39 5.11 4.73 50% 40% 965 96 336 87 177 1661 47% 79% 1130
Grand Total 30003 5.91 3.27 5.22 5.04 54% 46% 7481 1210 3936 788 2894 16309 39% 89% 13694
1 2 3
Avg. Avg. Avg. Avg. % to Prob.
Total % of Lgth.* Lgth. Lgth. Lgth. % to Prob. New Rev. Rev. Waiv Waiv Inc. New
Admissions Total Inc Sent Prob Sent Par Sen Dim of Sent Inc. Supv. Fel NF Tech. Tech Pend Total Parole GTPS Fel.
Violent Crimes 3843 13% 11.86 3.32 8.00 8.18 60% 29% 1629 185 473 131 317 2735 41% 77% 1108
Property Crimes 10311 34% 4.42 3.23 4.29 4.26 41% 46% 2243 502 1437 270 1148 5600 39% 92% 4711
Drug Crimes 13218 4.98 3.20 4.81 4.70 38% 52% 2882 510 1599 212 1093 6296 42% 94% 6922
All Others 2753 9% 5.81 3.26 4.85 4.88 50% 40% 1032 75 282 82 193 1664 45% 80% 1089
Grand Total 30125 6.03 3.23 5.18 5.07 54% 46% 7786 1272 3791 695 2751 16295 41% 89% 13830
1 Crime category percentage of total admissions.
2 Percentage of admissions by crime category sentenced to incarceration.
3 Percentage of admissions by crime category sentenced to probation supervision.
4 Revocations/Waivers has been removed as of May, 2005 and has been replaced with Waiver/Technical and Waiver/Pending
* In the case of revocations due to new felony, the admission count may reflect the original commitment crime or the new felony,
depending on the sentence length. The longer sentence length determines which crime is counted.
** Based upon the number of persons sentenced to incarceration and those sentenced to probation supervision.
44%
DEPARTMENT OF PUBLIC SAFETY AND CORRECTIONS
Summary of Adult Admissions 2006 - 2008(Based upon the Most Serious Commitment Crime)
2006 * **
Eligibilities**
45%
2007 * **
Incarceration
4
44%
4
Eligibilities**
Incarceration
4
2008 * **
Incarceration
Eligibilities**
78 Date: 12/31/2014

6 of 7
1 2 3
Avg. Avg. Avg. Avg. % to Prob.
Total % of Lgth.* Lgth. Lgth. Lgth. % to Prob. New Rev. Rev. Waiv Waiv Inc. NewAdmissions Total Inc Sent Prob Sent Par Sen Dim of Sent Inc. Supv. Fel NF Tech. Tech Pend Total Parole GTPS Fel.
Violent Crimes 4460 14% 10.15 3.38 8.44 8.61 61% 31% 1987 237 502 96 258 3080 42% 76% 1380
Property Crimes 10870 34% 4.60 3.29 4.51 4.49 41% 47% 2325 547 1563 202 1124 5761 40% 93% 5109
Drug Crimes 13704 5.05 3.29 4.70 4.81 38% 53% 3019 570 1684 147 1024 6444 40% 95% 7260
All Others 3260 10% 4.96 3.28 4.64 4.52 53% 40% 1350 77 315 58 152 1952 46% 80% 1308
Grand Total 32294 5.80 3.30 5.31 5.25 53% 47% 8681 1431 4064 503 2558 17237 41% 89% 15057
1 2 3
Avg. Avg. Avg. Avg. % to Prob.
Total % of Lgth.* Lgth. Lgth. Lgth. % to Prob. New Rev. Rev. Waiv Waiv Inc. New
Admissions Total Inc Sent Prob Sent Par Sen Dim of Sent Inc. Supv. Fel NF Tech. Tech Pend Total Parole GTPS Fel.
Violent Crimes 4613 15% 10.25 3.67 8.20 8.65 62% 30% 2102 251 526 19 343 3241 46% 79% 1372
Property Crimes 10831 35% 4.78 3.38 4.60 4.67 37% 45% 2587 558 1469 144 1181 5939 44% 93% 4892
Drug Crimes 12541 5.32 3.38 4.84 5.12 39% 52% 2942 576 1421 165 977 6081 43% 95% 6460
All Others 3187 10% 5.13 3.27 4.45 4.68 54% 40% 1379 58 273 89 127 1926 47% 79% 1261
Grand Total 31172 6.07 3.41 5.40 5.51 55% 45% 9010 1443 3689 417 2628 17187 44% 90% 13985
1 2 3
Avg. Avg. Avg. Avg. % to Prob.
Total % of Lgth.* Lgth. Lgth. Lgth. % to Prob. New Rev. Rev. Waiv Waiv Inc. New
Admissions Total Inc Sent Prob Sent Par Sen Dim of Sent Inc. Supv. Fel NF Tech. Tech Pend Total Parole GTPS Fel.
Violent Crimes 4568 15% 10.91 3.62 8.92 8.90 62% 27% 2083 284 448 97 426 3338 44% 77% 1230
Property Crimes 10967 36% 4.58 3.37 4.67 4.50 43% 43% 2613 660 1490 185 1357 6305 44% 93% 4662
Drug Crimes 11791 5.11 3.33 4.90 4.90 40% 50% 2801 547 1422 136 1035 5941 44% 94% 5850
All Others 3130 10% 5.18 3.25 4.76 4.70 56% 39% 1426 75 266 27 130 1924 47% 80% 1206
Grand Total 30456 6.04 3.37 5.58 5.39 57% 43% 8923 1566 3626 445 2948 17508 44% 89% 12948
1 Crime category percentage of total admissions.
2 Percentage of admissions by crime category sentenced to incarceration.
3 Percentage of admissions by crime category sentenced to probation supervision.
4 Revocations/Waivers has been removed as of May, 2005 and has been replaced with Waiver/Technical and Waiver/Pending
* In the case of revocations due to new felony, the admission count may reflect the original commitment crime or the new felony,
depending on the sentence length. The longer sentence length determines which crime is counted.
** Based upon the number of persons sentenced to incarceration and those sentenced to probation supervision.
40%
2010 * **
39%
4
2011 * **
Incarceration
Eligibilities**
Incarceration
Eligibilities**
DEPARTMENT OF PUBLIC SAFETY AND CORRECTIONS
Summary of Adult Admissions 2009 - 2011(Based upon the Most Serious Commitment Crime)
4
2009 * **
Incarceration
Eligibilities**
42%
4
79 Date: 12/31/2014

7 of 7
1 2 3
Avg. Avg. Avg. Avg. % to Prob.
Total % of Lgth.* Lgth. Lgth. Lgth. % to Prob. New Rev. Rev. Waiv Waiv Inc. NewAdmissions Total Inc Sent Prob Sent Par Sen Dim of Sent Inc. Supv. Fel NF Tech. Tech Pend Total Parole GTPS Fel.
Violent Crimes 4785 16% 9.37 3.59 8.02 8.15 62% 27% 2230 262 488 80 430 3490 43% 79% 1295
Property Crimes 10815 35% 4.58 3.33 4.58 4.55 45% 41% 2784 635 1420 213 1307 6359 39% 94% 4456
Drug Crimes 11919 5.16 3.36 4.88 5.00 39% 51% 2856 571 1278 147 982 5834 40% 97% 6085
All Others 3011 10% 5.16 3.30 4.58 4.53 56% 38% 1371 65 243 39 161 1879 42% 82% 1132
Grand Total 30530 5.79 3.37 5.42 5.34 58% 42% 9241 1533 3429 479 2880 17562 40% 90% 12968
1 2 3
Avg. Avg. Avg. Avg. % to Prob.
Total % of Lgth.* Lgth. Lgth. Lgth. % to Prob. New Rev. Rev. Waiv Waiv Inc. New
Admissions Total Inc Sent Prob Sent Par Sen Dim of Sent Inc. Supv. Fel NF Tech. Tech Pend Total Parole GTPS Fel.
Violent Crimes 16% 9.21 3.54 7.18 7.75 59% 28% 2090 230 536 109 503 3468 40% 80% 1372
Property Crimes 36% 4.62 3.34 4.53 4.58 43% 41% 2564 547 1492 285 1441 6329 39% 94% 4480
Drug Crimes 5.07 3.32 4.70 4.96 38% 51% 2497 481 1197 216 1045 5436 38% 97% 5628
All Others 10% 5.23 3.34 4.88 4.60 54% 39% 1284 54 267 45 162 1812 44% 79% 1153
Grand Total 29678 5.76 3.35 5.17 5.28 57% 43% 8435 1312 3492 655 3151 17045 39% 90% 12633
1 2 3
Avg. Avg. Avg. Avg. % to Prob.
Total % of Lgth.* Lgth. Lgth. Lgth. % to Prob. New Rev. Rev. Waiv Waiv Inc. New
Admissions Total Inc Sent Prob Sent Par Sen Dim of Sent Inc. Supv. Fel NF Tech. Tech Pend Total Parole GTPS Fel.
Violent Crimes 4627 16% 9.25 3.44 7.58 7.71 59% 27% 1988 273 478 90 533 3362 40% 80% 1265
Property Crimes 9796 35% 4.62 3.22 4.61 4.57 42% 41% 2165 550 1406 244 1437 5802 39% 97% 3994
Drug Crimes 10567 5.08 3.35 4.67 4.98 38% 50% 2411 470 1185 187 1077 5330 39% 97% 5237
All Others 3196 11% 5.21 3.31 5.08 4.73 56% 36% 1484 60 240 63 202 2049 35% 76% 1147
Grand Total 28186 5.78 3.35 5.31 5.29 59% 41% 8048 1353 3309 584 3249 16543 39% 91% 11643
1 2 3
Avg. Avg. Avg. Avg. % to Prob.
Total % of Lgth.* Lgth. Lgth. Lgth. % to Prob. New Rev. Rev. Waiv Waiv Inc. New
Admissions Total Inc Sent Prob Sent Par Sen Dim of Sent Inc. Supv. Fel NF Tech. Tech Pend Total Parole GTPS Fel.
Violent Crimes 4782 17% 9.14 3.88 7.83 7.71 59% 28% 2087 281 477 110 492 3447 37% 79% 1335
Property Crimes 9724 35% 4.83 3.32 4.61 4.78 43% 40% 2359 618 1249 248 1355 5829 37% 97% 3895
Drug Crimes 10236 5.20 3.33 4.81 5.03 38% 50% 2325 500 1111 184 952 5072 37% 97% 5164
All Others 3307 12% 5.13 3.35 5.24 4.61 56% 37% 1563 72 225 39 185 2084 33% 78% 1223
Grand Total 28049 5.89 3.39 5.44 5.38 59% 41% 8334 1471 3062 581 2984 16432 36% 91% 11617
1 Crime category percentage of total admissions.
2 Percentage of admissions by crime category sentenced to incarceration.
3 Percentage of admissions by crime category sentenced to probation supervision.
4 Revocations/Waivers has been removed as of May, 2005 and has been replaced with Waiver/Technical and Waiver/Pending
* In the case of revocations due to new felony, the admission count may reflect the original commitment crime or the new felony,
depending on the sentence length. The longer sentence length determines which crime is counted.
** Based upon the number of persons sentenced to incarceration and those sentenced to probation supervision.
# 241 unprocessed custody admission records have been proportionally applied to the incarceration totals.
36%
4840
10809
4
2015
Incarceration
Eligibilities**
37%
4
2014
Incarceration
Eligibilities**
37%
2965
11064
4
2013 # * **
Incarceration
Eligibilities**
Eligibilities**
39%
DEPARTMENT OF PUBLIC SAFETY AND CORRECTIONS
Summary of Adult Admissions 2012 - 2015(Based upon the Most Serious Commitment Crime)
2012 # * **
Incarceration
4
80 Date: 06/30/2017

1 2 3
Avg. Avg. Avg. Avg. % to Prob.
Total % of Lgth.* Lgth. Lgth. Lgth. % to Prob. New Rev. Rev. Waiv Waiv Inc. NewAdmissions Total Inc Sent Prob Sent Par Sen Dim of Sent Inc. Supv. Fel NF Tech. Tech Pend Total Parole GTPS Fel.
Violent Crimes 4850 18% 8.28 3.53 6.97 7.13 58% 28% 2058 275 486 99 576 3494 41% 81% 1356
Property Crimes 9119 34% 4.57 3.51 4.69 4.53 44% 37% 2144 600 1237 234 1508 5723 43% 97% 3396
Drug Crimes 9654 5.10 3.28 4.96 4.98 39% 49% 2172 520 1055 173 1032 4952 44% 97% 4702
All Others 3228 12% 4.97 3.20 5.08 4.49 57% 35% 1521 75 258 37 194 2085 38% 79% 1143
Grand Total 26851 5.58 3.38 5.30 5.17 61% 39% 7895 1470 3036 543 3310 16254 42% 91% 10597
1 Crime category percentage of total admissions.
2 Percentage of admissions by crime category sentenced to incarceration.
3 Percentage of admissions by crime category sentenced to probation supervision.
4 Revocations/Waivers has been removed as of May, 2005 and has been replaced with Waiver/Technical and Waiver/Pending
* In the case of revocations due to new felony, the admission count may reflect the original commitment crime or the new felony,
depending on the sentence length. The longer sentence length determines which crime is counted.
** Based upon the number of persons sentenced to incarceration and those sentenced to probation supervision.
# 241 unprocessed custody admission records have been proportionally applied to the incarceration totals.
36%
DEPARTMENT OF PUBLIC SAFETY AND CORRECTIONS
Summary of Adult Admissions 2016(Based upon the Most Serious Commitment Crime)
4
2016
Incarceration
Eligibilities**
Date: 09/30/2017

1 of 7
Avg. * Avg.*Total Length of Time
1994 Releases Sent. (Yrs.) Served (Yrs.)
Violent Crimes 2305 9.5 4.6 71.0% 5.9% 2.1% 10.8% 10.2%
Property Crimes 3690 5.2 2.3 71.8% 0.2% 3.4% 12.6% 12.0%
Drug Crimes 3763 5.9 2.9 61.8% 0.1% 2.6% 22.8% 12.7%
All Others 879 4.9 2.3 75.9% 0.1% 1.9% 7.4% 14.7%
Grand Total 10637 6.4 3.0 68.4% 1.4% 2.7% 15.4% 12.1%
Avg. * Avg.*
Total Length of Time1995 Releases Sent. (Yrs.) Served (Yrs.)
Violent Crimes 2417 9.2 4.5 72.7% 3.6% 1.8% 12.2% 9.6%
Property Crimes 3827 4.8 2.3 70.4% 0.1% 3.5% 13.2% 12.8%
Drug Crimes 4296 5.5 2.8 62.9% 0.0% 2.7% 21.8% 12.6%
All Others 987 4.9 2.1 73.5% 0.1% 2.8% 6.4% 17.2%
Grand Total 11527 6.0 2.9 68.4% 0.8% 2.8% 15.6% 12.4%
Avg.* Avg.*Total Length of Time
1996 Releases Sent. (Yrs.) Served (Yrs.)
Violent Crimes 2480 9.0 4.8 75.4% 2.9% 2.5% 7.2% 10.8%
Property Crimes 3742 4.9 2.8 71.6% 0.2% 3.4% 10.5% 11.7%
Drug Crimes 4582 5.3 2.7 65.6% 0.0% 3.6% 18.9% 10.0%
All Others 1033 4.1 2.0 70.5% 0.1% 2.0% 6.8% 20.7%
Grand Total 11837 5.8 3.1 70.0% 0.7% 3.2% 12.7% 11.6%
* Offenders may have multiple convictions at the time of commitment; this data represents cumulative sentences at time for all
convictions. Life & death sentences are computed as 99 yrs. for sentence averages. This is average sentence length only
of those released and does not include inmates remaining in prison.
** Goodtime/parole supervision (diminution of sentence).
*** Goodtime; inmates sentenced prior to 1972.
**** Represents Parole Board actions.
***** Includes conviction overturns, court orders, death, and release to probation on a split sentence.
Other*****
Parole****
Parole****
GTPS**
Other*****
Parole****GT*** Fullterm
Fullterm
Release Types
Release Types
GTPS** GT***
DEPARTMENT OF PUBLIC SAFETY AND CORRECTIONS
Summary of Adult Incarceration Releases 1994-1996(Based Upon Most Serious Commitment Crime)
FulltermGTPS**
Release Types
Other*****GT***
81 Date: 12/31/2014
2 of 7
Avg. * Avg.*Total Length of Time
1997 Releases Sent. (Yrs.) Served (Yrs.)
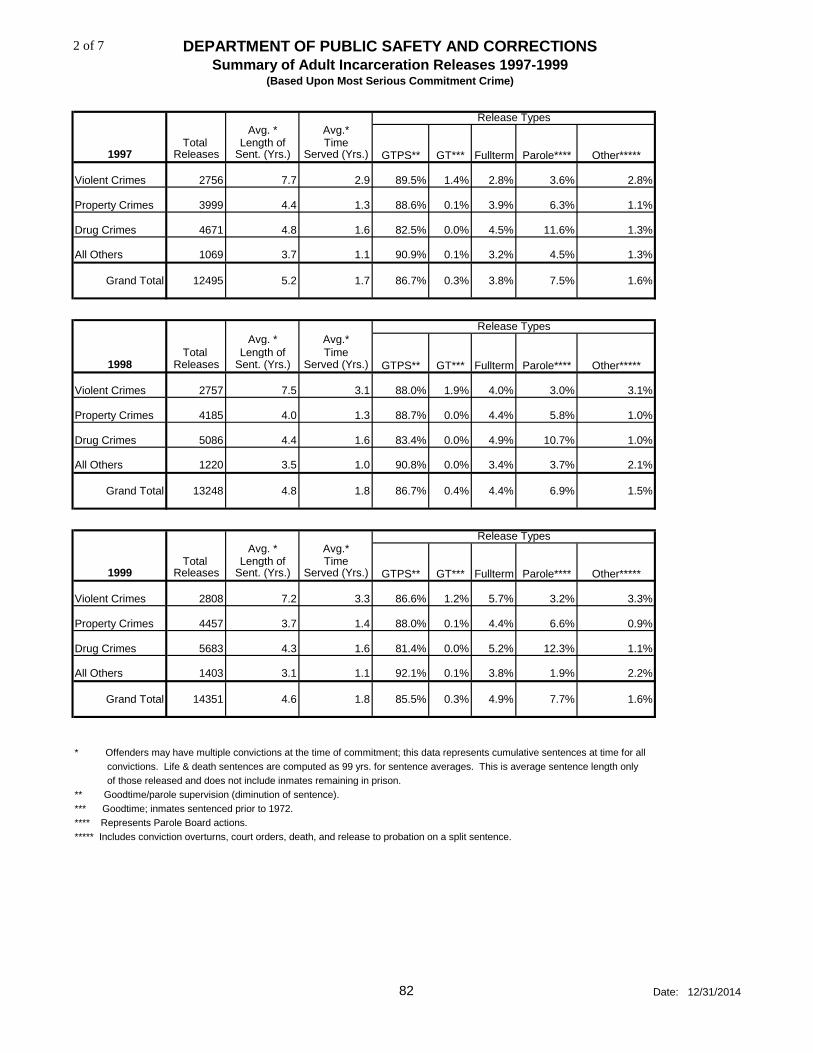
Violent Crimes 2756 7.7 2.9 89.5% 1.4% 2.8% 3.6% 2.8%
Property Crimes 3999 4.4 1.3 88.6% 0.1% 3.9% 6.3% 1.1%
Drug Crimes 4671 4.8 1.6 82.5% 0.0% 4.5% 11.6% 1.3%
All Others 1069 3.7 1.1 90.9% 0.1% 3.2% 4.5% 1.3%
Grand Total 12495 5.2 1.7 86.7% 0.3% 3.8% 7.5% 1.6%
Avg. * Avg.*
Total Length of Time1998 Releases Sent. (Yrs.) Served (Yrs.)
Violent Crimes 2757 7.5 3.1 88.0% 1.9% 4.0% 3.0% 3.1%
Property Crimes 4185 4.0 1.3 88.7% 0.0% 4.4% 5.8% 1.0%
Drug Crimes 5086 4.4 1.6 83.4% 0.0% 4.9% 10.7% 1.0%
All Others 1220 3.5 1.0 90.8% 0.0% 3.4% 3.7% 2.1%
Grand Total 13248 4.8 1.8 86.7% 0.4% 4.4% 6.9% 1.5%
Avg. * Avg.*Total Length of Time
1999 Releases Sent. (Yrs.) Served (Yrs.)
Violent Crimes 2808 7.2 3.3 86.6% 1.2% 5.7% 3.2% 3.3%
Property Crimes 4457 3.7 1.4 88.0% 0.1% 4.4% 6.6% 0.9%
Drug Crimes 5683 4.3 1.6 81.4% 0.0% 5.2% 12.3% 1.1%
All Others 1403 3.1 1.1 92.1% 0.1% 3.8% 1.9% 2.2%
Grand Total 14351 4.6 1.8 85.5% 0.3% 4.9% 7.7% 1.6%
* Offenders may have multiple convictions at the time of commitment; this data represents cumulative sentences at time for all
convictions. Life & death sentences are computed as 99 yrs. for sentence averages. This is average sentence length only
of those released and does not include inmates remaining in prison.
** Goodtime/parole supervision (diminution of sentence).
*** Goodtime; inmates sentenced prior to 1972.
**** Represents Parole Board actions.
***** Includes conviction overturns, court orders, death, and release to probation on a split sentence.
DEPARTMENT OF PUBLIC SAFETY AND CORRECTIONS
Summary of Adult Incarceration Releases 1997-1999(Based Upon Most Serious Commitment Crime)
GTPS**
GT***
Parole****GT***
Release Types
Other*****
Release Types
Other*****
Fullterm
Release Types
Parole****GT***GTPS**
Fullterm
GTPS** Other*****Parole****
Fullterm
82 Date: 12/31/2014

3 of 7
Avg. * Avg.*Total Length of Time
2000 Releases Sent. (Yrs.) Served (Yrs.)
Avg. * Avg.*
Total Length of Time2001 Releases Sent. (Yrs.) Served (Yrs.)
Avg. * Avg.*Total Length of Time
2002 Releases Sent. (Yrs.) Served (Yrs.)
* Offenders may have multiple convictions at the time of commitment; this data represents cumulative sentences at time for all
convictions. Life & death sentences are computed as 99 yrs. for sentence averages. This is average sentence length only
of those released and does not include inmates remaining in prison.
** Goodtime/parole supervision (diminution of sentence).
*** Goodtime; inmates sentenced prior to 1972.
**** Represents Parole Board actions.
***** Includes conviction overturns, court orders, death, and release to probation on a split sentence.
10.8%
3.6%
11.1%
15.9%
4.6%
2.8%
3.7%
1.4%
1.4%
10.2%75.0%
79.3% 0.3%
8.8%
5.5%
6.2%
10.2%
6.9%
1.3%
0.0%
0.0%
0.0%All Others
Grand Total 15052 5.2
1606
4.6
3.7
Drug Crimes
1.3
2.1
Violent Crimes
81.5% 0.2% 7.1% 9.3%
2771
5220
5455
1.3
8.6 4.2
1.7
1.8
82.5%
82.0%
76.5%
77.2%
6.0%
7.0%
1.2%
1.3%
0.0%
0.0%
8.0%
8.9%
14.6%
4.0% 4.2%
3.6 83.7% 1.1% 8.8%
1.9
3.0%
GT***
All Others
Grand Total 14768 5.0 2.0
5059
5251
1530
8.0
4.4
4.4
3.7 83.7% 0.0%
1.6
1.7
83.9%
1.5
Drug Crimes 6.3%6141 11.5%
All Others
Grand Total
4.4
14563 4.5
Violent Crimes
Property Crimes
Drug Crimes
2928
Property Crimes
1460
4.2
3.2
1.7
1.1 5.0% 3.3%
7.7%6.3%
Other*****
Release Types
GTPS** GT*** Fullterm Parole****
Parole****Fullterm
6.9% 3.4%
Other*****
1.0%
1.2%
2.2%
1.6%
2.0%
3.3%
86.4%
85.9%
0.9% 2.5%
GTPS**
80.9%
89.5%
DEPARTMENT OF PUBLIC SAFETY AND CORRECTIONS
Summary of Adult Incarceration Releases 2000-2002
Release Types
(Based Upon Most Serious Commitment Crime)
Violent Crimes
Property Crimes
2681 7.2 3.3
3.7
Release Types
Other*****GTPS** GT*** Fullterm Parole****
84.3%
0.0%
0.1%
0.2%
4281 0.0% 6.2% 6.9%
83 Date: 12/31/2014

4 of 7
Avg. * Avg.*Total Length of Time
2003 Releases Sent. (Yrs.) Served (Yrs.)
Violent Crimes 2807 8.7 4.1 81.2% 1.4% 9.4% 3.9% 4.2%
Property Crimes 5286 4.3 1.7 83.2% 0.0% 5.6% 10.0% 1.2%
Drug Crimes 5742 4.2 1.7 76.6% 0.0% 6.7% 15.1% 1.6%
All Others 1509 3.7 1.3 71.4% 0.0% 10.3% 4.2% 14.0%
Grand Total 15344 5.0 2.1 79.2% 0.3% 7.2% 10.2% 3.1%
Avg. * Avg.*
Total Length of Time2004 Releases Sent. (Yrs.) Served (Yrs.)
Violent Crimes 2572 7.4 3.9 83.1% 0.6% 9.3% 2.2% 4.9%
Property Crimes 5421 3.9 1.6 84.6% 0.0% 4.7% 9.1% 1.6%
Drug Crimes 5964 4.2 1.7 79.5% 0.0% 6.1% 12.8% 1.7%
All Others 1443 3.4 1.3 72.7% 0.0% 10.3% 2.1% 14.9%
Grand Total 15400 4.5 2.0 81.3% 0.1% 6.5% 8.7% 3.4%
Avg. * Avg.*Total Length of Time
2005 Releases Sent. (Yrs.) Served (Yrs.)
Violent Crimes 2642 7.5 4.2 82.0% 1.0% 10.1% 2.6% 4.4%
Property Crimes 5524 3.7 1.7 84.7% 0.0% 4.7% 9.1% 1.5%
Drug Crimes 5824 4.0 1.7 82.9% 0.0% 4.8% 10.9% 1.4%
All Others 1374 3.4 1.5 73.0% 0.0% 12.6% 2.3% 12.2%
Grand Total 15364 4.5 2.1 82.5% 0.2% 6.4% 8.1% 2.9%
* Offenders may have multiple convictions at the time of commitment; this data represents cumulative sentences at time for all
convictions. Life & death sentences are computed as 99 yrs. for sentence averages. This is average sentence length only
of those released and does not include inmates remaining in prison.
** Goodtime/parole supervision (diminution of sentence).
*** Goodtime; inmates sentenced prior to 1972.
**** Represents Parole Board actions.
***** Includes conviction overturns, court orders, death, and release to probation on a split sentence.
Release Types
GTPS** GT*** Fullterm Parole**** Other*****
GTPS** Other*****
GT***
GT***
Release Types
Fullterm
Release Types
Parole****
DEPARTMENT OF PUBLIC SAFETY AND CORRECTIONS
Summary of Adult Incarceration Releases 2003-2005DEPARTMENT OF PUBLIC SAFETY AND CORRECTIONS
Other*****GTPS** Fullterm Parole****
84 Date: 12/31/2014

5 of 7
Avg. * Avg.*Total Length of Time
2006 Releases Sent. (Yrs.) Served (Yrs.)
Violent Crimes 2602 9.6 4.8 81.7% 0.7% 11.1% 2.2% 4.3%
Property Crimes 5448 4.7 1.7 85.9% 0.1% 4.3% 8.5% 1.4%
Drug Crimes 5672 4.9 1.7 81.6% 0.1% 5.2% 11.8% 1.4%
All Others 1236 4.1 1.4 76.3% 0.0% 12.9% 1.3% 9.5%
Grand Total 14958 5.5 2.2 82.7% 0.2% 6.5% 8.0% 2.6%
Avg. * Avg.*
Total Length of Time2007 Releases Sent. (Yrs.) Served (Yrs.)
Violent Crimes 2428 9.6 4.8 77.9% 0.9% 11.9% 4.5% 4.9%
Property Crimes 5525 4.5 1.7 84.4% 0.0% 4.7% 9.5% 1.3%
Drug Crimes 5627 4.8 1.7 81.9% 0.1% 4.6% 11.9% 1.5%
All Others 1295 3.8 1.4 74.4% 0.0% 13.1% 1.8% 10.8%
Grand Total 14875 5.3 2.2 81.5% 0.2% 6.6% 8.9% 2.8%
Avg. * Avg.*Total Length of Time
2008 Releases Sent. (Yrs.) Served (Yrs.)
Violent Crimes 2402 7.8 4.6 77.3% 0.8% 15.0% 1.6% 5.3%
Property Crimes 5374 4.5 1.7 87.9% 0.0% 5.0% 5.8% 1.4%
Drug Crimes 5870 4.6 1.7 86.8% 0.0% 4.0% 8.0% 1.2%
All Others 1386 4.1 1.6 72.7% 0.0% 14.8% 1.9% 10.7%
Grand Total 15032 5.0 2.1 84.4% 0.1% 7.1% 5.6% 2.8%
* Offenders may have multiple convictions at the time of commitment; this data represents cumulative sentences at time for all
convictions. Life & death sentences are computed as 99 yrs. for sentence averages. This is average sentence length only
of those released and does not include inmates remaining in prison.
** Goodtime/parole supervision (diminution of sentence).
*** Goodtime; inmates sentenced prior to 1972.
**** Represents Parole Board actions.
***** Includes conviction overturns, court orders, death, and release to probation on a split sentence.
Release Types
GTPS** GT*** Fullterm Parole**** Other*****
DEPARTMENT OF PUBLIC SAFETY AND CORRECTIONS
Summary of Adult Incarceration Releases 2006-2008DEPARTMENT OF PUBLIC SAFETY AND CORRECTIONS
Release Types
Other*****GTPS** GT*** Fullterm Parole****
Release Types
GTPS** GT*** Fullterm Parole**** Other*****
85 Date: 12/31/2014

6 of 7
Avg. * Avg.*Total Length of Time
2009 Releases Sent. (Yrs.) Served (Yrs.)
Violent Crimes 2369 7.7 4.8 78.6% 0.6% 14.9% 0.6% 5.3%
Property Crimes 5423 4.0 1.7 89.2% 0.0% 5.3% 4.2% 1.3%
Drug Crimes 5903 4.4 1.8 88.4% 0.0% 4.0% 6.0% 1.6%
All Others 1519 3.5 1.4 74.0% 0.0% 12.7% 1.3% 12.0%
Grand Total 15214 4.7 2.2 85.7% 0.1% 7.0% 4.0% 3.1%
Avg. * Avg.*
Total Length of Time2010 Releases Sent. (Yrs.) Served (Yrs.)
Violent Crimes 2634 7.8 4.8 78.7% 0.3% 14.2% 0.8% 6.0%
Property Crimes 6040 4.4 1.7 89.3% 0.0% 5.4% 3.9% 1.4%
Drug Crimes 6764 4.7 1.9 89.5% 0.0% 4.2% 5.0% 1.3%
All Others 1815 3.8 1.5 76.1% 0.0% 12.0% 1.0% 10.9%
Grand Total 17253 5.0 2.3 86.4% 0.1% 7.0% 3.5% 3.1%
Avg. * Avg.*Total Length of Time
2011 Releases Sent. (Yrs.) Served (Yrs.)
Violent Crimes 3018 8.0 4.6 76.7% 0.4% 13.7% 1.1% 4.9%
Property Crimes 6033 4.9 1.5 85.0% 0.0% 6.1% 3.5% 1.5%
Drug Crimes 6186 5.0 1.6 91.9% 0.0% 5.6% 5.0% 1.3%
All Others 1885 4.4 1.6 71.0% 0.0% 12.8% 1.3% 7.5%
Grand Total 17122 5.6 2.3 84.5% 0.1% 8.0% 3.4% 2.7%
* Offenders may have multiple convictions at the time of commitment; this data represents cumulative sentences at time for all
convictions. Life & death sentences are computed as 99 yrs. for sentence averages. This is average sentence length only
of those released and does not include inmates remaining in prison.
** Goodtime/parole supervision (diminution of sentence).
*** Goodtime; inmates sentenced prior to 1972.
**** Represents Parole Board actions.
***** Includes conviction overturns, court orders, death, and release to probation on a split sentence.
Release Types
GTPS** GT*** Fullterm Parole**** Other*****
Release Types
GTPS** GT*** Fullterm Parole**** Other*****
DEPARTMENT OF PUBLIC SAFETY AND CORRECTIONS
Summary of Adult Incarceration Releases 2009-2011
DEPARTMENT OF PUBLIC SAFETY AND CORRECTIONS
Parole****
Release Types
Other*****GTPS** GT*** Fullterm
86 Date: 12/31/2014

7 of 7
Avg. * Avg.*Total Length of Time
2012 Releases Sent. (Yrs.) Served (Yrs.)
Violent Crimes 2905 8.4 4.8 75.3% 0.2% 14.9% 3.1% 6.5%
Property Crimes 6021 4.6 1.6 86.1% 0.0% 6.7% 5.5% 1.7%
Drug Crimes 6207 5.0 1.8 86.8% 0.0% 5.2% 6.5% 1.5%
All Others 1887 4.2 1.5 78.7% 0.0% 13.6% 2.1% 5.6%
Grand Total 17020 5.5 2.4 83.7% 0.0% 8.3% 5.1% 2.9%
Avg. * Avg.*Total Length of Time
2013 Releases Sent. (Yrs.) Served (Yrs.)
Violent Crimes 3073 8.6 5.1 75.7% 0.3% 14.5% 3.2% 6.4%
Property Crimes 6313 4.6 1.7 89.0% 0.0% 5.8% 3.2% 2.0%
Drug Crimes 6293 5.1 1.8 89.1% 0.0% 4.4% 4.7% 1.8%
All Others 2011 4.0 1.5 76.8% 0.0% 14.3% 1.5% 7.4%
Grand Total 17690 5.6 2.5 85.3% 0.0% 7.8% 3.5% 3.3%
Avg. * Avg.*Total Length of Time
2014 Releases Sent. (Yrs.) Served (Yrs.)
Violent Crimes 3166 9.2 5.1 76.8% 0.1% 14.0% 3.5% 5.6%
Property Crimes 6169 4.8 1.6 92.6% 0.0% 3.2% 2.8% 1.4%
Drug Crimes 6262 5.0 1.7 91.9% 0.0% 3.0% 3.5% 1.6%
All Others 2375 4.2 1.5 74.3% 0.0% 17.9% 1.1% 6.7%
Grand Total 17972 5.8 2.3 87.1% 0.0% 7.0% 2.9% 2.9%
Avg. * Avg.*Total Length of Time
2015 Releases Sent. (Yrs.) Served (Yrs.)
Violent Crimes 3181 9.6 5.0 76.7% 0.2% 13.0% 4.0% 6.3%
Property Crimes 6168 4.8 1.4 94.3% 0.0% 2.6% 1.8% 1.3%
Drug Crimes 6135 5.3 1.6 93.4% 0.0% 2.2% 2.9% 1.5%
All Others 2366 4.7 1.5 76.4% 0.0% 15.8% 0.6% 7.1%
* Offenders may have multiple convictions at the time of commitment; this data represents cumulative sentences at time for all convictions. Life & death sentences are computed as 99 yrs. for sentence averages. This is average sentence length only of those released and does not include inmates remaining in prison.** Goodtime/parole supervision (diminution of sentence).*** Goodtime; inmates sentenced prior to 1972.**** Represents Parole Board actions.***** Includes conviction overturns, court orders, death, and release to probation on a split sentence.
Release Types
GTPS** GT*** Fullterm Parole**** Other*****
Release Types
GTPS** GT*** Fullterm Parole**** Other*****
GTPS** GT*** Fullterm Parole**** Other*****
DEPARTMENT OF PUBLIC SAFETY AND CORRECTIONS
Release Types
Other*****GTPS**
Release Types
GT*** Fullterm Parole****
DEPARTMENT OF PUBLIC SAFETY AND CORRECTIONS
Summary of Adult Incarceration Releases 2012-2015
Grand Total 3.0%2.4%6.1%0.0%88.5%2.15.817850
87 Date: 06/30/2017

Avg. * Avg.*Total Length of Time
2016 Releases Sent. (Yrs.) Served (Yrs.)
Violent Crimes 3005 9.0 4.8 75.0% 0.2% 14.5% 3.3% 7.0%
Property Crimes 5636 4.6 1.3 94.3% 0.0% 2.5% 1.6% 1.6%
Drug Crimes 5610 5.2 1.5 93.9% 0.0% 2.4% 2.0% 1.7%
All Others 2289 4.4 1.5 76.1% 0.0% 16.0% 1.0% 6.9%
Grand Total 16540 5.6 2.0 0.0% 0.0% 0.0% 0.0% 0.0%
* Offenders may have multiple convictions at the time of commitment; this data represents cumulative sentences at time for all convictions. Life & death sentences are computed as 99 yrs. for sentence averages. This is average sentence length only of those released and does not include inmates remaining in prison.
** Goodtime/parole supervision (diminution of sentence).*** Goodtime; inmates sentenced prior to 1972.
**** Represents Parole Board actions.***** Includes conviction overturns, court orders, death, and release to probation on a split sentence.
15092
of
Sentence
2433
DEPARTMENT OF PUBLIC SAFETY AND CORRECTIONS
Summary of Adult Incarceration Releases 2016DEPARTMENT OF PUBLIC SAFETY AND CORRECTIONS
Release Types
GTPS** GT*** Fullterm Parole**** Other*****
Date: 09/30/2017

FISCAL
YEAR # ADMISSION % CHANGE # RELEASE % CHANGE
NET CHANGE
(DIFFERENCE)
79/80 2771 1896 875
80/81 2887 4.19% 1987 4.80% 900
81/82 3596 24.56% 2531 27.38% 1065
82/83 4490 24.86% 2736 8.10% 1754
83/84 4444 -1.02% 3184 16.37% 1260
84/85 4272 -3.87% 3588 12.69% 684
85/86 4849 13.51% 3926 9.42% 923
86/87 5693 17.41% 4704 19.82% 989
87/88 5421 -4.78% 5395 14.69% 26
88/89 6033 11.29% 5474 1.46% 559
89/90 6965 15.45% 5957 8.82% 1008
90/91 7728 10.95% 6738 13.11% 990
91/92 9138 18.25% 7973 18.33% 1165
92/93 10819 18.40% 9284 16.44% 1535
93/94 11588 7.11% 10433 12.38% 1155
94/95 12568 8.46% 11200 7.35% 1368
95/96 13281 5.67% 12050 7.59% 1231
96/97 14395 8.39% 12070 0.17% 2325
97/98 15567 8.14% 12934 7.16% 2633
98/99 15663 0.62% 13764 6.42% 1899
99/00 15590 -0.47% 14576 5.90% 1014
00/01 15900 1.99% 14664 0.60% 1236
01/02 15519 -2.40% 14725 0.42% 794
02/03 16033 3.31% 15352 4.26% 681
03/04 16234 1.25% 15373 0.14% 861
04/05 16098 -0.84% 15343 -0.20% 755
05/06 14279 -11.30% 15197 -0.95% -918
06/07 16011 12.13% 14913 -1.87% 1098
07/08 16334 2.02% 14879 -0.23% 1455
08/09 16525 1.17% 15198 2.14% 1327
09/10 17396 5.27% 16059 5.67% 1337
10/11 17428 0.18% 17384 8.25% 44
11/12 17913 2.78% 17020 -2.09% 893
12/13 16916 -5.57% 17231 1.24% -315
13/14 16106 -4.79% 17752 3.02% -1646
14/15 16572 2.89% 18457 3.97% -1885
15/16 16234 -2.04% 16877 -8.56% -643
TOTAL 439256 408824 30432
AVG 1069.37
DEPARTMENT OF PUBLIC SAFETY AND CORRECTIONS
ADMISSIONS/RELEASES COMPARISON FY 79/80 - CURRENT
-5000
0
5000
10000
15000
20000
79/80 82/83 85/86 88/89 91/92 94/95 97/98 00/01 03/04 06/07 09/10 12/13 15/16
# IN
MA
TE
S
FISCAL YEAR
ADMISSION RELEASE: FY 79/80 - 15/16
# ADMISSION
# RELEASE
NET CHANGE(DIFFERENCE)
88 Date: 9/30/17
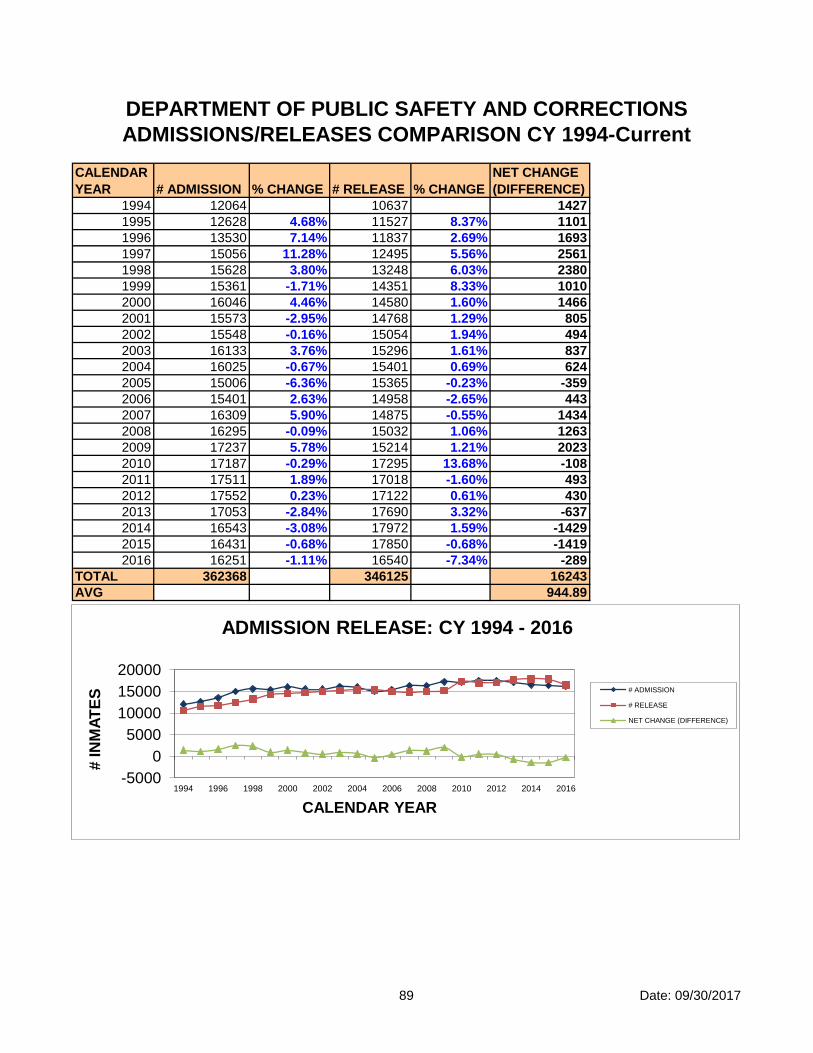
CALENDAR
YEAR # ADMISSION % CHANGE # RELEASE % CHANGE
NET CHANGE
(DIFFERENCE)
1994 12064 10637 1427
1995 12628 4.68% 11527 8.37% 1101
1996 13530 7.14% 11837 2.69% 1693
1997 15056 11.28% 12495 5.56% 2561
1998 15628 3.80% 13248 6.03% 2380
1999 15361 -1.71% 14351 8.33% 1010
2000 16046 4.46% 14580 1.60% 1466
2001 15573 -2.95% 14768 1.29% 805
2002 15548 -0.16% 15054 1.94% 494
2003 16133 3.76% 15296 1.61% 837
2004 16025 -0.67% 15401 0.69% 624
2005 15006 -6.36% 15365 -0.23% -359
2006 15401 2.63% 14958 -2.65% 443
2007 16309 5.90% 14875 -0.55% 1434
2008 16295 -0.09% 15032 1.06% 1263
2009 17237 5.78% 15214 1.21% 2023
2010 17187 -0.29% 17295 13.68% -108
2011 17511 1.89% 17018 -1.60% 493
2012 17552 0.23% 17122 0.61% 430
2013 17053 -2.84% 17690 3.32% -637
2014 16543 -3.08% 17972 1.59% -1429
2015 16431 -0.68% 17850 -0.68% -1419
2016 16251 -1.11% 16540 -7.34% -289
TOTAL 362368 346125 16243
AVG 944.89
DEPARTMENT OF PUBLIC SAFETY AND CORRECTIONS
ADMISSIONS/RELEASES COMPARISON CY 1994-Current
-5000
0
5000
10000
15000
20000
1994 1996 1998 2000 2002 2004 2006 2008 2010 2012 2014 2016
# IN
MA
TE
S
CALENDAR YEAR
ADMISSION RELEASE: CY 1994 - 2016
# ADMISSION
# RELEASE
NET CHANGE (DIFFERENCE)
89 Date: 09/30/2017