department of physics, university of warwick, coventry ... · department of physics, university of...
TRANSCRIPT

“The Physics Ball Sports”
Marc Walker
Department of Physics, University of Warwick, Coventry, England.
December, 1999.
Abstract
All ball sports are governed by the physics associated with aerodynamics and fluid flow. Here, we shall investigate Bernoulli's theorem and the Magnus effect, and then apply them to four sports - baseball, golf, football and cricket.
We find that aerodynamics has a huge role in defining all of these sports. All of them see curvature of the path of the ball whilst in flight. This is due to the Magnus effect, and to the boundary layer surrounding the ball. We find that dimples on a golf ball help to increase distance, whilst the seam on a cricket ball can enhance swing. We also see the effect of sidespin on the ball, with spin bowling in cricket, and the curveball in baseball, which curves around 18 inches in flight.
We also find that atmospheric conditions play a huge role in the distance of flight of a batted baseball, by increasing or reducing the air resistance, or drag, experienced by the ball.
This essay is intended as an introduction to some of the basic physics which we can see in some of the world’s most popular sports. If you have any comments, please email me.
1. Introduction In this essay, we will consider the physics involved in four sports - football, golf, cricket and baseball. Firstly, we will consider the principles behind the aerodynamics of spheres. Then, we will apply these theories to the four sports previously mentioned. We will also consider the collision between baseball and bat. 1.1 Bernoulli's Principle Bernoulli's Principle states that regions of higher velocity in a fluid correspond to regions of lower pressure in that fluid. This is a direct result from Newton's Second Law of Motion:
2
2
dtxdmF = (1)
Hence, it can be clearly seen that if a constant force, F, is applied to a mass, m, the mass will accelerate. If the mass is accelerating, then its kinetic energy, Ek, is increasing by equation 2.
2
21
=
dtdxmEk (2)
This is the work done by the force, as it moves through a distance x. The work done is also defined as the product of the magnitude of the force and the distance over which it acts on the mass m, i.e.
2
2dmx x .DWork dt
xFone == (3)
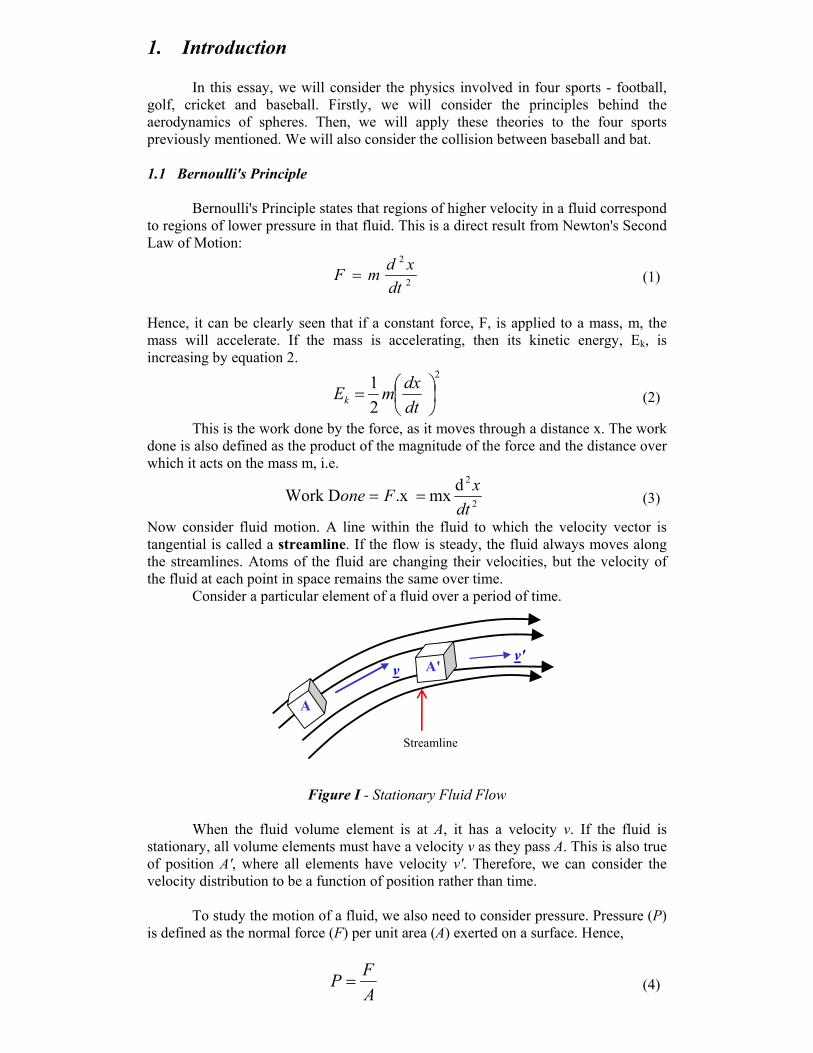
Now consider fluid motion. A line within the fluid to which the velocity vector is tangential is called a streamline. If the flow is steady, the fluid always moves along the streamlines. Atoms of the fluid are changing their velocities, but the velocity of the fluid at each point in space remains the same over time. Consider a particular element of a fluid over a period of time.
Figure I - Stationary Fluid Flow
When the fluid volume element is at A, it has a velocity v. If the fluid is
stationary, all volume elements must have a velocity v as they pass A. This is also true of position A', where all elements have velocity v'. Therefore, we can consider the velocity distribution to be a function of position rather than time. To study the motion of a fluid, we also need to consider pressure. Pressure (P) is defined as the normal force (F) per unit area (A) exerted on a surface. Hence,
AFP = (4)
A
A'
Streamline
v v'

Pressure is expressed in units of newtons per square metre (Nm-2), or Pascals.
The motion of the volume element is determined not only by the pressure exerted by the rest of the fluid, but also by gravity and other forces. We first determine the resultant of the external forces (gravity, electric, etc.), on the volume of fluid due to the pressure. Consider a fluid moving along a cylindrical pipe of variable cross-section A (see Figure II, below).
Figure II - Forces on a fluid element due to the pressure.
The x-axis is made coincident with the axis of the pipe. Consider an element
of thickness dx, cross-sectional area A, and therefore volume Adx. Let p and p' be the values of pressure on the left and right sides of the volume element. Therefore, by equation 4, the force differential, df, is
APPAPPAFFdf )'('' −−=−=−= (5) However, p'-p is the pressure differential across the element. The element is of thickness dx. So, if p'-p = dp, then
)()( AdxdxdpAdpdf −=−= (6)
Since Adx is the volume of the fluid, we conclude that the force per unit volume along the x-axis on the fluid due to the pressure is
dxdpF −= (7)
This result shows that the force acts in the direction of decreasing pressure.
This is analogous to a potential field. In addition to the pressure, there may be other external forces, such as gravity or an external electric field, acting on the fluid inside the volume element. Let Ep be the corresponding potential per unit volume due to other external forces. Then the total potential energy due to pressure and other effects is p + Ep. We assume that the fluid is incompressible. For an incompressible fluid, the internal energy does not change, so we can ignore it when we consider the changes of energy of the volume element. The conservation of energy applied to an incompressible fluid, states that if all the forces acting on an incompressible fluid are conservative, and we follow the motion of a small volume of fluid, we find that the total energy per unit volume remains constant. Thus, the sum of kinetic energy, potential energy and pressure is a constant. i.e.
.E21
p2 constPv =++ρ (8)

where ρ is the density of the fluid. This result is known as Bernoulli's Theorem. 1.2 Magnus Effect and the Boundary Layer The Magnus Effect describes the flow of air around a rotating sphere. The basic concept was formulated in the 19th century, and expanded by Prandtl in the early 1900s.
The commonly accepted explanation is that a spinning object creates a whirlpool of rotating air about itself. On the side where the motion of the whirlpool is in the same direction as that of the windstream to which the object is exposed, the velocity will be enhanced. On the opposite side, where the motions are opposed, the velocity will be decreased. According to Bernoulli's principle, this creates a pressure differential and a force perpendicular to the velocity vector of the sphere. This is the Magnus force.
In reality, the phenomenon is a little more complex. It involves a thin layer of fluid, very close to the solid wall of the sphere. This is known as the boundary layer. Because every fluid possesses a viscosity, there is a shearing force between adjacent regions of the fluid (in this case air), which move at different speeds. This shearing force between layers decreases as we move further away from the sphere, until the sphere has a negligible effect on the airflow. When we reach this point, the air moves with free stream velocity. The faster moving layers drag the slower-moving layers along. Between the edge of the sphere and the region of free stream velocity, the shearing force caused by the sphere is of great importance. This is the previously mentioned boundary layer. The boundary layer is of the order of a few millimetres wide, but is crucial to the motion of the sphere.
If the viscosity of air was zero, the air would flow around the ball as shown in
figure III, below.
Figure III - Flow of an ideal fluid having no viscosity.
Now consider a small section of fluid, known as a fluid particle, within the
fluid as a whole. As the fluid particle at point A in figure III approaches the ball, and begins to move around it to the equator (A'), it will accelerate. In order for this to happen, a force must be applied to the fluid particle. This ''pressure'' force comes from the pressure difference between A and A'. According to Bernoulli's Principle, the

pressure at A is greater than at A', and thus the kinetic energy of the particle must increase for equation 8 to hold.
The reverse happens between A' and A", with the kinetic energy being given back.
However, this is not quite the case, as air does have a viscosity. As the fluid particle moves past A', it still slows down. The free stream flow sweeps the fluid particle along, but on the downstream side of the sphere, however, the particle does not reach A''. A region known as the wake region develops, where the air experiences a swirling, chaotic flow. The point at which the wake region begins is known as the boundary layer separation point, and the phenomenon itself is known as boundary layer separation.
Figure IV - Flow of a real fluid (e.g. air) flowing around a sphere.
Due to the chaotic flow, the pressure in the wake region is significantly lower than the pressure on the front of the sphere. This is because the kinetic energy lost by the fluid particles is bound up in the turbulent eddies in the wake, instead of being added back to the pressure. The existence of the wake creates a drag force. The drag force slows the ball down, whilst the shape of the wake region causes curvature in flight.
1.3 Drag
We can estimate the drag forces on a ball (6). If a ball, moving with velocity v,
has a cross-section A, the drag force, Fd, is the force required to keep a cylinder of stationary air, density ρ, ahead of the moving ball.
2
2vA
CF d
d ρ= (9)
where Cd is a dimensionless proportionality constant. We would estimate that this would be less than 1, as some of the air flows around the ball, before reaching the ball's velocity. Therefore, the drag force on a ball is dependent on its velocity. It is also dependent on the surface of the ball, and the density of the air, so temperature and altitude will have an effect.
However, equation 9 is a general model. The drag regime changes when the Reynolds number, R, exceeds a certain value. Again, this is dependent on the surface of the ball, and is defined as
υVdR = (10)
where d is the diameter of the ball, V is the ball's velocity relative to the air, and υ is the kinematic viscosity of air. The drag crisis occurs when the laminar (smooth) flow in the boundary layer begins to separate and become turbulent. Kinetic energy is lost in the turbulent boundary layer, and so the wake region is smaller. At the drag crisis,

the drag coefficient Cd may drop by a factor of two. Generally the drag reduction will occur at lower Reynolds numbers for rougher spherical surfaces. Figure V, below, shows the characteristics of the drag coefficient versus Reynolds number for a smooth sphere (7).
Figure V - Drag Coefficient against Reynolds Number for a smooth sphere, in this case the same size as the baseball. Drag crisis occurs at around 42.67ms-1.
8 6 4
2
0
Cd
• 104 105 106
Reynolds Number
1ms-1 42.67 ms-1

1. Aerodynamics of Ball Sports
(Applying theories in section 1 to reality)
2.1 The Aerodynamics of the Golf Ball
In this section, we will consider the modern golf ball, the surface of which has
over 300 dimples, and has a cover made of Surlyn. The development of the golf ball is shown in reference 3.
SOLID 1 SOLID 2 SOLID 3 LIQUID-CORE PIECE PIECE PIECE 3 PIECE BALL BALL BALL BALL
Figure VI - Structures of modern golf balls.
We have already considered the airflow past a smooth ball is section 1. The
airflow is the same around a smooth ball, the same size as a golf ball.
Figure VII - Airflow past a smooth golf ball. Increasing the velocity to induce turbulent airflow produces the following
airflow characteristics:
Figure VIII - Airflow past a high-velocity, smooth ball, thus inducing turbulence.

Introducing dimples on to the surface decreases the size of the wake region further. We now see the following airflow pattern:
Figure IX - Airflow past a non-spinning, dimpled golf ball.
Therefore, the drag on the dimpled ball is significantly less. Now, we move on to consider the real-life situation. A properly hit golf ball is
struck below the equator, such that it spins with backspin. The airflow past a spinning dimpled ball is shown in figure X, below.
Figure X - Airflow past a spinning dimpled golf ball spinning with backspin.
In this case, the boundary layer moves with the surface of the ball as it spins.
This means that the airflow over the top of the ball is more rapid than at the bottom of the ball. According to Bernoulli's Principle, an upward force, or lift is generated. The wake also takes on a downward component due to the rotation of the ball. Thus, the air receives some downward momentum, and the ball recoils vertically.
The drag and lift depend on three variables: 1. speed of the ball 2. surface texture of the ball 3. rate of spin of the ball The drag on the ball increases with speed and with rate of spin. The lift on the
ball increases with rate of spin at a given speed, and increases with speed for a given rate of spin. Indeed, a ball hit into the wind will not fly as far (due to increased drag), but will fly on a higher trajectory (due to increase in lift), than a ball hit with the wind.
It is a rare case, however, when the spin axis is horizontal. If the spin axis is
tilted, curvature in flight will be observed due to the Magnus Effect. To produce a horizontal spin axis, the clubhead needs to hit the ball straight on, and should be moving along the intended line at impact.
2.2 The Aerodynamics of the Football
Many football fans will remember the goal by Brazil's Roberto Carlos at Le Tournoi de France in the summer of 1997. Carlos struck a free kick from around 30m from the goal so far to the right of the goal that a ball boy standing metres from the goal ducked his head. However, the ball curved, almost magically into the French goal, stunning everybody in the ground and the watching TV audience in the process. The curve on the ball was an example of the Magnus effect applied to footballs.
Footballs are significantly larger than golf balls, and thus the relative Reynolds number for the football at a given velocity is much higher than that of a golf ball. The football has a much smoother surface, so the drag crisis occurs at a higher velocity. However, if you can strike the ball fast enough, you can cause turbulence, and thus the ball experiences less drag. We observe that the ball curves more as it slows down. We would expect this, as the magnitude of the sideways force will stay roughly constant, but will become a larger component of the overall velocity as the ball slows down.
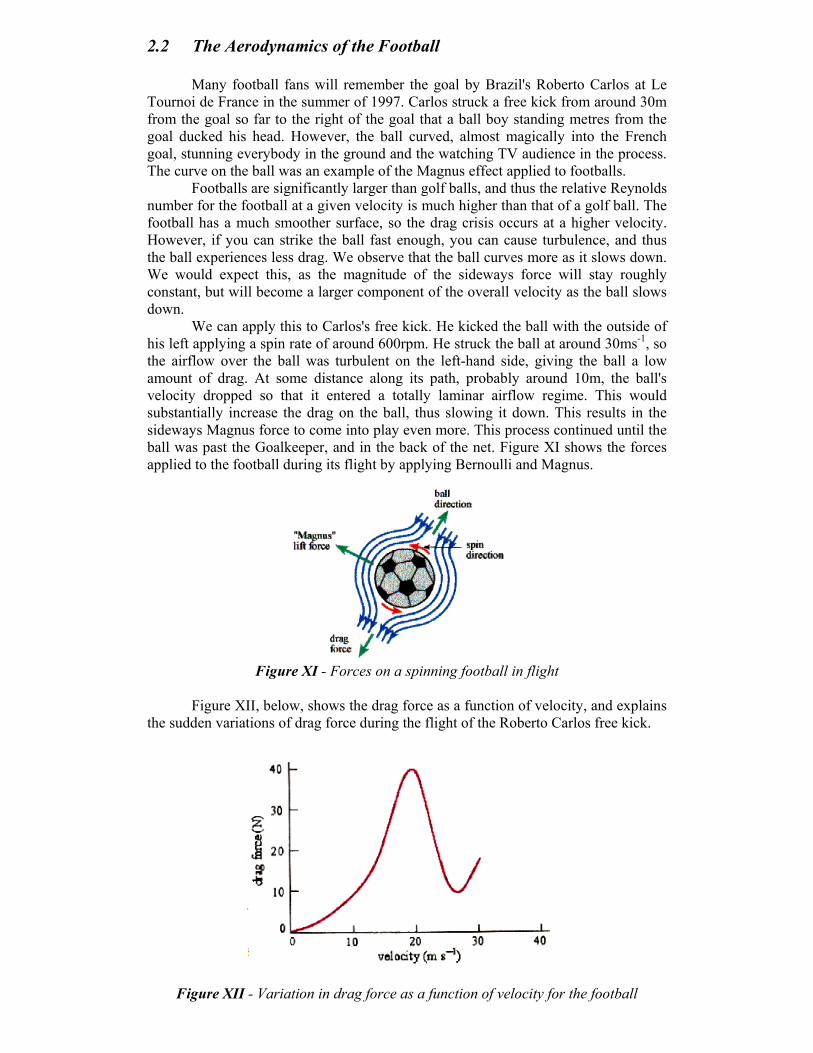
We can apply this to Carlos's free kick. He kicked the ball with the outside of his left applying a spin rate of around 600rpm. He struck the ball at around 30ms-1, so the airflow over the ball was turbulent on the left-hand side, giving the ball a low amount of drag. At some distance along its path, probably around 10m, the ball's velocity dropped so that it entered a totally laminar airflow regime. This would substantially increase the drag on the ball, thus slowing it down. This results in the sideways Magnus force to come into play even more. This process continued until the ball was past the Goalkeeper, and in the back of the net. Figure XI shows the forces applied to the football during its flight by applying Bernoulli and Magnus.
Figure XI - Forces on a spinning football in flight Figure XII, below, shows the drag force as a function of velocity, and explains
the sudden variations of drag force during the flight of the Roberto Carlos free kick.
Figure XII - Variation in drag force as a function of velocity for the football

(N.B. There are other factors that affect the aerodynamics of the football, which are outlined in reference 4). 2.3 The Aerodynamics of a Cricket Ball (ref5)
Each and every delivery in the game of cricket has a different trajectory, which can be varied by changing the pace of the delivery, the line and length of the delivery, and most subtly, by moving the ball "through the air", so that it dips, swings or drifts into or away from the batsman. All of these are roughly under the bowler's control. The line may also change when the ball hits the pitch, as the cricket ball is not perfectly spherical - it has a seam. When the ball bounces, it may change its line, bounce higher than expected or lower than expected.
Figure XIII - The Cricket Ball.
The movement through the air, which occurs before the ball bounces, is seen both in pace bowling and in spin bowling. They are quite different types of bowling, but similarities are seen between the two.
The behaviour of a real cricket ball under real conditions depends upon the
behaviour of the two possible states of the boundary layer - laminar or turbulent airflow. In the case of a smooth sphere the size of a cricket ball, the airflow remains fully laminar until the sphere reaches a velocity of around 90 mph. At higher velocities, the boundary layer would become turbulent before the separation point.
Now we consider the effect of the seam on the boundary layer. In fact, we see that the boundary layer can be tripped into turbulence by the seam of the ball. It can also be tripped by surface roughness. The seam is roughly the same height as the thickness of the boundary layer. This is most efficient way of tripping the boundary layer, and the fact that the seam is this size is probably a historical fluke.
To obtain swing, a fast bowler grips the ball with the seam angled across the line of flight, as in Figure XIV, below.
Figure XIV - Cricket ball with seam angled to line of flight.

Just after point A, the flow speed is low enough for laminar airflow. On the surface AD, the boundary layer is tripped by the seam, becomes turbulent, and therefore stays attached to the ball longer. On the surface AB, provided the Reynolds number is less than the critical value, the boundary layer would remain laminar and separate relatively early. Therefore, the pressure on surface AD is lower than the pressure on surface AB. This creates a lateral force on the ball, and creates swing. An outswinger starts with the seam pointed towards the slip fielders, and swings toward them and away from the batsman. The opposite is true for the inswinger.
The critical Reynolds Number at which the drag crisis occurs corresponds to a velocity of around 70mph - significantly lower than the smooth sphere. At speeds above this, the boundary layer on surface AB on figure XIV would also become turbulent. In this case, there would be virtually no pressure differential, and therefore very little swing. This explains why the quickest bowlers obtain less swing than medium pace bowlers.
The critical Reynolds number can also explain the concept of late swing. As the ball travels through the air, it experiences drag, which slows it down. This may have the effect of lowering the Reynolds number below the critical value, and thus change the flow regime, producing late swing, as with the football.
In the game of cricket, we also observe the fast bowlers shining the ball. Normally, they polish only one side, and leave the other side to roughen during play. This helps the ball to swing. Referring back to figure XIV, if surface AB is the shiny side of the ball, the laminar flow is preserved over the surface. However, the roughness on surface DC will help to complete the transition from laminar flow to turbulent flow initiated by the seam. If the bowler releases the ball with the seam held vertically, the difference in surface roughness creates a difference in drag across the ball. On the smoother side, we observe a largely laminar flow, whilst the boundary layer becomes turbulent on the other side of the ball. This redirects the wake region behind the ball, and causes swing toward the shiny side of the ball.
Next, we move on to consider the aerodynamics of the spinning cricket ball.
The "spinner's" prime objective is to make the ball change direction when the ball bounces. He spins the ball either with a flick of the fingers and/or a turn of the wrist as he releases the ball. Upon bouncing, the ball "turns" in the direction of the spin. However, the spinner can also make the ball move through the air. The movement produced by the spinner is a direct result of the spin on the ball, or the Magnus Effect. The effect has its greatest effect when the axis of spin is perpendicular to the direction of flight, as shown in figure XV, below.
Figure XV - Airflow around the spinning ball. In figure XV, the flow is squashed on one side of the ball more than the other.
This creates a pressure differential and a sideways force on the ball. Therefore, the ball will drift in the direction of spin.

However, there are further complications. Every cricketer knows that damp or humid conditions produce more swing. On the scale of variations in atmospheric conditions, the temperature and dampness have little effect on the viscosity of the air. However, these atmospheric changes may change the physical state of the ball. It is thought that the seam may swell in humid conditions, producing a more efficient boundary layer trip. This also implies that each and every ball will swing varying amounts depending on the height of the seam. The modern one-day game uses a white ball for night games. The polyurethane coating on this ball preserves its "whiteness", but induces more swing, probably due to smoother laminar airflow over the surface of the ball.
2.4 The Aerodynamics of the Baseball 2.4.1 The Composition of a Baseball(ref. 1)
A standard major league baseball is required to weigh between 141.75g and 148.83g, with a diameter in the range 7.26cm to 7.47cm. The balls are made in layers. At the centre is a composition cork ball, encased in two thin layers of rubber - one black, the other red. Then come many layers of wool and cotton, with a coat of rubber cement. It is all encased in a cowhide cover and hand-stitched with 216 red cotton stitches. The weight and diameter of the baseball have been standardised for over a century.
Figure XVI - The Major League Baseball
We will now move on to consider the aerodynamics of two different types of pitch - fastball and curveball. 2.4.3 The Aerodynamics of the Fastball
This, as you might deduce from its name, is the fastest pitch in baseball. The fastest pitchers in baseball can throw the fastball at around 95-98 mph. The fastball slows down by around 8 mph on its journey to home plate. The fastball is released with the following grip.
Figure XVII - Grip to produce the fastball. (14)
It is well known that the backspin applied to the fastball causes the ball to rise.
It rotates at about 1600 rpm, and rotates approximately 10 times on its journey to the plate. The "hop" on the fastball is no more than around 5 inches, but this is more than enough to deceive the batter. Most of the hop occurs in the last 15 feet of flight. The hop is caused by lift, rather like the golf ball.
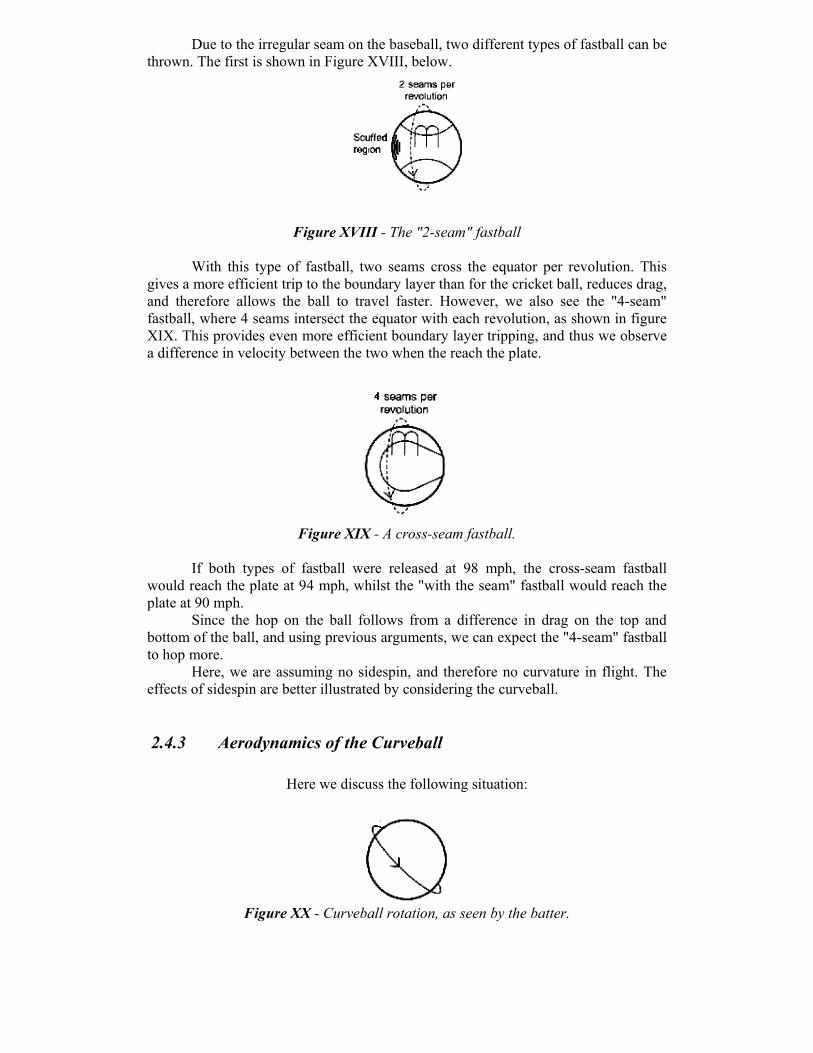
Due to the irregular seam on the baseball, two different types of fastball can be thrown. The first is shown in Figure XVIII, below.
Figure XVIII - The "2-seam" fastball
With this type of fastball, two seams cross the equator per revolution. This
gives a more efficient trip to the boundary layer than for the cricket ball, reduces drag, and therefore allows the ball to travel faster. However, we also see the "4-seam" fastball, where 4 seams intersect the equator with each revolution, as shown in figure XIX. This provides even more efficient boundary layer tripping, and thus we observe a difference in velocity between the two when the reach the plate.
Figure XIX - A cross-seam fastball. If both types of fastball were released at 98 mph, the cross-seam fastball
would reach the plate at 94 mph, whilst the "with the seam" fastball would reach the plate at 90 mph.
Since the hop on the ball follows from a difference in drag on the top and bottom of the ball, and using previous arguments, we can expect the "4-seam" fastball to hop more.
Here, we are assuming no sidespin, and therefore no curvature in flight. The effects of sidespin are better illustrated by considering the curveball. 2.4.3 Aerodynamics of the Curveball
Here we discuss the following situation:
Figure XX - Curveball rotation, as seen by the batter.
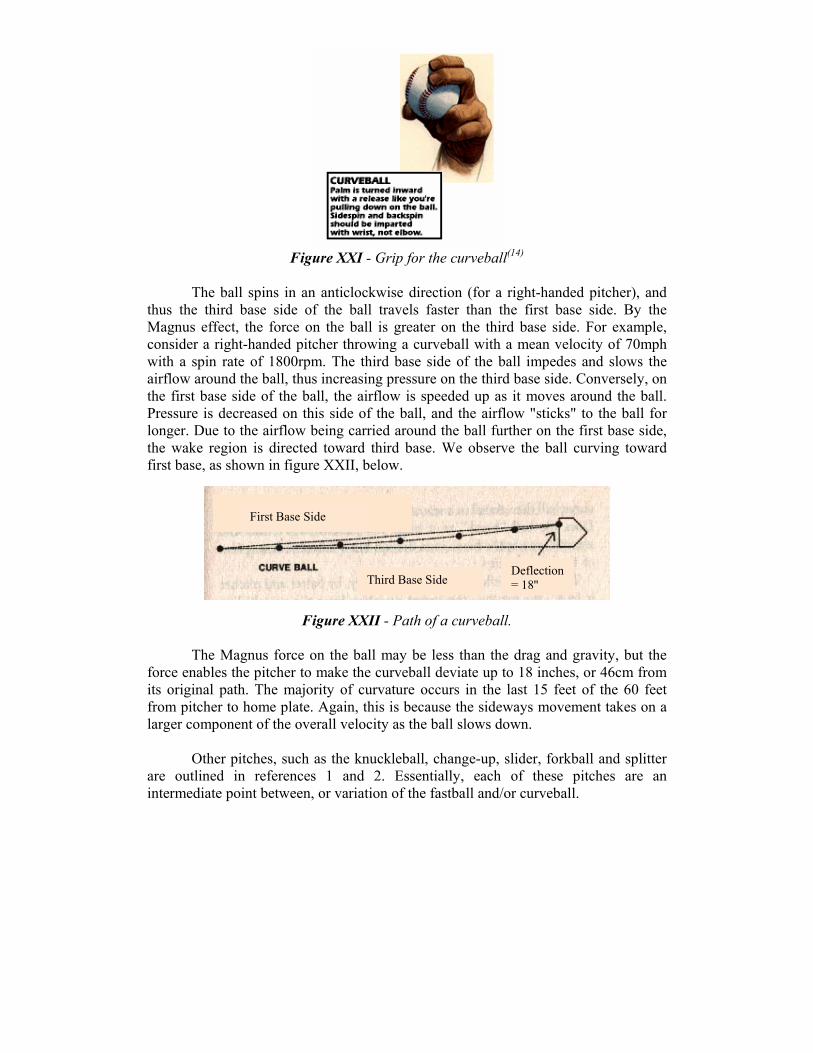
Figure XXI - Grip for the curveball(14) The ball spins in an anticlockwise direction (for a right-handed pitcher), and
thus the third base side of the ball travels faster than the first base side. By the Magnus effect, the force on the ball is greater on the third base side. For example, consider a right-handed pitcher throwing a curveball with a mean velocity of 70mph with a spin rate of 1800rpm. The third base side of the ball impedes and slows the airflow around the ball, thus increasing pressure on the third base side. Conversely, on the first base side of the ball, the airflow is speeded up as it moves around the ball. Pressure is decreased on this side of the ball, and the airflow "sticks" to the ball for longer. Due to the airflow being carried around the ball further on the first base side, the wake region is directed toward third base. We observe the ball curving toward first base, as shown in figure XXII, below.
Figure XXII - Path of a curveball. The Magnus force on the ball may be less than the drag and gravity, but the
force enables the pitcher to make the curveball deviate up to 18 inches, or 46cm from its original path. The majority of curvature occurs in the last 15 feet of the 60 feet from pitcher to home plate. Again, this is because the sideways movement takes on a larger component of the overall velocity as the ball slows down.
Other pitches, such as the knuckleball, change-up, slider, forkball and splitter are outlined in references 1 and 2. Essentially, each of these pitches are an intermediate point between, or variation of the fastball and/or curveball.
First Base Side
Third Base Side Deflection = 18''
3. Baseball - Batting (ref. 8-13) Batting is based on basic mechanics. For an outline of the swing of the bat, as
well as its composition and details of the "sweet-spot", or centre of percussion, references 1, 2, 8, 12 and 13 should be consulted.
3.1 Bat-Ball Collisions and Effect on Flight of the Ball
There are many ways of successfully batting the baseball. A model swing at a
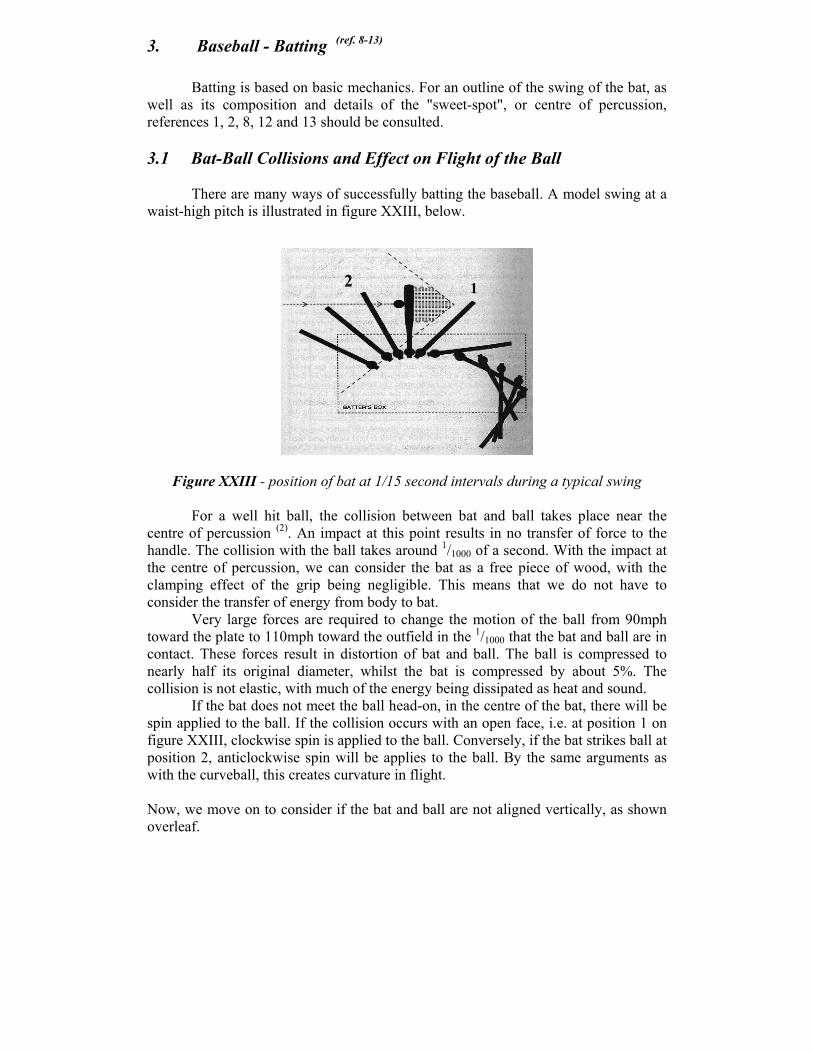
waist-high pitch is illustrated in figure XXIII, below.
Figure XXIII - position of bat at 1/15 second intervals during a typical swing
For a well hit ball, the collision between bat and ball takes place near the
centre of percussion (2). An impact at this point results in no transfer of force to the handle. The collision with the ball takes around 1/1000 of a second. With the impact at the centre of percussion, we can consider the bat as a free piece of wood, with the clamping effect of the grip being negligible. This means that we do not have to consider the transfer of energy from body to bat.
Very large forces are required to change the motion of the ball from 90mph toward the plate to 110mph toward the outfield in the 1/1000 that the bat and ball are in contact. These forces result in distortion of bat and ball. The ball is compressed to nearly half its original diameter, whilst the bat is compressed by about 5%. The collision is not elastic, with much of the energy being dissipated as heat and sound.
If the bat does not meet the ball head-on, in the centre of the bat, there will be spin applied to the ball. If the collision occurs with an open face, i.e. at position 1 on figure XXIII, clockwise spin is applied to the ball. Conversely, if the bat strikes ball at position 2, anticlockwise spin will be applies to the ball. By the same arguments as with the curveball, this creates curvature in flight.
Now, we move on to consider if the bat and ball are not aligned vertically, as shown overleaf.
2 1

Figure XXIV - Misalignment of the bat and ball upon collision. Figure XXIV shows what happens to the ball when the bat is not aligned
vertically with the ball upon collision. In case 1, the case when home runs can be hit, the ball has backspin imparted on to it. As with the golf ball, this backspin increases the distance the ball flies. However, if the angle is too great, the ball will fly very high but not flying very far. This is known in the game as a fly ball. In case 2, the ball flies downwards, and leaves the bat with topspin, reducing distance. This is known in the game as a ground ball.
3.2 Atmospheric Effects on the Flight of the Ball
Many parameters effect the air resistance opposing the flight of the ball, or the
drag force. The magnitude of the drag force is an important factor in determining the distance that a well hit baseball will fly.
In a vacuum, the maximum distance of a fly ball is achieved when the ball is hit at an angle of 45°. However, adding in air resistance makes the situation slightly more complicated. Air resistance gives a spinless ball an acceleration opposite to its velocity vector throughout the duration of the flight. Looking at the vertical component of the air resistance, it is directed downwards as the ball ascends, whilst it is directed upwards as the ball descends. These components cancel, leaving gravity as the only vertical force. Therefore, we can consider the air resistance to be a force directed back toward home plate for a batted baseball. Therefore, the flight of a baseball is asymmetric, dropping at a steeper angle than it rose. We must also notice that, as the air resistance is a force, the effect of drag increases with the time the ball is in the air. To decrease the time that the ball is in the air, we decrease the initial angle of the ball. Therefore, the optimum angle is around 35°.
However, we have not considered the effect of spin on the ball. If the ball is hit so that it rises off the bat (case 1 in figure XXIV), the ball flies with backspin. As with the golf ball, this creates lift, resulting in the optimum angle being reduced to 31°. (ref 11)
Increasing altitude or reducing air pressure, as well as reducing air density, reduces the drag force on the ball, thus increasing distance. Increasing temperature decreases the drag force, and we find that a 10° increase in temperature produces an extra 4 feet of distance in flight (ref. 9). However, if the density is increased, drag is increased, and distance is lost. We also observe that a 1mph following wind increases distance by 3 feet. Therefore, we can see that atmospheric parameters have a great effect on the flight of the batted baseball.
4. Conclusions
5. References
1. R. Watts and T. Bahill, "Keep Your Eye on the Ball - The Science and
Folklore of Baseball", W.H. Freeman and Company, New York, 1990. 2. R.K. Adair, "The Physics of Baseball, Second Edition", HarperPerennial, New
York, 1994. 3. T.P. Jorgensen, "The Physics of Golf, Second Edition", Springer-Verlag, New
York, 1999. 4. T. Asai, T. Akatsuka and S. Haake, Physics World, 11 (1998), 25-27. 5. R. Mehta and D. Wood, "The Aerodynamics of a Cricket Ball", New Scientist,
1980, 442-447. 6. R.K. Adair, "The Physics of Baseball", Physics World, May 1995, 26-31. 7. C. Frohlich, "Aerodynamic Drag Crisis and its Possible Effect on the Flight of
Baseballs", American Journal of Physics, 52 (4), 325-334 . 8. L.L. Van Zandt, "The Dynamical Theory of the Baseball Bat", American
Journal of Physics, 60 (2), 172-181. 9. N. Wanner, " How Far Can You Hit One? - The Science Behind a Home
Run", What's New in the World of Science, Issue 20. 10. A.F. Rex, "The Effect of Spin on the Flight of Batted Baseballs", American
Journal of Physics, 53 (11), 1073-1075. 11. "The Physics of Baseball", Harvard Science Review, Winter 1997 12. H. Brody, "Models of Baseball Bats", American Journal of Physics, 58 (8), 756-
758.
• Two types of airflow, laminar and turbulent, effect the characteristics of the wake region behind the ball. This effects the drag on the ball. • Turbulent boundary layer “sticks” to the ball longer than a laminar boundary layer. • For spinning balls, we have pressure differentials, which induce Magnus forces, causing drift in the path of the ball. • Surface roughness effects Reynolds number at which the drag crisis occurs. Seams on the ball help to complete the transition from laminar to turbulent flow in the boundary layer. • The path of batted baseballs, as well as golf balls, is affected by many factors, such as air density, temperature and wind.
13. H. Brody, "The Sweet Spot of a Baseball Bat", American Journal of Physics, 54 (7), 640-643.
14. J. Kaat, "The Mechanics of a Breaking Pitch", Popular Mechanics, April 1997. Further Reading P.J. Brancazio, "Looking into Chapman's Homer : The Physics of Judging a Fly Ball", American Journal of Physics, 53 (9), 849-855. R.G. Watts and S. Baroni, "Baseball-Bat Collisions and the Resulting Trajectories of Spinning Balls", American Journal of Physics, 57 (1), 40-45. R.G. Watts and E. Sawyer, "Aerodynamics of a Knuckleball", American Journal of Physics, 43 (11), 960-963. F.J. Lopez-Lopez, "Question #48", American Journal of Physics, 64 (9), 1097. D.T. Kagan, "The Effect of Coefficient of Restitution Variations on Long Fly Balls", American Journal of Physics, 58 (2), 151-154. R.G. Watts and R. Ferrer, "The Lateral Force on a Spinning Sphere : Aerodynamics of a Curveball", American Journal of Physics, 55 (1), 40-44. Associated Websites:
• http://www.trms.k12.fulton.ga.net/~jtucker/lessons/sc/curveball/equate.htm
• http://www.majorleaguebaseball.com
• http://www.pgatour.com
• http://www.cricket.org
back to home page