department of medicine quality improvement … qi workshop part 1_1_10...department of medicine...
TRANSCRIPT
Department of Medicine Quality Improvement
Workshop - Part 1
Jennifer S. Myers MD Patti Macolino RN MSN ASQ LSSBB
October 13, 2016

Goal
Support the Department of Medicine fellowship training programs and faculty in educating and
engaging their fellows in meaningful quality improvement work in their specialty
Introductions
Introduce yourself to your tablemates and share what ,if any, experience you have in
quality improvement work

Batalden and Davidoff. Qual Saf Healthcare 2007.
Better Patient
Outcomes
Better Professional
Development
Better Systems
EVERYONE
“Everyone in healthcare has two jobs to do when they
come to work everyday:
To do their work, and improve the work that they do.”

Specific Learning Objectives
• Utilize a structured approach to quality improvement work
• Identify and apply QI tools in order to understand the current condition and root causes of a quality problem in your healthcare setting
• Plan the next steps to move your improvement work forward

44-98,000 deaths per year
from medical errors
Goals Healthcare that is:
Safe Effective Equitable Efficient Timely
Patient-Centered
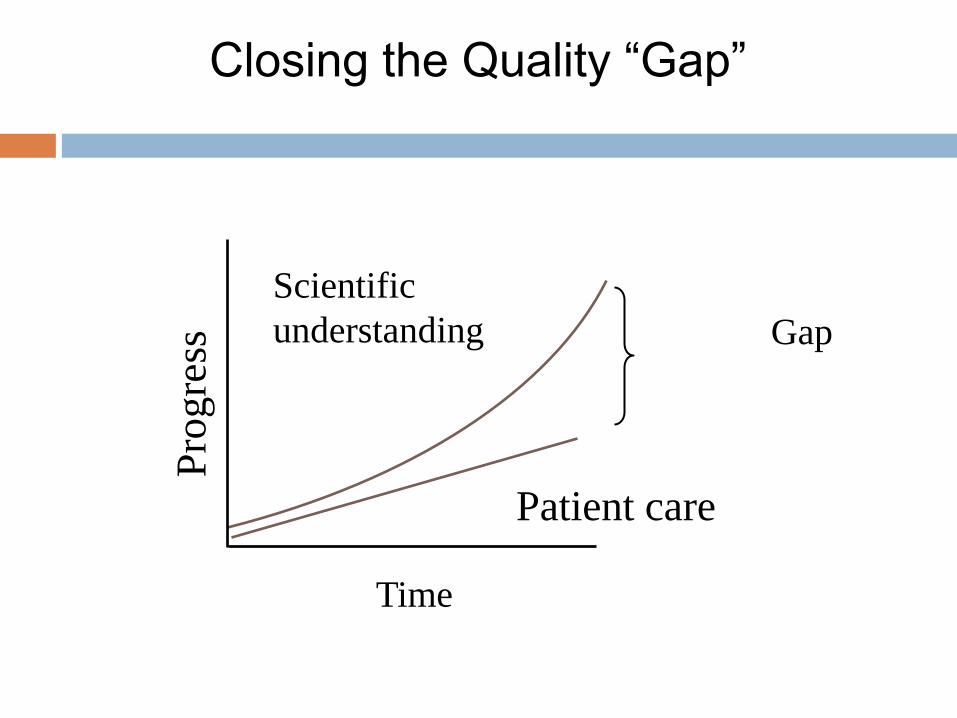
Closing the Quality “Gap”
Gap
Scientific
understanding
Patient care
Pro
gre
ss
Time
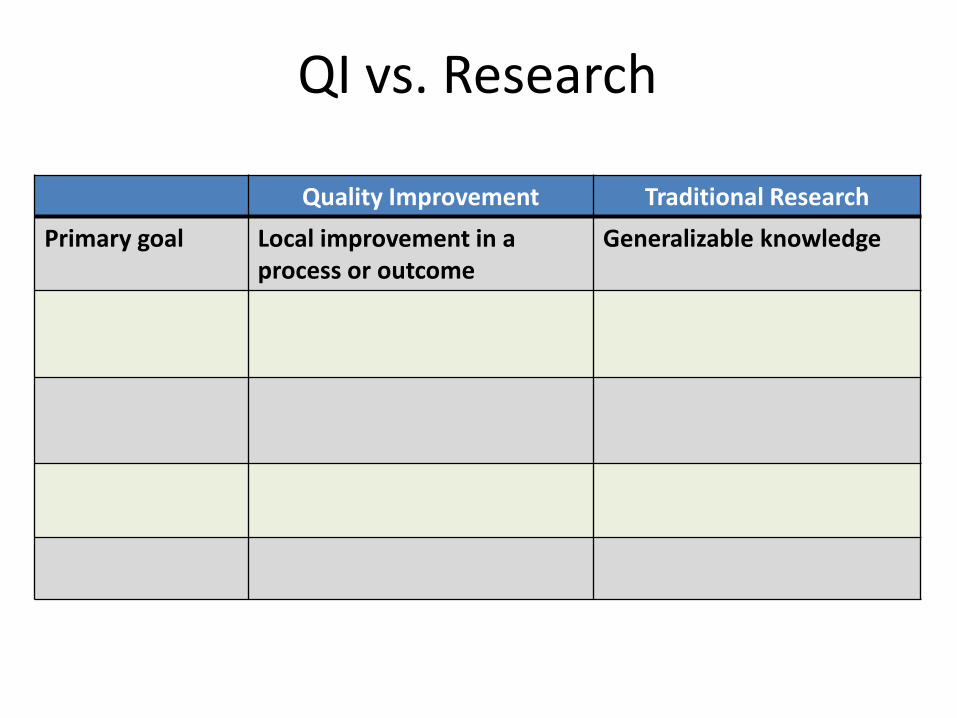
QI vs. Research
Quality Improvement Traditional Research
Primary goal Local improvement in a process or outcome
Generalizable knowledge

QI vs. Research
Quality Improvement Traditional Research
Primary goal Local improvement in process or outcome
Generalizable knowledge
Scope Typically within existing standards of care
Often testing new methods and models
Evaluation Hypothesis driven with systematic data collection
Hypothesis driven with systematic data collection
IRB required No Yes
Possible Secondary Goal
Generalizable knowledge Local improvement in process or outcome
“All improvement requires change, but not all change results in improvement…”

Organize and guide work Provides a roadmap for teachers and learners
We All Need Frameworks
H & P
Research abstract
Curriculum
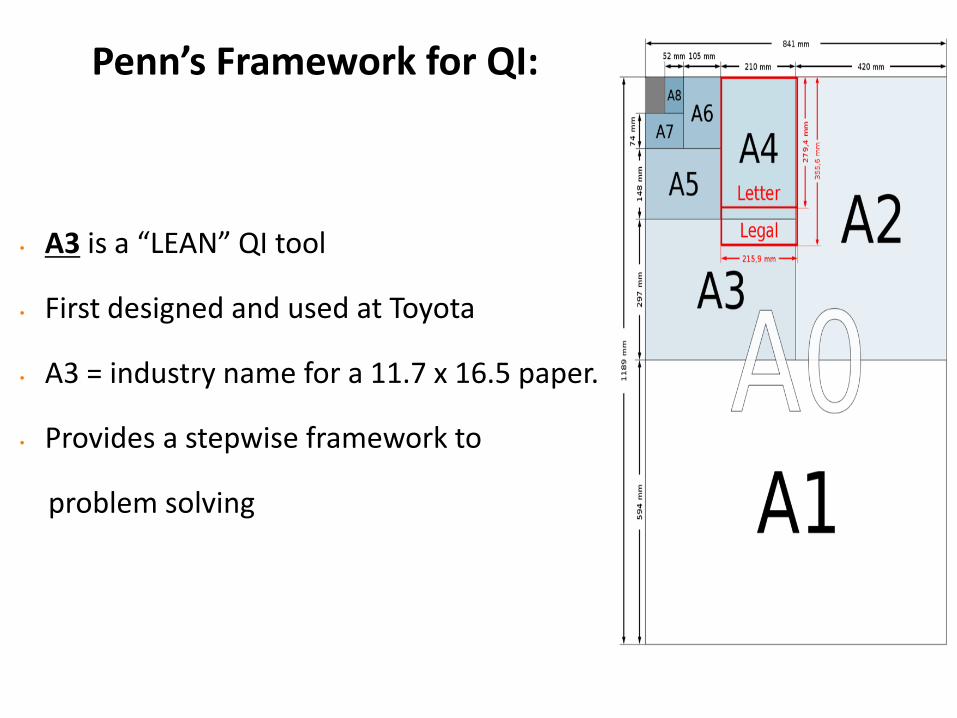
Penn’s Framework for QI:
• A3 is a “LEAN” QI tool
• First designed and used at Toyota
• A3 = industry name for a 11.7 x 16.5 paper.
• Provides a stepwise framework to
problem solving

Problem Statement
Current Condition
Root Causes
Target Condition
Propose & Test Countermeasures
Metrics/Results
Make it Standard Work/Implement Successful Countermeasures
Anatomy of an A3 Roadmap
15
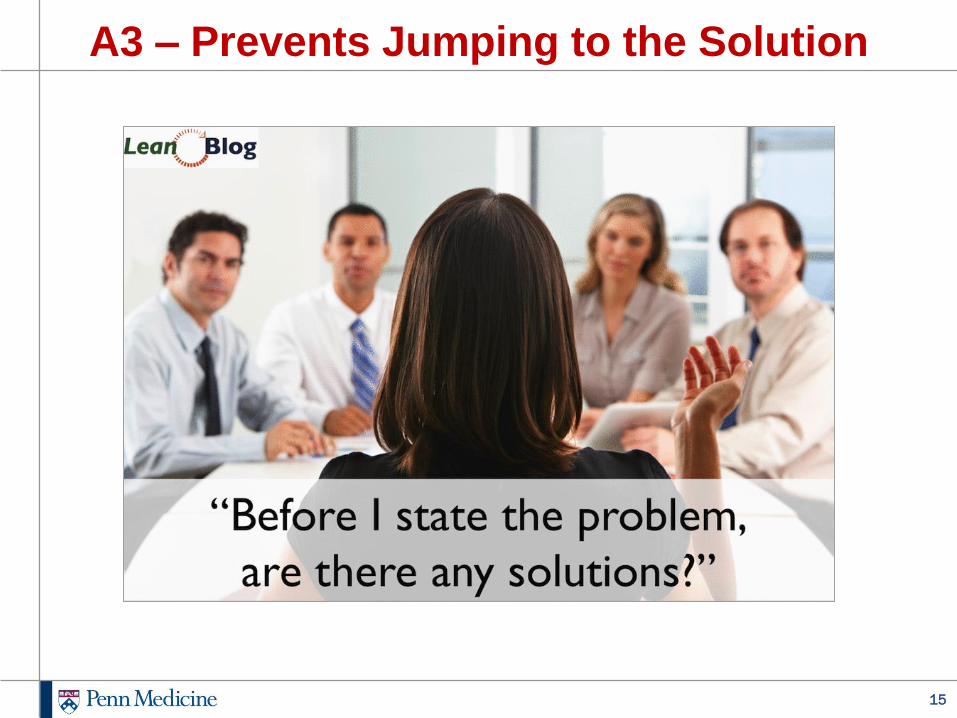
A3 – Prevents Jumping to the Solution
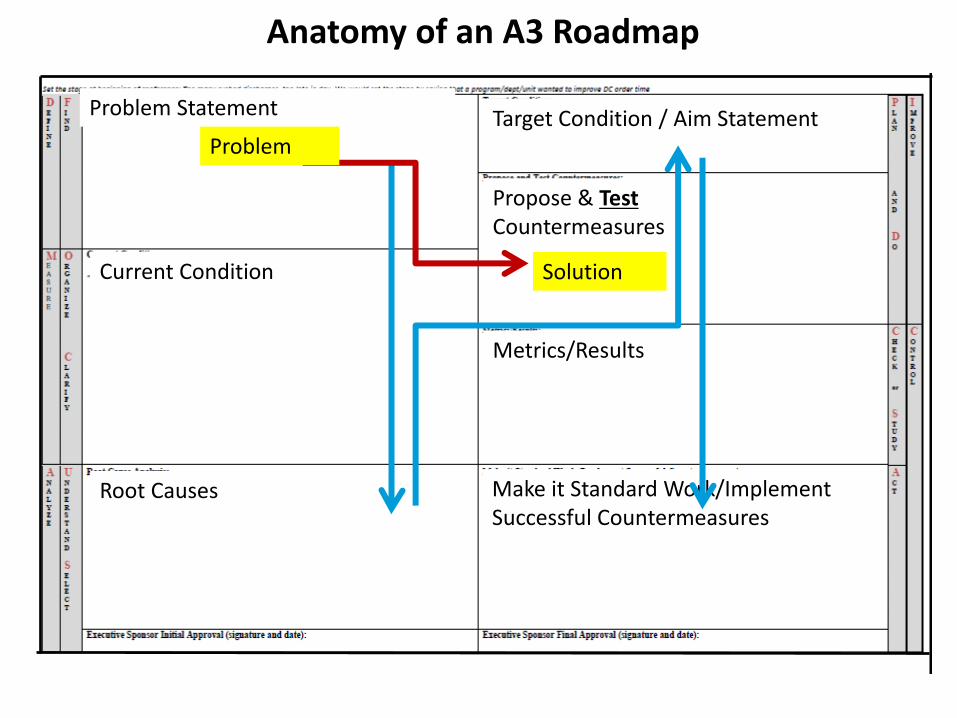
Problem Statement
Current Condition
Root Causes
Target Condition / Aim Statement
Propose & Test Countermeasures
Metrics/Results
Make it Standard Work/Implement Successful Countermeasures
Anatomy of an A3 Roadmap
Problem
Solution

A3 Framework Problem Statement
Target Condition
Current Condition
Propose and Test Countermeasures
Root Causes
Results/Metrics
Make it Standard Work

The Problem (or Opportunity) Statement
Good Problem statements should answer the following
questions:
• What is occurring?
• Where is the problem?
• When did the problem start? (or when did you notice it)
• Extent (Gap) of the problem or opportunity
• Very patient/customer focused
• Address business case, when applicable
• Show why a change is needed
Good problem statements make it easier for others to
understand and care about the problem you wish to solve

Critique this Problem Statement
There are too many patients with bad colonoscopy
preps leading to an increased number of interval
colonoscopies being recommended.

Better Problem Statement (note that this was v6 for this QI team!)
From January through July 2014 in the PCAM
Endoscopy Unit, 15% of patients undergoing
colonoscopy had inadequate prep quality leading to
patients’ needing to undergo an additional, early,
repeat procedures. This rate is outside the standard
benchmark for quality and may be the basis for
negative reimbursement incentives.

The scope assists in defining the work and consists of two questions:
What is the earliest step in the process and the last step in the process that falls into this improvement cycle?
This bounds the work for the team and speeds success
Example: Is it the entire peri-operative process or only from patient registration through to hand-off to OR team?
Colonoscopy Example: only focused on prep quality not re-designing front desk clerk workflow in GI
What is included and excluded in the work?
Included: elective outpatient colonoscopies in PCAM
Excluded: inpatient colonoscopies
Scope

Small Group Activity
Draft Version 1 of your problem statement with
your team members: 7 minutes
Share with larger group
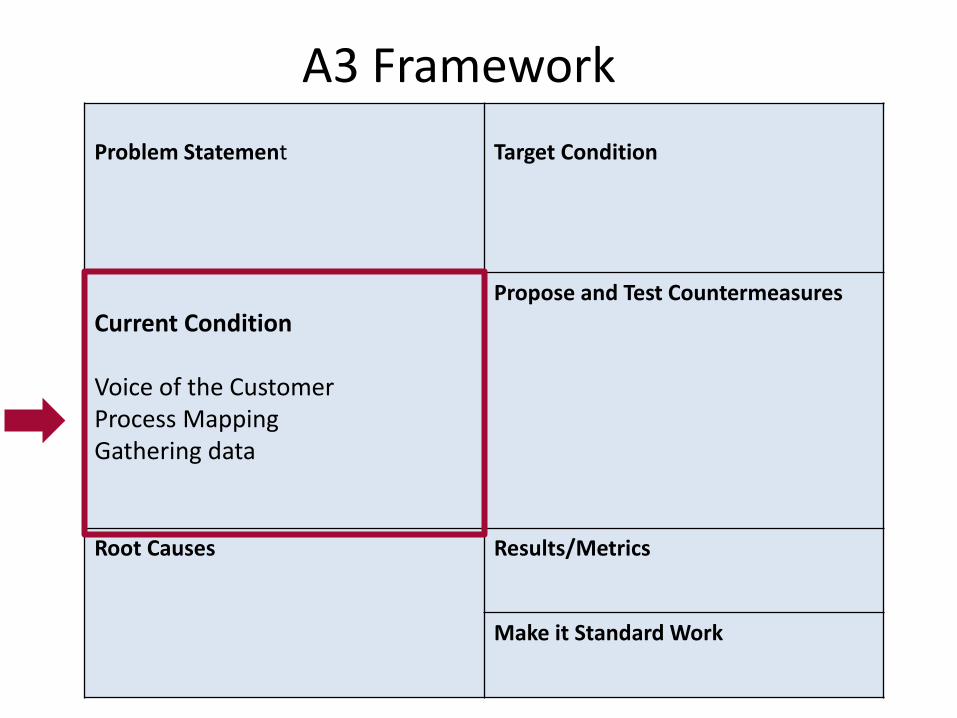
A3 Framework Problem Statement
Target Condition
Current Condition Voice of the Customer Process Mapping Gathering data
Propose and Test Countermeasures
Root Causes
Results/Metrics
Make it Standard Work

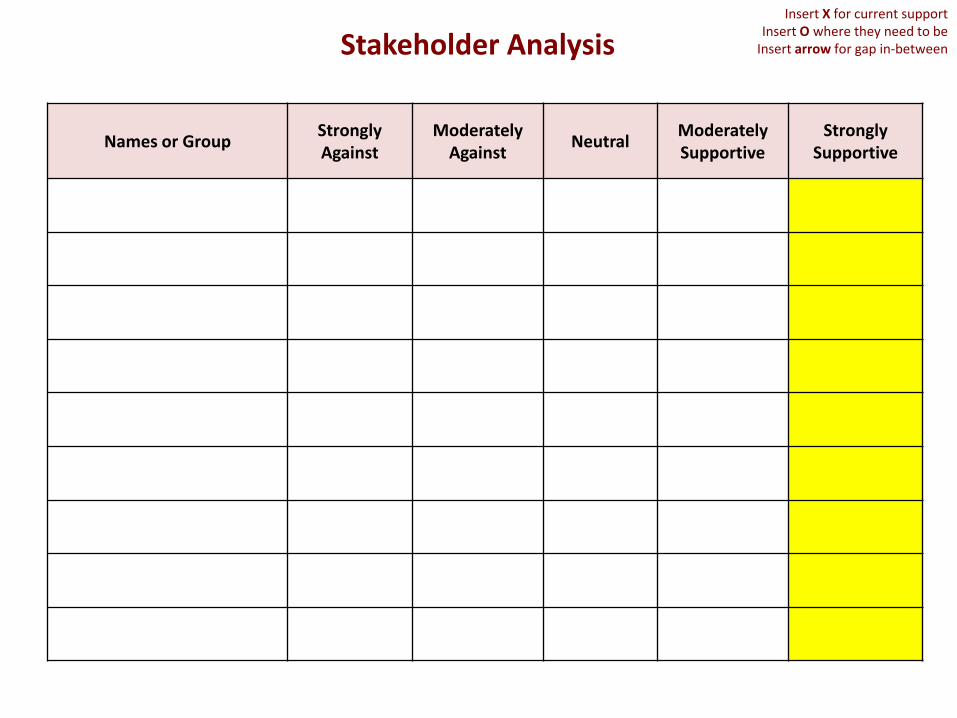
Stakeholder Analysis Tool
Critical tool for QI work
Who has a “stake” in the problem that you wish to
improve?
Do you anticipate them to be a supporter or not?
Complete at the beginning stages of your project
work and come back to it over time
Names or Group Strongly Against
Moderately Against
Neutral Moderately Supportive
Strongly Supportive
Stakeholder Analysis Insert X for current support
Insert O where they need to be Insert arrow for gap in-between
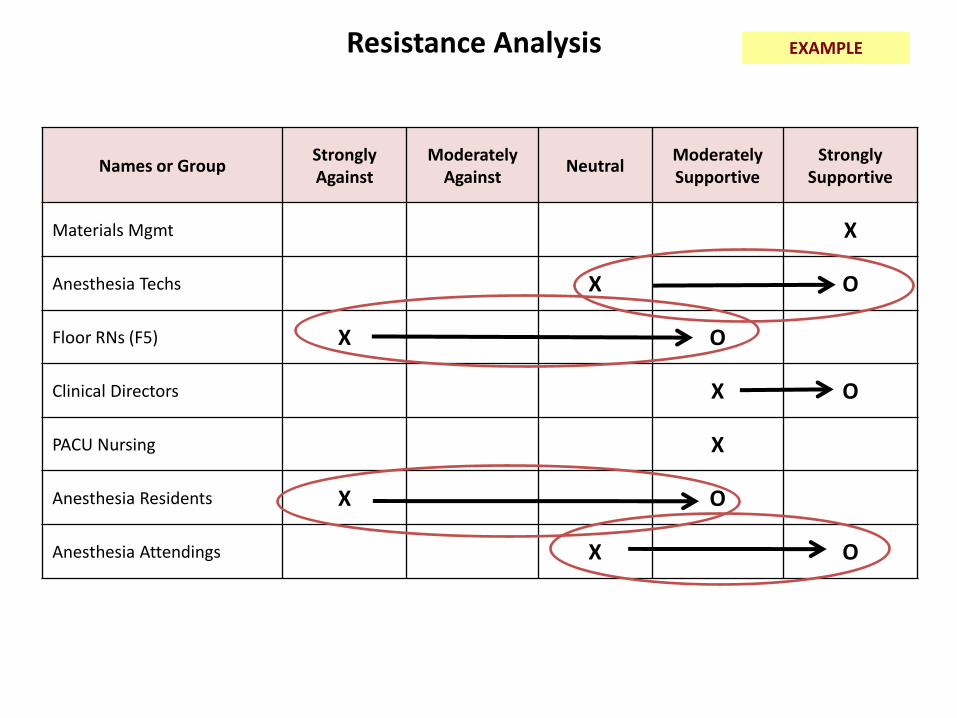
Names or Group Strongly Against
Moderately Against
Neutral Moderately Supportive
Strongly Supportive
Materials Mgmt X
Anesthesia Techs X O
Floor RNs (F5) X O
Clinical Directors X O
PACU Nursing X
Anesthesia Residents X O
Anesthesia Attendings X O
Resistance Analysis EXAMPLE
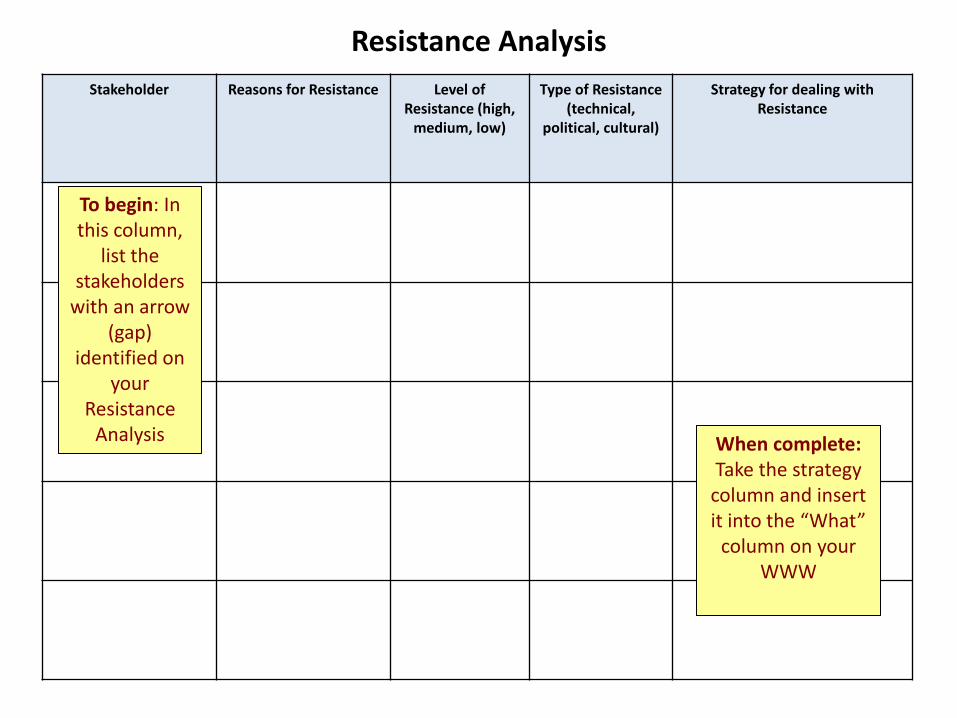
Resistance Analysis
Stakeholder Reasons for Resistance Level of Resistance (high,
medium, low)
Type of Resistance (technical,
political, cultural)
Strategy for dealing with Resistance
To begin: In this column,
list the stakeholders
with an arrow (gap)
identified on your
Resistance Analysis When complete:
Take the strategy column and insert it into the “What”
column on your WWW
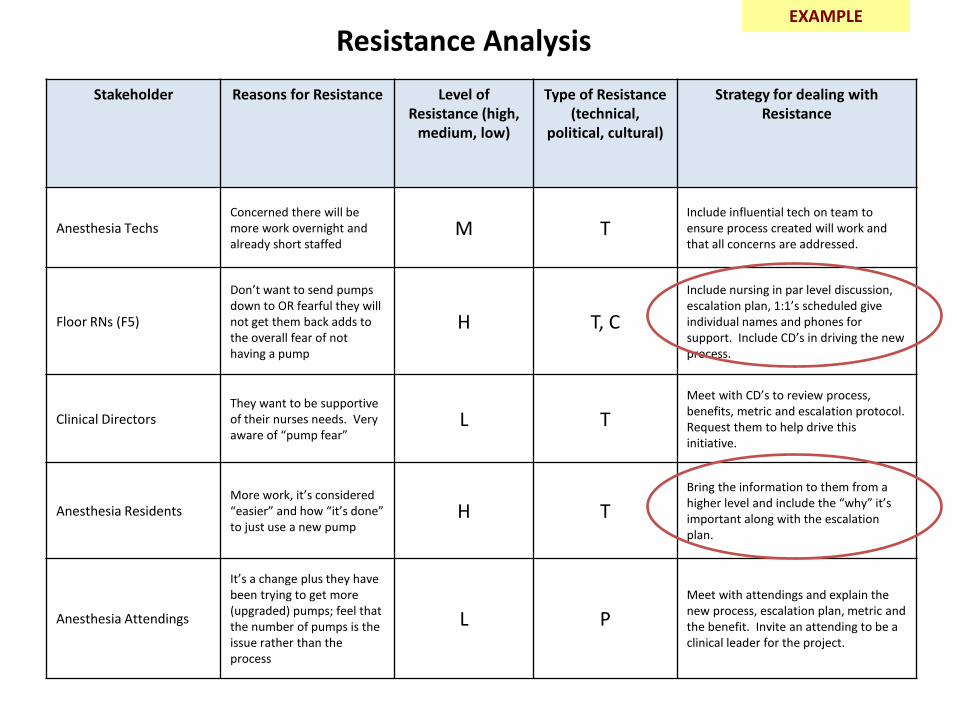
Resistance Analysis
Stakeholder Reasons for Resistance Level of Resistance (high,
medium, low)
Type of Resistance (technical,
political, cultural)
Strategy for dealing with Resistance
Anesthesia Techs Concerned there will be more work overnight and already short staffed
M T Include influential tech on team to ensure process created will work and that all concerns are addressed.
Floor RNs (F5)
Don’t want to send pumps down to OR fearful they will not get them back adds to the overall fear of not having a pump
H T, C
Include nursing in par level discussion, escalation plan, 1:1’s scheduled give individual names and phones for support. Include CD’s in driving the new process.
Clinical Directors They want to be supportive of their nurses needs. Very aware of “pump fear”
L T
Meet with CD’s to review process, benefits, metric and escalation protocol. Request them to help drive this initiative.
Anesthesia Residents More work, it’s considered “easier” and how “it’s done” to just use a new pump
H T
Bring the information to them from a higher level and include the “why” it’s important along with the escalation plan.
Anesthesia Attendings
It’s a change plus they have been trying to get more (upgraded) pumps; feel that the number of pumps is the issue rather than the process
L P
Meet with attendings and explain the new process, escalation plan, metric and the benefit. Invite an attending to be a clinical leader for the project.
EXAMPLE

Stakeholder Analysis vs Quality Improvement Team
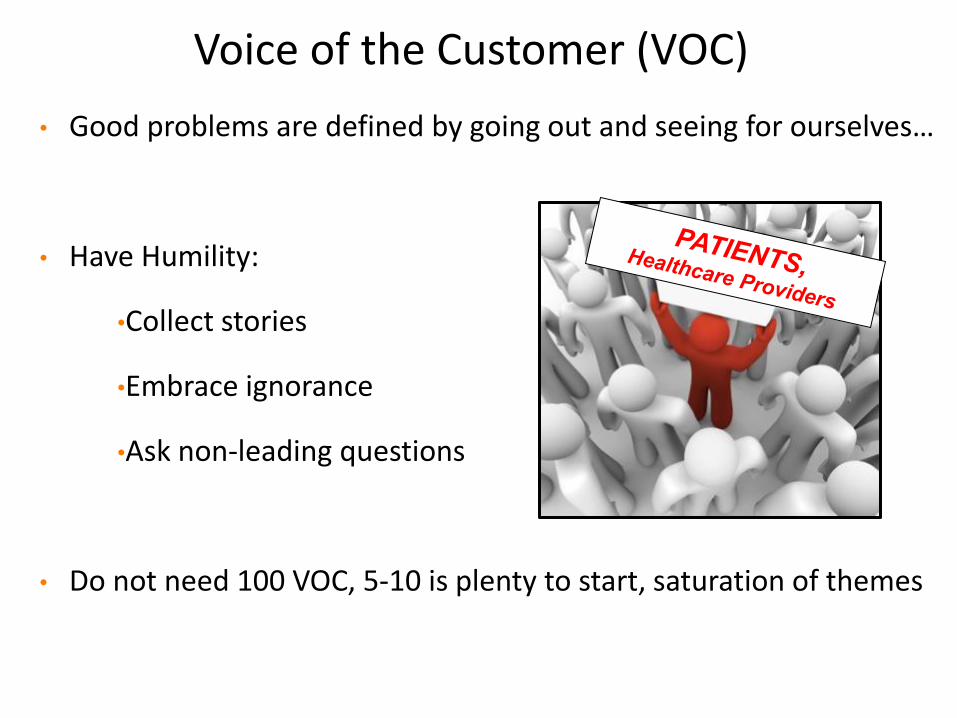
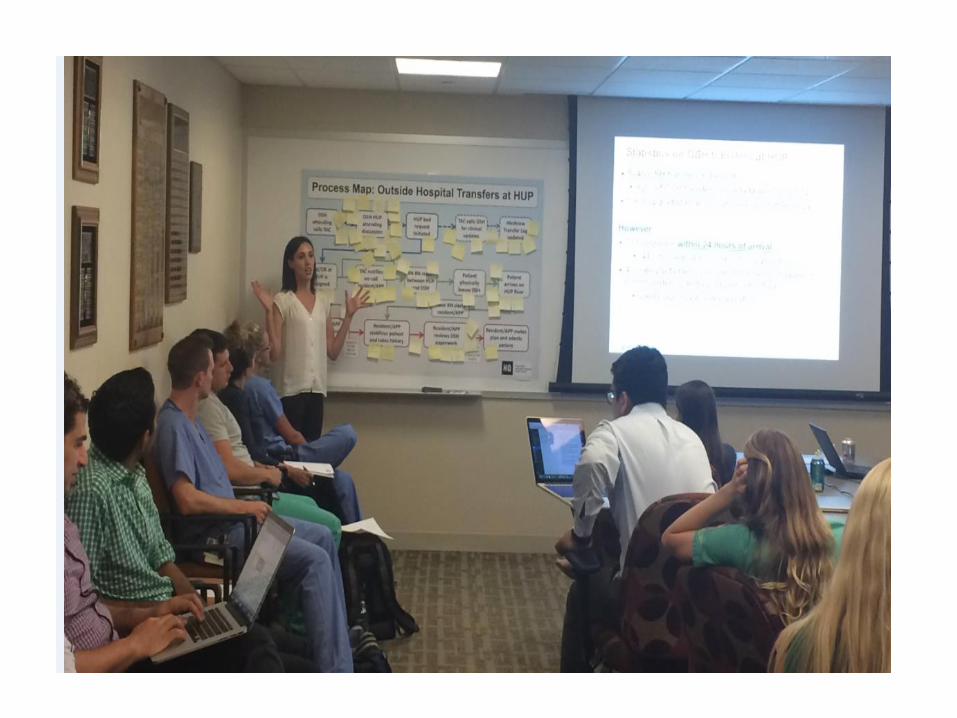
Voice of the Customer (VOC)
• Good problems are defined by going out and seeing for ourselves…
• Have Humility:
•Collect stories
•Embrace ignorance
•Ask non-leading questions
• Do not need 100 VOC, 5-10 is plenty to start, saturation of themes

Collecting VOC
What’s working well?
What’s not working well?
What would you change?
Collate answers/identify themes

Process Maps / Flow Charts
What You Think It is . . .
What It Actually is . . .
What You Would Like it to Be . . .
The struggle is that this is where everyone wants to start.
You MUST GO AND SEE to verify what is really happening out there
Often difficult to persuade people that their BELIEF ≠ REALITY ON THE GROUND

Report Given to Admitting Medicine Provider on 6W
Provider Places Telemetry Order
into CPRS
Telemetry Order Expires at 10am the Next Day
(and subsequently every 24hrs)
Patient Admitted to 6W and Placed on
Telemetry
CPRS Alert Sent to Provider Indicating Need for Order
Renewal
Order Not Renewed
-Telemetry Continued
Physician Reviews
Alert -Telemetry Reordered
Physician Reviews
Alert -
Telemetry Discontinued
6 West Inpatient Telemetry – High-Level Process Map
Alert sent to incorrect provider
Telemetry often continued without active orders
MD’s often not aware of appropriate telemetry guidelines
RN’s often don’t feel empowered to “speak up” about expired orders
Resident MD’s rounding at this time and often not near a computer
MD’s don’t regularly reassess telemetry need during daily rounds
Order often renewed without a true assessment of continued need
If 6W full, patient admitted to ICU
35
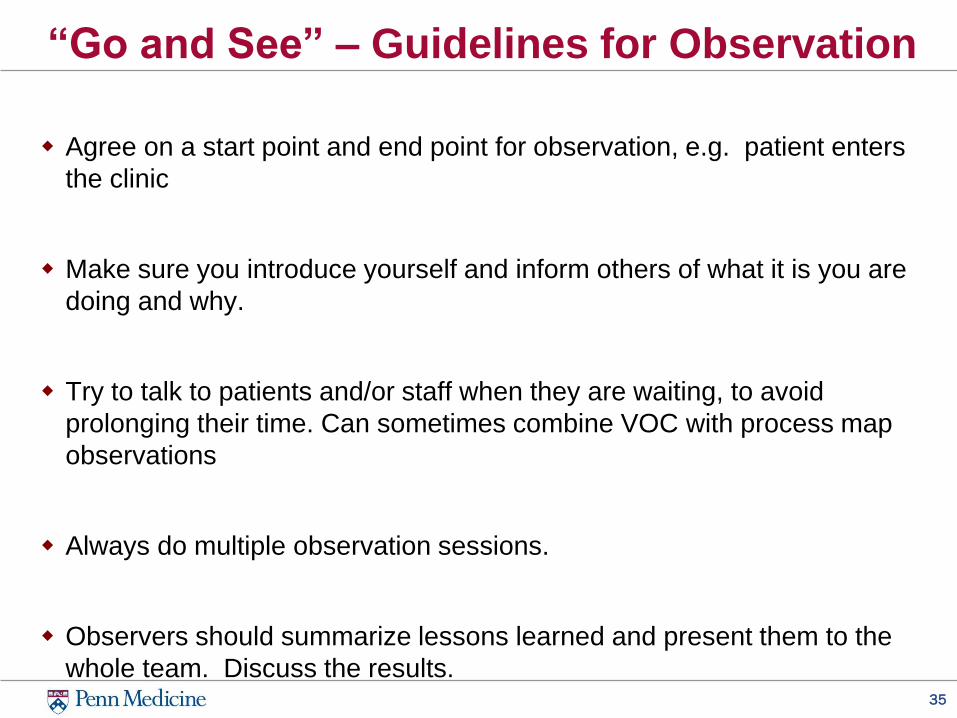
“Go and See” – Guidelines for Observation
Agree on a start point and end point for observation, e.g. patient enters
the clinic
Make sure you introduce yourself and inform others of what it is you are
doing and why.
Try to talk to patients and/or staff when they are waiting, to avoid
prolonging their time. Can sometimes combine VOC with process map
observations
Always do multiple observation sessions.
Observers should summarize lessons learned and present them to the
whole team. Discuss the results.
Data
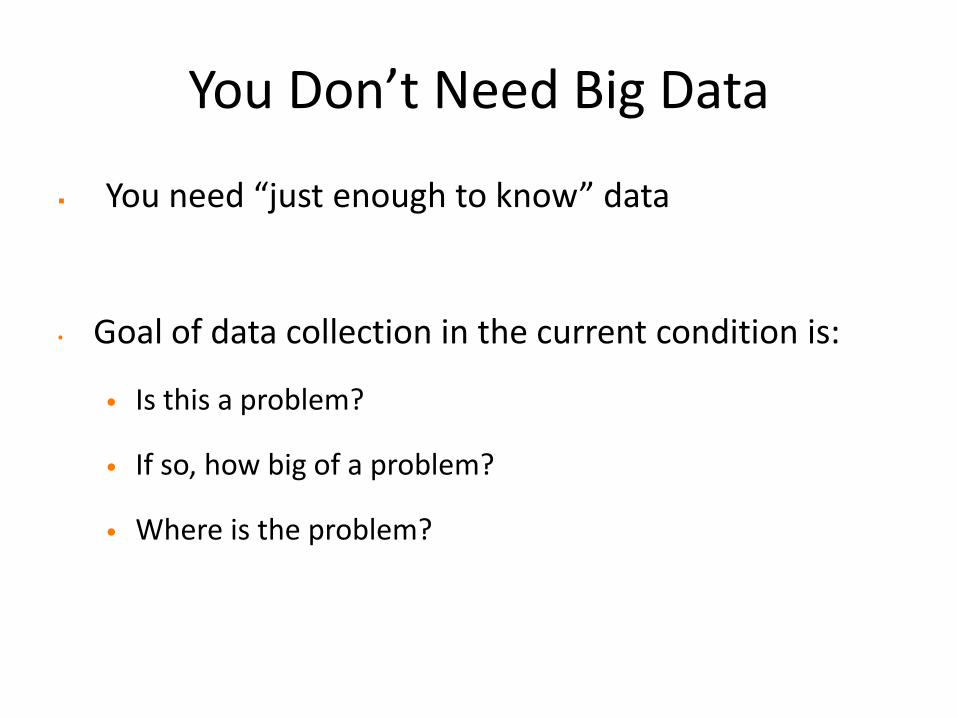
You Don’t Need Big Data
You need “just enough to know” data
• Goal of data collection in the current condition is:
• Is this a problem?
• If so, how big of a problem?
• Where is the problem?
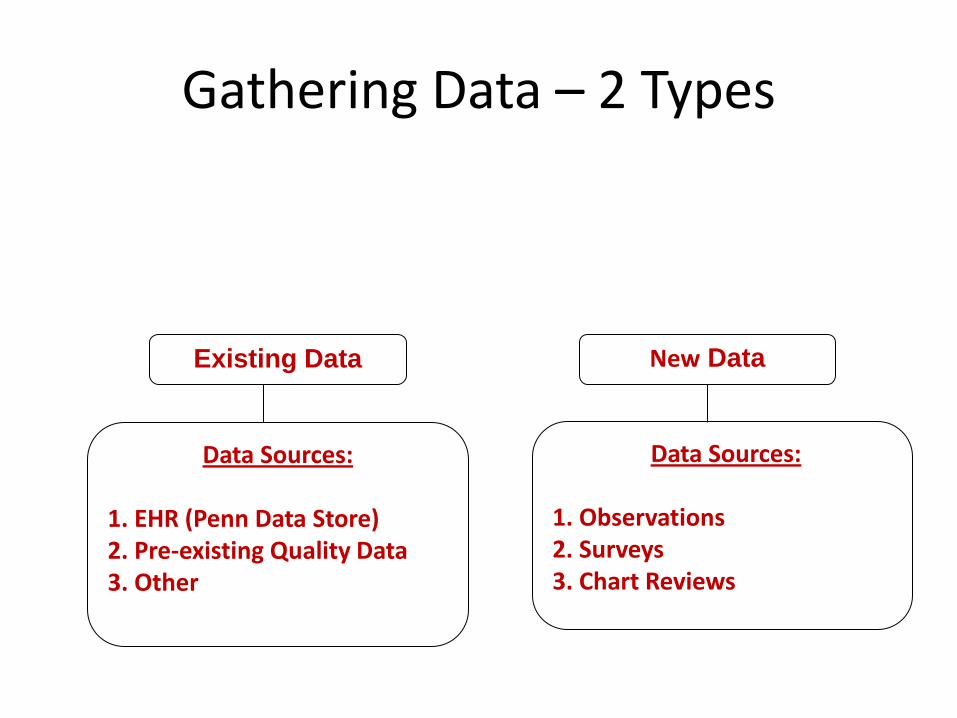
Existing Data New Data
Data Sources:
1. EHR (Penn Data Store) 2. Pre-existing Quality Data 3. Other
Data Sources:
1. Observations 2. Surveys 3. Chart Reviews
Gathering Data – 2 Types

Discuss the Data Collection Plan for
understanding the current state of your quality
problem
Small Group Activity

40
Defining Your Current State – Data Collection Plan
Voice of the Customer: Who Do You Need to Talk to?
Process Mapping: What process(es) could you observe?
Data
What data already exists that would be important to look at?
What data could you collect?

A3 Framework Problem Statement (Purpose)
Target Condition (Countermeasure)
Current Condition (Process)
Propose and Test Countermeasures
Root Causes (Probable Causes) Fishbone Diagram 5-whys Pareto Chart
Results/Metrics (Measure success)
Make it Standard Work
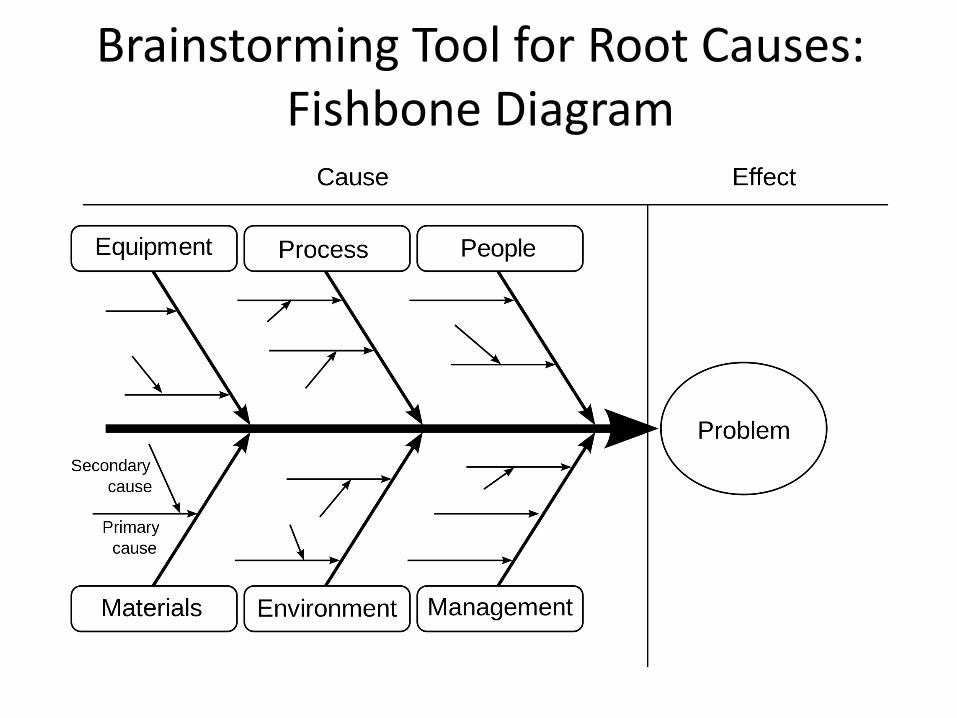
Brainstorming Tool for Root Causes: Fishbone Diagram


Why were you late to the meeting today, Jen?
I was preparing for 2 other meetings that I have this afternoon and lost track of time (symptom)
Why was that?
I didn’t have time last night to prepare (excuse)
Why was that?
I was working on another deadline and didn’t have time (blame)
Why was that? Because I have too many projects at work (root cause)
Why is that?
Because I have trouble saying “no” (true root cause)
5 Whys: A Quality Improvement Tool

• The simple idea is to keep asking "Why" (usually five times) to ensure that the root cause(s) of a problem are fully understood.
• The reasoning is that the result of each time the Why is asked gives a different answer, in essence peeling back the onion as follows:
– First Why—Symptom – Second Why—Excuse – Third Why—Blame – Fourth Why—Cause – Fifth Why—Root Cause
5 Whys (use separately or in concert with
Fishbone)
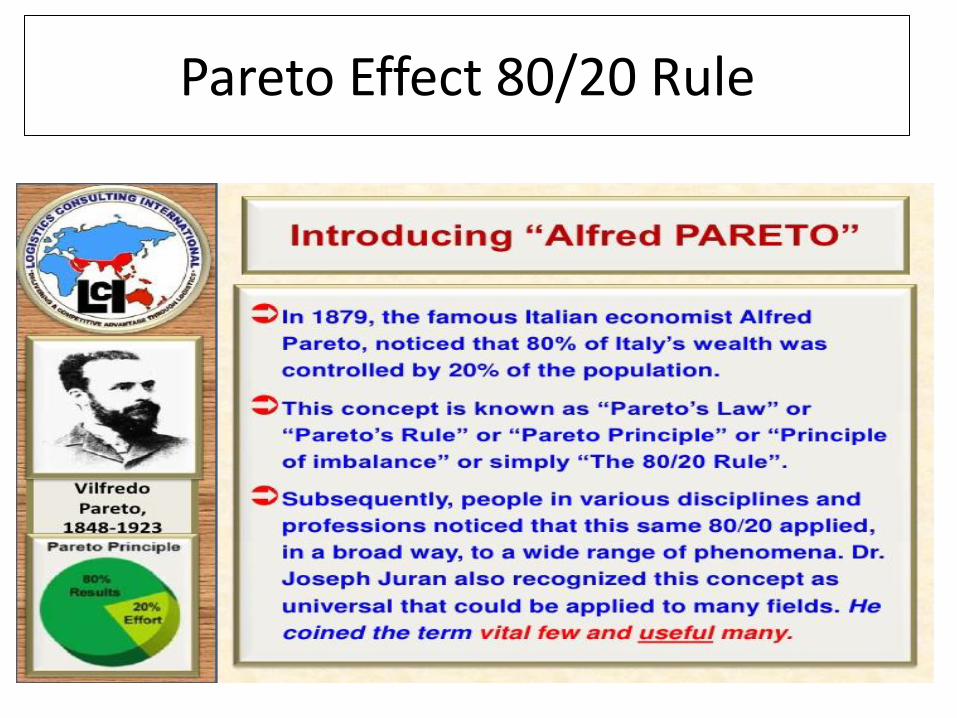
Pareto Effect 80/20 Rule
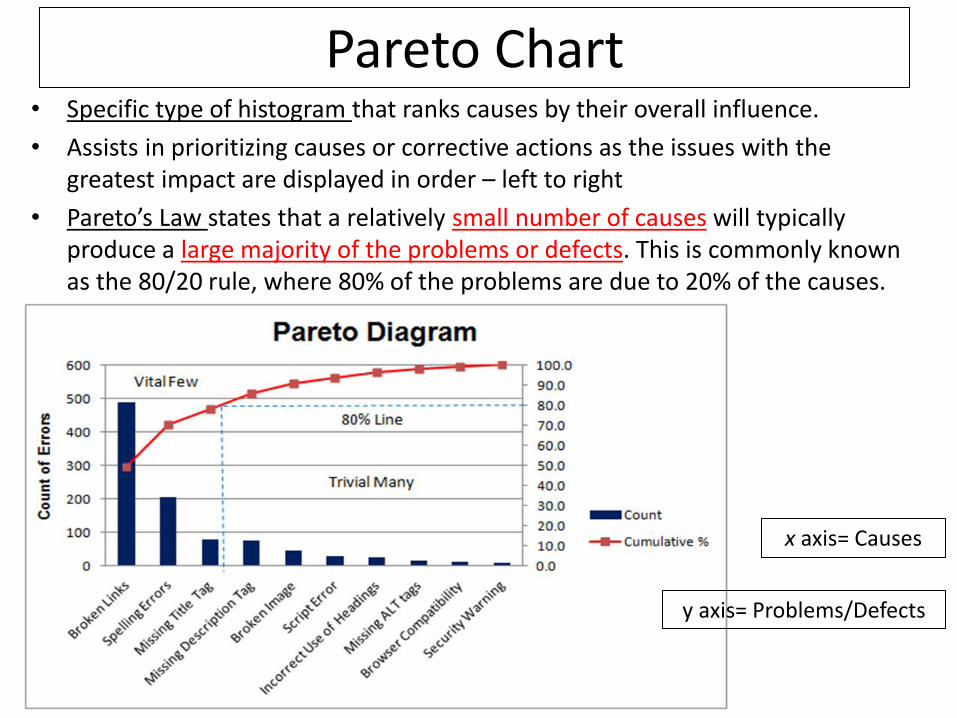
Pareto Chart • Specific type of histogram that ranks causes by their overall influence.
• Assists in prioritizing causes or corrective actions as the issues with the greatest impact are displayed in order – left to right
• Pareto’s Law states that a relatively small number of causes will typically produce a large majority of the problems or defects. This is commonly known as the 80/20 rule, where 80% of the problems are due to 20% of the causes.
x axis= Causes
y axis= Problems/Defects
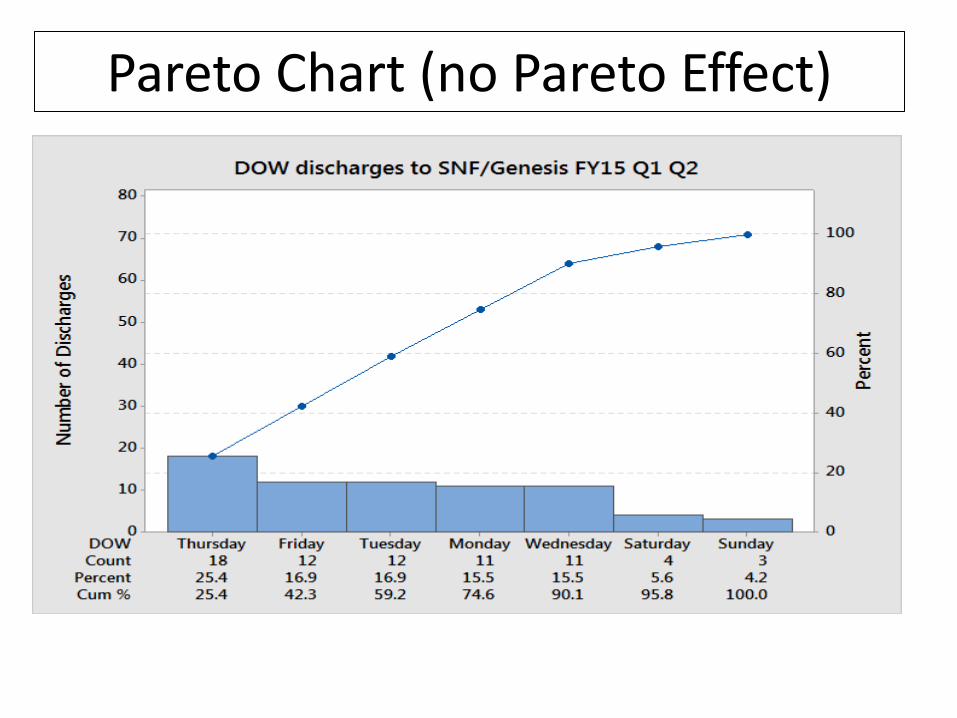
Pareto Chart (no Pareto Effect)

Histogram = Frequency • A type of bar chart showing a distribution of variables. • Represents each attribute or characteristic as a column and
the frequency of each attribute or characteristic occurring as the height of the column – look for patterns, helps visualize current state
8:44:30 AM
8:38:30 AM
8:32:30 AM
8:26:30 AM
8:20:30 AM
8:14:30 AM
8:08:30 AM
8:02:30 AM
3.0
2.5
2.0
1.5
1.0
0.5
0.0
Mean 0.3499
StDev 0.006481N 14
FP12 Truck Arrival Time M-F
Freq
uenc
y
Normal
Worksheet: Worksheet 1
Histogram of FP12 Breakfast Truck Arrival Time
Expectation is 8:00-8:15
arrival
Mean 8:23:51 AM

Project and Team Management: Essential for QI Work
Establish Team Meetings
Create Project Management Plan
Who What When Status
Sara and John Interview nurses By 11/1/16 In progress
Lauren Observe process and make v1 of process map
Week of 10/17 in clinic
Mike Discuss with faculty
At Oct faculty meeting 10/24
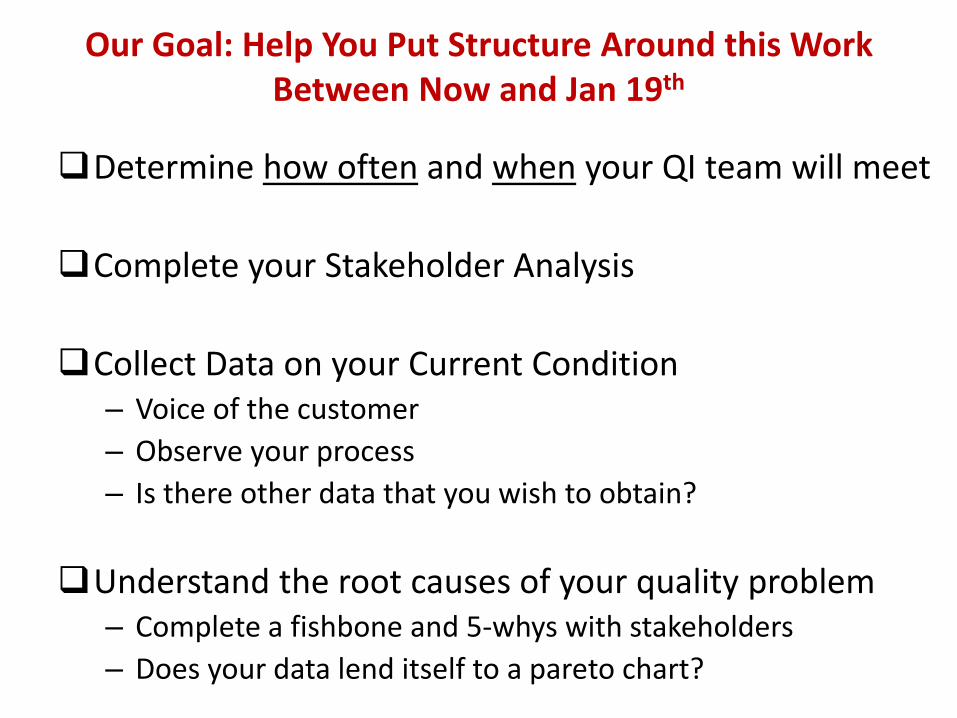
Our Goal: Help You Put Structure Around this Work Between Now and Jan 19th
Determine how often and when your QI team will meet
Complete your Stakeholder Analysis
Collect Data on your Current Condition – Voice of the customer
– Observe your process
– Is there other data that you wish to obtain?
Understand the root causes of your quality problem – Complete a fishbone and 5-whys with stakeholders
– Does your data lend itself to a pareto chart?
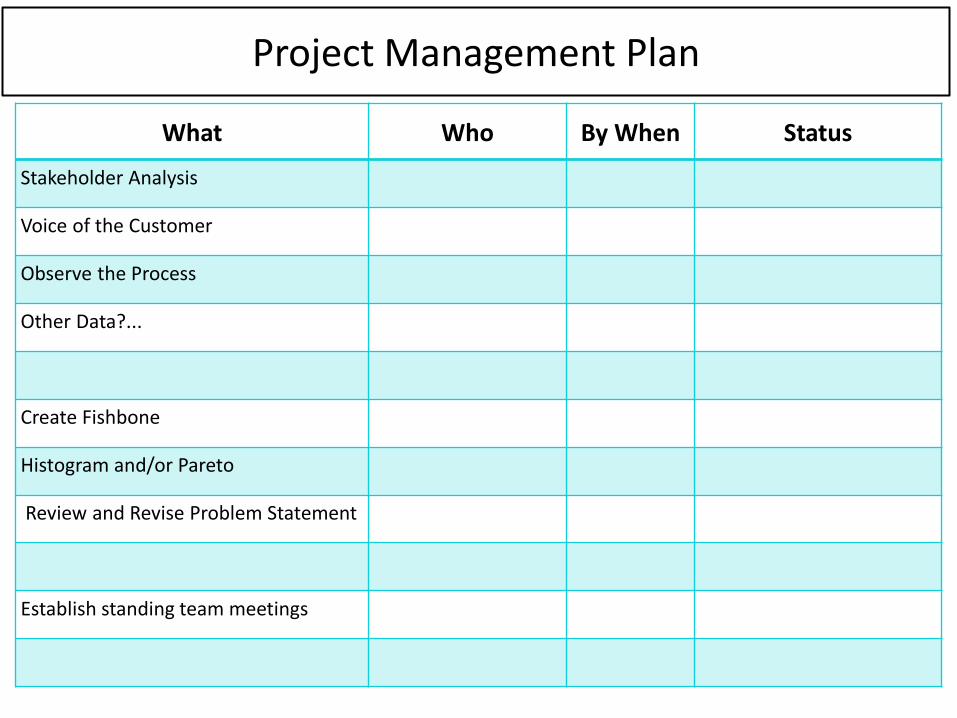
Project Management Plan
What Who By When Status
Stakeholder Analysis
Voice of the Customer
Observe the Process
Other Data?...
Create Fishbone
Histogram and/or Pareto
Review and Revise Problem Statement
Establish standing team meetings
Complete your project management plan as a team
Small Group Activity
Final Thoughts
• Complete the evaluation (blue paper)
• All materials from today are on medhub
• Don’t hesitate to contact us at any time with questions or if you get stuck- phone, email, meeting
• We will see you all again as a group on January 19, 2017!