department of health management of nhs hospital productivity · management of nhs hospital...
TRANSCRIPT
Department of Health
Management of NHS hospital productivity
RepoRt by tHe ComptRolleR anD auDitoR GeneRal
HC 491 SeSSion 2010–2011
17 DeCembeR 2010

The National Audit Office scrutinises public spending on behalf of
Parliament. The Comptroller and Auditor General, Amyas Morse, is an
Officer of the House of Commons. He is the head of the National Audit
Office which employs some 900 staff. He and the National Audit Office
are totally independent of Government. He certifies the accounts of all
Government departments and a wide range of other public sector bodies;
and he has statutory authority to report to Parliament on the economy,
efficiency and effectiveness with which departments and other bodies
have used their resources. Our work leads to savings and other efficiency
gains worth many millions of pounds: £890 million in 2009-10.
Our vision is to help the nation spend wisely.
We apply the unique perspective of public audit to help Parliament and government drive lasting improvement in public services.
Ordered by the House of Commons to be printed on 16 December 2010
Report by the Comptroller and auditor General HC 491 Session 2010–2011 17 December 2010
London: The Stationery Office £14.75
This report has been prepared under Section 6 of the National Audit Act 1983 for presentation to the House of Commons in accordance with Section 9 of the Act.
Amyas Morse Comptroller and Auditor General
National Audit Office
15 December 2010
Department of Health
Management of NHS hospital productivity

In 2000 the Department of Health published the NHS Plan, a ten-year vision for reforming the NHS. The expectation was that a significant increase in NHS budgets would drive systemic change leading to improvements in the quality of care and increased NHS productivity.
© National Audit Office 2010
The text of this document may be reproduced free of charge in any format or medium providing that it is reproduced accurately and not in a misleading context.
The material must be acknowledged as National Audit Office copyright and the document title specified. Where third party material has been identified, permission from the respective copyright holder must be sought.
Printed in the UK for the Stationery Office Limited on behalf of the Controller of Her Majesty’s Stationery Office2406150 12/10 STG
Contents
Summary 4
Part One Productivity measurement in NHS hospitals 11
Part TwoNational initiatives to improve hospital performance 22
Part ThreeHospital performance in improving productivity 31
Part FourThe new national challenge to deliver improved productivity 38
Appendix OneMethodology 40
The National Audit Office study team consisted of:
Andy Fisher, Candida Owusu-Apenten, Will Palmer, Rowena Tozer, with the assistance of James Booth, Michael Donaldson, Mark Glover, Zahir Nowaz, Dan Ward, and Heather Whitver, under the direction of Karen Taylor.
This report can be found on the National Audit Office website at www.nao.org.uk/NHS-Productivity-2010
For further information about the National Audit Office please contact:
National Audit Office Press Office 157-197 Buckingham Palace Road Victoria London SW1W 9SP
Tel: 020 7798 7400
Email: [email protected]
Website: www.nao.org.uk
Twitter: @NAOorguk

4 Summary Management of NHS hospital productivity
Figure 1How NHS productivity is measured
NHS productivity is measured as the ratio between the volume of resources going into the NHS (inputs) ¬
and the quantity of healthcare provided by the NHS (outputs). If inputs rise faster than outputs, then productivity goes down.
Productivity is focused on the measurement of inputs and outputs that are directly in the control of the ¬
organisation that produces them, rather than the outcomes that are not wholly within their control. For instance, a hospital can control the time a patient waits for an operation, but cannot fully control their long-term health.
The most authoritative measure of productivity is produced by the Office for National Statistics (ONS). ¬
In its productivity index, inputs are measured so as to remove the effects of pay and price changes and instead focus on growth in the volume of inputs. The outputs are adjusted to reflect their relative cost and their quality.
The ONS measure evaluates whether the NHS is getting more from its physical resources (such as staff ¬
and equipment) and does not directly capture the economy with which these resources are procured (such as staff pay or price of drugs). ‘Labour Productivity’ is a more narrow measure that looks at the ratio between number of staff and quantity of outputs, and so does not directly measure either the cost or volume of non-labour inputs, such as healthcare equipment.
Measuring productivity is difficult – in particular, adjusting for quality change is challenging – and there ¬
has been only limited useful work in other countries. Efforts to compare productivity of NHS hospitals to other organisations are made difficult by a lack of data and directly comparable bodies.
ONS acknowledges there are limitations to its measure. In particular, the adjustment of outputs: ¬
does not cover all aspects of quality; is based on limited information; and is sensitive to the weighting of the different facets of quality included in the index.
Outputs
NHS services activity e.g hospital procedures and admissions
Weighted for cost
Input
Staff costs
Goods and services
Use of capital resources
Adjusted for inflation
Productivity
Quality
Post-operative survival rates
Hospital waiting times
Outcomes from patient experience
Adjusted for
=
Source: National Audit Offi ce
Management of NHS hospital productivity Summary 5
Summary
In 2000 the Department of Health (Department) published the NHS Plan, a ten-year 1 vision for reforming the NHS. The Plan argued that the NHS was failing to deliver because it had been underfunded, and set out to substantially increase funding in order to meet public expectations for: more, better paid staff using new ways of working; reduced waiting times; high quality care centred on patients; and improvements in local healthcare buildings. The Plan set out the systemic problems of the NHS, such as a lack of national standards and clear incentives and levers to improve performance, and also outlined the expectation that the NHS would continuously improve its efficiency, productivity and performance.
NHS productivity is the measure that describes the relationship between inputs 2 (such as staff and clinical supplies) and outputs (healthcare activity adjusted for quality) (Figure 1). In the NHS the term ‘productivity’ is widely used but often confused with other terms like economy, efficiency and value for money. Between 2000-01 and 2010-11, NHS expenditure will have increased by 70 per cent to £102 billion from £60 billion. The Department explained that much of the additional funding was intended to be used to meet the key public expectations and would not initially be matched by a commensurate increase in outputs.
The Department’s implementation of the NHS Plan has comprised three stages. 3 The first was about building workforce, physical capacity and tackling issues of major concern to the public, such as access. Between 2004 and 2007, the Department introduced levers to enable reform, such as: choice, more freedom for providers, and better financial systems. In the final stage, from around 2008, the NHS was expected to use the additional capacity and the various levers to transform services to deliver high quality care for patients and value for money for the taxpayer.
As over 40 per cent of NHS expenditure is accounted for by acute NHS and 4 foundation hospital trusts (hospitals), improving hospital performance is central to achieving the expectations in the NHS Plan. The Department expected to improve the quality and efficiency of hospital care through: national performance targets to reduce waiting times and improve patient outcomes; national pay contracts involving above inflation pay increases designed, in part, to deliver productivity improvements of between 1.1 and 1.5 per cent a year; and the commissioning of hospital services through a national tariff system called Payment by Results.

6 Summary Management of NHS hospital productivity
The National Audit Office has published two reports on pay modernisation 5 in hospitals, which included assessments of progress in meeting the productivity improvements. Our 2007 report on the new consultants’ contract concluded that it was too early to tell whether productivity had improved. Our 2009 report on Agenda for Change highlighted that the Department had not carried out a specific exercise to demonstrate the productivity improvements and hospitals had not attempted to measure the resulting efficiency or productivity gains.
In November 2009, the NHS Chief Executive announced that, in response to the 6 economic downturn and increasing demand for healthcare, the NHS and Department would need to deliver between £15 and 20 billion of efficiency savings per year by 2013-14 to be reinvested in health services. Around 40 per cent of these savings are expected to come from driving efficiency in hospitals. To support NHS organisations to improve quality of care while making these savings, the NHS Chief Executive also launched the national Quality, Innovation, Productivity and Prevention (QIPP) challenge.
This report examines how productivity in hospitals in England has changed 7 over the last ten years, and the effectiveness of the Department’s initiatives in driving productivity in hospitals. It also assesses how well placed the NHS is to deliver improvements in hospital productivity. Our evaluation is based on both the outcome – whether hospital productivity has changed (Part One) – and the implementation of the national initiatives that the Department expected to influence productivity (Part Two). Part Three examines the variations in hospitals’ efficiency and approaches to productivity, to provide an indication of the scope for improvement. The report concludes with a discussion of the risks associated in delivering the QIPP challenge (Part Four). In this report, we look at both the factors affecting the Office for National Statistics measure of productivity and also broader elements of productivity, such as staff pay, which significantly affect the value for money of expenditure in hospitals. Our methodology is summarised in Appendix One. A more detailed methodology is on our website at www.nao.org.uk/NHS-Productivity-2010.
Key findings
The most authoritative national measure shows a decline in hospital productivity
Figures produced by the Office for National Statistics estimate that, since 8 2000, total UK NHS productivity decreased by an average of 0.2 per cent per year; however, productivity in hospitals fell by around 1.4 per cent per year. Over the last ten years, in line with the NHS Plan, significantly more money has been spent in hospitals. This increased funding has paid for more, better paid staff, and extra goods and services. Hospital activity – adjusted to reflect improvements in the quality of care – has not risen at the same rate as these additional resources, indicating that productivity has declined. However, the adjustments for quality are challenging and remain at an early stage of development due largely to the lack of data on health gains. Also, productivity might initially be expected to fall in periods of rapid input growth as any resulting increase in output may be slower to achieve.

Management of NHS hospital productivity Summary 7
The Department has focused on delivering the Government’s ambition for improved performance within an agreed budget
The increased money going into NHS hospitals has helped deliver more, 9 better paid staff, reduced waiting times, higher quality care and improved hospital facilities. Until the end of 2009, the Department has focused on delivering national priorities – through a combination of targets, performance management, incentives and guidance – within a fixed budget. This has resulted in improvements in, for example: inpatient median waiting times from 12.9 weeks in 2000 to 4.3 weeks in 2010; outpatient waiting times from 4.8 weeks in 2005 to 2.7 weeks in 2010; and the percentage of patients treated in A&E within four hours from 78 per cent in 2003 to 98 per cent in 2009. The Department argues that it has not performance managed measures of productivity directly. It has focused on costing expenditure pressures and performance targets, and requiring the NHS to deliver these within an agreed budget. The Department has not set specific targets for productivity but built in expectations for efficiency improvements into the levels of funding provided to Primary Care Trusts and hospitals.
NHS pay contracts implemented nationally since 2003 have increased 10 hospital costs and are not always used effectively to drive productivity. Since we reported on the Consultant Contract and Agenda for Change, we have not been able to identify the widespread cultural shift in hospitals that we suggested was needed if the contracts were to be used to optimise productivity. The Department intended, for example, that consultant job planning would give hospital managers the opportunity to align consultant activity with hospital objectives; however, few hospitals have used job planning or staff appraisal systems to demonstrably improve productivity. Data show that there have been improvements in the trends for measures of labour productivity since the contracts were introduced, and the Department believes there is a plausible link between these improvements and the introduction of the contracts.
The Department’s process of setting prices under the Payment by Results 11 system has promoted some efficient practice. Recent evidence suggests that national tariffs have driven reductions in length of stay and an increasing proportion of operations undertaken as day surgeries. However, the Department’s own hospital-level efficiency index shows substantial variation, and the tariff adjustment to account for assumed efficiency improvements is offset by uplifts to account for inflationary cost pressures, such as those resulting from the national pay contracts.
There have been delays in rolling out the national tariff to all hospital activity 12 and the quality of information used to pay hospitals is variable. The original intention was that by 2008 all commissioning would use national tariffs; however, in 2010 around 40 per cent of hospitals’ income is not covered by Payment by Results. Reports by the Audit Commission highlighted significant variation in hospitals’ cost and activity data, which are used for setting and applying the tariff. In 2010, the Department introduced the concept of best practice tariffs (paying hospitals for evidence based care), piloted on four common procedures with a view to expanding its use in future.

8 Summary Management of NHS hospital productivity
Other Departmental initiatives to improve productivity, based on sharing 13 innovation and good practice, have yet to be fully evaluated and remain insufficiently used within and across hospitals. The Department has sponsored the development and sharing of good practice, for example through the NHS Institute for Innovation and Improvement (NHS Institute). There are many examples where hospitals have implemented good practice to help improve their productivity, such as: electronic job planning; “Productive Ward” and “Productive Operating Theatre” (part of the NHS Institute’s ‘productive’ series); and initiatives to help redesign patient pathways. The implementation of good practice, however, is seldom comprehensive or consistent within a whole hospital and innovation is often not adopted because of a lack of evidence or scepticism about the costs and benefits.
Hospitals have not focused sufficiently on driving productivity
The hospital managers we spoke to say they have primarily concentrated on 14 meeting national performance targets whilst maintaining financial balance, and not specifically on optimising productivity. The national focus on quality of care has meant that clinical staff have not been performance-managed with regard to the cost or efficiency of their activities. We found that hospital managers do not always bring performance and financial data together in a way that enables them to fully understand the relationship between the money they spend and the care they provide.
There are substantial variations in hospital costs and activity, but not all 15 hospitals use this information effectively to identify efficiency savings. Variations in performance exist in other health care systems and in private sector companies. The Department is aware of the variations in hospital costs and that they indicate potential efficiencies, with reducing variation one of the sources of savings to meet the QIPP challenge. However, we found that these variations have not been systematically interrogated by senior hospital managers or local commissioners; as a result there is limited consideration of the extent to which a hospital is delivering value for money in comparison to its peers. The NHS Institute has estimated that the scale of productivity opportunity in hospitals through the reduction of variations in some key hospital activities is around £4.6 billion. Our analysis indicates that if all hospitals performed at the level of the top 25 per cent in respect of staff costs, use of estate, control of emergency admissions and bed management, the NHS could save around £1.6 billion a year.
Year-on-year increases in activity have enabled hospitals to increase their 16 income rather than drive efficiencies and local savings. In 2008-09 funding from Primary Care Trusts for acute hospital services rose by 7.3 per cent compared to the uplift in the national tariff of 2.3 per cent. Increased activity coupled with improved counting and coding of activity paid at the national tariff may have helped many hospitals to maintain financial balance. There are unexplained variations across England in the money spent by hospitals to provide the same treatments, and hospitals we visited did not understand why their costs were higher or lower than the average.

Management of NHS hospital productivity Summary 9
There are challenges to overcome if the NHS is to deliver £15 to 20 billion of efficiency savings
Some hospitals do not effectively control staff costs. 17 Some hospitals have been slow to adopt tighter controls either over managing staff vacancies and the use of temporary and agency staff or in adopting more efficient approaches to managing staff rotas. Some managers also reported that they felt unable to effectively use the provisions within the contract to control some costs, such as recurring clinical excellence awards.
Given the unprecedented scale, there are risks to the delivery of the 18 2009-launched Quality Innovation Productivity and Prevention challenge and the expected efficiency savings required by March 2014. This Department-led initiative required Strategic Health Authorities to develop regional efficiency plans by April 2010. Additional plans have been developed by 12 national work-streams. Primary Care Trusts have developed local plans but these have had limited input from the hospitals who are expected to deliver the bulk of the savings. The timetable for implementation is operating alongside the schedule for transition to the new NHS structures, announced in the July 2010 White Paper. There is a risk that Strategic Health Authorities and Primary Care Trusts, which are responsible for driving the delivery of the efficiency savings, will be distracted by their planned closure by March 2013.
Conclusion on value for money
The past decade has seen consistent, significant increases in hospital funding. 19 This was designed, in part, to deliver more productive behaviour. However, hospital productivity has fallen. The Department’s design and the NHS’s implementation of national initiatives were predominantly focused on increasing capacity, quality and outcomes of healthcare whilst maintaining financial balance, rather than on realising improvements in productivity. Whilst hospitals have used their increased resources to deliver many of the national priorities, hospitals need to provide more leadership, management and clinical engagement to optimise the use of additional resources and deliver value for money.
Recommendations
The July 2010 Health White Paper, 20 Equity and Excellence: Liberating the NHS, proposes a number of significant reforms. Our recommendations highlight the issues that the Department should consider in these reforms to help improve productivity from publicly funded hospitals. Once the reforms are in place, we will agree with the Department the responsibility and timeline for implementing the recommendations.
Hospitals do not make best use of the levers in the national contracts for a staff. Any future national pay contracts should set out the expected productivity gains and efficiency savings that organisations should be obtaining, clearly linking these to the aspects of the contract that are intended to be used to realise the improvements.

10 Summary Management of NHS hospital productivity
Although the Department built some efficiency targets into the Payment by b Results framework, these are not aligned to the level of efficiencies now required. The national tariffs and associated business rules need to be aligned with the expected efficiency gains and in a way that also promotes the take-up of productive behaviour.
The quality of some of the data underpinning hospital payments is variable. c The Audit Commission has agreed to review the accuracy of costing data in 2010, but there needs to be a long-term strategy for improving, and providing assurance on, the validity of hospital cost (reference costs) and coding of activity data (Hospital Episode Statistics).
The Department has not adequately evaluated the cost of national d initiatives after their implementation. Major national initiatives should include a realistic assessment of the costs and benefits, with progress against these expectations evaluated.
The current measures of NHS productivity cover the whole UK, and the e quality adjustment is limited. When producing productivity measures, new data on quality such as Patient Reported Outcome Measures (PROMs) should be considered. The current UK measure should, if possible, be disaggregated for the devolved administrations and by type of healthcare service.

Management of NHS hospital productivity part one 11
Part One
Productivity measurement in NHS hospitals
Over the last ten years, in line with the NHS Plan 2000, there have been substantial 1.1 increases in NHS funding. Between 2000-01 and 2010-11, expenditure on the NHS will have increased by 70 per cent to £102 billion from £60 billion, an average real terms increase of 4.5 per cent a year. In the NHS Plan, the Government set out a ten-year plan to modernise the NHS through investment in more, better paid staff, using new ways of working, and improved equipment and buildings. The aim was to deliver better care to more people more quickly, address issues of public concern, such as access to healthcare and waiting times, and improve outcomes for major disease areas such as cancer and coronary heart disease. The Department of Health (the Department) expected that the increased spending would overcome the systemic problems in the NHS, and meet the public’s expectations but also continuously improve efficiency, productivity and performance.
The Department’s implementation of the NHS Plan had three stages 1.2 (Figure 2 overleaf). The first phase was about building the NHS workforce, improving the physical capacity of the NHS, and tackling issues of major concern to the public, such as waiting times and improvements in mortality rates. Between 2004 and 2007, the Department introduced a number of reform levers such as: choice; more freedom for providers, particularly Foundation trusts; and better financial systems. In the final stage, from around 2008, the Department expected the NHS to use the additional capacity and the reform levers to transform services to deliver high quality care for patients and value for money for the taxpayer.
Over 40 per cent of NHS expenditure is accounted for by acute NHS and 1.3 foundation hospital trusts (hospitals). In November 2009, the NHS Chief Executive announced that the NHS and Department would need to achieve £15 to 20 billion efficiency savings per year, of which around 40 per cent are expected from driving efficiency in hospitals. In this part of the report, we analyse the measurement of NHS productivity and how hospital productivity has changed since 2000.

12 part one Management of NHS hospital productivity
measures of nHS productivity include a quality adjustment
Productivity is the ratio between the volume of resources going into the NHS 1.4 (inputs) and the quantity of healthcare provided by the NHS (outputs). Outputs are adjusted to reflect their relative cost and their quality. If outputs rise faster than inputs then productivity increases. Working with the Department, the Office for National Statistics (ONS) produces an annual measure of UK NHS productivity, giving trends since 1995. In 2004, ONS changed the measurement of healthcare productivity so that the outputs which represented treatments received by individual patients were weighted to take into account the complexity and varying cost of individual treatments.
Figure 2Timeline of key events since the NHS Plan 2000
Source: National Audit Offi ce
Phase 1: Increasing capacity and investment Phase 2: Choice, competition and better financial systems
Phase 3: Deliver high quality care and value for money
Comprehensive Spending Review (CSR) 2000 (27 per cent increase in nominal NHS funding over three years)
CSR 2007 (22 per cent increase over three years)
CSR 2010 (11 per cent increase over four years)
CSR 2004 (21 per cent increase over three years)
Publication of NHS Plan: a plan for investment, a plan for reform
Department submit business case to HM Treasury on pay modernisation
Introduction of Agenda for Change (a process that continued until Dec 2006)
Best Practice Tariffs introduced into PbR
Introduction of the new Consultant Contract
Payments by Results (PbR) introduced covering a small proportion of elective admissions
New target of a maximum wait of 18 weeks from referral to treatment
Department announces £15-20 billion of efficiency savings to be made by 2013-14
New target to halve MRSA infections by 2008
PbR extended to include A&E, outpatients and emergency admissions for all hospitals
QIPP programme launched
2000 2001 2002 2003 2004 2005 2006 2007 2008 2009 2010

Management of NHS hospital productivity part one 13
Healthcare inputs – categorised as labour, goods and services, and capital 1.5 consumption – are measured so as to remove the effects of pay and price changes and instead focus on growth in the volume of inputs. For instance, labour inputs are measured using staff numbers weighted together using proportions of expenditure on the relevant staff groups. Hospital outputs are calculated using activity data (Hospital Episode Statistics) and unit cost data (reference costs1). Outputs are adjusted for quality to reflect improvements in survival rates, waiting times, and patient experience. The ONS acknowledges there are limitations to their measure. In particular, the adjustment of outputs: does not cover all aspects of quality; is based on limited information; and is sensitive to the weighting of the different facets of quality included in the index.
Since the nHS plan total nHS productivity, as measured by the onS, has not improved
ONS estimates that UK NHS productivity declined between 2000 and 2008 on 1.6 average by 0.2 per cent per year. Inputs grew by 4.9 per cent per year during this period, but the average annual growth for outputs was 4.7 per cent (Figure 3).
1 Further details on reference costs are given in Box One, p25.
Figure 3Change in total NHS productivity from 2000 to 2008
Index (2000=100)
150
140
130
120
110
100
90
80
2000 2001 2002 2003 2004 2005 2006
Year
Productivity index
NOTE1 Productivity is calculated by dividing the outputs (for example the volume of operations and treatments, adjusted for
quality) by the inputs (the resources used to carry out the care). Further detail on the calculation of productivity is given in Figure 1.
Source: Office for National Statistics
Output indexInput index
2007 2008

14 part one Management of NHS hospital productivity
onS-measured productivity in hospitals has declined at a greater rate than in the rest of the nHS
Hospital productivity has decreased at a higher rate than for the NHS as a whole. 1.7 At our request, ONS disaggregated its NHS productivity measure to construct an index for Hospital and Community Health Services (HCHS) – of which acute hospitals account for the majority of inputs, outputs and quality adjustments. Between 2000 and 2008, this UK index fell, on average, by 2 per cent per year or by 1.4 per cent when outputs are adjusted for those quality improvements accounted for in the NHS index that could be attributable to hospitals (short-term survival, health gain and waiting times) (Figure 4). Over this period, the inputs measured in this productivity index rose by almost a half (46.5 per cent), and productivity might initially be expected to fall in periods of rapid input growth as any resulting increase in output may be slower to achieve.
Figure 4Changes in hospital productivity from 2000 to 2008
Index (2000=100)
Year
NOTE1 Hospital and Community Health Services (HCHS) includes ambulance and non-acute hospital services (e.g. mental
health). Acute hospital care accounts for the majority of inputs, outputs and quality adjustment. ONS do not fully measure community activity which represents 4 per cent of this measure, and any shift in activity from acute care to the community will underestimate productivity.
Source: Office for National Statistics
Hospital (HCHS) productivity, unadjusted
Hospital (HCHS) productivity, adjusted
NHS productivity, adjusted for quality
80
90
100
110
120
130
140
150
2000 2001 2002 2003 2004 2005 2006 2007 2008

Management of NHS hospital productivity part one 15
Labour productivity initially declined alongside growth in staff numbers but subsequently improved
Labour productivity is a more narrow measure that looks at the ratio of outputs 1.8 to number of staff and so gives an indication of the average output per member of staff. Goods and services are not included as inputs in a labour productivity measure but contribute to outputs. Since 2000 goods and services have increased at a higher rate than labour inputs – at 8.0 per cent per year compared to 3.5 per cent – so labour productivity might therefore have been expected to increase. However, Figure 5 shows that, since 2000, hospital (HCHS staff) labour productivity fell in five of the last eight years, but increased in three of the last four years. Hospital consultant labour productivity fell in seven of these years. Both measures have performed below the total NHS labour productivity measure, although with some improvement in later years.
Figure 5Trends in labour productivity since 1995
Index (1995=100)
NOTE1 In this calculation, hospital (HCHS staff) labour productivity excludes consultant numbers.
Source: Analysis of Office for National Statistics and NHS Information Centre data
Consultant productivity
Hospital (HCHS staff) labour productivityNHS labour productivity
80
90
100
110
120
130
140
150
1995 1996 1997 1998 1999 2000 2001 2002 2003 2004 2005 2006 2007 2008
Agenda for Change introduced
Consultant Contractintroduced
Year

16 part one Management of NHS hospital productivity
In the Department’s business case on pay modernisation, submitted to HM Treasury 1.9 in 2002, the Department expected that in return for above inflation pay awards it would deliver annual labour productivity gains of between 1 and 2 per cent, mostly through increased activity, shorter waiting times and higher quality of patient care or longer consultation times. Figure 6 illustrates changes in labour productivity before, during and after the implementation of the contracts. Trends in these measures of labour productivity tend to be as a result of changes in the rate with which the workforce has grown and they do not necessarily represent how effectively the workforce contracts are used, although the Department believes that it is plausible that some of the improvements are due to the new contracts. Some of the growth in labour productivity is due to a change in staff-mix in favour of higher paid grades, and some may be an artefact of outsourcing services. Details of the labour productivity measures (including limitations) and the overall hospital (HCHS) productivity index used in paragraph 1.7 are included in our online methodology (www.nao.org.uk/NHS-Productivity-2010).
Figure 6Changes in labour productivity
nHS staff group Consultants, annual change
Hospital (HCHS staff), annual change
A Historical trend -1.6% 0.6%
(1995-2002) (1995-2003)
B During implementation -2.7% -0.2%
(2002-2004) (2003-2005)
C Since implementation -0.8% 2.3%
(2004-2008) (2005-2008)
D Actual gross change (C – A) 0.8% 1.7%
E Expected labour productivity gain (gross change) 2.0% 1.1% (Nurses) – 1.5% (Allied Health Professionals)
noteIn this calculation, hospital (HCHS staff) labour productivity excludes consultant numbers.1
Source: Department of Health, and analysis of Offi ce for National Statistics and NHS Information Centre data
Management of NHS hospital productivity part one 17
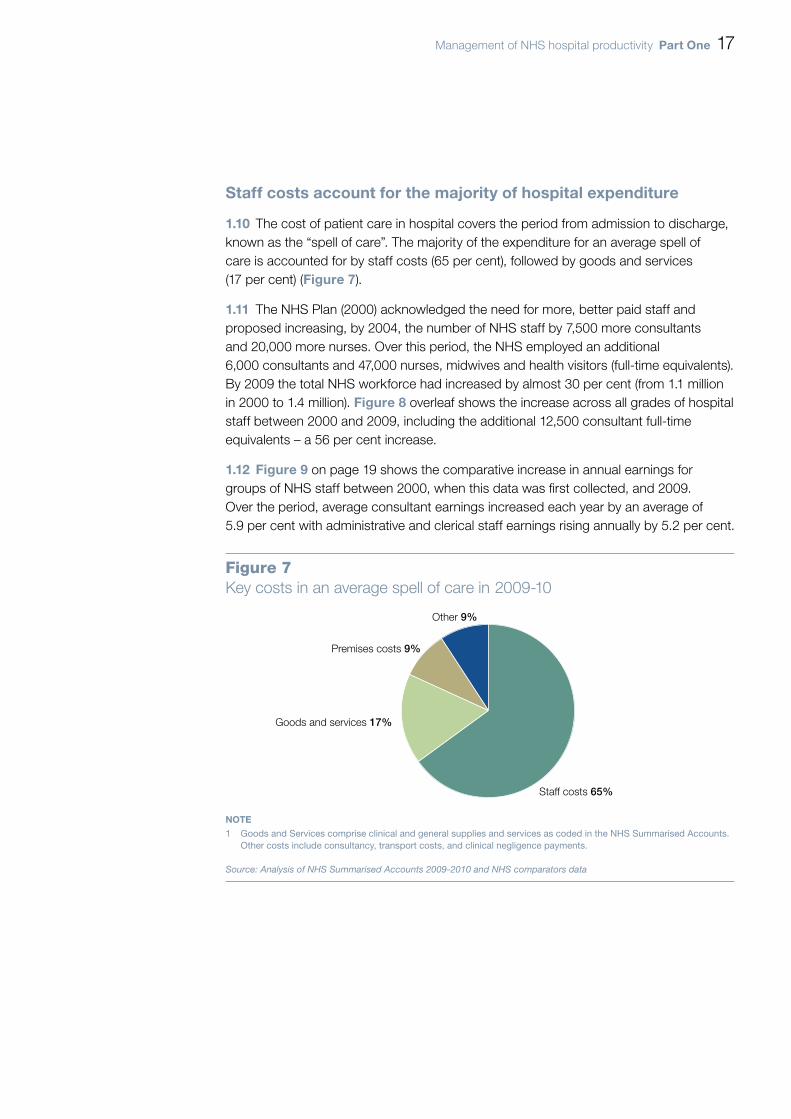
Staff costs account for the majority of hospital expenditure
The cost of patient care in hospital covers the period from admission to discharge, 1.10 known as the “spell of care”. The majority of the expenditure for an average spell of care is accounted for by staff costs (65 per cent), followed by goods and services (17 per cent) (Figure 7).
The NHS Plan (2000) acknowledged the need for more, better paid staff and 1.11 proposed increasing, by 2004, the number of NHS staff by 7,500 more consultants and 20,000 more nurses. Over this period, the NHS employed an additional 6,000 consultants and 47,000 nurses, midwives and health visitors (full-time equivalents). By 2009 the total NHS workforce had increased by almost 30 per cent (from 1.1 million in 2000 to 1.4 million). Figure 8 overleaf shows the increase across all grades of hospital staff between 2000 and 2009, including the additional 12,500 consultant full-time equivalents – a 56 per cent increase.
Figure 91.12 on page 19 shows the comparative increase in annual earnings for groups of NHS staff between 2000, when this data was first collected, and 2009. Over the period, average consultant earnings increased each year by an average of 5.9 per cent with administrative and clerical staff earnings rising annually by 5.2 per cent.
Figure 7Key costs in an average spell of care in 2009-10
NOTE1 Goods and Services comprise clinical and general supplies and services as coded in the NHS Summarised Accounts.
Other costs include consultancy, transport costs, and clinical negligence payments.
Source: Analysis of NHS Summarised Accounts 2009-2010 and NHS comparators data
Staff costs 65%
Goods and services 17%
Premises costs 9%
Other 9%

18 part one Management of NHS hospital productivity
Figure 8Change in NHS hospital workforce from 2000 to 2009
Full-time equivalents (FTEs) (000s)
0
50
100
150
200
250
300
350
Year
20012000 2002 2003 2004 2005 2006 2007 2008 2009
NOTE1 Figures as at 30 September each specified year. Figures include staff from non-acute hospitals.
Source: NHS Information Centre
1 Nurses, midwives and health visitors2 Support to clinical staff3 Non-managerial infrastructure support staff4 Qualified scientific, therapeutic & technical staff
5 Registrars and other doctors in training6 Managers7 Consultants
1
2
3
4
5
67

Management of NHS hospital productivity part one 19
the costs of goods and services have increased below inflation
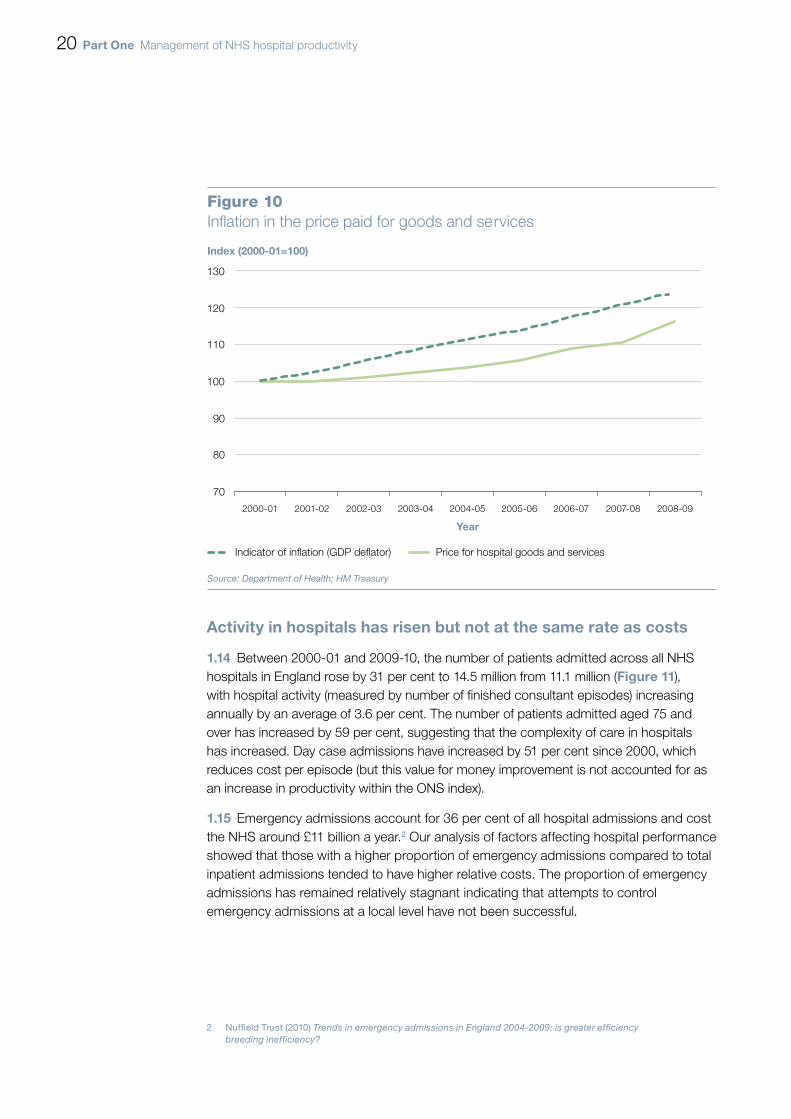
Over the last decade the costs of goods and services purchased by hospitals have 1.13 increased below most comparable measures of inflation. These goods and services – which include the cost of drugs, medical equipment, cleaning services and rent – have risen on average by less than 2 per cent a year between 2000-01 and 2008-09 (Figure 10 overleaf). However, during this period the volume of goods and services used by hospitals has risen by a total of 86 per cent.
Figure 9Change in NHS average earnings between 2000 and 2009
nHS staff group mean earnings aug 2000
(£)
mean earnings
July-Sep 2009(£)
percentage change 2000-09
mean annual percentage
change
Consultants 71,900 120,900 68 5.9
Doctors in training and their equivalents
35,000 51,800 481 4.51
Managers 35,700(Aug 2002)
47,900 342
(2002-09)4.32
Nurses and midwives 22,600 30,700 36 2 3.52
Maintenance and works 19,600 27,300 39 3.8
Admin and clerical 14,000 22,100 58 5.2
Healthcare assistants 12,400(Aug 2002)
18,700 512
(2002-09)6.02
public sector3 17,000 25,300 49 4.5
private sector3 19,800 27,500 38 3.7
noteSThe number of hours worked per week by Doctors in training has been limited by the introduction of the European 1 Working Time Directive.
These fi gures may understate actual growth, as 2009 data for: ‘Managers’ excludes some senior managers; 2 ‘Nurses and midwives’ includes unqualifi ed and health visiting staff; and ‘Healthcare assistants’ includes ‘other support staff’.
Comparator earnings fi gures are average for whole years (2000, 2009) and are rounded to the nearest £100.3
Source: NHS Information Centre; Department of Health; Offi ce for National Statistics
20 part one Management of NHS hospital productivity
activity in hospitals has risen but not at the same rate as costs
Between 2000-01 and 2009-10, the number of patients admitted across all NHS 1.14 hospitals in England rose by 31 per cent to 14.5 million from 11.1 million (Figure 11), with hospital activity (measured by number of finished consultant episodes) increasing annually by an average of 3.6 per cent. The number of patients admitted aged 75 and over has increased by 59 per cent, suggesting that the complexity of care in hospitals has increased. Day case admissions have increased by 51 per cent since 2000, which reduces cost per episode (but this value for money improvement is not accounted for as an increase in productivity within the ONS index).
Emergency admissions account for 36 per cent of all hospital admissions and cost 1.15 the NHS around £11 billion a year.2 Our analysis of factors affecting hospital performance showed that those with a higher proportion of emergency admissions compared to total inpatient admissions tended to have higher relative costs. The proportion of emergency admissions has remained relatively stagnant indicating that attempts to control emergency admissions at a local level have not been successful.
2 Nuffield Trust (2010) Trends in emergency admissions in England 2004-2009: is greater efficiency breeding inefficiency?
Figure 10Inflation in the price paid for goods and services
Index (2000-01=100)
Year
Source: Department of Health; HM Treasury
Price for hospital goods and servicesIndicator of inflation (GDP deflator)
2000-01 2001-02 2002-03 2003-04 2004-05 2005-06 2006-07 2007-08 2008-09
70
80
90
100
110
120
130

Management of NHS hospital productivity part one 21
over the last ten years there have been measurable improvements in the quality of patient care
The ONS includes a quality adjustment in its calculation of hospital productivity to 1.16 account for short-term survival rates, health gain following treatment and waiting times. The Department’s data on waiting times show: that inpatient median waiting times fell from 12.9 weeks in 2000 to 4.3 weeks in 2010; improvements in outpatient waiting times from 4.8 weeks in 2005 to 2.7 weeks in 2010; and the percentage of patients treated in A&E within four hours has increased from 78 per cent in 2003 to 98 per cent in 2009.
There is limited data available relating to quality beyond reducing mortality for 1.17 cancer and coronary heart disease and reducing two specific healthcare associated infections. Whilst there have been achievements in these areas, our 2009 report on healthcare associated infections found that other infections, that are not being performance managed, may have increased.3 Our 2010 report on health inequalities found that the cancer and coronary heart disease targets are on course to be achieved.4 There are other aspects of quality which are not fully covered within the ONS measure, such as the health gains from different procedures and the new Patient Reported Outcome Measures (PROMs).
3 National Audit Office (2009) Reducing Healthcare Associated Infections in Hospitals in England.4 National Audit Office (2010) Tackling inequalities in life expectancy in areas with the worst health and deprivation.
Figure 11Inpatient hospital admissions since 2000 by type
Admissions (millions)
Year
Source: Hospital Episode Statistics
Emergency Elective (non-emergency) excluding day case Day case
2000-01 2001-02 2002-03 2003-04 2004-05 2005-06 2006-07 2007-08 2008-09 2009-10
3.0
3.5
4.0
4.5
5.0
5.5
6.0
22 part two Management of NHS hospital productivity
Part Two
National initiatives to improve hospital performance
Over the last 10 years the Department has had control over a considerable 2.1 proportion of hospital costs. The Department has influenced hospital staff’s earnings through national pay contracts and other input prices, such as drugs. It also sets the tariff that commissioners use to pay hospitals for much of the care they provide. In addition the Department has had some influence over the nature and volume of activity through the use of national standards and targets. The Department also has influence through other NHS bodies which have a role in providing guidance and best practice advice, performance management and inspection of hospitals (Figure 12). All of these actions can impact on overall value for money but this may not always be fully captured in a narrow definition of productivity. This part of the report examines the effectiveness of the Department’s initiatives and other sponsored organisations on hospital productivity.
Hospitals could make better use of the national contracts for staff
NHS pay contracts are negotiated by NHS Employers, the representative body for 2.2 NHS trusts, on behalf of the Department, and trade unions such as the British Medical Association. National contracts were negotiated to reward staff for working differently and provide tools which employers can use to help them improve productivity and quality. Our reviews of the new consultants’ contract in 20075 and Agenda for Change in 20096 have shown that whilst the contracts contained levers for improving productivity, these were not used effectively by hospitals. The Department recognises that more needs to be done to make best use of the contracts, for example, encouraging NHS Employers to disseminate best practice and improve workforce guidance.
5 National Audit Office (2007) Pay Modernisation: A new contract for NHS consultants in England.6 National Audit Office (2009) NHS Pay Modernisation in England: Agenda for Change.

Management of NHS hospital productivity part two 23
Figure 12External organisations that infl uence hospital productivity
Department of Health
Inputs Outputs Quality
National payContracts1
National procurement
Payment by Results
National quality targets
Quality, innovation, productivity and prevention (Qipp)
Strategic Health Authorities
Benchmarking of providers ¬
Facilitating sharing of good practice ¬
Acute Provider
Primary Care Trusts
Commissioning ¬
Contracting ¬
Local health ¬
economy stimulation
Demand ¬
management
Care Quality Commission
Licensing and regulation of provider care
Monitor Independent regulation and development of Foundation Trusts
External audit
NHS Employers
Represents hospitals on workforce issues1
NHS Institute
Development and spread of good practice tools
NICE
National guidance and quality standards for hospital care
performance management
Commissioning and
Competition
Regularityand
accountability
Facilitation of good
practice and benchmarking
noteIn 2004, the Department passed its role of negotiating contracts on to NHS Employers.1
Source: National Audit Offi ce

24 part two Management of NHS hospital productivity
The Consultant Contract
In 2003 consultants were awarded a new contract with improved pay and 2.3 conditions. The Department expected this contract to deliver year-on-year consultant productivity gains of 2 per cent above historical trends, through efficiency gains and quality improvements. In our 2007 report, we concluded that it was too early to determine whether productivity had improved. Whilst the contract introduced the potential for greater transparency and productive working practice, we found that few hospitals were realising this opportunity. There was little evidence that consultants were working sufficiently differently or having their objectives aligned with those of the hospital. We recommended that clinical management should be strengthened in hospitals, including implementing more effective job planning.
In 2010, hospital managers told us that the Consultant Contract is still not used 2.4 as a lever for change, and we found few examples of the contract being used to demonstrably improve productivity. Managers reported that the job planning process remains primarily a diary exercise and is neither effectively monitored nor tailored to the needs of the hospital, with job plans still not actively linked to appraisal processes. Managers did, however, report that the ratio between time spent on direct patient care and other duties is more closely monitored. Some managers also reported that they felt unable to effectively use the provisions within the contract to control some costs, such as recurring clinical excellence awards.
Agenda for Change
In 2006, the majority of hospital staff in the NHS, except doctors and senior 2.5 managers, had a new contract under the framework called Agenda for Change. This framework was designed to facilitate new ways of working within hospitals. The Department expected that Agenda for Change would result in a 1.1–1.5 per cent per year rise in productivity. In 2009 we reported that hospitals had successfully transferred 1.1 million NHS employees on to the new simplified pay system. However, in requiring hospitals to implement the framework quickly, the Department placed no explicit requirement on individual hospitals to achieve productivity improvements. In 2010 some hospital managers told us that Agenda for Change is not always used to manage staff performance effectively, and that the incremental nature of the framework limits their control of staff costs.
Foundation trusts are able to negotiate their own local terms and conditions for any 2.6 staff group, which in theory should enable the hospitals to respond more effectively to local market pressures. In practice, foundation trusts have yet to use this freedom and we have identified only one hospital which does not use the national contracts under Agenda for Change.

Management of NHS hospital productivity part two 25
payment by Results was intended to increase activity, reduce waiting times and incentivise efficiency
Hospital services are commissioned by Primary Care Trusts, who are expected 2.7 to manage services to meet local needs in a cost-effective way. Hospitals are paid for these services through:
the nationally-set Payment by Results regime introduced in 2003-04 ¬¬
(see box one); and
locally-agreed contracts for the remainder of activity.¬¬
Before Payment by Results was introduced, commissioners largely used block 2.8 contracts to reimburse hospitals for the care they provided. Block contracts were often based on historical provision of care, not on the actual numbers of patients treated, and did not reflect cost efficiencies. Payment by Results was designed to reduce waiting times by directly linking payment to activity and to incentivise efficiency by only paying at average cost. The original intention was to have all commissioning within the framework by 2008. However, Payment by Results currently covers 60 per cent of the income of an average hospital and the remaining 40 per cent of income is based on either contracts negotiated locally by Primary Care Trusts or other activities such as teaching, training and research.
Box OnePayment by Results and reference costs
Payment by Results is a single rule-based system for paying hospitals for the services they provide. The Department expected that setting prices nationally would stimulate both activity, in part to reduce waiting times, and efficiency.
Payments are based on a national price for a given unit of activity multiplied by the number of patients treated. The price for each group of treatments (Healthcare Resource Group, HRG) is determined using cost information provided by all hospitals in England. The price for an HRG is then set based on its average cost compared to other HRGs, adjusted to take account of inflation and other cost pressures (such as increases in pay) less an efficiency target (currently 3.5 per cent).
Reference costs are the average costs reported by each hospital for providing individual treatments, and are used in calculating the national tariff. The overall cost for a hospital is compared to the average costs of delivering the same level of activity to create the Reference Cost Index, a measure of hospitals’ relative efficiency with, for example, a score of 105 suggesting that the hospital is 5 per cent more expensive than average.

26 part two Management of NHS hospital productivity
The Department’s reference costs data show a wide variation in the average costs 2.9 reported by hospitals (Figure 13). Some of this variation will be caused by differences in patient case-mix and accuracy of submitted data but the wide range demonstrates potential for improving efficiency. The Department hopes to incentivise hospitals to adopt high quality, cost-effective procedures through:
the Commissioning for Quality and Innovation (CQUIN) payment framework ¬¬
launched in 2009, which makes a small proportion of hospitals’ income conditional on quality and innovation;
as of 2010-11, hospitals being paid at ‘marginal’ (30 per cent) tariff rates for ¬¬
any unplanned admissions above the 2008-09 baseline levels. From 2006-07 to 2008-09, there was a ‘differential’ tariff to share, between providers and commissioners, the financial risk of increasing emergency admissions, with any changes above or below a nationally-set threshold priced at half of average cost; and
introducing best practice tariffs for four areas of care in 2010-11, with plans to ¬¬
extend to other procedures.
However, it is too early to audit the impact of these initiatives on productivity. The Department also plans to amend the payment framework so hospitals are not paid for readmissions or ‘never events’.
Figure 13Reference Cost Index compared to size of hospital by activity
Reference Cost Index 2008-09
40
60
80
100
120
140
160
Total Hospital Income (£m)
0 100 200 300 400 500 600 700 800 900 1,000
Source: Analysis of Department of Health data
Small Medium Large Teaching Specialist

Management of NHS hospital productivity part two 27
The quality of information used to pay hospitals is variable
Reference costs are used as the basis for the national prices paid to hospitals for 2.10 providing care. However, there is a perception that the quality of reference costs is poor, and an audit of 2008-09 data found that hospital submissions were variable.7 In 2010, the Audit Commission also reported that despite an improvement in the accuracy of clinical coding of activity data (from a 16.5 per cent error rate in 2007-08 to 11.3 per cent error rate in 2009-10) with no net national over- or undercharging; however, there is still significant variation between hospitals.8 Hospitals and Primary Care Trusts also use the data to support local pricing and contracting and, as a result, there can be wide variations in the price paid for similar activities.
Payment by Results has incentivised hospitals both to control their costs and increase income
In 2008-09, funding from Primary Care Trusts for acute hospital services rose by 2.11 7.3 per cent compared with a national tariff increase of 2.3 per cent. This is partly due to increased number and complexity of patients treated in hospitals. Hospitals are paid a standard tariff for the elective procedures they carry out, so an increase in activity leads to increased hospital income, although the use of either differential and marginal tariffs from 2006-07 (with the exception of 2009-10) have reduced the financial gains for hospitals of treating more emergency admissions. Since 2000 there has been a significant planned rise in elective admissions, to address waiting times, but also in emergency admissions. Senior managers in the hospitals we visited told us that they were able to maintain financial balance through increasing income from activity covered by Payment by Results and, as a result, did not focus specifically on improving productivity.
Hospitals have improved their recording of patient-level activity so that they are 2.12 fully reimbursed for the care they provide. At the same time, the proportion of patients recorded as having additional medical complications has increased. There were 119 inpatient procedures under the 2008-09 Payment by Results tariff where hospitals are paid at different levels depending on whether the patient is recorded as having complications and, on average, a hospital could receive two-thirds more money if they do so. Between 2007-08 and 2008-09, the proportion of admissions recorded as ‘with complications’ increased in 99 of the 119 procedures (83 per cent).
7 Audit Commission (2010) Review of Reference Costs: findings from pilot reviews of the quality on 2008-09 submissions.
8 Audit Commission (2010) Improving data quality in the NHS: Annual report on the PbR assurance programme.

28 part two Management of NHS hospital productivity
Commissioners have been unable to control the increases in spend on hospital care
Currently, Primary Care Trusts are expected to improve economy and efficiency 2.13 through commissioning and contracting, and reshaping local health economies to move care out of hospitals. In practice, many Primary Care Trusts have had limited impact over referral activity in primary care. Hospital managers we spoke to said they had not experienced successful local demand management by their Primary Care Trusts, and they particularly struggled with managing emergency admissions and A&E attendances. For 2010-11, in an attempt to incentivise hospitals to actively manage demand for their services, the Department has introduced a cap on payments for emergency admissions, with commissioners now only paying 30 per cent of tariff for emergency admissions above the 2009 baseline.
While some contracts contain assumed reductions in demand, these are driven 2.14 by affordability, and local demand management by Primary Care Trusts has been insufficient to achieve the assumed level. Our 2010 report on cancer services highlighted that many commissioners lack understanding of what drives costs and have not focused on improving value for money.9
Payment by Results has driven some efficient practice
Payment by Results was introduced to support and enable increasing patient 2.15 choice and competition between hospitals. Recent evidence suggests that competition has helped improve efficiency and quality in hospitals.10, 11, 12 In particular, hospitals have been incentivised through the tariff to carry out certain surgical procedures on one day with no overnight stay (day case surgery). Length of stay has decreased by over a quarter to a mean of 5.6 days in 2009-10, from 8.2 days in 2000-01, with the extra capacity primarily used to reduce waiting times. Due to the increase in admissions, hospitals have not been able to close beds at the same rate as the decrease in length of stay, with the number of acute care beds (excluding those for mental health and learning disabilities) having decreased by 8.2 per cent between 2000-01 and 2009-10. These efficient practices have not resulted in hospitals releasing cash due to counter cost pressures such as staff pay, which have negated the adjustments made to the tariff to account for assumed efficiency gains.
9 National Audit Office (2010) Delivering the Cancer Reform Strategy.10 Martin Gaynor et al (2010) Death by Market Power.11 Z Cooper et al (2010) Does Hospital Competition Improve Efficiency?12 Z Cooper et al (2010) Does Hospital Competition Save Lives?
Management of NHS hospital productivity part two 29
tools designed to help hospitals share good practice and identify productivity improvements have not been taken up universally
The Department has sponsored the development and sharing of good practice 2.16 to help hospitals increase their productivity, for example through the NHS Institute for Innovation and Improvement (NHS Institute). box two shows some of the main products the NHS Institute has developed to improve productivity. Hospital managers reported that, where implemented, the Productive Series has been successful in improving ward management, quality of care, and the job satisfaction of staff. However, hospitals we visited were not able to quantify savings from implementing the Productive Ward and could not identify the cost of implementation. Likewise few trusts that we spoke to had used the information from the Better Care Better Value indicators to drive efficiency improvements. In 2010, the NHS Institute published a ‘Module Impact Framework’ for measuring improvements stemming from the Productive Series, and are working on a ‘Rapid Impact Assessment’ for quantifying productivity opportunities.
The Department negotiates national procurement contracts for goods and services 2.17 used in hospitals. However, it is the choice of individual hospitals whether they use these contracts. We reported in 2010 that there are opportunities for improvements in procurement across the public sector.13 The NHS Purchasing and Supply Agency has identified the potential to save £240 million nationally by individual trusts using national framework agreements.
13 National Audit Office and Audit Commission (2010) A Review of Collaborative Procurement Across the Public Sector.
Box TwoInitiatives from the NHS Institute for Innovation and Improvement
The Productive Series is designed to help NHS teams to redesign the way they work, using efficiency and safety techniques developed from manufacturing industries. The aim is to improve the length of time staff can devote to patient care by redesigning processes, leading to improved quality of care and, over time, cost reductions.
The Better Care, Better Value Indicators are 15 high-level efficiency indicators that can help individual hospitals identify potential areas for improvement in hospital care, published quarterly since October 2006.
The Institute has calculated that by improving performance to the top quartile in using just nine indicators that relate to hospital care (including the Productive series, reducing length of stay and preoperative bed days) £4.6 billion could be saved.1
note1 Kings Fund (2010) Improving NHS Productivity: More with the same not more of the same.

30 part two Management of NHS hospital productivity
The National Institute for Health and Clinical Excellence (NICE) also plays 2.18 an important role in influencing hospital activity through its national guidance and publication of quality standards for hospital care. NICE also produces cost-saving guidance for hospitals14, including costing templates, that set out changes in approaches to care for particular conditions or procedures which NICE estimates will produce a net saving. NICE can have a significant impact on the way hospitals work, but not all of its guidance is compulsory and there is no national approach to auditing compliance. Our previous reports have found that patients were not always treated in accordance with NICE guidelines.15, 16
Whilst national targets have delivered quality improvements and were costed by the Department, the actual costs are rarely assessed after implementation
As part of each Spending Review, the Department assesses the costs of key 2.19 changes, such as: pay and price increases; demographic and other demand pressures; national targets and quality improvements; and other new policies. The Department then agrees the funds that will be made available with HM Treasury, and allocates budgets to NHS bodies and other local health and social care organisations. The Department argues that they do not performance manage measures of productivity directly but require the NHS to deliver these changes within their agreed budget. The Department builds in expectations for efficiency improvements into the levels of funding provided to Primary Care Trusts and hospitals.
In the areas we have previously examined there is limited information about the 2.20 actual cost of achieving the national targets for quality improvements in the NHS. For example, in 2009 we reported that the Department had not evaluated the cost to the NHS of reducing two healthcare associated infections, which we calculated was commensurate with the benefits claimed. Without sufficient evaluation of the cost of implementing targets, it is difficult for the NHS to prioritise spending to deliver improvements in care or demonstrate value for money. The Department accepts that there is a need for further improvement in post-implementation evaluation.
14 Available at: http://www.nice.org.uk/usingguidance/benefitsofimplementation/costsavingguidance.jsp15 National Audit Office (2010) Progress in improving stroke care.16 National Audit Office (2010) Major Trauma Care in England.
Management of NHS hospital productivity part three 31
Part Three
Hospital performance in improving productivity
In the 2010 budget the Government announced that NHS expenditure growth 3.1 would be significantly lower than at any other time in the last 15 years. At the end of 2009, the NHS Chief Executive set a challenge to deliver savings equivalent to £15 to 20 billion across the whole NHS, to be reinvested in health services. These savings, which the Institute for Fiscal Studies and Kings Fund have estimated could require annual efficiency gains of around six per cent17, are intended to be achieved through: lowering input costs; rebalancing activity between hospitals and primary care; reducing administration costs and improving hospital productivity. Central to the Department’s plans for hospital productivity is a drive to reduce variation between hospitals.
The July 2010 Health White Paper recognised that the NHS may need to identify 3.2 further savings, but also set out a vision for a reorganisation of the delivery of health care in England. Focusing on productivity will help the NHS to understand the implications of cost reduction and identify sustainable improvements. This part of the report assesses the scope for hospitals to deliver their share of the savings.
Variation between hospitals’ costs and activity shows there is significant scope for improving productivity
Costs vary between hospitals
There are unexplained variations across England in the money spent by hospitals 3.3 to provide the same treatments. The Reference Cost Index shows a hospital’s costs in relation to the national average for their case-mix (see Box One, p25). Figure 14 overleaf shows the variation in average costs within and between different types of hospital. Hospitals we visited did not understand why their costs were higher or lower than the average.
17 Appleby J, Crawford R, Emmerson C (2009) How Cold Will It Be? Prospects for NHS funding: 2011-2017.

32 part three Management of NHS hospital productivity
The Reference Cost Index is an aggregate measure of relative efficiency and, within 3.4 the overall variation shown above, individual reference costs or components of expenditure may vary more widely. This may reflect poor quality cost data or relative inefficiency at, for example, individual ward-level. There is evidence of substantial cost variations at hospital speciality and procedure level. A recent study found that even allowing for case complexity, patients in some hospital obstetrics departments routinely cost £550 more than the average for England.18 Analysis of hospital data for 2008-09 showed the cost of a first-time elective coronary artery bypass graft varied between £5,000 and £12,000. Day case surgery is recommended nationally for a number of procedures and, by decreasing the length of time patients are in hospital, is generally cheaper than non-day case procedures. We calculated a variation, between non-specialist hospitals, in average day case rates for all procedures of 35 per cent in 2008-09.
Our analysis of detailed costing data showed that the proportion of spend on key 3.5 costs varied significantly between hospitals. Staff cost for 2008-09 varied between 51 per cent and 71 per cent of total hospital expenditure, excluding specialist hospitals. The average proportion of spend on premises was five per cent of total expenditure, but for some hospitals was over ten per cent. Whilst some variation is expected and may be explained, the level of variation is significant enough to raise concerns around the use of resources.
18 Laudicella M, Olsen KR, Street A (2009) What explains variation in the costs of treating patients in English obstetrics specialties?
Figure 14There are variations in reference costs by type of hospital
NOTE1 The grey dot shows the median Reference Cost Index for each category of acute trust. The size of the white box shows the trusts lying between the top and bottom quartile for the Index. The length of the black line shows the minimum and maximum score for each category.
Source: Department of Health
70
80
90
100
110
120
130
Small (47) Medium (38) Large (38) Teaching (27)
Min Median Max
Reference cost index 2008-09

Management of NHS hospital productivity part three 33
Costs are determined by a number of key factors
To understand the potential drivers of hospital cost, we analysed the Reference 3.6 Cost Index efficiency scores for all hospitals (excluding specialist hospitals) between 2006-07 and 2008-09, alongside other organisational data to identify how key indicators influenced hospital costs. These performance indicators included: hospital size; clinical activity; financial management; workforce; bed use; and estate management. Our analysis indicated that proportion of emergency admissions; workforce levels per bed; the use of the hospital estate; bed occupancy; and financial management were key drivers of costs. These aspects are discussed in greater detail below, along with estimates for the scope of savings that could be made if performance was improved. Decisions on how these improvements are realised would need to be made with patient safety as a first consideration.
Emergency admissions
There is substantial variation in the number of emergency admissions as a 3.7 proportion of total hospital admissions (Figure 15 overleaf). Emergency admissions are a key driver of cost: as the proportion of emergency admissions increased by 1 per cent, the Reference Cost Index increased by 0.14 (equating to potential savings of £0.3 million for an average hospital). For this factor, and those listed below, we calculated potential national savings based on the bottom 75 per cent of hospitals improving their performance to that of the 25th percentile (which is shown on the graphs). For emergency admissions, this showed a potential saving across all acute hospitals of around £300 million a year;19 however, these savings could only be achieved by hospitals working with other local health and social care providers and commissioners.
Staff per bed
Between 2006-07 and 2008-09, the average number of staff per hospital bed 3.8 increased by five per cent, and staff costs as a proportion of operational expenditure increased from an average of 50.8 to 62.3 per cent. Ranking hospitals by number of staff per bed (Figure 16 overleaf), we found that the average number in the 25 per cent with the lowest number of staff per bed was four, compared with an average of over five for the rest of the population. We calculated that decreasing the number of staff per bed by one decreased the Reference Cost Index by 2.6, suggesting potential national savings of around £500 million. However, this analysis – as with the other aspects discussed in this section – does not account for the relationship between staff numbers and safe care in hospitals.
19 This figure may not be fully achievable as the analysis did not differentiate between hospitals with and hospitals without A&E departments and, as such, some variation in levels of emergency admission is inevitable.

34 part three Management of NHS hospital productivity
Figure 15Variation between hospitals in the proportion of admissions that are emergencies 2008-09
Emergency admissions as proportion of all admissions (%)
70
60
50
40
30
20
10
0
Hospital trust Median performance (36.7%)
NOTE1 Excludes specialist trusts.
Source: Hospital Episode Statistics
25th percentile (33.2%)
Figure 16Variations in the number of staff per bed 2008-09
Staff per bed (WTE)
14
12
10
8
6
4
2
0
Number of staff per bed (WTE) Median number of staff per bed (4.69)
NOTE1 Whole time equivalent staff numbers include doctors, nurses and allied health professionals.
Source: Hospital Episode Statistics
25th percentile (4.2)

Management of NHS hospital productivity part three 35
Bed utilisation and hospital space
The unit cost of operating an NHS hospital bed is approximately £200-£300 per day, 3.9 and is largely incurred even when the bed is not occupied. In 2008-09 the bed occupancy rate in individual hospitals varied substantially (Figure 17). Our analysis indicated that if bed occupancy increased by one per cent, the Reference Cost Index decreased by 0.38 on average (equating to potential savings of £0.8 million per average hospital), with potential national savings of around £600 million a year.
In 2008-09, an average of three per cent of hospital floor space was “empty” 3.10 or “underused”, with 80 per cent of NHS hospitals having some proportion of their occupied floor space below the acceptable functional standard defined by national NHS standards. We calculated potential national savings from improving management of hospital floor space of around £200 million.
Figure 17Variation in bed occupancy levels 2008-09
Bed occupancy (%)
100
95
90
85
80
75
70
65
60
55
50
Hospital trust Median occupancy (85.1%)
Source: Department of Health
25th percentile (89.3%)
36 part three Management of NHS hospital productivity
Financial management
Good financial management is essential to optimising improvements in NHS 3.11 productivity. We assessed whether the Care Quality Commission annual health check score for financial responsibility, awarded on a four-point scale to individual hospitals, was strongly related to reference costs. Our modelling suggested that in 2006-07 the effect of financial management rated by the Care Quality Commission as ‘excellent’ was an improved Reference Cost Index score of four points over that of a hospital whose financial management was rated ‘weak’. The effect in 2008-09 was even greater, with a difference of nine points.
Hospital initiatives to improve productivity could be more effective
Cost improvement plans are largely based on discrete opportunities to reduce costs
All the hospitals we visited had annual Cost Improvement Programme (CIP) plans, 3.12 owned and monitored by the Finance Director. We found that these CIP plans are not always linked with operational plans or priorities. They were commonly based on discrete opportunities to reduce cost or improve quality in specific areas of the hospital or for specific areas of treatment. This meant that it was very difficult to assess whether the cost reduction was structured in a way that would deliver sustainable improvements, and hospitals had insufficient data to demonstrate the accuracy of their claimed savings.
Information is not used effectively by hospitals to improve productivity
We found that hospitals make limited use of comparative data and benchmarking 3.13 against peers. Strategic Health Authorities often share data between hospitals for benchmarking purposes, but told us that it was common for information that showed a hospital to be performing relatively poorly to be dismissed as non-comparable or incorrect. Our review of hospital board minutes found that Non-Executive Boards generally hold hospitals to account using national quality metrics and overall financial performance. However, data is not always linked in a way that would enable boards to assess both performance and expenditure, and hence productivity.
There are tools available to help hospitals compile their data in a useful way. 3.14 However, the use of evidence-based IT solutions such as electronic job planning is localised, relies on individual hospital engagement, and is rarely rolled-out across whole hospitals. Other examples of innovation and good practice have not been implemented because they are poorly costed and the benefits are not accurately measured. The Department has commissioned a hospital-level productivity indicator, due to be published in 2011.

Management of NHS hospital productivity part three 37
Few hospitals have effective systems for performance managing their staff
The pay modernisation contracts contained contractual obligations designed to 3.15 enable hospitals to more closely performance-manage their staff. The implementation of the new contracts was also an opportunity to align the objectives of the hospital with the job plans of their staff, and improve productivity.
Consultants responding to our survey reported that they rarely have objectives 3.16 linked to productivity metrics such as cost or throughput of patients, either as part of their job plans or formalised in another way. Over 80 per cent of the consultants said they do not have objectives linked to reducing cost, and around two-thirds do not have objectives linked to volume of patients. However, 52 per cent of consultants reported having changed the way they work, over the last two years, to reduce the cost of care and 72 per cent of consultants have worked to improve the throughput of patients.
The Knowledge and Skills Framework, introduced from 2004 and key to realising 3.17 the benefits of Agenda for Change, has still not been implemented by all hospitals and for all staff. Not all NHS staff receive an annual appraisal or related performance development review, although the proportion has increased from 61 to 69 per cent between 2007 and 2009.20 Hospital managers reported annual incremental progression through the pay scale was rarely based on performance. The Department, NHS Employers and trade unions recognised the shortcomings of the Knowledge and Skills Framework and commissioned a re-design and simplification of the current Framework, published in November 2010.
Individual hospitals monitor their workforce productivity using a limited number of 3.18 efficiency indicators, including sickness absence rates, staff turnover, and agency costs. However, we found that many hospitals had not implemented known good practice to improve these four metrics. The use of e-rostering was recommended by us in 2006 and was shown to reduce sickness absence, agency staff usage, and cost; yet we found that some hospitals we visited had still not implemented an e-rostering system.
20 Care Quality Commission (2010) NHS Staff Survey 2009.
38 part Four Management of NHS hospital productivity
Part Four
The new national challenge to deliver improved productivity
Quality, innovation, productivity and prevention is a national initiative designed to deliver savings across the nHS
In order to deliver the quality improvements and efficiency savings expected by 4.1 2014, in November 2009 the NHS Chief Executive introduced the Quality, Innovation, Productivity and Prevention (QIPP) challenge. QIPP aims to provide support, where needed, to enable clinical teams and NHS organisations to make efficiency savings that can be reinvested in the NHS whilst simultaneously maintaining or improving the quality of services. Strategic Health Authorities are overseeing the development of local QIPP plans, which are supported by 12 national workstreams, such as the ’productive care’ worksteam that is designed to support rollout of the productive series (paragraph 2.16, p29).
This part of the report details the findings from our review of the regional and 4.2 national QIPP plans in relation to savings in hospitals. It is too early to audit the implementation of the plans, although a recent Gateway Review rated the confidence of delivering QIPP as ‘amber’, indicating that successful delivery appears feasible but issues require management attention.
We found that some of the national workstream plans are not yet sufficiently explicit 4.3 in how they intend to engage and work with acute providers to either realise savings or demonstrate and measure effectiveness. While workstreams include some specific targets, poor baseline data for some of these mean it will be difficult to measure the savings delivered by hospitals and progress against the nationally expected improvements.
The Department required Strategic Health Authority plans for achieving efficiency 4.4 savings between 2010 and 2014 to be agreed by April 2010, accepting that the plans will change as the regional programmes are developed. The plans largely consist of discrete projects aimed at reducing costs in specific cost areas and improvements in quality. It is not clear how implementing the plans will lead to longer-term regional transformation of local health economies.

Management of NHS hospital productivity part Four 39
We identified risks to the implementation of the regional plans within the desired 4.5 timeframe and to both the measurement and the realisation of the projected efficiencies. As the QIPP team acknowledges, there is some double counting of efficiencies and has been only limited engagement with, and use of information from, provider services. The overarching focus for each Strategic Health Authority remains the quality of care, and many of the projects are extensions or iterations of those set up after the 2008 NHS Next Stage Review which focused on the improvement of quality. The Department recognises the scale of the challenge in delivering the savings and have put plans in place aimed at supporting the NHS and mitigating the risks.
Some external commentators and NHS managers argue that there are additional 4.6 risks to the implementation of QIPP, which stem from the initiative’s timetable coinciding with the period of transformation of the NHS to achieve the reforms set out in the July 2010 White Paper. The abolition of Strategic Health Authorities and Primary Care Trusts, which have a lead role in delivering the QIPP agenda, and the establishment of new organisations, could distract staff at all levels from focusing on the achievement of the necessary productivity improvements. The additional cost pressures of the reorganisation are also not yet known.
The Department argues that the changes can be used to reinforce the QIPP 4.7 agenda through helping to deliver a one-third reduction in costs of administration and improving clinicians’ engagement. The Department considers that its transition programme has a clear focus on mitigating the risks through, for example:
making Strategic Health Authorities combine the implementation of the White ¬¬
Paper and QIPP in a single plan;
authorising pilot ‘pathfinder’ GP consortia (which will replace Primary Care Trusts) ¬¬
against criteria including commitment to support the local QIPP agenda; and
ensuring hospitals’ applications to gain foundation trust status consider QIPP. ¬¬
40 appendix one Management of NHS hospital productivity
Appendix One
Methodology
methods purpose
Case study visits to all ten Strategic Health Authorities (SHAs)
To understand the role of SHAs in improving hospital productivity
Case study visits to NHS hospital trusts (12 sites) To understand the levers and barriers trusts face when managing productivity
Survey of consultants in England (381 responses) To obtain views on the use of mechanisms designed to improve productivity such as job planning
Survey of executive directors of NHS trusts in England (48 responses)
To obtain views on business planning within hospitals
Semi-structured interviews with key stakeholders To inform our understanding of the national initiatives
Regression analysis of existing hospital cost and activity data
To identify what financial, activity or performance attributes of trusts drive costs
Detailed statistical analysis of financial and activity data in one hospital trust
To explore the relationships between lengths of stay, mortality, and financial performance in a single trust

Design and Production byNAO CommunicationsDP Ref: 009317-001
This report has been printed on Consort 155 and contains material sourced from responsibly managed and sustainable forests certified in accordance with FSC (Forest Stewardship Council).
The wood pulp is totally recyclable and acid-free. Our printers also have full ISO 14001 environmental accreditation which ensures that they have effective procedures in place to manage waste and practices that may affect the environment.
002825

Published by TSO (The Stationery Office) and available from:
online www.tsoshop.co.uk
mail, telephone, Fax & email TSO PO Box 29, Norwich NR3 1GN Telephone orders/General enquiries: 0870 600 5522 Order through the Parliamentary Hotline Lo-Call 0845 7 023474 Fax orders: 0870 600 5533 Email: [email protected] Textphone: 0870 240 3701
The Parliamentary Bookshop 12 Bridge Street, Parliament Square, London SW1A 2JX Telephone orders/General enquiries 020 7219 3890 Fax orders: 020 7219 3866 Email: [email protected] Internet: http//www.bookshop.parliament.uk
tSo@blackwell and other accredited agents Customers can also order publications from:
tSo ireland 16 Arthur Street, Belfast BT1 4GD 028 9023 8451 Fax 028 9023 5401
9 780102 970029
ISBN 978-0-10-297002-9
£14.75