department of health - home - office of management and … year budgets/operating budget 2018... ·...
TRANSCRIPT


Department Of Health
Agency
Agency Mission
The Department of Health’s vision is "All people in Rhode Island will have the opportunity to live a safe and healthy life in a safe and healthy community" and its mission is to “Protect and promote the health of Rhode Islanders.”
Agency Description
The vision and mission recognize that while the Department made strides in achieving its Healthy Rhode Island 2010 health goals, disparities persist, and for the first time in modern years the current generation of children may have a shorter life expectancy than their parents.
Looking forward to its Healthy Rhode Island 2020 goals, the Department has three strategic priorities that will frame its work:
The Department strives to achieve the following outcomes:
• Reduce the burden of disease and disability in the population • Assure safe and healthy environments
• Assure access for all to high quality health services • Promote healthy behaviors and practices
The Department’s programs will employ five health strategies to drive success in accomplishing their strategic priorities:
• Promote healthy living through all stages of life • Ensure access to safe food, water and quality environments in all communities
• Promote a comprehensive health system that a person can navigate, access and afford • Prevent, investigate, control and eliminate health hazards and emergent threats
• Analyze and communicate data to improve the public’s health
Statutory History
Authorization for the Department of Health is contained in various sections of Title 23 of the Rhode Island General Laws.
40

FY 2017 Revised
FY 2018 Recommend
FY 2017 Enacted
FY 2015 Audited
FY 2016 Audited
Department Of Health
Budget
Expenditures By ProgramCentral Management 11,802,686 10,982,991 4,851,117 4,894,139 8,912,255
State Medical Examiner 2,475,373 2,850,462 - - -
Community Health and Equity - 1,997,330 105,984,171 108,084,901 105,183,926
Environmental and Health Services Regulation
16,675,964 17,562,641 - - -
Environmental Health - - 11,704,513 12,740,569 13,255,810
Health Laboratories and Medical Examiner 8,273,230 8,903,739 12,157,638 12,391,957 12,171,199
Public Health Information 3,698,780 3,660,999 - - -
Community and Family Health and Equity 63,110,430 77,324,693 - - -
Infectious Disease and Epidemiology 5,386,121 5,599,214 - - -
Customer Services - - 10,997,783 11,807,781 11,807,317
Policy, Information and Communications - - 3,148,479 3,266,362 4,189,481
Preparedness, Resp, Infectious Dis, & Emergency Services
- - 14,040,951 16,755,206 15,648,088
Total Expenditures $111,422,584 $128,882,069 $162,884,652 $169,940,915 $171,168,076
Expenditures By ObjectPersonnel 53,531,782 55,688,170 65,405,609 66,677,639 68,451,375
Operating Supplies and Expenses 42,313,370 50,900,926 51,611,375 57,119,389 55,749,357
Assistance and Grants 15,276,965 21,340,330 45,674,276 45,231,017 46,676,976
Subtotal: Operating Expenditures 111,122,117 127,929,426 162,691,260 169,028,045 170,877,708
Capital Purchases and Equipment 300,467 952,643 193,392 912,870 290,368
$111,422,584 $128,882,069 $162,884,652 $169,940,915 $171,168,076Total Expenditures
Expenditures By FundsGeneral Revenue 22,821,939 25,468,221 25,931,822 25,999,235 26,325,249
Federal Funds 57,741,431 69,157,857 100,365,021 103,507,285 105,373,312
Restricted Receipts 30,856,883 34,255,991 36,587,809 40,434,395 39,469,515
Operating Transfers from Other Funds 2,331 - - - -
$111,422,584 $128,882,069 $162,884,652 $169,940,915 $171,168,076Total Expenditures
FTE Authorization 491.3 490.6 503.6 503.6 499.6
41

Department of Health
Policy,Information & Communications
State Health Laboratories
& Medical Examiner
Preparedness, Response, Infectious Disease
& Emergency Medical Services
Community Health & Equity
Health Disparities & Access to Care
Environmental Health
Customer Services
Public Health Communication
Legislative & Regulative Affairs
Health SystemsPolicy & Regulation
Health Data & Analysis &
Public Health Informatics
Environmental Sciences
Forensic Sciences
Biological Sciences
Laboratory Support Services
Office of State Medical Examiners
Chronic Care & Disease
Management
Health Promotion
Professional Licensing
Vital Records
Health Facilities Regulation
TheAgency
Director ofHealth
Executive Director
CFO, Finance & Operations Team
Chief Legal Counsel & Legal Team
Chief of Staff
Secretary of Health and Human Services
Deputy Director
Acute Infectious Diseases
Epidemiology
HIV, Hepatitis,STDs & TB
Epidemiology
Emergency Preparedness & Response
Emergency Medical Services
Perinatal & Early Childhood
Health
Preventive Services
Healthy Homes & Environment
Food Protection
Drinking Water Quality
Professional Boards & Commissions
RIDOH Academic
Center
RIDOH Health Equity Institute
42

Department Of Health
Personnel
Grade FTE Cost FTE Cost
FY 2017 FY 2018
Agency Summary
36,568,764 36,820,942Classified 498.4 501.4
701,091 703,026Unclassified 5.0 5.0
1Total Salaries 503.6 $34,753,898 499.6 $36,043,567
503.4 $37,269,855 506.4 $37,523,968Subtotal
Benefits
199,594 207,759Payroll Accrual
2,050,564 2,134,858Retiree Health
25,601 25,657Holiday
869 290Other
6,270,890 6,890,694Health Benefits
2,660,638 2,759,299FICA
8,889,707 9,115,967Retirement
$20,097,863 $21,134,524Subtotal
- - Consolidation of OHHS Finance Staff - (7.0)
4,897,672 4,299,270Cost Allocation from Other Programs 63.5 54.5
($4,897,672) ($4,299,270)Cost Allocation to Other Programs (63.5) (54.5)
($144,467) ($158,217)Interdepartmental Transfer - -
378,749 378,749Overtime - -
- - Reconcile to FTE Authorization 0.3 0.2
431,814 441,002Temporary and Seasonal - -
($3,182,053) ($2,141,935)Turnover - -
($2,515,957) ($1,480,401)Subtotal 0.2 (6.8)
Total Salaries and Benefits 503.6 $54,851,761 499.6 $57,178,091
Cost Per FTE Position (Excluding Temporary and Seasonal) $108,058 $113,567
Statewide Benefit Assessment $1,619,457 $1,643,367
Payroll Costs 503.6 $56,471,218 499.6 $58,821,458
43

Department Of Health
Personnel
Grade FTE Cost FTE Cost
FY 2017 FY 2018
Agency Summary
Purchased Services
600 600Buildings and Ground Maintenance
5,544,586 5,210,907Training and Educational Services
144,600 1,600Legal Services
608,946 656,798Other Contracts
1,375,673 1,526,300Information Technology
395,456 306,994Clerical and Temporary Services
141,000 128,000Design and Engineering Services
106,625 83,000University and College Services
1,013,695 901,210Management & Consultant Services
875,240 814,508Medical Services
$10,206,421 $9,629,917Subtotal
Distribution By Source Of Funds
General Revenue 191.0 $21,966,141 191.0 $22,060,004
Federal Funds 252.4 $36,497,037 251.1 $37,222,705
Restricted Receipts 60.1 $8,214,461 57.5 $9,168,666
Total All Funds 503.6 $66,677,639 499.6 $68,451,375
Total Personnel 503.6 $66,677,639 499.6 $68,451,375
44
Department Of Health
Performance Measures
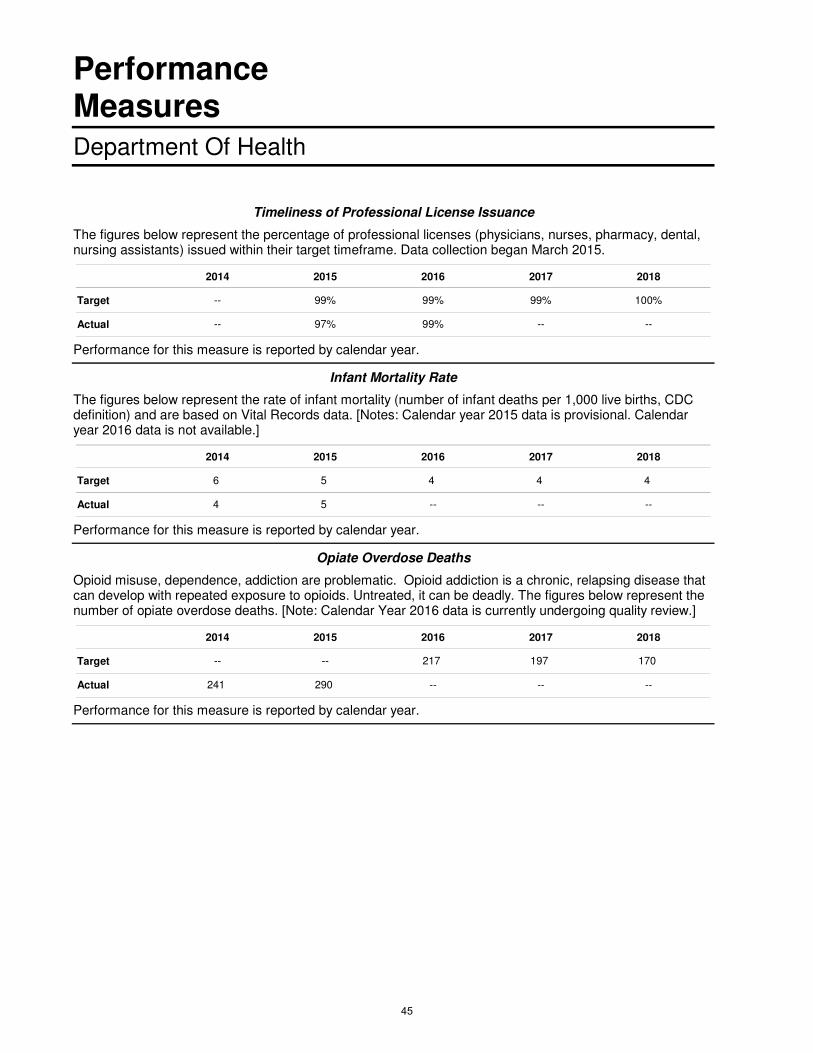
The figures below represent the percentage of professional licenses (physicians, nurses, pharmacy, dental, nursing assistants) issued within their target timeframe. Data collection began March 2015.
Timeliness of Professional License Issuance
Target
Actual
--
2014 2015 2016 2017
--
99%
97% 99%
99% 99%
--
2018
100%
--
Performance for this measure is reported by calendar year.
The figures below represent the rate of infant mortality (number of infant deaths per 1,000 live births, CDC definition) and are based on Vital Records data. [Notes: Calendar year 2015 data is provisional. Calendar year 2016 data is not available.]
Infant Mortality Rate
Target
Actual
6
2014 2015 2016 2017
4
5
5 --
4 4
--
2018
4
--
Performance for this measure is reported by calendar year.
Opioid misuse, dependence, addiction are problematic. Opioid addiction is a chronic, relapsing disease that can develop with repeated exposure to opioids. Untreated, it can be deadly. The figures below represent the number of opiate overdose deaths. [Note: Calendar Year 2016 data is currently undergoing quality review.]
Opiate Overdose Deaths
Target
Actual
--
2014 2015 2016 2017
241
--
290 --
217 197
--
2018
170
--
Performance for this measure is reported by calendar year.
45

Department Of Health
Performance Measures
Overweight and obesity have been increasing at alarming rates and research has linked these conditions to life threatening health problems such as diabetes, heart disease, stroke, and certain cancers. Among adolescents, overweight and obesity increase the risk of diabetes, early development of chronic diseases, orthopedic problems, and depression. Obesity is a leading contributor to premature death, second only to tobacco. Because of rising obesity rates, this may be the first generation who live shorter lives than their parents. The figures below represent the percentage of Rhode Island children and adolescents age 2 to 19 who are considered obese. Data are from the Youth Risk Behavior Survey. [Note: Calendar year 2016 data is not yet available.]
Adolescent Obesity Rate
Target
Actual
--
2014 2015 2016 2017
--
--
12% --
11.8% 11.6%
--
2018
11.4%
--
Performance for this measure is reported by calendar year.
Tobacco use is the single most preventable cause of death and disease in the United States. The health risks do not just affect the smoker. Each year, approximately 443,000 Americans die from smoking or exposure to secondhand smoke. More alarming is the fact that for every person who dies from tobacco use, 20 more people suffer from one or more serious tobacco-related illness, including numerous types of cancer, heart disease, and respiratory illnesses. The figures below represent the percentage of Rhode Islanders over the age of 18 who have smoked cigarettes within the past 30 days. Data are based on the RI Behavioral Risk Factor Surveillance System (BRFSS). [Note: Calendar Year 2016 data is currently undergoing quality review.]
Adult Smoking Rate
Target
Actual
16.5%
2014 2015 2016 2017
16.3%
16%
15.5% --
15.5% 14%
--
2018
13.3%
--
Performance for this measure is reported by calendar year.
Primary care is the level of a health services system that provides entry into the system for all new needs and problems, provides person-focused (not disease-oriented) care over time, provides care for all but very uncommon or unusual conditions, and coordinates or integrates care, regardless of where the care is delivered and who provides it. (http://www.jhsph.edu/research/centers-and-institutes/johns-hopkins-primary-care-policy-center/definitions.html). The figures below represent the percentage of Rhode Islanders with a regular primary care provider. Data are based on the BRFSS. [Note: Federal Fiscal Year 2016 data is currently undergoing quality review.]
Rhode Islanders with Primary Care Provider
Target
Actual
80%
2014 2015 2016 2017
80.5%
82.1%
83.4% --
83.7% 85.4%
--
2018
86.9%
--
Performance for this measure is reported by federal fiscal year.
46
Department Of Health
Performance Measures
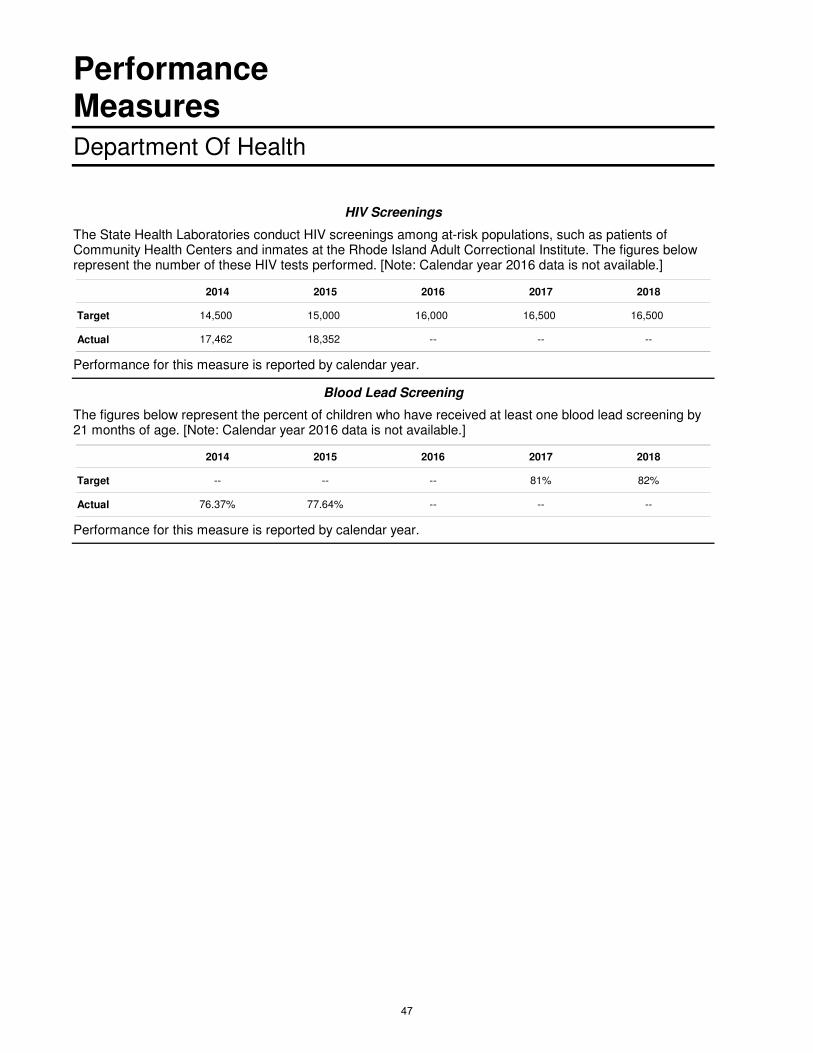
The State Health Laboratories conduct HIV screenings among at-risk populations, such as patients of Community Health Centers and inmates at the Rhode Island Adult Correctional Institute. The figures below represent the number of these HIV tests performed. [Note: Calendar year 2016 data is not available.]
HIV Screenings
Target
Actual
14,500
2014 2015 2016 2017
17,462
15,000
18,352 --
16,000 16,500
--
2018
16,500
--
Performance for this measure is reported by calendar year.
The figures below represent the percent of children who have received at least one blood lead screening by 21 months of age. [Note: Calendar year 2016 data is not available.]
Blood Lead Screening
Target
Actual
--
2014 2015 2016 2017
76.37%
--
77.64% --
-- 81%
--
2018
82%
--
Performance for this measure is reported by calendar year.
47

Department Of HealthCentral Management
The Program
Program MissionThe primary mission of the Central Management program is to provide leadership, administrative, andprogrammatic oversight to the various programs and operations of the Department of Health.
Program DescriptionThe Central Management program includes four subprograms:
The Executive Functions subprogram encompasses the Office of the Director. The Director and theleadership team provide overall direction to the Department, coordinate operations across program lines tocarry out statutory mandates, provide legal services that support the enforcement of health laws andregulations; and provide community and legislative liaison services.
The Academic Center subprogram strengthens the integration of scholarly activities and public healthpractice, by instilling a culture of learning and innovative implementation along with continuous qualityimprovement. The Academic Center includes externally focused public health research and educationprograms as well as internally focused workforce development and quality improvement programs.
The Health Equity Institute (HEI) subprogram is strategically positioned within the Director of Health’s Office and applies the health equity lens to all RIDOH programs and policies to a priority population of people with disabilities and racial / ethnic minorities. RIDOH set as its strategic priorities to (1) address the social and environmental determinants of health, (2) eliminate the disparities of health and promote health equity, and (3) ensure access to quality health services for Rhode Islanders including vulnerable populations. Since establishing these strategic priorities, RIDOH has aligned its organizational structure and investments by creating the Health Equity Institute and evaluating expenditures. The Management Services subprogram provides administrative services and support for the departmentincluding budget, finance, purchasing, human resources and information systems.
Statutory HistoryAuthorization for the Central Management program includes §42-6-5, §42-6-8, §42-6-9, §42-6-10, andvarious sections of Title 23, Chapter 1.
48

Department Of HealthCentral Management
TheBudget
2017 Revised
2018 Recommend
2017 Enacted
2015 Audited
2016 Audited
Expenditures By SubprogramExecutive Functions 121,347 - 808,064 867,563 743,030
Management Services
6,050,556 4,013,626 4,043,053 4,026,576 4,476,359
Emergency Preparedness and Res
5,630,783 6,969,365 - - -
Health Equity Institute - - - - 3,692,866
Total Expenditures $11,802,686 $10,982,991 $4,851,117 $4,894,139 $8,912,255
Expenditures By Object
Personnel 8,745,891 7,229,033 4,093,352 4,037,594 6,404,989
Operating Supplies and Expenses 2,179,847 1,962,366 508,833 507,590 702,292
Assistance and Grants 855,532 1,258,744 248,932 348,955 1,804,974
Subtotal: Operating Expenditures 11,781,270 10,450,143 4,851,117 4,894,139 8,912,255
Capital Purchases and Equipment 21,416 532,848 - - -
$11,802,686 $10,982,991 $4,851,117 $4,894,139 $8,912,255Total Expenditures
Expenditures By FundsGeneral Revenue 323,512 319,443 - 100,000 789,523
Federal Funds 5,660,639 6,969,365 808,064 767,563 3,646,373
Restricted Receipts 5,818,535 3,694,183 4,043,053 4,026,576 4,476,359
$11,802,686 $10,982,991 $4,851,117 $4,894,139 $8,912,255Total Expenditures
49

Department Of HealthCentral Management
Personnel
Grade FTE Cost FTE Cost
FY 2017 FY 2018
Classified
DEPUTY DIRECTOR OF HEALTH 1.0 148,490 1.0 134,07800145A
EXECUTIVE DIRECTOR (ENVIRONMENTAL 1.0 128,841 1.0 128,84100144A
INTERDEPARTMENTAL PROJECT MANAGER 1.0 104,964 1.0 110,37000139A
CHIEF CHILDREN WITH SPECIAL HEALTH CARE 1.0 103,535 1.0 106,15400137A
HEALTH POLICY ANALYST 1.0 83,880 1.0 86,18300333A
PRINCIPAL COMMUNITY DEVELOPMENT TRAINING 1.0 83,880 1.0 86,98400329A
CHIEF HUMAN SERVICES BUSINESS OFFICER 1.0 79,154 1.0 79,15400133A
PRINCIPAL PUBLIC HEALTH PROMOTION 1.0 73,913 1.0 73,91400333A
PROGRAMMING SERVICES OFFICER 3.0 220,698 3.0 224,66400331A
SENIOR PUBLIC HEALTH PROMOTION SPECIALIST 3.0 215,392 3.0 217,64900331A
CHIEF IMPLEMENTATION AIDE 1.0 71,292 1.0 71,29200128A
SENIOR HUMAN SERVICES POLICY AND SYSTEMS 3.0 212,691 3.0 212,19900328A
PRINCIPAL HUMAN SERVICES BUSINESS OFFICER 2.0 131,490 2.0 133,48100128A
EXECUTIVE ASSISTANT 1.0 55,879 1.0 57,55400118A
ASSISTANT BUSINESS MANAGEMENT OFFICER 1.0 53,375 1.0 53,37500319A
FISCAL MANAGEMENT OFFICER 1.0 50,313 1.0 51,95800326A
PRINCIPAL COMMUNITY PROGRAM LIAISON 1.0 48,630 1.0 50,12000324A
COMMUNITY PROGRAM LIAISON WORKER 1.0 44,341 1.0 44,34000319A
25.0 $1,910,758 25.0 $1,922,310Subtotal
Unclassified
DIRECTOR DEPARTMENT OF HEALTH 1.0 134,975 1.0 134,97500955KF
1.0 $134,975 1.0 $134,975Subtotal
1Total Salaries 30.7 $2,146,819 36.7 $3,363,956
Benefits
12,385 19,369Payroll Accrual
- 277Holiday
164,236 257,364FICA
127,620 197,881Retiree Health
355,414 594,296Health Benefits
552,367 846,924Retirement
$1,212,022 $1,916,111Subtotal
- - Consolidation of OHHS Finance Staff - (6.0)
1,148,965 1,406,180Cost Allocation from Other Programs 15.0 17.9
(724,746) (82,936)Cost Allocation to Other Programs (10.2) (1.2)
28,273 29,716Overtime - -
9,188 55,125Temporary and Seasonal - -
(360,594) (101,414)Turnover - -
$101,086 $1,306,671Subtotal 4.7 10.7
50

Department Of HealthCentral Management
Personnel
Grade FTE Cost FTE Cost
FY 2017 FY 2018
Total Salaries and Benefits 30.7 $3,358,841 36.7 $5,280,067
Cost Per FTE Position (Excluding Temporary and Seasonal) $109,003 $142,369
Statewide Benefit Assessment $101,977 $157,847
Payroll Costs 30.7 $3,460,818 36.7 $5,437,914
Purchased Services
6,000 6,000Information Technology
18,000 18,000University and College Services
400 400Clerical and Temporary Services
92,600 92,600Management & Consultant Services
143,000 - Legal Services
143,550 182,897Other Contracts
138,226 632,178Training and Educational Services
35,000 35,000Medical Services
$576,776 $967,075Subtotal
Distribution By Source Of Funds
General Revenue - $100,000 4.7 $572,232
Federal Funds 1.2 $336,793 8.5 $1,782,173
Restricted Receipts 29.5 $3,600,801 23.5 $4,050,584
Total All Funds 30.7 $4,037,594 36.7 $6,404,989
Total Personnel 30.7 $4,037,594 36.7 $6,404,989
51

Department Of HealthState Medical Examiner
The Program
Program MissionThe mission of the State Medical Examiner is to investigate and make a determination as to the manner andcircumstance of death, and to properly and accurately certify the cause of death in unnatural cases, suddenunexpected deaths, and deaths which are otherwise unexplained.
Program DescriptionThe Office of the State Medical Examiner investigates through scene investigations, study of medical andpolice records, body inspection, autopsy, bodily fluid investigation, or any combination thereof, all known orsuspected homicides, suicides, accidents, sudden infant deaths, drug related deaths, medically unattendedor unexplained deaths, and deaths which may constitute the threat of an epidemic or in any way endangerthe public health.
The Medical Examiner’s Office periodically provides expert testimony in criminal and civil cases andapproves all cremation requests in Rhode Island. The Office utilizes the contracted services ofanthropologists, x-ray technicians, histotechnologists, and forensic dentists in the discharge of its mandatedduties.
Statutory HistoryChapter 23-4 of the Rhode Island General Laws establishes the Office of the State Medical Examiner.
52

Department Of HealthState Medical Examiner
TheBudget
2017 Revised
2018 Recommend
2017 Enacted
2015 Audited
2016 Audited
Expenditures By SubprogramOperations 2,475,373 2,850,462 - - -
Total Expenditures $2,475,373 $2,850,462 - - -
Expenditures By Object
Personnel 2,285,489 2,654,553 - - -
Operating Supplies and Expenses 182,222 187,372 - - -
Subtotal: Operating Expenditures 2,467,711 2,841,925 - - -
Capital Purchases and Equipment 7,662 8,537 - - -
$2,475,373 $2,850,462 - - - Total Expenditures
Expenditures By FundsGeneral Revenue 2,342,089 2,705,546 - - -
Federal Funds 133,284 144,916 - - -
$2,475,373 $2,850,462 - - - Total Expenditures
53

Department Of HealthCommunity Health and Equity
The Program
Program MissionThe Community Health and Equity program aims to achieve health equity for all populations by eliminatinghealth disparities, assuring healthy child development, preventing and controlling disease and disability, andworking to make communities healthy. The program takes a lead role in promoting and monitoring HealthyRhode Island 2020 goals.
Program DescriptionThe Community Health and Equity program includes four Centers:
The Center for Chronic Care and Disease Management uses an integrated systems approach to improvehealth outcomes and reduce the incidence, burden, and associated risk factors for arthritis, asthma,diabetes, cancer, heart disease, and stroke.
The Center for Health Promotion and Wellness promotes the health and well-being of Rhode Islanders bychanging social, political, and physical environments to support healthy lifestyles. The Center focuses onphysical activity, nutrition, tobacco control, and violence and injury prevention.
The Center for Perinatal and Early Childhood Health supports healthy birth outcomes, positive earlychildhood development and school readiness, and preparation for healthy productive adulthood by providingand assuring access to quality maternal and child health services.
The Center for Preventive Services improves the availability of and access to quality preventive services forvulnerable populations. The Center’s strategies include diminishing ethnic and racial health disparities,providing performance standards, enhancing community partnerships, and applying evidence-based,effective programming.
Statutory HistoryAuthorization for the Community Health and Equity Program is contained in various sections of Title 23 of theRhode Island General Laws.
54
Department Of HealthCommunity Health and Equity
TheBudget
2017 Revised
2018 Recommend
2017 Enacted
2015 Audited
2016 Audited
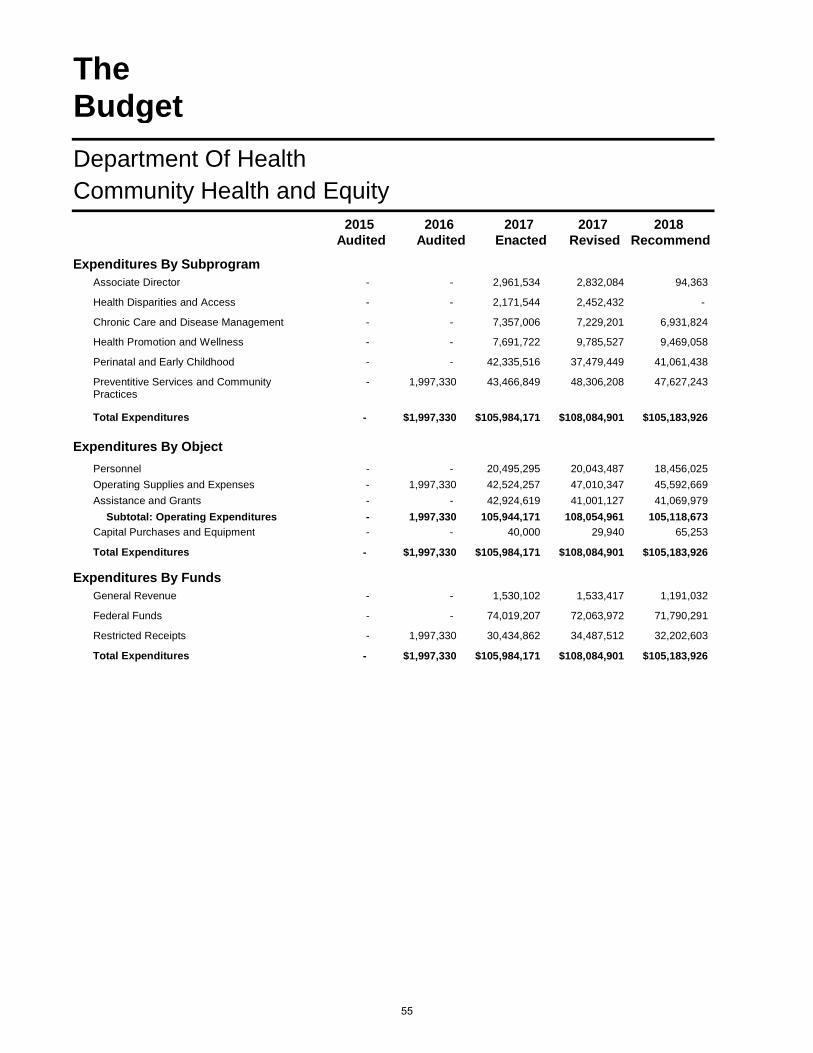
Expenditures By SubprogramAssociate Director - - 2,961,534 2,832,084 94,363
Health Disparities and Access - - 2,171,544 2,452,432 -
Chronic Care and Disease Management - - 7,357,006 7,229,201 6,931,824
Health Promotion and Wellness - - 7,691,722 9,785,527 9,469,058
Perinatal and Early Childhood - - 42,335,516 37,479,449 41,061,438
Preventitive Services and Community Practices
- 1,997,330 43,466,849 48,306,208 47,627,243
Total Expenditures - $1,997,330 $105,984,171 $108,084,901 $105,183,926
Expenditures By Object
Personnel - - 20,495,295 20,043,487 18,456,025
Operating Supplies and Expenses - 1,997,330 42,524,257 47,010,347 45,592,669
Assistance and Grants - - 42,924,619 41,001,127 41,069,979
Subtotal: Operating Expenditures - 1,997,330 105,944,171 108,054,961 105,118,673
Capital Purchases and Equipment - - 40,000 29,940 65,253
- $1,997,330 $105,984,171 $108,084,901 $105,183,926Total Expenditures
Expenditures By FundsGeneral Revenue - - 1,530,102 1,533,417 1,191,032
Federal Funds - - 74,019,207 72,063,972 71,790,291
Restricted Receipts - 1,997,330 30,434,862 34,487,512 32,202,603
- $1,997,330 $105,984,171 $108,084,901 $105,183,926Total Expenditures
55

Department Of HealthCommunity Health and Equity
Personnel
Grade FTE Cost FTE Cost
FY 2017 FY 2018
Classified
MEDICAL DIRECTOR, FAMILY HEALTH 1.0 168,758 1.0 172,05400252A
INTERDEPARTMENTAL PROJECT MANAGER 5.0 561,699 5.0 556,49100139A
CHIEF DIVISION OF DENTAL PUBLIC HEALTH 1.0 109,993 1.0 109,99300140A
HEALTH PROGRAM ADMINISTRATOR 1.0 102,709 1.0 105,45100135A
CHIEF OFFICE OF WOMEN, INFANTS AND 1.0 95,963 1.0 95,96300137A
COMMUNITY HEALTH NURSE COORDINATOR 1.0 92,056 1.0 92,05600923A
ASSISTANT ADMINISTRATOR COMMUNITY AND 1.0 87,700 1.0 87,70000335A
CHIEF HEALTH PROGRAM EVALUATOR 1.0 87,239 1.0 87,23900137A
PLANNING AND PROGRAM SPECIALIST (HEALTH) 1.0 86,725 1.0 86,72500331A
HEALTH PROGRAM ADMINISTRATOR 2.0 168,155 2.0 168,15500335A
PRINCIPAL PUBLIC HEALTH PROMOTION 6.0 478,460 6.0 478,11200333A
HEALTH POLICY ANALYST 8.0 635,438 8.0 642,08700333A
SENIOR PUBLIC HEALTH EPIDEMIOLOGIST 3.0 229,490 3.0 229,49200333A
CHIEF PROGRAM DEVELOPMENT 2.0 149,756 2.0 149,91300134A
SENIOR PUBLIC HEALTH PROMOTION SPECIALIST 26.0 1,882,772 26.0 1,892,79500331A
PUBLIC HEALTH EPIDEMIOLOGIST 3.0 212,781 3.0 217,62300331A
PUBLIC HEALTH PROMOTION SPECIALIST 5.8 384,492 5.8 386,65400329A
PRINCIPAL COMMUNITY DEVELOPMENT TRAINING 1.0 66,168 1.0 66,16800329A
CHIEF IMPLEMENTATION AIDE 2.0 131,510 2.0 133,55000128A
PROGRAMMING SERVICES OFFICER 6.0 391,973 6.0 402,25200331A
ASSISTANT HEALTH PROGRAM ADMINISTRATOR 2.0 128,098 2.0 132,49600331A
PROGRAMMING SERVICES OFFICER 1.0 62,164 1.0 65,00300131A
SENIOR HUMAN SERVICES POLICY AND SYSTEMS 2.0 121,440 2.0 126,46100328A
PRINCIPAL RESOURCE SPECIALIST 2.0 120,901 2.0 122,94600328A
PUBLIC HEALTH NUTRITIONIST 1.0 59,162 1.0 59,16200327A
PRINCIPAL HUMAN SERVICES BUSINESS OFFICER 1.0 58,893 1.0 61,99200128A
CHIEF FIELD INVESTIGATOR (GENERAL) 2.0 117,223 2.0 117,22300B24A
PRINCIPAL COMMUNITY PROGRAM LIAISON 4.0 216,361 4.0 219,08900324A
ADMINISTRATIVE OFFICER 1.0 53,368 1.0 55,46200324A
SENIOR COMMUNITY PROGRAM LIAISON WORKER 2.0 89,109 2.0 91,57300322A
ASSISTANT BUSINESS MANAGEMENT OFFICER 1.0 44,341 1.0 44,34100319A
COMMUNITY PROGRAM LIAISON WORKER 2.0 88,682 2.0 88,68200319A
CHIEF CLERK 3.0 124,180 3.0 128,60400B16A
SENIOR WORD PROCESSING TYPIST 1.0 36,976 1.0 37,08200312A
102.8 $7,444,735 102.8 $7,510,589Subtotal
56

Department Of HealthCommunity Health and Equity
Personnel
Grade FTE Cost FTE Cost
FY 2017 FY 2018
1Total Salaries 132.0 $9,164,572 118.1 $8,380,549
Benefits
52,820 48,305Payroll Accrual
260 39Holiday
701,112 641,114FICA
537,818 492,919Retiree Health
1,531,282 1,511,946Health Benefits
2,368,106 2,138,264Retirement
$5,191,398 $4,832,587Subtotal
2,163,292 1,291,815Cost Allocation from Other Programs 29.4 17.3
(21,597) (196,657)Cost Allocation to Other Programs (0.3) (2.0)
(41,247) (54,997)Interdepartmental Transfer - -
7,517 6,074Overtime - -
156,188 137,813Temporary and Seasonal - -
(544,316) (314,088)Turnover - -
$1,719,837 $869,960Subtotal 29.2 15.3
Total Salaries and Benefits 132.0 $14,355,970 118.1 $13,213,136
Cost Per FTE Position (Excluding Temporary and Seasonal) $107,615 $110,705
Statewide Benefit Assessment $433,913 $397,202
Payroll Costs 132.0 $14,789,883 118.1 $13,610,338
Purchased Services
990,125 1,144,350Information Technology
53,625 30,000University and College Services
15,250 15,250Clerical and Temporary Services
533,675 493,030Management & Consultant Services
322,195 399,700Other Contracts
3,121,263 2,551,397Training and Educational Services
217,471 211,960Medical Services
$5,253,604 $4,845,687Subtotal
Distribution By Source Of Funds
General Revenue 7.4 $1,029,654 2.0 $711,262
Federal Funds 104.7 $16,003,340 94.1 $14,519,385
Restricted Receipts 19.9 $3,010,493 22.0 $3,225,378
Total All Funds 132.0 $20,043,487 118.1 $18,456,025
Total Personnel 132.0 $20,043,487 118.1 $18,456,025
57

Department Of HealthEnvironmental and Health Services Regulation
The Program
Program MissionThe Environmental and Health Services Regulation program encompasses the majority of the Department’shealth care and environmental licensure and regulatory functions. With respect to health care services,quality assurance is a key prerequisite to protecting the health and safety of the people of Rhode Island.Current public sector approaches to quality assurance in health care services rely primarily on enforcementof minimum standards through licensure, certification, and complaint investigation. These regulatoryapproaches are necessary to assure quality in the face of pressures arising from reduced utilization,increased competition, acquisitions and mergers, financial challenges, and managed care.
Program DescriptionThe Environmental and Health Services Regulation program encompasses the majority of the Department’shealth care and environmental licensure and regulatory functions.To assure that minimum standards are met in the provision of health care services, the division licenses,certifies, and exercises discipline over health care professionals, health care facilities, and managed careorganizations. Additionally, complaints from any source are investigated and, if substantiated, appropriate compliance action is initiated.
Statutory HistoryAuthorization for the Environmental and Health Services Regulation program is contained in Titles 2, 4, 5,21, 23, 27, 28, 31, 42, and 46 of the Rhode Island General Laws.
58

Department Of HealthEnvironmental and Health Services Regulation
TheBudget
2017 Revised
2018 Recommend
2017 Enacted
2015 Audited
2016 Audited
Expenditures By SubprogramAssociate Director 985,345 1,755,624 - - -
Drinking Water Quality 927,035 986,319 - - -
Food Protection 4,422,657 4,220,651 - - -
Health Professionals Regulations 5,907,629 6,109,879 - - -
Facilities Regulations 4,163,997 4,280,238 - - -
Radiologic Health 829 18,159 - - -
Managed Care 268,472 191,771 - - -
Total Expenditures $16,675,964 $17,562,641 - - -
Expenditures By Object
Personnel 14,194,999 15,240,982 - - -
Operating Supplies and Expenses 2,288,842 1,789,344 - - -
Assistance and Grants 90,052 250,350 - - -
Subtotal: Operating Expenditures 16,573,893 17,280,676 - - -
Capital Purchases and Equipment 102,071 281,965 - - -
$16,675,964 $17,562,641 - - - Total Expenditures
Expenditures By FundsGeneral Revenue 8,850,784 9,945,295 - - -
Federal Funds 6,886,793 6,631,871 - - -
Restricted Receipts 938,387 985,475 - - -
$16,675,964 $17,562,641 - - - Total Expenditures
59

Department Of HealthEnvironmental Health
The Program
Program MissionThe Environmental Health program is responsible for licensure and regulatory activities related toEnvironmental Health as well as all activities related to Healthy Homes. The program regulates and providesoversight of population-based activities related to safe food; potable water; healthy homes in the areas oflead, asbestos, radon; and health and safety in the workplace.
Program DescriptionThe Environmental Health program includes three Centers:
The Center for Food Protection operates licensure and inspection programs to assure that standards aremet to protect and promote public health and prevent disease by assuring the safety and quality of the foodsupply.
The Center for Drinking Water Quality ensures the quality of state’s drinking water supply. The Center isresponsible for maintaining compliance with state and federal laws and regulations pertaining to drinkingwater quality.
The Center for Healthy Homes and Environment protects the health and safety of children, workers, and thegeneral public by identifying and decreasing environmental hazards such as lead, radon, and asbestos.
Statutory HistoryAuthorization for the Environmental Health program is contained in Titles 2, 21, 23, 31, 42, and 46 of theRhode Island.
60
Department Of HealthEnvironmental Health
TheBudget
2017 Revised
2018 Recommend
2017 Enacted
2015 Audited
2016 Audited
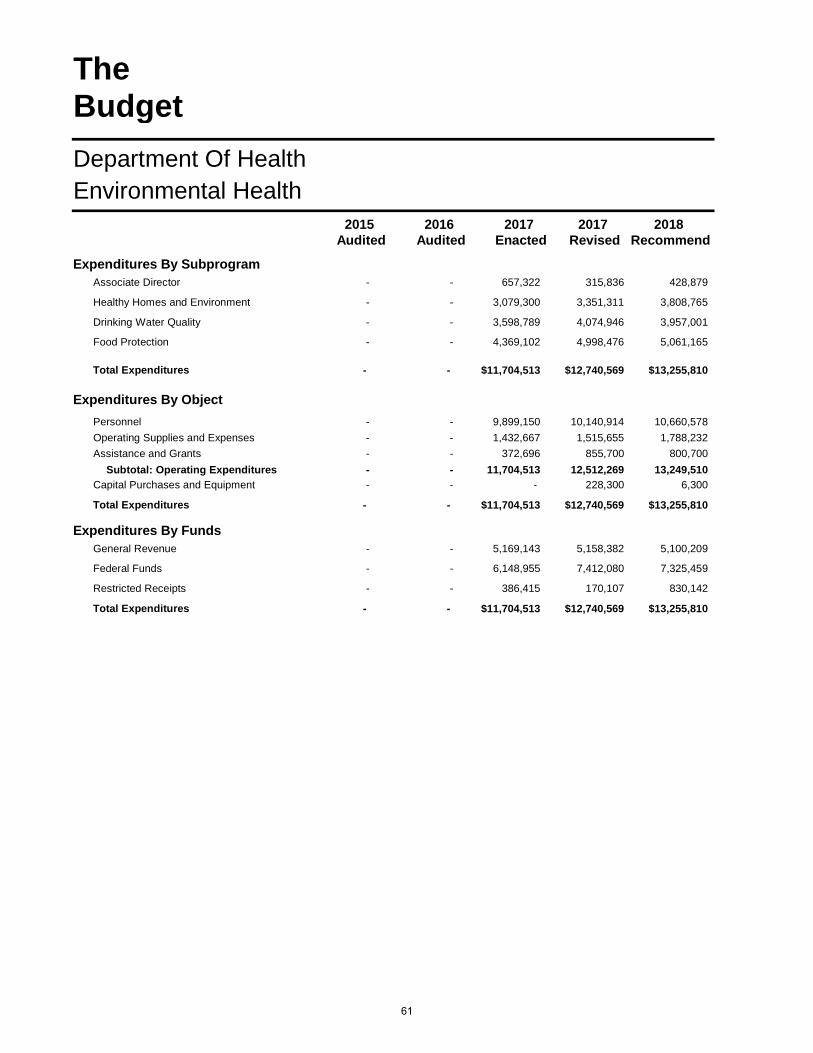
Expenditures By SubprogramAssociate Director - - 657,322 315,836 428,879
Healthy Homes and Environment - - 3,079,300 3,351,311 3,808,765
Drinking Water Quality - - 3,598,789 4,074,946 3,957,001
Food Protection - - 4,369,102 4,998,476 5,061,165
Total Expenditures - - $11,704,513 $12,740,569 $13,255,810
Expenditures By Object
Personnel - - 9,899,150 10,140,914 10,660,578
Operating Supplies and Expenses - - 1,432,667 1,515,655 1,788,232
Assistance and Grants - - 372,696 855,700 800,700
Subtotal: Operating Expenditures - - 11,704,513 12,512,269 13,249,510
Capital Purchases and Equipment - - - 228,300 6,300
- - $11,704,513 $12,740,569 $13,255,810Total Expenditures
Expenditures By FundsGeneral Revenue - - 5,169,143 5,158,382 5,100,209
Federal Funds - - 6,148,955 7,412,080 7,325,459
Restricted Receipts - - 386,415 170,107 830,142
- - $11,704,513 $12,740,569 $13,255,810Total Expenditures
61

Department Of HealthEnvironmental Health
Personnel
Grade FTE Cost FTE Cost
FY 2017 FY 2018
Classified
PRINCIPAL PUBLIC HEALTH PROMOTION 1.0 147,007 1.0 143,53200333A
ASSOCIATE DIRECTOR OF HEALTH 1.0 132,519 1.0 123,60700143A
CHIEF DIVISION OF DRINKING WATER QUALITY 1.0 113,114 1.0 113,11400139A
CHIEF DIVISION OF FOOD PROTECTION AND 1.0 112,719 1.0 112,71900139A
PRINCIPAL ENVIRONMENTAL HEALTH RISK 1.0 103,492 1.0 107,84200139A
CHIEF ENVIRONMENTAL HEALTH FOOD 1.0 99,082 1.0 99,08200135A
SENIOR ENVIRONMENTAL SCIENTIST 3.0 285,736 3.0 287,35000330A
ASSISTANT ADMINISTRATOR, FINANCIAL 1.0 93,982 1.0 93,98200134A
ENVIRONMENTAL SCIENTIST 3.0 280,551 3.0 280,55100326A
SUPERVISING INDUSTRIAL HYGIENIST 1.0 90,882 1.0 90,88200334A
CHIEF SANITARIAN 1.0 90,257 1.0 90,25700133A
ASSISTANT ADMINISTRATOR COMMUNITY AND 1.0 88,074 1.0 91,33300335A
SUPERVISING ENVIRONMENTAL HEALTH FOOD 5.0 430,357 5.0 430,35700333A
PRINCIPAL SANITARY ENGINEER 1.0 82,066 1.0 85,32700333A
SENIOR INDUSTRIAL HYGIENIST 2.0 160,980 2.0 160,98000330A
SUPERVISING SANITARY ENGINEER (DEM) 1.0 74,324 1.0 - 00135A
SENIOR ENVIRONMENTAL HEALTH FOOD 5.0 357,621 5.0 359,89300330A
ASSISTANT HEALTH PROGRAM ADMINISTRATOR 3.0 211,166 3.0 196,87300331A
COMPLIANCE/EVALUATION STANDARDIZATION 1.0 67,654 1.0 71,02400331A
PUBLIC HEALTH EPIDEMIOLOGIST 2.0 132,080 2.0 132,08000331A
SENIOR SANITARY ENGINEER 3.0 197,086 3.0 200,55400331A
PLANNING AND PROGRAM SPECIALIST (HEALTH) 1.0 65,443 1.0 67,65400331A
SENIOR SANITARIAN (WATER SUPPLY AND 1.0 62,479 1.0 62,47900326A
GEOGRAPHIC INFORMATION SYSTEM SPECIALIST II 1.0 61,993 1.0 61,99300128A
ENVIRONMENTAL HEALTH FOOD INSPECTOR 3.0 183,529 3.0 186,17200323A
PRINCIPAL HUMAN SERVICES POLICY AND 1.0 60,918 1.0 60,91800330A
INDUSTRIAL HYGIENIST 7.0 420,224 9.0 553,61600327A
SENIOR HUMAN SERVICES POLICY AND SYSTEMS 3.0 179,533 3.0 179,53300328A
ENVIRONMENTAL HEALTH FOOD SPECIALIST 16.0 940,402 16.0 963,97600327A
SANITARIAN 1.0 56,087 1.0 56,08700323A
CLINICAL LABORATORY TECHNICIAN 1.0 55,462 1.0 55,46200324A
SANITARY ENGINEER 2.0 108,970 2.0 108,97000327A
ENGINEERING TECHNICIAN IV (NATURAL 1.0 54,484 1.0 54,48400327A
HUMAN SERVICES POLICY AND SYSTEMS 1.0 53,273 1.0 55,46200324A
SENIOR COMMUNITY DEVELOPMENT TRAINING 1.0 50,988 1.0 50,98800326A
ASSISTANT ADMINISTRATIVE OFFICER 1.0 47,651 1.0 49,51700321A
EXECUTIVE ASSISTANT 2.0 95,212 2.0 97,20400118A
SENIOR COMMUNITY PROGRAM LIAISON WORKER 1.0 46,506 1.0 48,26000322A
SENIOR LABORATORY TECHNICIAN 1.0 45,275 1.0 46,60000319A
DATA CONTROL CLERK 1.0 42,101 1.0 41,66300315A
HEALTH SERVICES REGULATION LICENSING AIDE II 4.0 156,605 4.0 159,10800316A
PROGRAMMING SERVICES OFFICER - - 1.0 58,89200131A
SENIOR PUBLIC HEALTH PROMOTION SPECIALIST - 63,225 - 63,22500331A
89.0 $6,201,109 92.0 $6,353,602Subtotal
62
Department Of HealthEnvironmental Health
Personnel
Grade FTE Cost FTE Cost
FY 2017 FY 2018
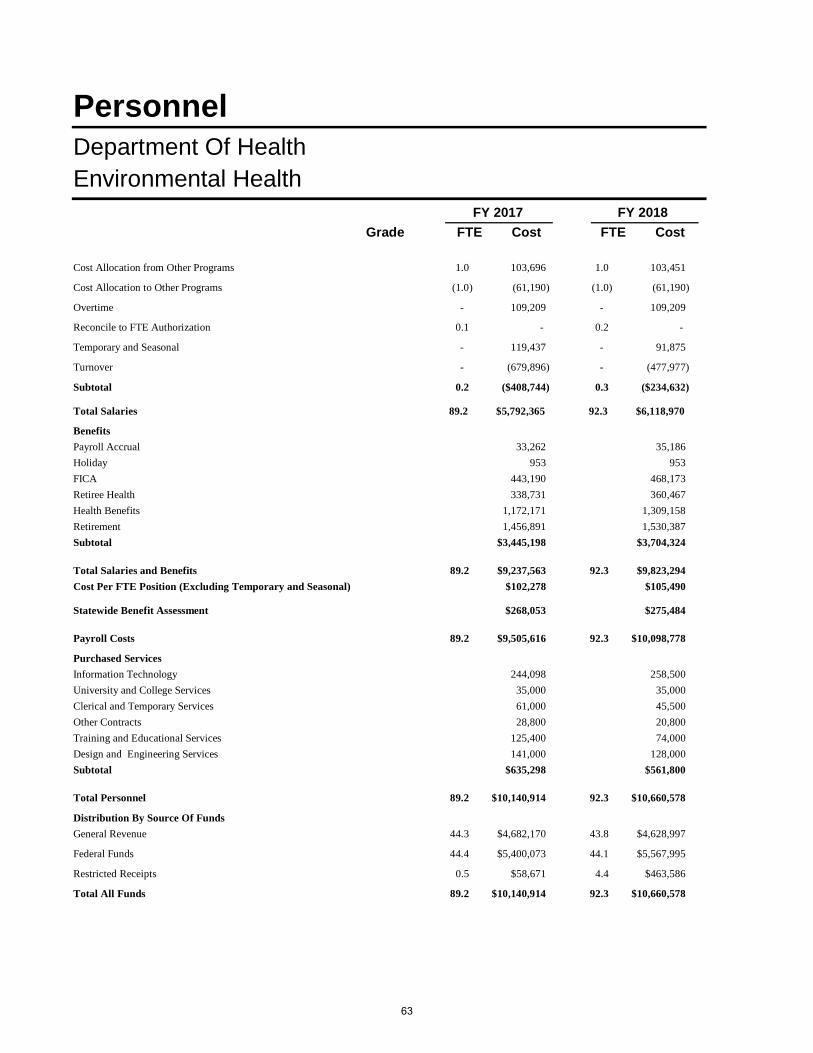
1Total Salaries 89.2 $5,792,365 92.3 $6,118,970
Benefits
33,262 35,186Payroll Accrual
953 953Holiday
443,190 468,173FICA
338,731 360,467Retiree Health
1,172,171 1,309,158Health Benefits
1,456,891 1,530,387Retirement
$3,445,198 $3,704,324Subtotal
103,696 103,451Cost Allocation from Other Programs 1.0 1.0
(61,190) (61,190)Cost Allocation to Other Programs (1.0) (1.0)
109,209 109,209Overtime - -
- - Reconcile to FTE Authorization 0.1 0.2
119,437 91,875Temporary and Seasonal - -
(679,896) (477,977)Turnover - -
($408,744) ($234,632)Subtotal 0.2 0.3
Total Salaries and Benefits 89.2 $9,237,563 92.3 $9,823,294
Cost Per FTE Position (Excluding Temporary and Seasonal) $102,278 $105,490
Statewide Benefit Assessment $268,053 $275,484
Payroll Costs 89.2 $9,505,616 92.3 $10,098,778
Purchased Services
244,098 258,500Information Technology
35,000 35,000University and College Services
61,000 45,500Clerical and Temporary Services
28,800 20,800Other Contracts
125,400 74,000Training and Educational Services
141,000 128,000Design and Engineering Services
$635,298 $561,800Subtotal
Distribution By Source Of Funds
General Revenue 44.3 $4,682,170 43.8 $4,628,997
Federal Funds 44.4 $5,400,073 44.1 $5,567,995
Restricted Receipts 0.5 $58,671 4.4 $463,586
Total All Funds 89.2 $10,140,914 92.3 $10,660,578
Total Personnel 89.2 $10,140,914 92.3 $10,660,578
63

Department Of HealthHealth Laboratories and Medical Examiner
The Program
Program MissionThe State Health Laboratories and Medical Examiners program supports the Department’s mission of "safeand healthy lives in safe and healthy communities" through scientific identification of pathogenicmicroorganisms, toxic substances, and criminals that threaten the health and safety of Rhode Islanders, andthrough the investigation of suspicious or unexpected deaths.
Program DescriptionThe State Health Laboratories mission is to provide accurate, timely, and effective laboratory services forpublic health, environmental protection, and forensic science purposes. Key program functions include earlydetection and identification of infectious diseases, identification and measurement of environmentalcontaminants, and the characterization of evidence collected at crime scene. Services are provided to stateand municipal agencies, health care providers, and individuals in support of public health and safety goals.
The State Medical Examiners Center investigates all known or suspected homicides, suicides, accidents,sudden infant deaths, drug related deaths, medically unattended or unexplained deaths, and deaths whichmay constitute the threat of an epidemic or in any way endanger the public health.
The State Health Laboratories and Medical Examiners program maintains a high level of preparedness torespond to a demand for services in case of an emergency; and maintains rigorous quality control andquality assurance programs to allow for maintaining nationally recognized accreditations.
Statutory HistoryThe primary enabling legislation for the state laboratory is RIGL 23-1-3, Maintenance of Laboratories. Theprimary enabling legislation for the Medical Examiners Center is RIGL 23-4, Office of State MedicalExaminer.
64

Department Of HealthHealth Laboratories and Medical Examiner
TheBudget
2017 Revised
2018 Recommend
2017 Enacted
2015 Audited
2016 Audited
Expenditures By SubprogramAssociate Director 1,665,681 1,856,492 1,920,051 1,982,706 2,028,852
Forensic Sciences 2,720,928 3,141,997 2,948,351 2,977,159 2,861,767
Environmental Sciences
1,822,052 1,839,342 1,991,126 2,000,945 1,903,508
Biological Sciences 2,064,569 2,065,908 2,289,781 2,359,467 2,296,250
State Medical Examiners - - 3,008,329 3,071,680 3,080,822
Total Expenditures $8,273,230 $8,903,739 $12,157,638 $12,391,957 $12,171,199
Expenditures By Object
Personnel 6,270,938 6,669,985 9,538,530 9,733,408 9,652,477
Operating Supplies and Expenses 1,835,201 2,154,601 2,496,908 2,399,377 2,456,607
Subtotal: Operating Expenditures 8,106,139 8,824,586 12,035,438 12,132,785 12,109,084
Capital Purchases and Equipment 167,091 79,153 122,200 259,172 62,115
$8,273,230 $8,903,739 $12,157,638 $12,391,957 $12,171,199Total Expenditures
Expenditures By FundsGeneral Revenue 6,426,990 6,992,607 10,028,498 10,243,948 10,136,655
Federal Funds 1,846,240 1,911,132 2,129,140 2,148,009 2,034,544
$8,273,230 $8,903,739 $12,157,638 $12,391,957 $12,171,199Total Expenditures
65

Department Of HealthHealth Laboratories and Medical Examiner
Personnel
Grade FTE Cost FTE Cost
FY 2017 FY 2018
Classified
ASSISTANT MEDICAL EXAMINER FORENSIC 3.0 545,934 3.0 545,93400254A
ASSOCIATE DIRECTOR OF HEALTH 1.0 127,664 1.0 127,66400143A
CHIEF FORENSIC SCIENCES 1.0 114,529 1.0 114,52900139A
FORENSIC SCIENTIST ASSOCIATE 1.0 106,941 1.0 108,68500326A
CHIEF REGISTERED ENVIRONMENTAL 1.0 102,682 1.0 102,68200139A
QUALITY ASSURANCE OFFICER (BIOLOGICAL 1.0 97,904 1.0 97,90400335A
SUPERVISING CLINICAL LABORATORY SCIENTIST 1.0 95,526 1.0 76,96700334A
SUPERVISOR FORENSIC SCIENCES (TOXICOLOGY) 1.0 95,189 1.0 95,18900334A
CHIEF OF MANAGEMENT SERVICES (HEALTH) 1.0 94,752 1.0 94,75200138A
SUPERVISING CLINICAL LABORATORY SCIENTIST 4.0 368,269 4.0 368,26900334A
PRINCIPAL FORENSIC SCIENTIST (RACING 1.0 90,750 1.0 90,75000332A
SUPERVISOR FORENSIC SCIENCES (SEROLOGY) 1.0 89,461 1.0 89,46100334A
SUPERVISING REGISTERED ENVIRONMENTAL 3.0 264,286 3.0 264,28600334A
PRINCIPAL FORENSIC SCIENTIST (DRUG 1.0 87,937 1.0 87,93700332A
QUALITY ASSURANCE OFFICER (ENVIRONMENTAL 1.0 86,863 1.0 86,86300335A
PRINCIPAL FORENSIC SCIENTIST (TOXICOLOGY) 1.0 86,179 1.0 86,17900332A
PRINCIPAL CLINICAL LABORATORY SCIENTIST 5.0 389,636 5.0 392,17100332A
CHIEF PREAUDIT SUPERVISOR 1.0 75,983 1.0 79,17100131A
CLINICAL LABORATORY SCIENTIST (PUB HEALTH 7.0 525,969 7.0 536,30800327A
PRINCIPAL REGISTERED ENVIRONMENTAL 1.0 75,002 1.0 75,00200332A
SUPERVISING MEDICAL EXAMINER INVESTIGATOR 1.0 75,002 1.0 75,00200332A
SENIOR FORENSIC SCIENTIST 6.0 443,380 6.0 443,28100330A
SENIOR CLINICAL LABORATORY SCIENTIST 2.0 144,193 2.0 144,19300330A
SENIOR REGISTERED ENVIRONMENTAL 2.0 143,758 2.0 140,56400330A
SUPERVISOR FORENSIC SCIENCES (DRUG 1.0 69,402 1.0 73,09500334A
SUPERVISOR BREATH ANALYSIS PROGRAM 1.0 67,621 1.0 67,62100328A
PRINCIPAL HUMAN SERVICES POLICY AND 1.0 66,268 1.0 66,26800330A
SCENE INVESTIGATOR 7.0 449,012 7.0 453,26700328A
SUPERVISOR OF LABORATORY CENTRAL SERVICES 1.0 62,549 1.0 62,54900326A
SENIOR SCENE INVESTIGATOR 1.0 61,408 1.0 63,78500330A
REGISTERED ENVIRONMENTAL LABORATORY 8.0 487,827 8.0 492,64700327A
FORENSIC SCIENTIST 5.0 295,133 5.0 299,44200327A
CLINICAL LABORATORY TECHNICIAN 2.0 117,625 2.0 117,62500324A
OFFICE MANAGER 1.0 58,581 1.0 58,58100123A
ENVIRONMENTAL LABORATORY SCIENTIST 1.0 56,863 1.0 56,86300326A
ADMINISTRATIVE OFFICER 1.0 53,615 1.0 55,52100124A
INSPECTOR BREATH ANALYSIS 1.0 52,821 1.0 52,82100324A
HUMAN SERVICES BUSINESS OFFICER 1.0 46,743 1.0 48,66200322A
TOXICOLOGIST 1.0 45,972 1.0 45,97200323A
SENIOR LABORATORY TECHNICIAN 1.0 42,665 1.0 44,16100319A
CHIEF CLINICAL LABORATORY SCIENTIST (PUBL. 1.0 40,895 1.0 40,89500139A
EXECUTIVE ASSISTANT 1.0 39,598 1.0 40,46700118A
LABORATORY ASSISTANT 8.0 303,748 8.0 301,13600314A
SENIOR WORD PROCESSING TYPIST 2.0 71,736 2.0 72,35200312A
94.0 $6,817,871 94.0 $6,837,473Subtotal
66
Department Of HealthHealth Laboratories and Medical Examiner
Personnel
Grade FTE Cost FTE Cost
FY 2017 FY 2018
Unclassified
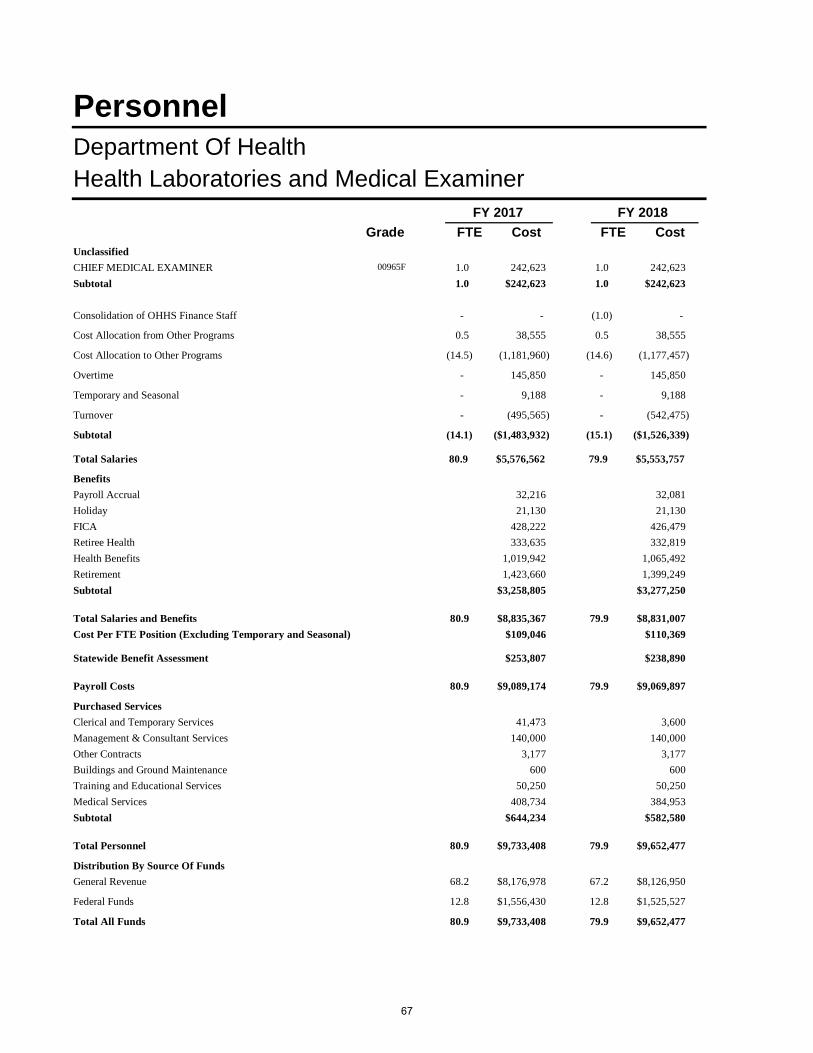
CHIEF MEDICAL EXAMINER 1.0 242,623 1.0 242,62300965F
1.0 $242,623 1.0 $242,623Subtotal
1Total Salaries 80.9 $5,576,562 79.9 $5,553,757
Benefits
32,216 32,081Payroll Accrual
21,130 21,130Holiday
428,222 426,479FICA
333,635 332,819Retiree Health
1,019,942 1,065,492Health Benefits
1,423,660 1,399,249Retirement
$3,258,805 $3,277,250Subtotal
- - Consolidation of OHHS Finance Staff - (1.0)
38,555 38,555Cost Allocation from Other Programs 0.5 0.5
(1,181,960) (1,177,457)Cost Allocation to Other Programs (14.5) (14.6)
145,850 145,850Overtime - -
9,188 9,188Temporary and Seasonal - -
(495,565) (542,475)Turnover - -
($1,483,932) ($1,526,339)Subtotal (14.1) (15.1)
Total Salaries and Benefits 80.9 $8,835,367 79.9 $8,831,007
Cost Per FTE Position (Excluding Temporary and Seasonal) $109,046 $110,369
Statewide Benefit Assessment $253,807 $238,890
Payroll Costs 80.9 $9,089,174 79.9 $9,069,897
Purchased Services
41,473 3,600Clerical and Temporary Services
140,000 140,000Management & Consultant Services
3,177 3,177Other Contracts
600 600Buildings and Ground Maintenance
50,250 50,250Training and Educational Services
408,734 384,953Medical Services
$644,234 $582,580Subtotal
Distribution By Source Of Funds
General Revenue 68.2 $8,176,978 67.2 $8,126,950
Federal Funds 12.8 $1,556,430 12.8 $1,525,527
Total All Funds 80.9 $9,733,408 79.9 $9,652,477
Total Personnel 80.9 $9,733,408 79.9 $9,652,477
67

Department Of HealthPublic Health Information
The Program
Program MissionThe mission of the Public Health Information program is to ensure health data quality, maintain the State’svital records, and promote health information technology infrastructure within the State.
Program DescriptionThe Public Health Information program consists of three units: the Center for Health Data and Analysis, VitalRecords, and Health Information Technology.
The Center for Health Data and Analysis coordinates and oversees all efforts within the Department ofHealth and between the Department and its external partners related to the assurance of health data qualityand the provision of health-related data and analysis to inform health policy, monitor health status and healthcare quality, and support public health initiatives.
The Vital Records division is responsible for maintaining the State’s vital records systems; collecting,analyzing and reporting of data pertaining to births, deaths, marriages, divorces, and other health relatedstatistics; and the issuing of certified copies of vital records.
Health Information Technology is responsible for developing a state-wide health information exchange (HIE)system which will promote the adoption of electronic medical records and e-prescribing. The healthinformation exchange system will also assist in developing strategies to use the data to improve the qualityand safety of care and for public health purposes.
Statutory HistoryAuthorization for the activities within the Public Health Information program is contained within varioussections of Title 23.
68
Department Of HealthPublic Health Information
TheBudget
2017 Revised
2018 Recommend
2017 Enacted
2015 Audited
2016 Audited
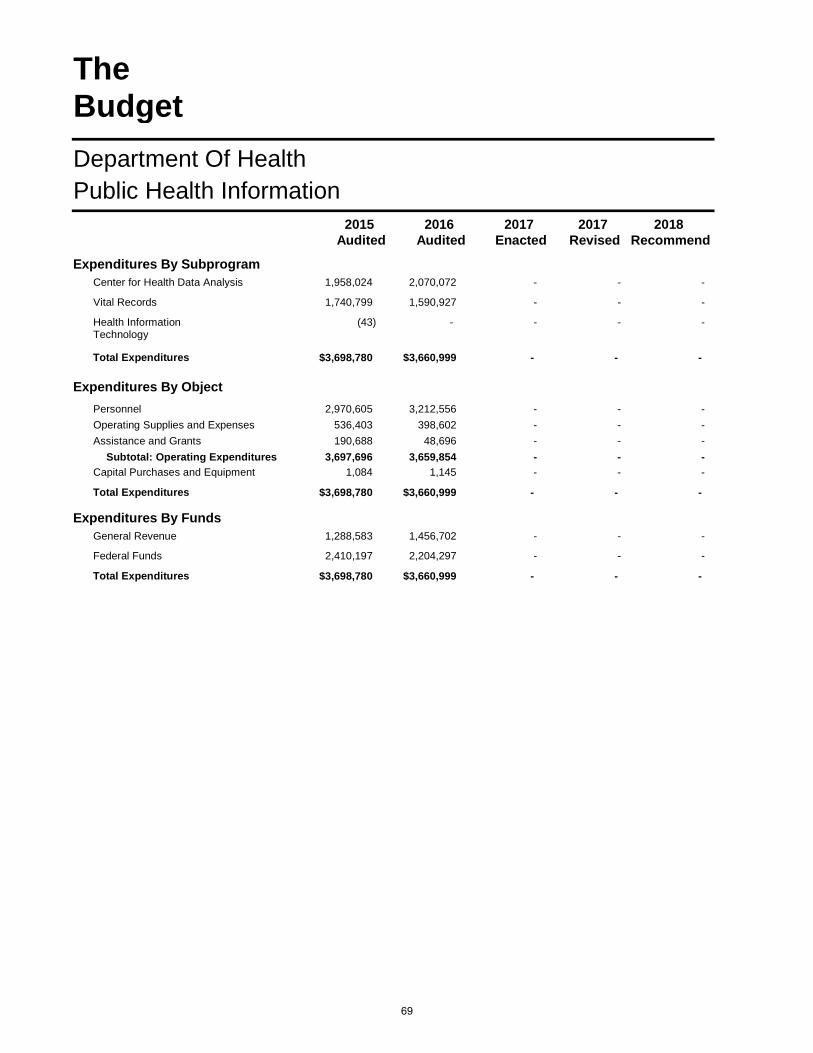
Expenditures By SubprogramCenter for Health Data Analysis 1,958,024 2,070,072 - - -
Vital Records 1,740,799 1,590,927 - - -
Health Information Technology
(43) - - - -
Total Expenditures $3,698,780 $3,660,999 - - -
Expenditures By Object
Personnel 2,970,605 3,212,556 - - -
Operating Supplies and Expenses 536,403 398,602 - - -
Assistance and Grants 190,688 48,696 - - -
Subtotal: Operating Expenditures 3,697,696 3,659,854 - - -
Capital Purchases and Equipment 1,084 1,145 - - -
$3,698,780 $3,660,999 - - - Total Expenditures
Expenditures By FundsGeneral Revenue 1,288,583 1,456,702 - - -
Federal Funds 2,410,197 2,204,297 - - -
$3,698,780 $3,660,999 - - - Total Expenditures
69

Department Of HealthCommunity and Family Health and Equity
The Program
Program MissionThe Community and Family Health and Equity program provides evidence-based public health strategiesthat focus on all members of the community to achieve health equity and eliminate health disparities throughRhode Island.
Program DescriptionThe Executive Director of the Community and Family Health and Equity program provides leadership, vision,communication, and policy direction to the administrative staff, team leads, program leads, and support staffwithin the division. There are six teams that represent priority areas of the division.
The Health Disparities and Access to Care Team assures equitable systems, empowers communities, andbuilds capacity to promote access to comprehensive, high quality services that are responsive to the needsof Rhode Island’s diverse populations so that they may achieve their optimal state of health.
The Healthy Homes and Environment Team protects the health and safety of children, workers, and thegeneral public by identifying and decreasing environmental hazards.
The Chronic Care and Disease Management Team uses a systems approach to reduce the incidence,burden, and associated risk factors related to diabetes, asthma, cancer, heart disease, and stroke toimprove health outcomes.
The Health Promotion and Wellness Team is committed to promoting the health and well-being of all RhodeIslanders by changing social, political, and physical environments to support healthy lifestyles. This teamfocuses on physical activity, nutrition, tobacco control, and violence and injury prevention.
The Perinatal and Early Childhood Health Team supports healthy birth outcomes, positive early childhooddevelopment and school readiness, and preparation for a healthy productive adulthood by providing andassuring mothers, children, and adolescents access to quality maternal and child health services.
The Preventative Services and Community Practices Team improves the quality of preventative care andcommunity services through immunization, oral health, and family planning services. This is achieved byincreasing access and availability to vulnerable populations by diminishing ethnic and racial healthdisparities, providing performance standards, enhancing community partnerships, and applying evidencebased, effective programing.
Statutory HistoryAuthorization for the Community and Family Health and Equity Program is contained in various sections ofTitle 23 of the Rhode Island General Laws.
70

Department Of HealthCommunity and Family Health and Equity
TheBudget
2017 Revised
2018 Recommend
2017 Enacted
2015 Audited
2016 Audited
Expenditures By SubprogramAssociate Director 4,613,491 3,343,391 - - -
Health Disparities and Access
2,175,628 1,997,970 - - -
Healthy Homes and Environment
2,937,443 2,950,186 - - -
Chronic Care and Disease Management 3,344,950 5,730,829 - - -
Health Promotion and Wellness
2,603,422 3,810,591 - - -
Perinatal and Early Childhood
12,208,671 13,611,008 - - -
Preventitive Services and Community Practices
35,226,825 45,880,718 - - -
Total Expenditures $63,110,430 $77,324,693 - - -
Expenditures By Object
Personnel 15,876,365 16,944,942 - - -
Operating Supplies and Expenses 34,069,342 41,203,950 - - -
Assistance and Grants 13,164,723 19,152,996 - - -
Subtotal: Operating Expenditures 63,110,430 77,301,888 - - -
Capital Purchases and Equipment - 22,805 - - -
$63,110,430 $77,324,693 - - - Total Expenditures
Expenditures By FundsGeneral Revenue 2,304,828 2,498,046 - - -
Federal Funds 36,703,310 47,247,644 - - -
Restricted Receipts 24,099,961 27,579,003 - - -
Operating Transfers from Other Funds 2,331 - - - -
$63,110,430 $77,324,693 - - - Total Expenditures
71

Department Of HealthInfectious Disease and Epidemiology
The Program
Program MissionThe Infectious Disease and Epidemiology program is responsible for implementing the statewide response to detect, control, and prevent infectious disease of public health significance. By monitoring, conducting surveillance, and investigation for a wide array of reportable diseases; collecting, analyzing and distributinginformation about infectious diseases; and investigating disease outbreaks and responding appropriately, theDivision is able to minimize the impact of infectious disease on the health and economy of the state.
Program DescriptionThe Infectious Disease and Epidemiology program is responsible for the following major program areas ofinfectious communicable disease control:
Acute Disease Surveillance and Outbreak Investigation for 86 reportable diseases including meningitis,foodborne diseases, Lyme disease, and West Nile Virus.
A Tuberculosis Prevention and Control program which provides clinical services including testing, diagnosisand treatment; surveillance activities; medical and social case management; and professional and publiceducation.
The provision of surveillance activities, disease investigations and contact tracing for Sexually TransmittedDiseases.
An Animal Bite and Rabies program which provides complete case management related to animal bites andhuman exposure to animal rabies.
The monitoring of all reports of potential agents of bioterrorism including Anthrax, Plague, Ricin, Tularemia,and Smallpox.
A National Electronic Disease Surveillance System that utilizes web-based data collection, analysis, andreporting of all 86 state and nationally notifiable conditions to the Centers for Diseases Control andPrevention.
An Office of HIV/AIDS and Viral Hepatitis which monitors infections, associated laboratory tests, and CD4counts to monitor, prevent, and control these diseases.
Statutory HistoryAuthorization for the Infectious Diseases and Epidemiology program is contained in various sections of Title23.
72

Department Of HealthInfectious Disease and Epidemiology
TheBudget
2017 Revised
2018 Recommend
2017 Enacted
2015 Audited
2016 Audited
Expenditures By SubprogramOperations 5,386,121 5,599,214 - - -
Total Expenditures $5,386,121 $5,599,214 - - -
Expenditures By Object
Personnel 3,187,495 3,736,119 - - -
Operating Supplies and Expenses 1,221,513 1,207,361 - - -
Assistance and Grants 975,970 629,544 - - -
Subtotal: Operating Expenditures 5,384,978 5,573,024 - - -
Capital Purchases and Equipment 1,143 26,190 - - -
$5,386,121 $5,599,214 - - - Total Expenditures
Expenditures By FundsGeneral Revenue 1,285,153 1,550,582 - - -
Federal Funds 4,100,968 4,048,632 - - -
$5,386,121 $5,599,214 - - - Total Expenditures
73

Department Of HealthCustomer Services
The Program
Program MissionThe Customer Service program assures that minimum standards for the provision of health care servicesare met. To that end, the program licenses, investigates and disciplines health care professionals, healthcare facilities, and health-related facilities. Complaints from all sources are investigated and, if substantiated,compliance action is initiated. The Customer Services program also includes the public-facing Center forVital Records which ensures the integrity and appropriate access to permanent records related to births,deaths, marriages, and civil unions for Rhode Island.
Program DescriptionThe Division of Customer Services program encompasses four Centers:
The Center for Professional Licensing is responsible for licensing health care professionals. The programmaintains an integrated license and verification system. The system allows consumers to view publicinformation about their health care provider on the Department's website. The Office also reviews requestsfor Medical Marijuana Program registration.
The Center for Professional Boards and Commissions oversees the complaint investigation and discipline oflicensed professionals. The office also oversees the administrative and regulatory functions of theseprofessions to ensure the highest quality health care for Rhode Islanders.
The Center for Vital Records is responsible for the administration, statutory compliance and regulatorypromulgation of Rhode Island’s vital records system of births, marriages, deaths and fetal deaths.
The Center for Health Facilities Regulation is responsible for ensuring that state-licensed and federally certified.
Medicare and Medicaid health care facilities meet the applicable health, safety, and quality standards and regulations outlined in state and federal law. The program maintains an agreement with the Centers for Medicare and the State Medicaid Office to conduct Medicare and Medicaid certification surveys and investigations for participating health care facilities and providers.
Statutory HistoryAuthorization for the Customer Service program is contained in the various sections of Titles 4, 5, 16, 21, 23,and 42.
74
Department Of HealthCustomer Services
TheBudget
2017 Revised
2018 Recommend
2017 Enacted
2015 Audited
2016 Audited
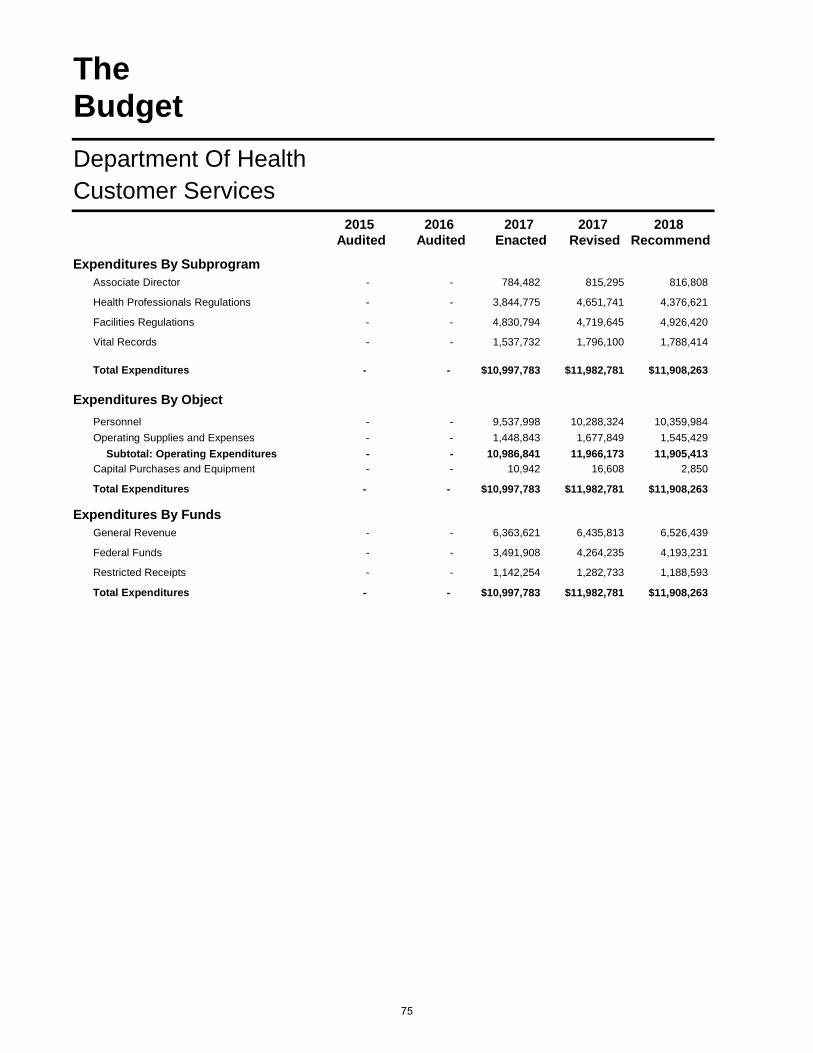
Expenditures By SubprogramAssociate Director - - 784,482 815,295 816,808
Health Professionals Regulations - - 3,844,775 4,651,741 4,376,621
Facilities Regulations - - 4,830,794 4,719,645 4,926,420
Vital Records - - 1,537,732 1,796,100 1,788,414
Total Expenditures - - $10,997,783 $11,982,781 $11,908,263
Expenditures By Object
Personnel - - 9,537,998 10,288,324 10,359,984
Operating Supplies and Expenses - - 1,448,843 1,677,849 1,545,429
Subtotal: Operating Expenditures - - 10,986,841 11,966,173 11,905,413
Capital Purchases and Equipment - - 10,942 16,608 2,850
- - $10,997,783 $11,982,781 $11,908,263Total Expenditures
Expenditures By FundsGeneral Revenue - - 6,363,621 6,435,813 6,526,439
Federal Funds - - 3,491,908 4,264,235 4,193,231
Restricted Receipts - - 1,142,254 1,282,733 1,188,593
- - $10,997,783 $11,982,781 $11,908,263Total Expenditures
75

Department Of HealthCustomer Services
Personnel
Grade FTE Cost FTE Cost
FY 2017 FY 2018
Classified
CONSULTANT PUBLIC HEALTH NURSE 1.0 113,215 1.0 113,21500926A
CHIEF OF HEALTH PROFESSIONS REGULATION 1.0 109,873 - - 00139A
PRINCIPAL NURSING CARE EVALUATOR 2.0 214,720 2.0 214,72000926A
ASSOCIATE DIRECTOR OF HEALTH 1.0 98,105 1.0 98,10500143A
SUPERVISING INDUSTRIAL HYGIENIST 1.0 95,576 1.0 95,57600334A
INTERDEPARTMENTAL PROJECT MANAGER 3.0 277,729 3.0 281,41200139A
HEALTH POLICY ANALYST 2.0 180,012 2.0 180,01200333A
CHIEF HEALTH PROGRAM EVALUATOR 2.0 178,840 2.0 178,84000137A
STATE DIRECTOR OF NURSING REGISTRATION & 1.0 88,469 1.0 92,09600137A
SENIOR NURSING CARE EVALUATOR 3.0 262,139 3.0 262,13900923A
HEALTH PROGRAM ADMINISTRATOR 2.0 174,658 2.0 174,65800135A
SUPERVISING RADIOLOGICAL HEALTH SPECIALIST 1.0 87,033 1.0 87,03300334A
PROGRAMMING SERVICES OFFICER 1.0 82,349 1.0 82,34900131A
SENIOR PUBLIC HEALTH PROMOTION SPECIALIST 2.0 161,139 2.0 165,83500331A
NURSING CARE EVALUATOR 11.0 864,611 12.0 929,98600920A
PRINCIPAL HEALTH FACILITY SURVEYOR 1.0 77,428 1.0 77,42800329A
CHIEF COMPLIANCE AND REGULATORY SECTION 1.0 76,836 1.0 79,72700335A
MEDICOLEGAL ADMINISTRATOR 1.0 76,097 1.0 76,09700132A
PHYSICAL THERAPIST (HABIL./REHAB.) 1.0 75,002 1.0 75,00200332A
CHIEF PROGRAM DEVELOPMENT 1.0 71,608 1.0 71,60800134A
PRINCIPAL HUMAN SERVICES POLICY AND 1.0 71,604 1.0 69,58100330A
RADIOLOGICAL HEALTH SPECIALIST 3.0 210,831 3.0 212,91200330A
CHIEF IMPLEMENTATION AIDE 2.0 139,431 2.0 139,43100128A
SENIOR HEALTH FACILITY SURVEYOR 1.0 68,948 1.0 68,94800326A
CLINICAL SOCIAL WORKER 2.0 137,708 2.0 139,35100327A
HUMAN SERVICES POLICY AND SYSTEMS 1.0 67,840 1.0 70,16900324A
PUBLIC HEALTH PROMOTION SPECIALIST 3.0 200,962 4.0 261,49300329A
SENIOR CLINICAL LABORATORY SCIENTIST 1.0 66,268 1.0 66,26800330A
RECORDS ANALYST 1.0 64,737 1.0 64,73700324A
PRINCIPAL RESEARCH TECHNICIAN 1.0 64,536 1.0 64,53600327A
ADMINISTRATIVE OFFICER 1.0 62,721 1.0 64,33200324A
HEALTH SERVICES REGULATION LICENSING AIDE I 2.0 118,976 2.0 119,68300314A
DATA ENTRY UNIT SUPERVISOR 2.0 117,273 2.0 117,27300B21A
SYSTEMS ANALYST 1.0 55,121 1.0 55,12100324A
PUBLIC HEALTH NUTRITIONIST 1.0 54,484 1.0 54,48400327A
SENIOR TELLER 1.0 51,694 1.0 51,69400318A
SENIOR SYSTEMS ANALYST 1.0 50,988 1.0 50,98800326A
INFORMATION AIDE 1.0 48,766 1.0 48,76600315A
HEALTH FACILITY SURVEYOR 3.0 142,200 3.0 145,14800323A
ASSISTANT SUPERVISING DATA ENTRY OPERATOR 1.0 46,493 1.0 46,49300314A
PROGRAM ANALYST 4.0 183,839 4.0 187,58000322A
DATA CONTROL CLERK 2.0 89,156 2.0 89,15600315A
HEALTH SERVICES REGULATION LICENSING AIDE II 7.0 310,271 7.0 310,27100316A
COMMUNITY PROGRAM LIAISON WORKER 2.0 86,182 2.0 86,92800319A
BEAUTY SHOP INSPECTOR 1.0 39,678 1.0 39,67800315A
76

Department Of HealthCustomer Services
Personnel
Grade FTE Cost FTE Cost
FY 2017 FY 2018
EXECUTIVE ASSISTANT 1.0 39,636 1.0 40,50000118A
GENEALOGICAL CLERK 2.0 77,035 2.0 77,48800314A
ASSISTANT ADMINISTRATIVE OFFICER - 47,228 - 47,22800321A
SENIOR FORENSIC SCIENTIST - 60,918 - 60,91800330A
88.0 $6,140,963 89.0 $6,186,993Subtotal
Unclassified
CHIEF ADMINISTRATIVE OFFICER 1.0 177,226 1.0 177,22600966F
PRODUCTION SYSTEMS SPECIALIST 1.0 49,181 1.0 51,11600320A
2.0 $226,407 2.0 $228,342Subtotal
1Total Salaries 90.4 $5,804,746 91.4 $5,961,966
Benefits
33,509 34,420Payroll Accrual
624 624Holiday
444,110 456,139FICA
344,387 354,361Retiree Health
1,190,531 1,276,282Health Benefits
1,481,276 1,517,912Retirement
$3,494,437 $3,639,738Subtotal
70,454 88,473Cost Allocation from Other Programs 0.7 0.9
(29,214) (29,214)Cost Allocation to Other Programs (0.5) (0.5)
(103,220) (103,220)Interdepartmental Transfer - -
43,363 43,363Overtime - -
- - Reconcile to FTE Authorization 0.2 -
36,750 36,750Temporary and Seasonal - -
(580,757) (489,521)Turnover - -
($562,624) ($453,369)Subtotal 0.4 0.4
Total Salaries and Benefits 90.4 $9,299,183 91.4 $9,601,704
Cost Per FTE Position (Excluding Temporary and Seasonal) $102,483 $104,684
Statewide Benefit Assessment $266,865 $263,952
Payroll Costs 90.4 $9,566,048 91.4 $9,865,656
77
Department Of HealthCustomer Services
Personnel
Grade FTE Cost FTE Cost
FY 2017 FY 2018
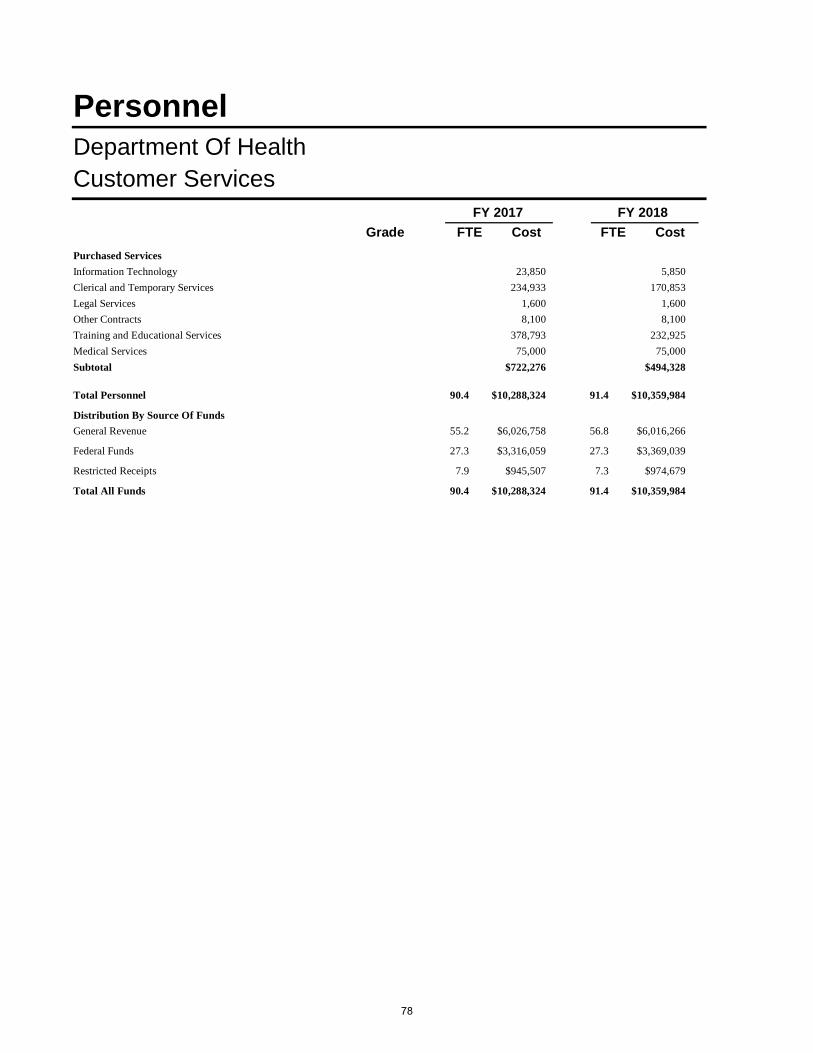
Purchased Services
23,850 5,850Information Technology
234,933 170,853Clerical and Temporary Services
1,600 1,600Legal Services
8,100 8,100Other Contracts
378,793 232,925Training and Educational Services
75,000 75,000Medical Services
$722,276 $494,328Subtotal
Distribution By Source Of Funds
General Revenue 55.2 $6,026,758 56.8 $6,016,266
Federal Funds 27.3 $3,316,059 27.3 $3,369,039
Restricted Receipts 7.9 $945,507 7.3 $974,679
Total All Funds 90.4 $10,288,324 91.4 $10,359,984
Total Personnel 90.4 $10,288,324 91.4 $10,359,984
78

Department Of HealthPolicy, Information and Communications
The Program
Program MissionThe Policy, Information and Communications program is responsible for the acquisition and use of clear,accurate and appropriate data to inform public health policy as well as the provision of high-quality, timely,and accurate health information to the public so they can understand health risks and make healthy and safechoices.
Program DescriptionThe Policy, Information and Communications program is comprised of four centers:
The Center for Health Data and Analysis is responsible for the acquisition, provision and use of clear, accurate and appropriate data and analyses. The Center manages health datasets and systems, and provides analytic capacity to department programs. Center activities inform and drive public health program and policy decisions.
The Center for Public Health Communications provides high-quality, timely, and accurate health informationto the public so they can understand health risks and make healthy and safe choices.
The Center for Health Systems Policy and Regulation is responsible for preventing unnecessary duplicationin the healthcare system including medical services, facilities and equipment. The Centers certifies andmonitors health plans and utilization review agencies to ensure compliance with applicable statutes andregulations, and reviews initial license applications and changes in ownership, control, and leases for varioushealth care facilities.
The Center for Legislative and Regulatory Affairs tracks proposed state legislation impacting public health,ensures that Department of Health complies with legislative mandates, provides constituency services, andcoordinates the development and implementation of departmental regulations in accordance with existingstate requirements.
Statutory HistoryAuthorization for the activities within the Policy, Information, and Communication program is contained withinthe various sections of Title 23 and Title 27.
79

Department Of HealthPolicy, Information and Communications
TheBudget
2017 Revised
2018 Recommend
2017 Enacted
2015 Audited
2016 Audited
Expenditures By SubprogramCenter for Health Data Analysis - - 2,128,864 2,431,034 2,219,772
Associate Director - - 438,390 296,361 504,148
Health Systems Policy & Regulation - - 581,225 538,967 1,465,561
Total Expenditures - - $3,148,479 $3,266,362 $4,189,481
Expenditures By Object
Personnel - - 2,727,883 2,748,481 3,025,950
Operating Supplies and Expenses - - 208,028 365,881 454,242
Assistance and Grants - - 212,568 150,000 707,289
Subtotal: Operating Expenditures - - 3,148,479 3,264,362 4,187,481
Capital Purchases and Equipment - - - 2,000 2,000
- - $3,148,479 $3,266,362 $4,189,481Total Expenditures
Expenditures By FundsGeneral Revenue - - 937,935 658,228 962,260
Federal Funds - - 1,629,319 1,965,667 2,354,457
Restricted Receipts - - 581,225 642,467 872,764
- - $3,148,479 $3,266,362 $4,189,481Total Expenditures
80

Department Of HealthPolicy, Information and Communications
Personnel
Grade FTE Cost FTE Cost
FY 2017 FY 2018
Classified
HEALTH ECONOMICS SPECIALIST 2.0 259,280 - 136,71900131A
ASSOCIATE DIRECTOR OF HEALTH 1.0 118,926 1.0 124,51300143A
INTERDEPARTMENTAL PROJECT MANAGER 4.0 416,587 4.0 416,58700139A
ASSISTANT ADMINISTRATOR COMMUNITY AND 2.0 198,083 2.0 198,08300335A
HEALTH PROGRAM ADMINISTRATOR 2.0 198,011 3.0 270,00700335A
ENVIRONMENTAL HEALTH RISK ASSESSMENT 1.0 98,303 1.0 98,30300135A
SENIOR PUBLIC HEALTH EPIDEMIOLOGIST 4.0 391,365 4.0 391,36500333A
SENIOR PUBLIC HEALTH PROMOTION SPECIALIST 4.0 345,372 4.0 347,57500331A
CHIEF HEALTH PROGRAM EVALUATOR 1.0 83,228 1.0 86,18400137A
CHIEF PROGRAM DEVELOPMENT 2.0 164,440 2.0 164,44000134A
WEB DEVELOPMENT MANAGER 0.6 48,724 0.6 48,72400135A
PRINCIPAL HUMAN SERVICES POLICY AND 1.0 80,479 1.0 80,47900330A
PUBLIC HEALTH PROMOTION SPECIALIST 3.0 241,145 3.0 243,81300329A
CHIEF OFFICE OF HEALTH PROMOTION 1.0 78,997 1.0 81,88400137A
PRINCIPAL PUBLIC HEALTH PROMOTION 2.0 149,276 2.0 150,69400333A
CHIEF IMPLEMENTATION AIDE 1.0 74,392 1.0 74,39200328A
PROGRAMMING SERVICES OFFICER 1.0 73,237 2.0 142,09200131A
PROGRAMMING SERVICES OFFICER 1.0 68,855 - - 00331A
PUBLIC HEALTH EPIDEMIOLOGIST 3.0 202,759 3.0 205,27300331A
SENIOR HUMAN SERVICES POLICY AND SYSTEMS 4.0 252,644 4.0 252,64400328A
SENIOR RESEARCH TECHNICIAN 1.0 61,783 1.0 61,78300323A
PRINCIPAL COMMUNITY DEVELOPMENT TRAINING 1.0 60,266 1.0 63,14500329A
IMPLEMENTATION AIDE 1.0 58,874 1.0 58,87400322A
FISCAL MANAGEMENT OFFICER 1.0 50,988 1.0 50,98800326A
SENIOR COMMUNITY PROGRAM LIAISON WORKER 1.0 48,662 1.0 49,06200322A
PRINCIPAL COMMUNITY PROGRAM LIAISON 1.0 47,886 1.0 49,37400324A
SENIOR WORD PROCESSING TYPIST 1.0 42,645 1.0 42,64500312A
COMMUNITY PROGRAM LIAISON WORKER 2.0 83,668 2.0 85,83200319A
DATA CONTROL CLERK 1.0 41,662 1.0 41,66200315A
CHIEF CLERK 1.0 38,075 1.0 38,07500B16A
HUMAN SERVICES POLICY AND SYSTEMS - 47,486 - 47,48600324A
51.6 $4,126,098 50.6 $4,102,697Subtotal
Unclassified
POLICY ANALYST 1.0 97,086 1.0 97,08600833A
1.0 $97,086 1.0 $97,086Subtotal
81

Department Of HealthPolicy, Information and Communications
Personnel
Grade FTE Cost FTE Cost
FY 2017 FY 2018
1Total Salaries 16.9 $1,319,487 17.7 $1,517,589
Benefits
7,638 8,772Payroll Accrual
100,941 116,100FICA
78,773 90,202Retiree Health
208,117 231,351Health Benefits
344,236 389,115Retirement
$739,705 $835,540Subtotal
10,673 10,673Cost Allocation from Other Programs 0.2 0.2
(2,747,331) (2,640,271)Cost Allocation to Other Programs (35.8) (34.1)
- 9,188Temporary and Seasonal - -
(167,039) (61,784)Turnover - -
($2,903,697) ($2,682,194)Subtotal (35.7) (33.9)
Total Salaries and Benefits 16.9 $2,059,192 17.7 $2,353,129
Cost Per FTE Position (Excluding Temporary and Seasonal) $121,558 $132,576
Statewide Benefit Assessment $61,745 $69,084
Payroll Costs 16.9 $2,120,937 17.7 $2,422,213
Purchased Services
42,400 71,391Clerical and Temporary Services
247,420 175,580Management & Consultant Services
9,924 9,924Other Contracts
327,800 346,842Training and Educational Services
$627,544 $603,737Subtotal
Distribution By Source Of Funds
General Revenue 5.9 $636,858 7.6 $940,890
Federal Funds 8.8 $1,512,634 9.8 $1,630,621
Restricted Receipts 2.3 $598,989 0.3 $454,439
Total All Funds 16.9 $2,748,481 17.7 $3,025,950
Total Personnel 16.9 $2,748,481 17.7 $3,025,950
82

Department Of HealthPreparedness, Resp, Infectious Dis, & Emergency Services
The Program
Program MissionThe Preparedness, Response, Infectious Disease, and Emergency Medical Services program is responsiblefor creating and promoting a state of readiness and prompt response to protect the health of RhodeIslanders during catastrophic events, large-scale disasters, and other types of emergencies; controllingperson-to-person spread of infectious diseases; and licensing, regulating, and oversight of emergencymedical services.
Program DescriptionThe Preparedness, Response, Infectious Disease,and Emergency Services program includes the followingCenters:
The Emergency Preparedness and Response Center coordinates emergency preparedness and response activities including planning, education, assessment, and support services among public health providers,private medical providers, public safety agencies, and government officials.
The Infectious Disease and Epidemiology Center is responsible for the detection, control, and prevention ofinfectious disease of public health significance. The Center monitors, conducts surveillance, and investigatesa wide array of reportable diseases; collects, analyzes, and distributes information about infectious diseases;and investigates and responds to disease outbreaks to minimize the impact of infectious disease on thehealth and economy of the state.
The HIV, Hepatitis, STD and TB Center conducts surveillance, disease investigations, and contact tracing forHIV, sexually transmitted diseases, and tuberculosis to ensure all potential contacts are screened and treated. The Center oversees efforts to prevent and control Hepatitis C infection, including the community based needle exchange program.
The Emergency Medical Services Center licenses, regulates, and provides oversight for ambulance services, ambulances, and emergency medical service practitioners.
Statutory HistoryAuthorization for the activities within the Preparedness, Response, Infectious Disease, and EmergencyServices program is contained within the various sections of Title 23.
83

Department Of HealthPreparedness, Resp, Infectious Dis, & Emergency Services
TheBudget
2017 Revised
2018 Recommend
2017 Enacted
2015 Audited
2016 Audited
Expenditures By SubprogramAccute Infectious Diseases - - 3,755,792 5,447,583 5,650,309
HIV, Hep, STDs & TB - - 2,120,660 2,732,956 2,436,164
Emergency Preparedness and Response - - 7,732,236 8,133,122 7,123,618
Emergency Medical Services - - 432,263 441,545 437,997
Total Expenditures - - $14,040,951 $16,755,206 $15,648,088
Expenditures By Object
Personnel - - 9,113,401 9,685,431 9,891,372
Operating Supplies and Expenses - - 2,991,839 3,817,690 3,310,832
Assistance and Grants - - 1,915,461 2,875,235 2,294,034
Subtotal: Operating Expenditures - - 14,020,701 16,378,356 15,496,238
Capital Purchases and Equipment - - 20,250 376,850 151,850
- - $14,040,951 $16,755,206 $15,648,088Total Expenditures
Expenditures By FundsGeneral Revenue - - 1,902,523 1,869,447 1,619,131
Federal Funds - - 12,138,428 14,885,759 14,028,957
- - $14,040,951 $16,755,206 $15,648,088Total Expenditures
84

Department Of HealthPreparedness, Resp, Infectious Dis, & Emergency Services
Personnel
Grade FTE Cost FTE Cost
FY 2017 FY 2018
Classified
MEDICAL DIRECTOR, DISEASE CONTROL 1.0 201,827 1.0 201,82700252A
ASSOCIATE DIRECTOR OF HEALTH 1.0 132,035 1.0 91,85700143A
CHIEF HEALTH PROGRAM EVALUATOR 2.0 263,362 2.0 269,36900137A
ASSISTANT DIRECTOR OF HEALTH (HEALTH 1.0 116,460 1.0 116,46000141A
COMMUNITY HEALTH NURSE COORDINATOR 3.0 343,054 3.0 343,05400923A
CONSULTANT PUBLIC HEALTH NURSE 2.0 216,996 2.0 216,99600926A
HEALTH PROGRAM ADMINISTRATOR 1.0 93,649 1.0 93,64900135A
HEALTH PROGRAM ADMINISTRATOR 1.0 90,585 1.0 90,58500335A
PUBLIC HEALTH EPIDEMIOLOGIST 6.0 529,609 6.0 537,48400331A
ASSISTANT ADMINISTRATOR COMMUNITY AND 1.0 86,128 1.0 86,12800335A
CHIEF DIVISION OF EMERGENCY MEDICAL 1.0 81,206 1.0 81,20600135A
SENIOR PUBLIC HEALTH EPIDEMIOLOGIST 2.0 156,819 2.0 156,81900333A
PRINCIPAL PUBLIC HEALTH PROMOTION 1.0 76,497 1.0 76,49700333A
HEALTH POLICY ANALYST 3.0 228,801 3.0 228,80100333A
PUBLIC HEALTH PROMOTION SPECIALIST 2.0 147,092 2.0 147,09200329A
PROGRAMMING SERVICES OFFICER 1.0 72,271 1.0 72,27100331A
SENIOR PUBLIC HEALTH PROMOTION SPECIALIST 1.0 71,155 1.0 71,15500331A
ASSISTANT HEALTH PROGRAM ADMINISTRATOR 5.0 348,867 5.0 347,33400331A
DISEASE INTERVENTION SPECIALIST II 2.0 134,368 2.0 134,36700327A
SENIOR HUMAN SERVICES POLICY AND SYSTEMS 1.0 55,668 1.0 57,55400328A
PROGRAM PLANNER 1.0 54,276 1.0 54,74700325A
COMMUNITY PROGRAM LIAISON WORKER 2.0 101,984 2.0 101,98400319A
FIELD TECHNICIAN (EMERGENCY MEDICAL 1.0 50,988 1.0 50,98800323A
DISEASE INTERVENTION SPECIALIST I 3.0 150,600 3.0 155,34900324A
DATA CONTROL CLERK 1.0 43,646 1.0 43,64600315A
EXECUTIVE ASSISTANT 1.0 42,204 1.0 42,97600118A
SENIOR WORD PROCESSING TYPIST 1.0 37,083 1.0 37,08300312A
48.0 $3,927,230 48.0 $3,907,278Subtotal
85

Department Of HealthPreparedness, Resp, Infectious Dis, & Emergency Services
Personnel
Grade FTE Cost FTE Cost
FY 2017 FY 2018
1Total Salaries 63.5 $4,949,347 63.6 $5,146,780
Benefits
27,764 29,626Payroll Accrual
2,634 2,634Holiday
869 290Other
378,827 393,930FICA
289,600 306,209Retiree Health
793,433 902,169Health Benefits
1,263,171 1,294,116Retirement
$2,756,298 $2,928,974Subtotal
1,362,037 1,360,123Cost Allocation from Other Programs 16.7 16.8
(131,634) (111,545)Cost Allocation to Other Programs (1.2) (1.2)
44,537 44,537Overtime - -
101,063 101,063Temporary and Seasonal - -
(353,886) (154,676)Turnover - -
$1,022,117 $1,239,502Subtotal 15.5 15.6
Total Salaries and Benefits 63.5 $7,705,645 63.6 $8,075,754
Cost Per FTE Position (Excluding Temporary and Seasonal) $119,701 $125,487
Statewide Benefit Assessment $233,097 $240,908
Payroll Costs 63.5 $7,938,742 63.6 $8,316,662
Purchased Services
111,600 111,600Information Technology
93,200 32,200Other Contracts
1,402,854 1,323,315Training and Educational Services
139,035 107,595Medical Services
$1,746,689 $1,574,710Subtotal
Distribution By Source Of Funds
General Revenue 10.1 $1,313,723 9.0 $1,063,407
Federal Funds 53.4 $8,371,708 54.6 $8,827,965
Total All Funds 63.5 $9,685,431 63.6 $9,891,372
Total Personnel 63.5 $9,685,431 63.6 $9,891,372
86